Sample Category Title
USD/JPY Daily Outlook
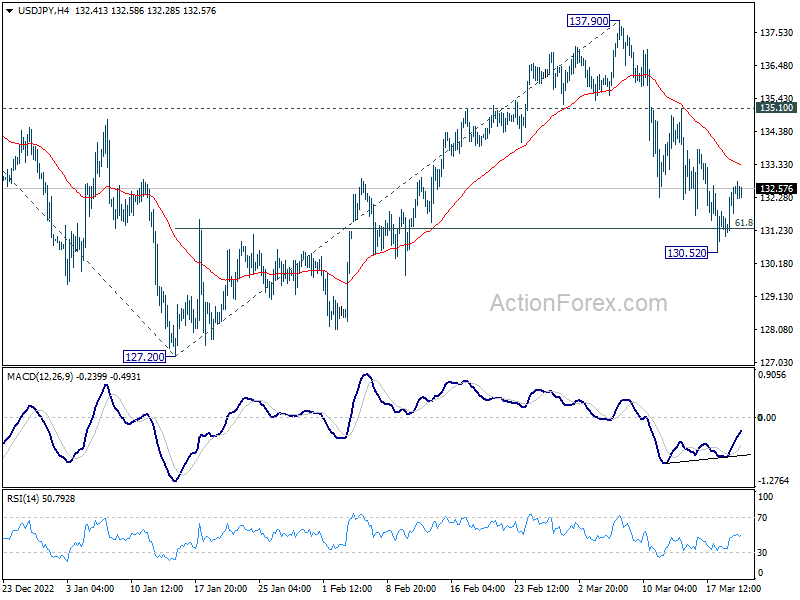
Daily Pivots: (S1) 131.45; (P) 132.04; (R1) 133.04; More...
Intraday bias in USD/JPY remains neutral for the moment. Further decline is expected as long as 135.10 resistance holds. The current favored case is that rebound from 127.20 has completed at 137.90 already. Sustained trading below 61.8% retracement of 127.20 to 137.90 at 131.28 will pave the way to retest 127.20 low next. However, break of 135.10 will turn bias back to the upside for 137.90 instead.
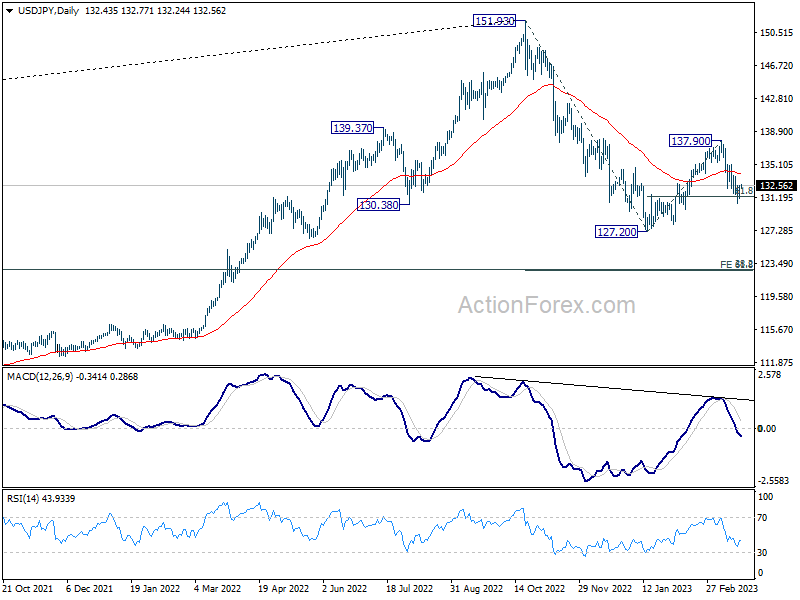
In the bigger picture, rebound from 127.20 should have completed at 137.90 as a corrective move, with strong break of 55 day EMA. The down trend from 151.93 (2022 high) is not over yet. Break of 127.20 will resume this down trend and target 61.8% projection of 151.93 to 127.20 from 137.90 at 122.61. This will now be the favored case as long as 137.90 resistance holds.
USD/CHF Daily Outlook
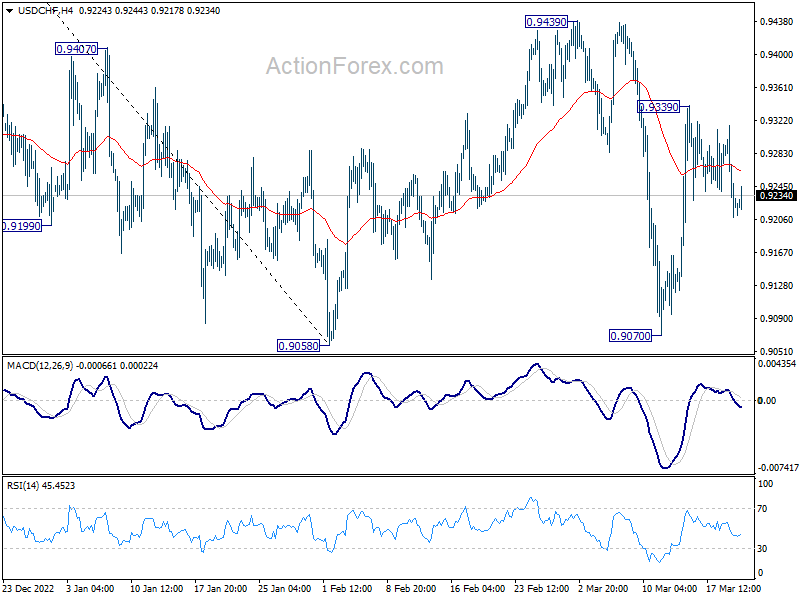
Daily Pivots: (S1) 0.9184; (P) 0.9250; (R1) 0.9291; More...
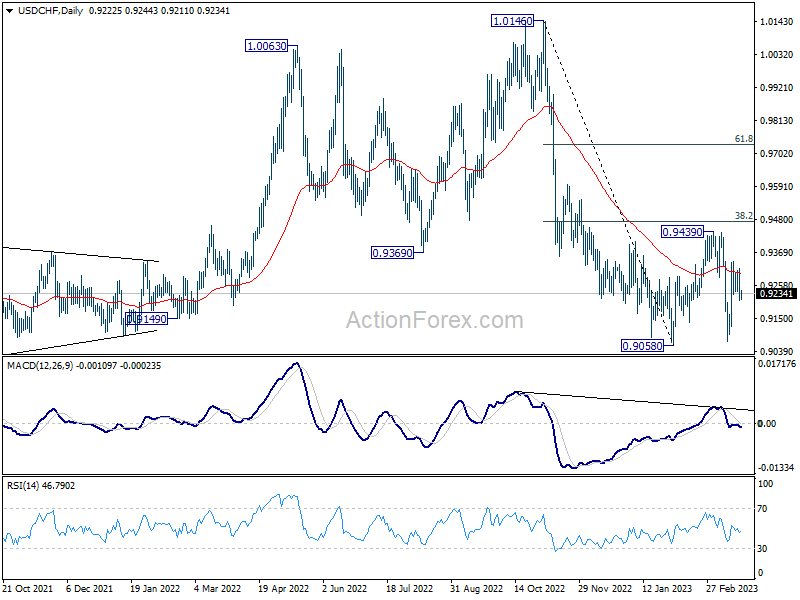
Intraday bias in USD/CHF remains neutral and outlook is unchanged. Corrective pattern from 0.9058 low should still be in progress with rise from 0.9070 as the third leg. Above 0.9339 will target 0.9439 resistance and possibly above. But overall, outlook will stay bearish as long as 0.9474 fibonacci level holds, and another decline through 0.9058 is expected at a later stage.
In the bigger picture, fall from 1.1046 (2022 high) should still be in progress with 38.2% retracement of 1.0146 to 0.9058 at 0.9474 intact. Rejection by 55 week EMA was a medium term bearish sign. Break of 0.9058 will resume such decline towards 0.8756 support (2021 low). But overall, such fall is still as a leg in the long term range pattern from 1.0342 (2016 high). So, downside should be contained by 0.8756 to bring reversal.
EUR/USD Daily Outlook
Daily Pivots: (S1) 1.0720; (P) 1.0754; (R1) 1.0804; More...
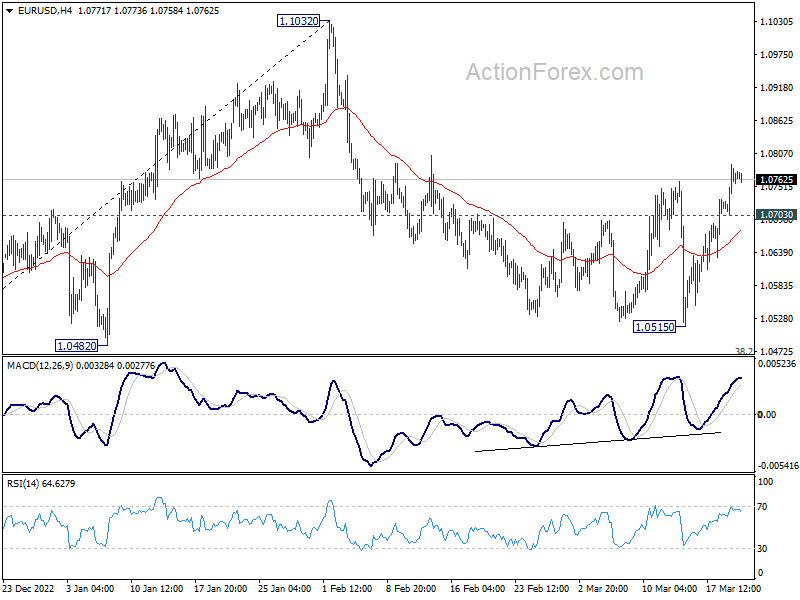
Intraday bias in EUR/USD remains on the upside and outlook is unchanged. Corrective fall from 1.1032 should have completed at 1.0515 already. That came after defending both 1.0482 support and 38.2% retracement of 0.9534 to 1.1032 at 1.0258. Further rise should be seen for retesting 1.1032 high next. On the downside, below 1.0703 minor support will turn intraday bias neutral again first.
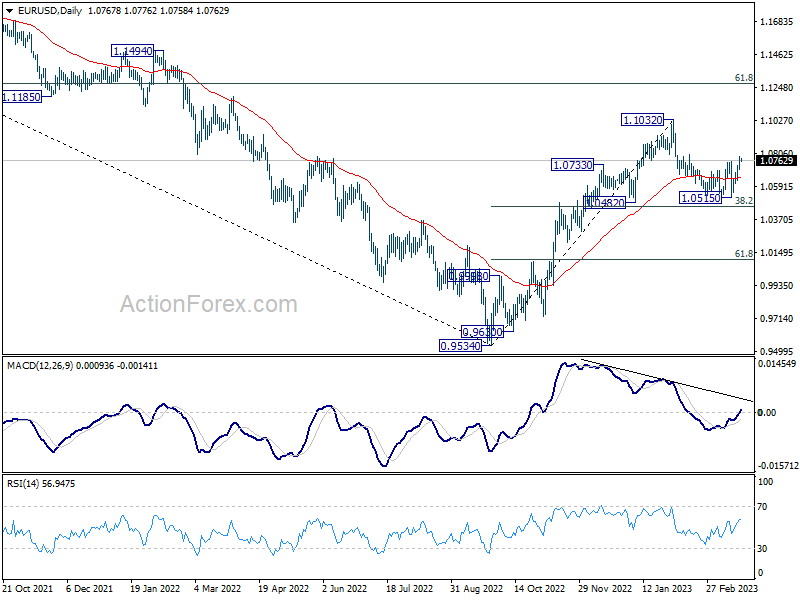
In the bigger picture, as long as 1.0482 support holds, rise from 0.9534 (2022 low) should continue to 61.8% retracement of 1.2348 (2021 high) to 0.9534 at 1.1273. However, sustained break of 1.0482 will bring deeper fall to 61.8% retracement of 0.9534 to 1.1032 at 1.0106, with risk of breaking through 0.9534 eventually.
USD Awaits Catalyst
EUR/USD breaks higher
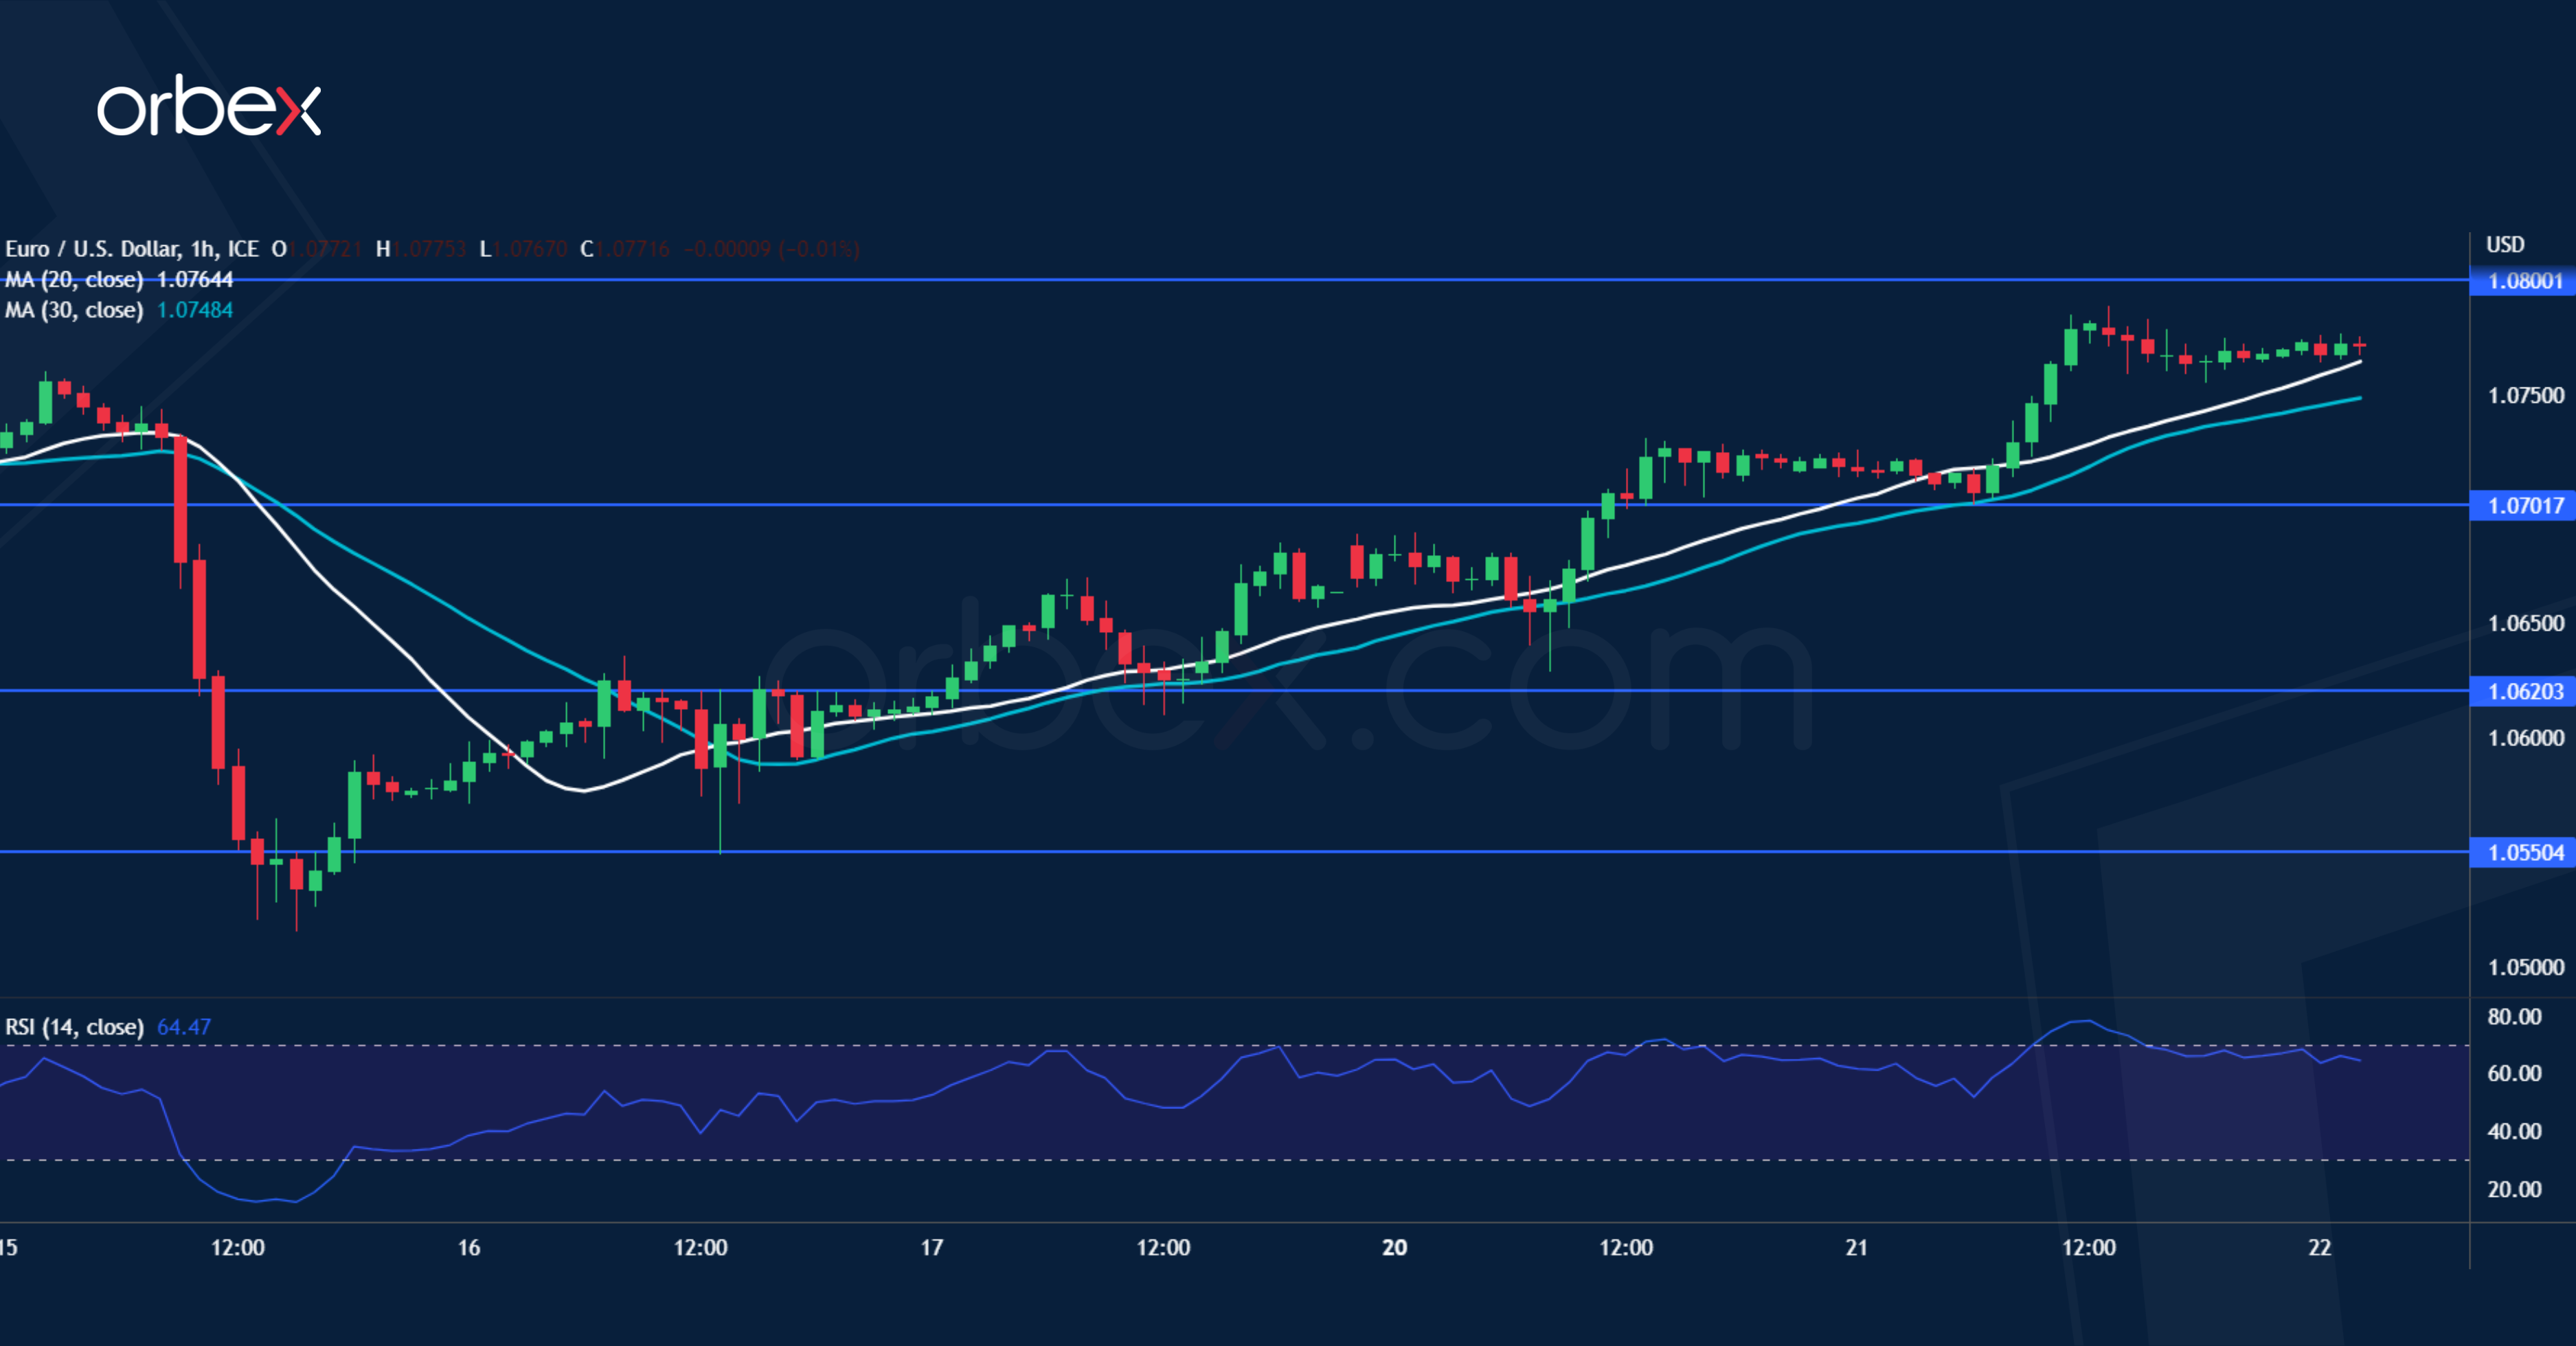
The US dollar struggles as the market prepares for a 25-basis-point rate hike by the Fed. A pop above last week’s liquidation point at 1.0760 sends a strong bullish signal, prompting sellers to cover their bets. As the RSI rose into overbought territory, the bulls may see a pullback as an opportunity to stake in at a discount with 1.0700 at the base of the momentum as the first support. A close above the February spike of 1.0800 would reinforce the upward bias and open the door to an extension to the supply zone around 1.0900.
USD/CAD bounces back
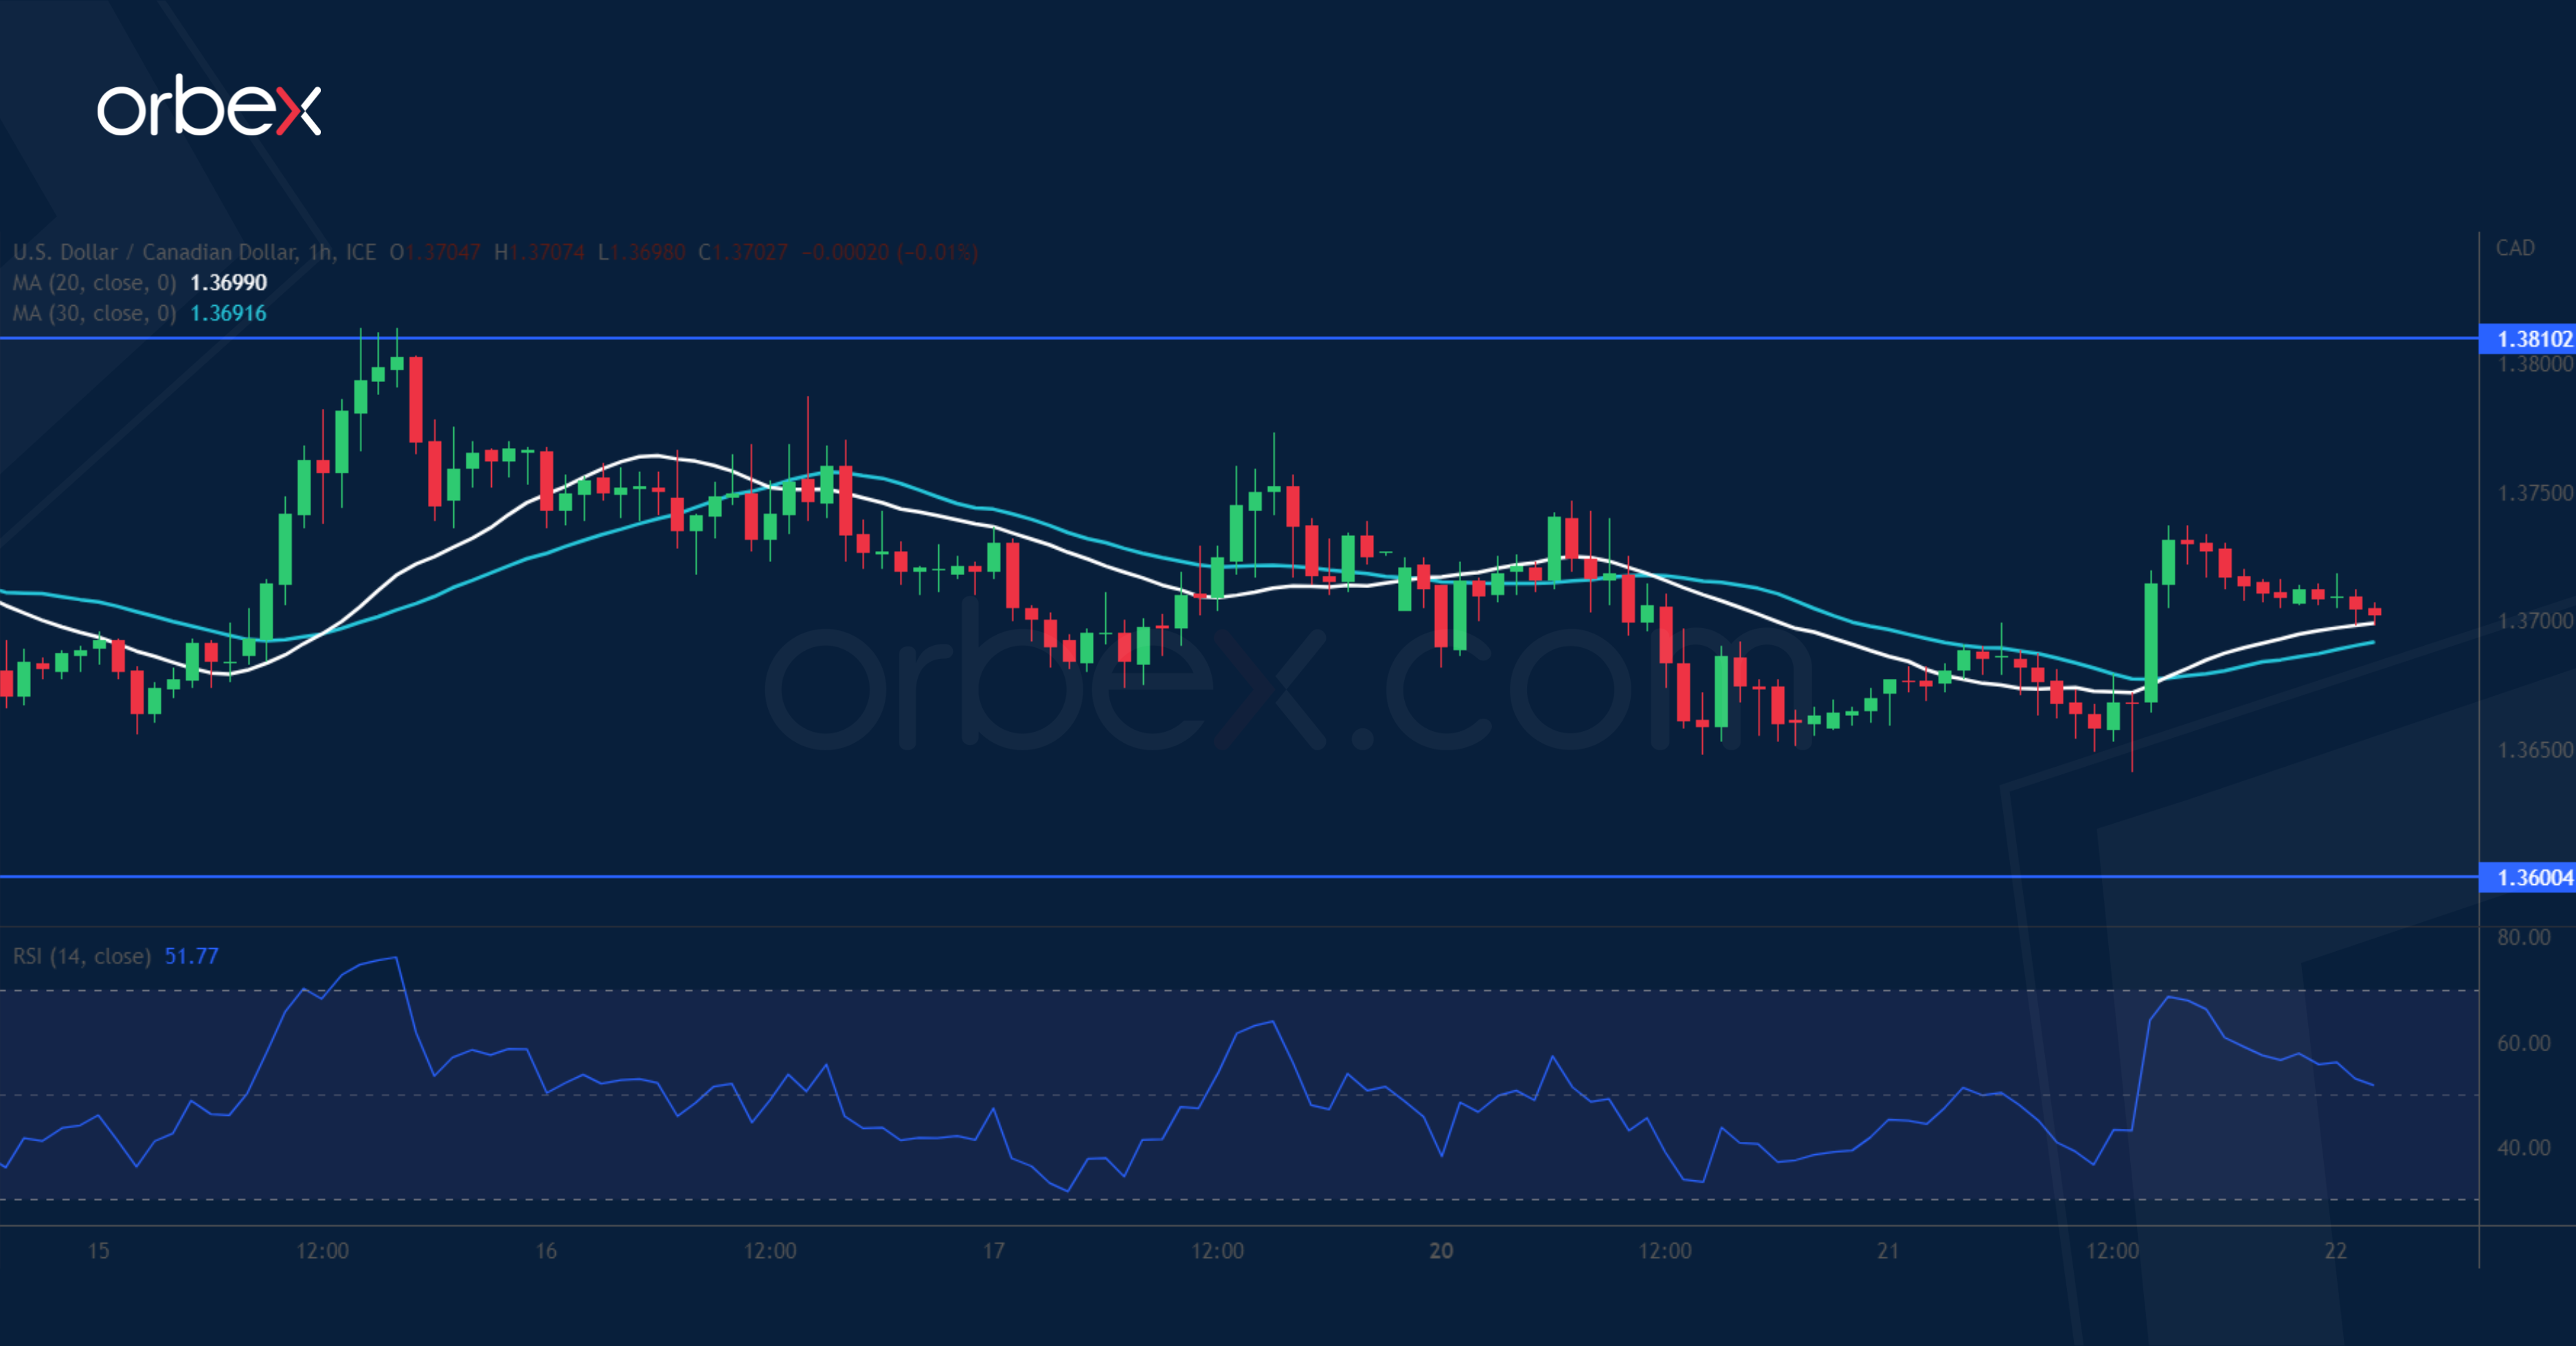
The Canadian dollar slipped as February’s monthly CPI fell short of expectations. After lifting offers around the December high of 1.3700, the US dollar has been drifting lower in search of bids. Overall sentiment remains upbeat from the daily chart’s perspective. The demand zone above 1.3600 over the 30-day SMA has caught buyers’ eyes once again. A successful rebound would keep the greenback in the lead. 1.3810 right under the recent peak (1.3860) is a key hurdle and its breach would extend gains towards 1.4000.
FTSE 100 attempts to rebound
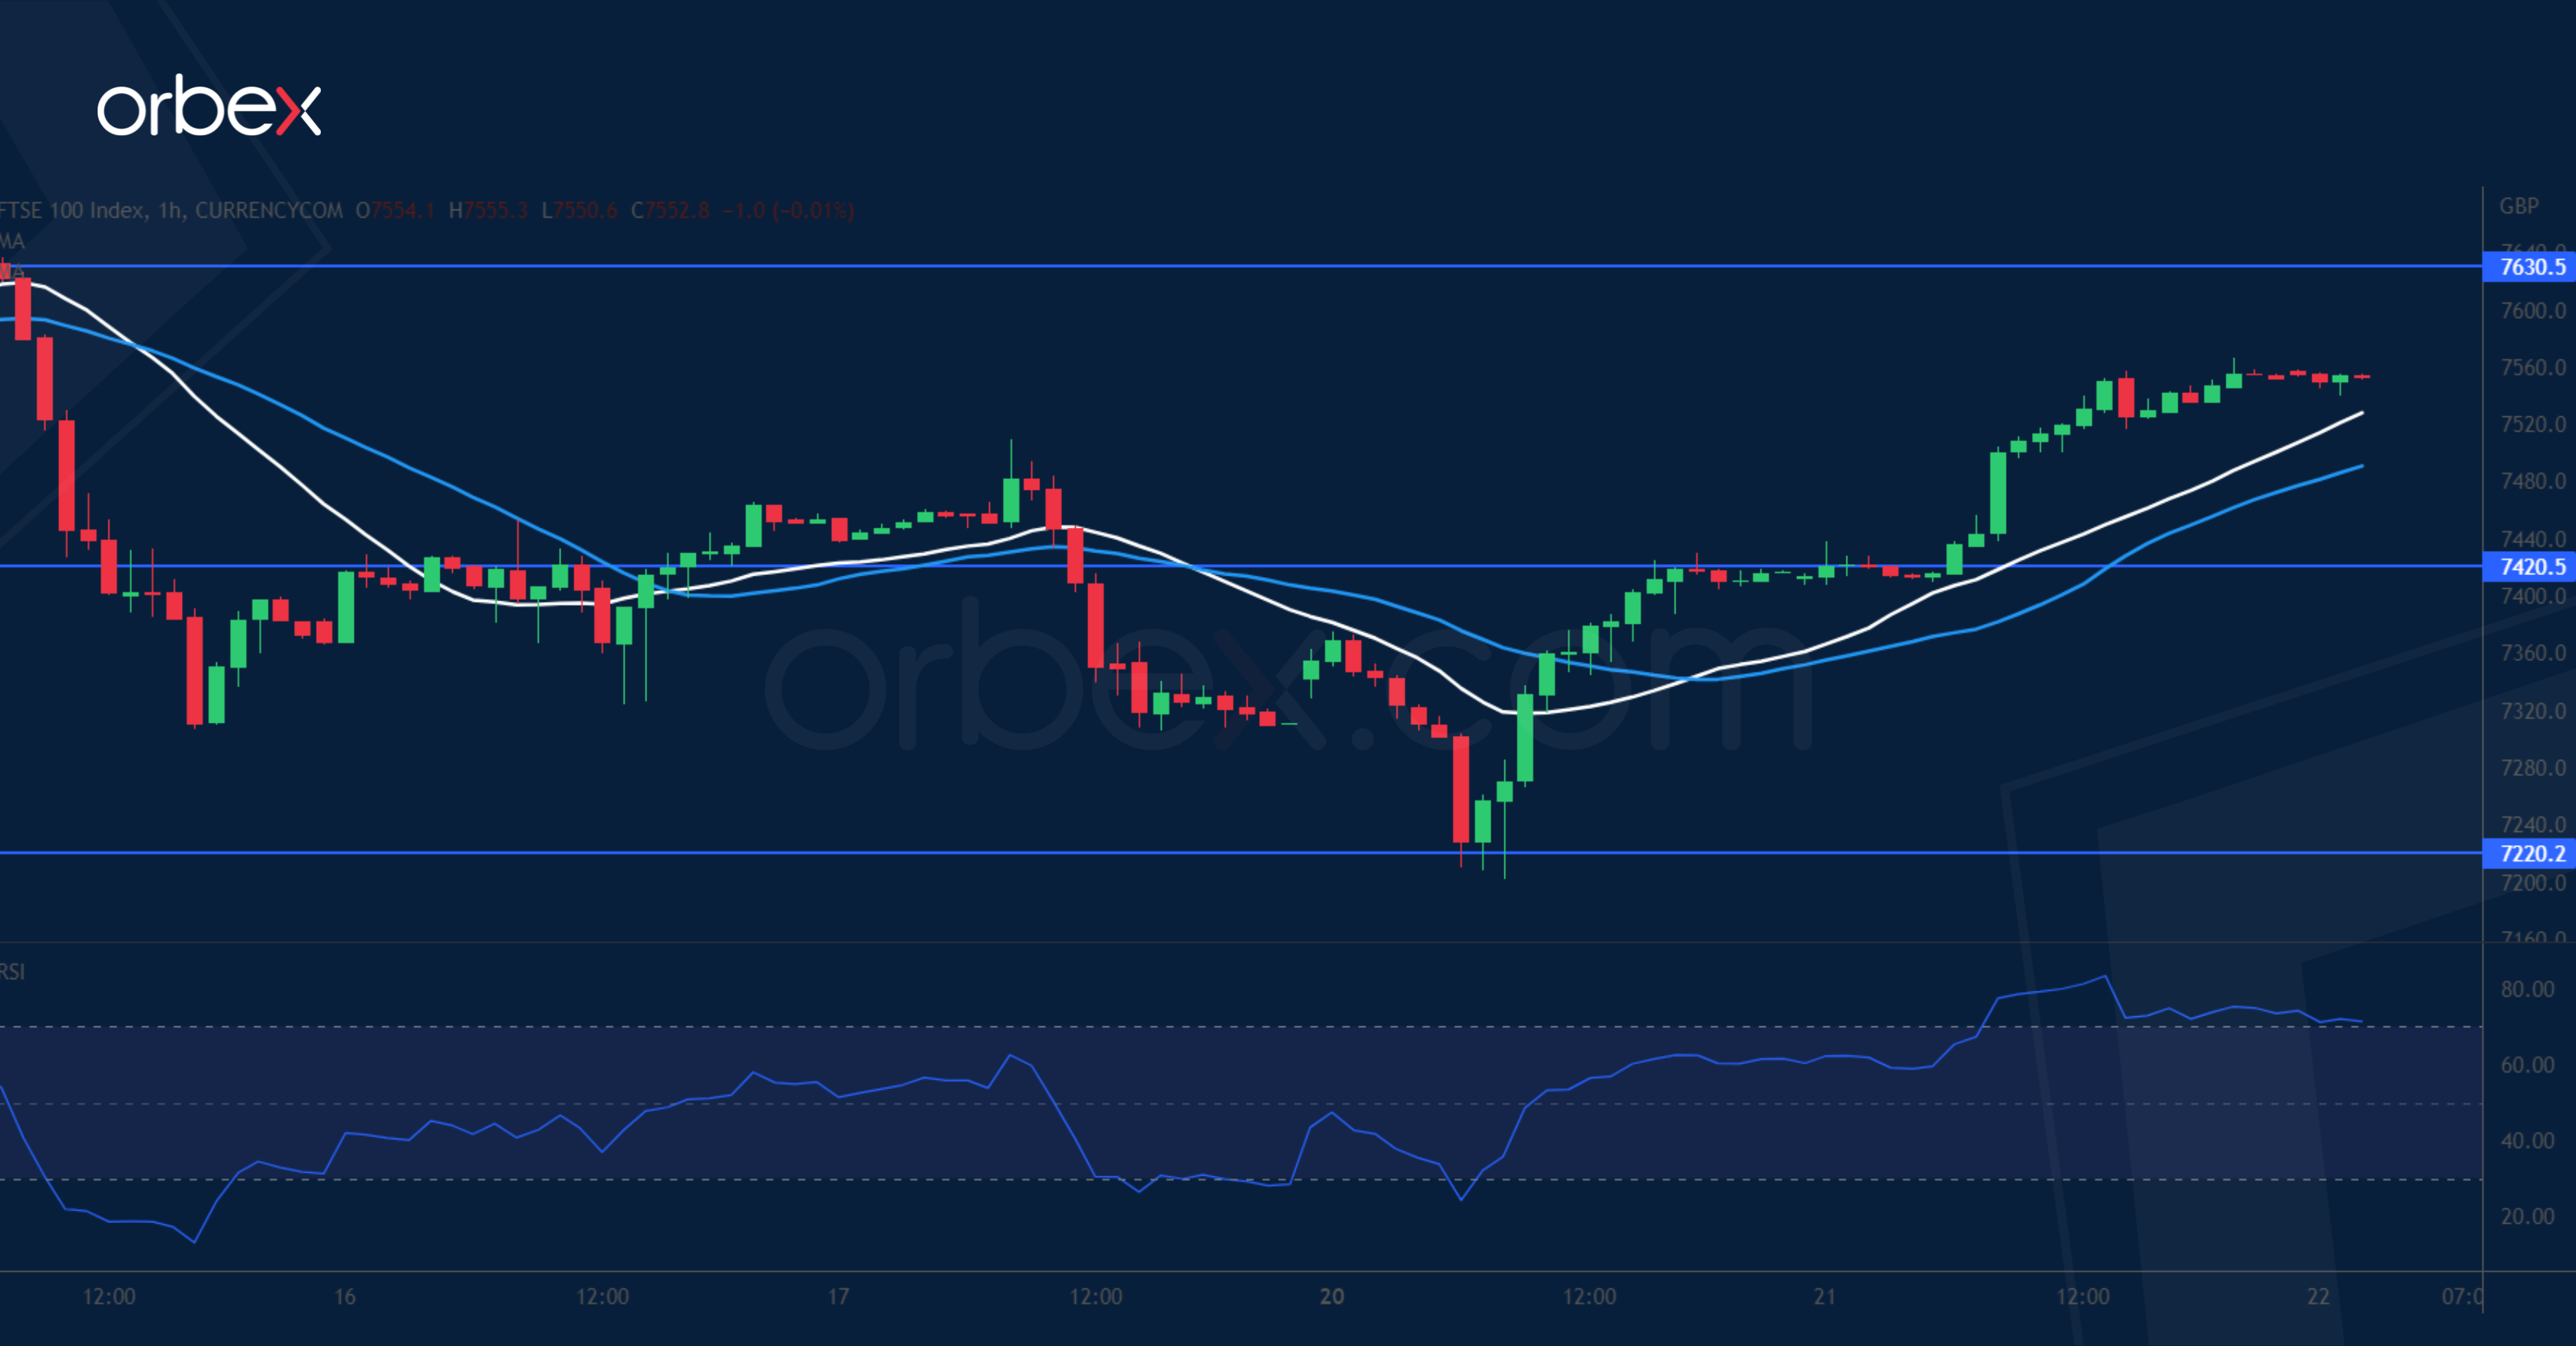
Equities recover as investors reposition ahead of the Fed decision. A surge above last Friday’s high of 7500 has alleviated the pressure on the FTSE 100 but the buy side is not out of the woods yet. 7630 from a previous faded bounce is a key resistance where trapped buyers and new sellers could drive the bids lower. However, a bullish breakout would suggest that the path of least resistance is up and a meaningful recovery above 7740 near the 20-SMA could then take shape. 7420 is a fresh support in case of further hesitation.
How Much More Tightening Projected in Dot Plot is the Key Question
Markets
Concerns about financial stability continued to ease yesterday. Risk-on after the CS rescue entered its second day, lifting equities in Europe about 1.5% higher. Main indices in the US rose by 0.7-1.3%. Core bond yields surged. Markets realized their central bank positioning was (and still is) too dovish given subsiding (at least for now) tail risk and still-high inflation. German yields soared 11.1 (30-y) to 25.6 bps (2y). European swap yields advanced by about half that. US rates skyrocketed 6.7 bps to 19 bps in a similar curve inversion deepener. The slight relative yield advantage combined with the bright mood gave the euro an edge over the dollar. EUR/USD took out the 1.0735 resistance level and closed at 1.0768. The narrative was different for sterling. With UK gilt yields adding a mere 5.4 bps at the front-end, GBP took a whammy against both the euro and the dollar despite being a risk-sensitive currency. EUR/GBP bounced off 0.8735 support (50% retracement March-Sep 2022 rally) to finish the day at 0.8814.
Asian stock markets eke out nice gains following the performance on WS. Japan outperforms, catching up with the rest after being closed yesterday. Bunds trade sideways, US Treasuries rise marginally. Cash yields in the country drops a few bps. It’s equally quiet on FX markets with the dollar, the euro and the Japanese yen all trading subdued. Markets are clearly in countdown mode. The ECB watchers conference kicks off with a ton of speakers scheduled. BuBa’s Nagel in an interview with the Financial Times already gave a glimpse of what to expect (see headline below). Focus later obviously then shifts to the Fed policy meeting tonight. US money markets add an 80% probability to the Fed hiking by 25 bps to 4.75-5%. Not only would this in current market thinking be the final hike, there are about three rate cuts priced in for the second half of this year. Investors assume financial stability is going to dominate monetary policy from tomorrow on. This in our view is grossly underestimating the Fed’s resolve to kill (sticky) inflation. It is pity indeed that the situation around First Republic Bank hasn’t been resolved ahead of the meeting. But we believe there are tools other than the policy rate that are more equipped to address any (liquidity) strains in the market should tensions build again. It is the approach the ECB followed last week Thursday and which we believe the Fed will adopt too. How much more tightening is being projected in the dot plot is the key question. But given current market positioning, yields especially at the short end of the curve have further upside scope. This may also call off the recent EUR/USD recovery. 1.068 serves as a first support, followed by the 1.06 big figure. Sterling investors are counting down to the Bank of England meeting tomorrow. UK February CPI numbers this morning delivered a nasty surprise, coming in at 10.4% headline and 6.2% core. Both are an unexpected acceleration from January. Rate hike coming up. EUR/GBP eases back below 0.88 in a first reaction.
News and views
German Bundesbank president Nagel in an interview with the Financial Times said that the central bank’s fight against inflation is not over. “If we were to tame this stubborn inflation, we will have to be even more stubborn”. There’s still some way to go (in hiking rates) and Nagel believes that they are approaching restrictive area. Once the policy rates hit peak levels, the central bank should resist calls to cut them as otherwise inflation could flare up again. The German central banker is also in favour of speeding up the balance sheet winddown when the council reviews the current €15bn/month in July. He remains bullish on the economy thanks to an extraordinarily robust labour market. In the wake of the recent Credit Suisse rescue, he argued that it’s way too early to say that the EMU is heading for a credit crunch which would choke demand.
The IMF and Ukrainian authorities have reached a staff-level agreement on a set of macroeconomic and financial policies that would be supported by a new 48-month Extended Fund Facility Arrangement. The $15.6bn EFF aims to support the Ukrainian authorities anchor policies that sustain fiscal, external, price and financial stability, and support the ongoing gradual economic recovery, while promoting long-term growth in the context of post-war reconstruction and Ukraine’s path to EU accession. The IMF has to approve changes to its lending rules to involve exogenous shocks that are beyond the control of country authorities and the reach of their economic policies, and which generate larger than usual tail risks. It’s their first loan to a country in war.
A Fed Decision Has Barely Been This Uncertain
It looks like the Federal Reserve (Fed) will announce its latest monetary policy decision to a public with relatively calmer nerves compared to a few days ago.
The VIX index eased sharply from last week’s levels on bank relief, gold tanked to $1935 per ounce and indices on both sides of the Atlantic Ocean were comfortably higher on Tuesday. The Stoxx 600 gained 1.33%, as the S&P500 closed the session above the 4000 mark.
The pressure on US treasuries eased, as well, and the US 2-year yield is now around the levels it was before Fed President Jerome Powell’s speech to the Senate which spurred the expectation of a 50bp hike for week’s meeting.
And even if Powell’s testimony looks like it was ages ago, the bank stress that hit the fan during the pre-Fed silent period prevented the Fed members to give their opinion about an adequate policy response,
As a result, investors have been left to themselves to shape the expectations for today’s decision.
And even though activity on Fed funds futures looks like it finally is pointing at a solid-ish consensus that the Fed should hike rates by 25bp today, no one really knows how much importance the Fed will assess to the latest banking stress, which, in reality, resulted in an uptick in Fed’s balance sheet due to additional liquidity, but which also tightened the financial conditions sharply.
Because banking crisis raised worries that credit flow from the US regional banks into the economy would slow. The premium that lenders ask for lending to high risk borrowers popped, while the flight to safe US treasuries pulled the US sovereign yields lower.
Gap between high yield and sovereign bonds popped above the 5% psychological mark – which traditionally served as a red flag hinting at higher-than-average credit risk in the maret.
And the higher credit risk, and tighter credit availability hint that the US economy could indeed continue to slow, and eventually step into recession – which would, in return, slow demand and pull inflation lower without further intervention from the Fed.
That’s why, the chances are that the Fed hikes by a final 25bp to stick to their promise to bring the US interest rates to around 5%. But we could certainly forget about a further advance to 5.5-6%.
For equities, a softer Fed and unexpected liquidity is supportive in the short run. In this respect, we could see the S&P500 rally extend.
Yet, recession fears, and recession itself could catch up investors, weigh on revenue and earnings expectations and limit the upside potential.
In numbers language: it could be interesting to consider selling a potential S&P500 rally into the 4200 peak – if of course we don’t have data pointing at flourishing US economy despite all challenges.
In the FX, the US dollar is expected to continue its journey to the south, if, of course, the Fed doesn’t come with a hawkish surprise at today’s decision.
The US dollar index has been giving back field since last September. We saw a rebound between February and March due to the rising hawkish Fed expectations, but the dollar index never breached a key Fibonacci resistance to challenge the past 6 months negative trend, the major 38.2% Fibonacci retracement on the depreciation that started end of September.
So, if all goes according to the plan – meaning the Fed hikes by 25bp and signals the end of rate hikes – we will likely see the US dollar return below the 100 level.
25bp Fed Hike Expected But Focus on Guidance
Market movers today
Today's main event is the FOMC meeting where we expect the Fed to hike rates by 25bp, see Fed Preview - Rate hikes continue despite the volatility, 17 March. Consensus seems largely in line with our views as markets are pricing in an 80% probability of a hike. Focus will mainly be on the Fed's guidance on future moves where the Fed is walking a balance between securing financial stability and fighting still too high inflation pressures. There are differing views among analysts about to what degree the recent turmoil will provide some of the tightening needed to lower inflation and it will be interesting to gauge where the Fed stands on this issue.
UK inflation will be out today and expectations is for 5.7% for underlying inflation compared to 5.8% in January, following the downward trend seen since the peak in October. Services inflation continues to be a risk and is on the radar for the Bank of England (BoE). BoE delivers its rate decision tomorrow meaning that today's inflation outcome will be an important input. We expect a final 25bp hike up to 4.25% to be delivered.
We also have a flurry of ECB speakers in the calendar at the ECB watchers conference, notably Lagarde at 9:45. Obviously, markets will keep a close eye for any news or headlines regarding banks and systemic risks.
The 60 second overview
'Risk on' continued in Asia: With financial turmoil calming down risk appetite rebounded yesterday and the improvement continued in Asian trading overnight. After S&P500 increased 1.2% yesterday, the future eked out a small further gain. Bond yields are broadly flat in overnight trading after rising throughout the day yesterday as risk sentiment improved. Oil and metals prices have also regained some ground. Markets are now awaiting the Fed meeting tonight.
Credit: Yesterday saw some further recovery of the AT1 bond market overall, as investors likely reflected on the comments from European regulators (EBA/ECB/SRB joint statement and BoE) that common equity instruments are first in line to absorb losses before AT1s and that the Swiss approach where common equity holders were prioritised as seen over the weekend is therefore unique. The broader credit market also saw improving sentiment with CDS indices tightening (iTraxx Main by 7bp to 91bp and Xover by 29bp to 472bp.
Xi concludes meeting in Moscow: Chinese President Xi Jinping is concluding his three-day-visit in Moscow. During the visit China's peace proposal was discussed but also a deepening trade relationship. Xi reiterated China's "neutral position" at the meeting and it has been flagged that Xi will talk to Ukraine's leader Volodymyr Zelensky on phone soon. We have doubts that China's peace proposal will gain traction as it has been widely criticized by the US, and Ukraine and Russia are very far from each other in their individual demands. A key concern that could escalate global tensions has been whether China would deliver weapons to Russia but so far there are few indications of this. NATO Secretary General Jens Stoltenberg said Tuesday that the alliance had seen "some signs" Russia had requested lethal aid from China for the war in Ukraine but so far "haven't seen any proof that China is delivering lethal weapons to Russia."
FI: European curves flattened in a rates up move (bear flattening) from the front end. ECB pricing went 27bp higher on the day as no news on the banking turmoil made investors reassess the narrative albeit still waiting for the Fed decision tonight. Markets price 3.41% peak policy rate for ECB, some 40bp higher than the recent lows. German ASW spreads tightening significantly, led by the 5y bobl spread which tightened almost 10bp, but is still 15bp higher than 14 days ago when the turmoil started. After flirting with the 200bp mark, the BTPs-bund spread is trading at 183bp (tightened 3bp yesterday).
Nordic macro
Riksbank Governor Thedéen will speak at 13.10 CET in a panel on technology and climate change at the BIS Innovation Summit. It seems unlikely that he will dwell on current monetary policy or the banking turmoil.
UK CPI rose back to 10.4% yoy in Feb, core CPI up to 6.2% yoy
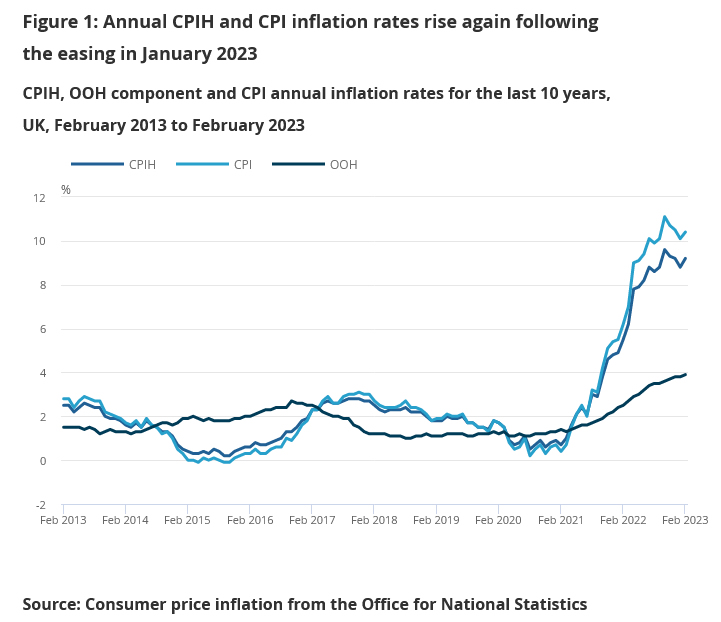
UK CPI accelerated from 10.1% yoy to 10.4% yoy in February, well above expectation of slowing to 9.8% yoy. The reading was still below recent peak of 11.1% yoy in October 2022, the highest since 1981. CPI excluding food, energy, alcohol and tobacco (core CPI) jumped from 5.8% yoy to 6.2% yoy, above expectation of 5.7% yoy.
On a monthly basis, CPI rose 1.1% mom, more than reversing January's -0.6% mom decline, above expectation of 0.6% mom.
Also released, RPI came in at 1.2% mom, 13.8% yoy, above expectation of 0.8% mom, 13.2% yoy. PPI input was at -0.1% mom, 12.1% yoy, versus expectation of 0.8% mom, 12.5% yoy. PPI core output was at -0.2% mom, 10.4% yoy, versus expectation of 0.4% mom, 9.9% yoy.
Technical Outlook and Review
DXY:
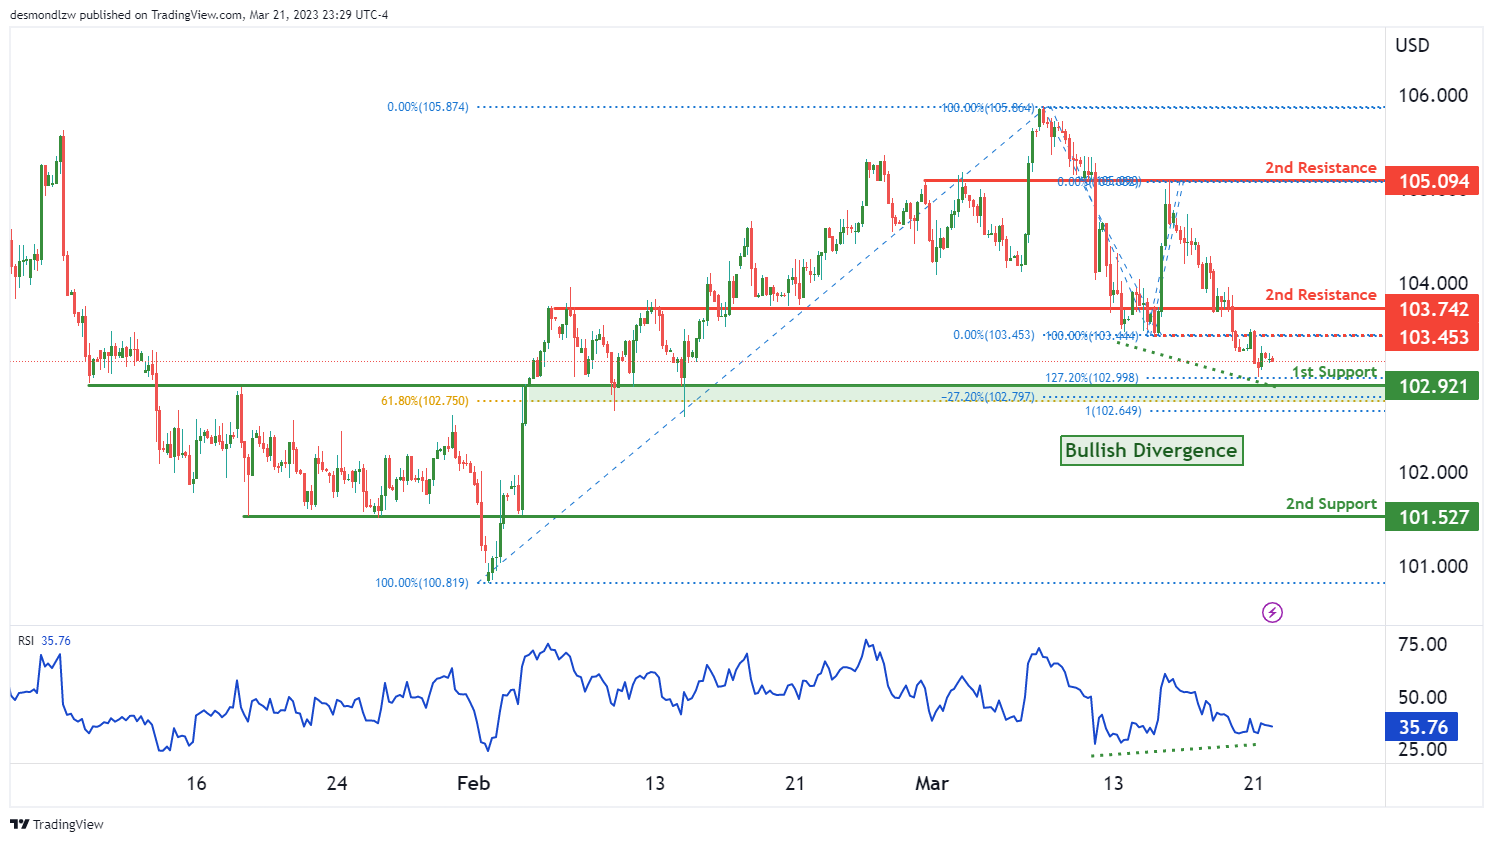
The DXY chart indicates that it currently has a bullish momentum. This is supported by an ascending support line and an Ichimoku cloud support, suggesting that prices could continue to rise further along with the momentum.
There is a major support at 102.92, which is an overlap support and has a 61.80% Fibonacci retracement lining up with it. In the event that prices bounce off this support level, they could rise to the first resistance at 103.74, which is an overlap resistance level.
Furthermore, there is an intermediate resistance level at 103.45, which is between the current price and the first resistance level. Should prices break through this intermediate resistance, it could trigger a stronger bullish acceleration towards the first resistance level.
However, if prices break the first support level, the next level it could drop to is the second support at 101.52, which is also an overlap support level.
It is also worth noting that the RSI is displaying bullish divergence versus price, which could suggest a potential bullish reversal soon.
EUR/USD:
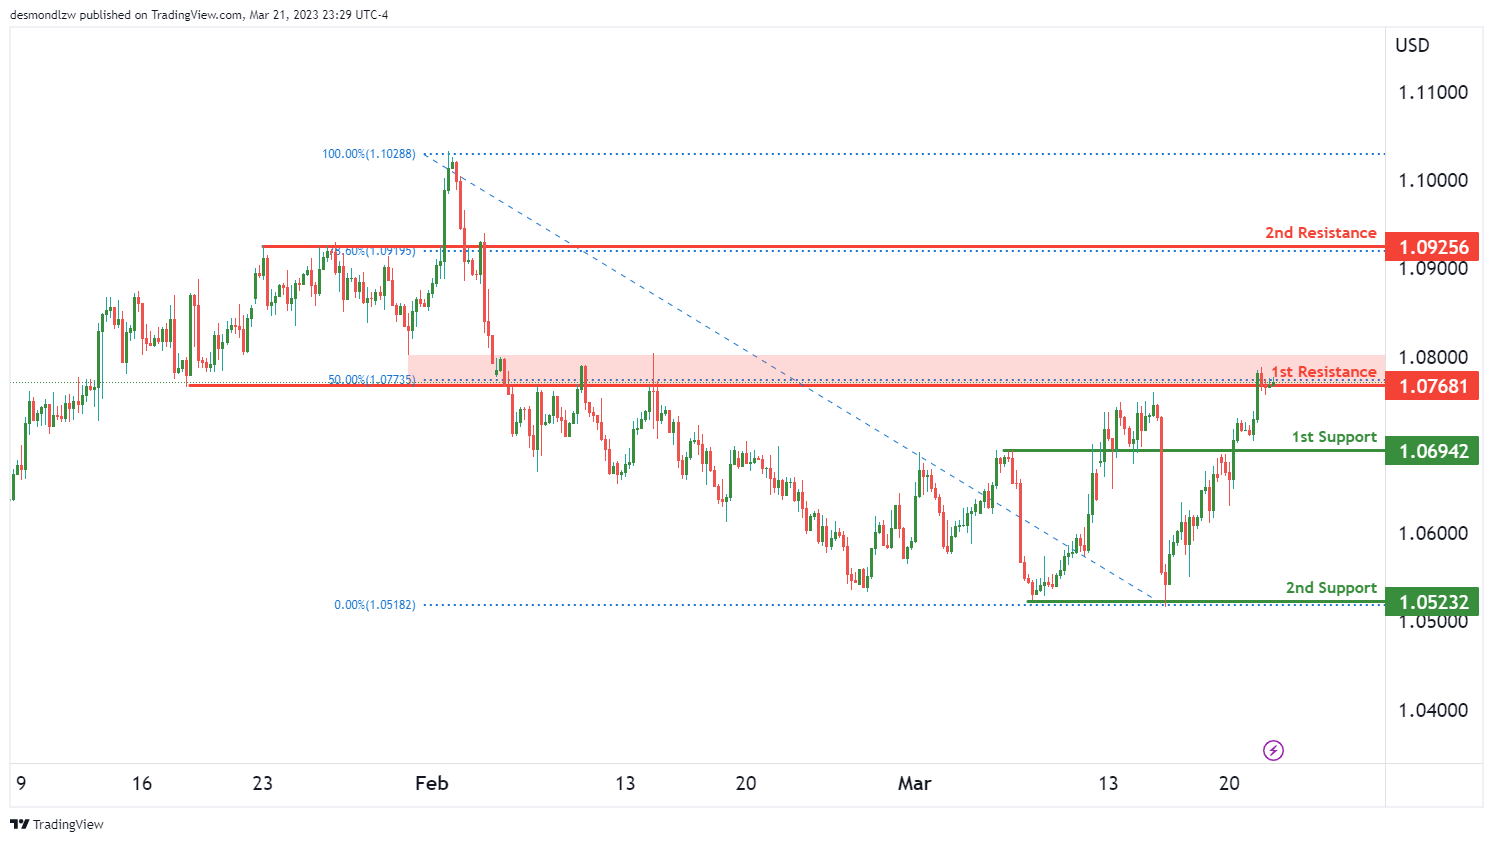
Overall momentum of the chart: Bearish
Price is currently exhibiting bearish momentum and may potentially react negatively to the first resistance level, leading to a drop towards the first support level.
The first support level is at 1.0694, which is a strong overlap support level. If price breaks below this level, it could reach the second support level at 1.0523, which is a multi-swing low support level.
On the other hand, the first resistance level at 1.0768 is a significant overlap resistance level and also aligns with the 50% Fibonacci retracement level. If price were to break above this level, it could potentially head towards the second resistance level at 1.0925, which is another important overlap resistance level.
GBP/USD:
The GBP/USD chart is currently displaying bullish momentum, with potential for a bullish bounce off the 1st support at 1.2194 and a move towards the 1st resistance at 1.2287. The overall momentum of the chart is bullish, with a clear ascending trend line indicating continued upward momentum.
The 1st support level at 1.2194 is an overlap support with a 23.6% Fibonacci retracement lining up with it, making it a strong level of support. The 2nd support level at 1.2045 is also an overlap support, this time with a 50% Fibonacci retracement.
On the resistance side, the 1st resistance level at 1.2287 is another overlap level and provides a good opportunity for prices to reverse direction. The 2nd resistance level at 1.2440 is a multi-swing high resistance level that may provide additional resistance if prices break through the 1st resistance level.
It is worth noting that the overall bullish momentum could be halted if prices break below the ascending trend line or below the 1st support level. Additionally, the absence of any clear Ichimoku cloud signals means that the momentum of the chart is not being driven by any particular directional trend.
USD/CHF:
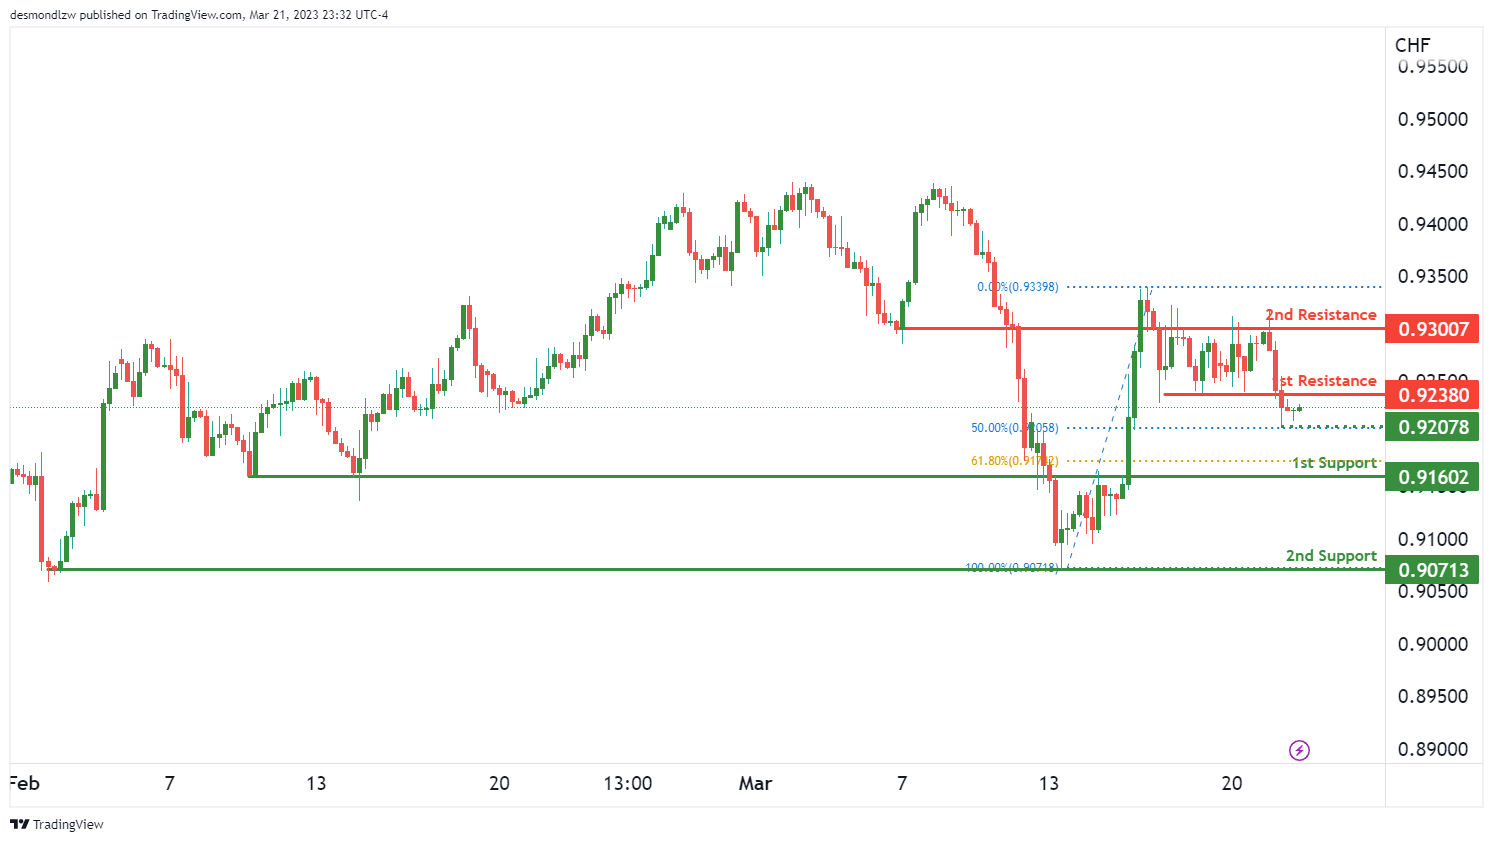
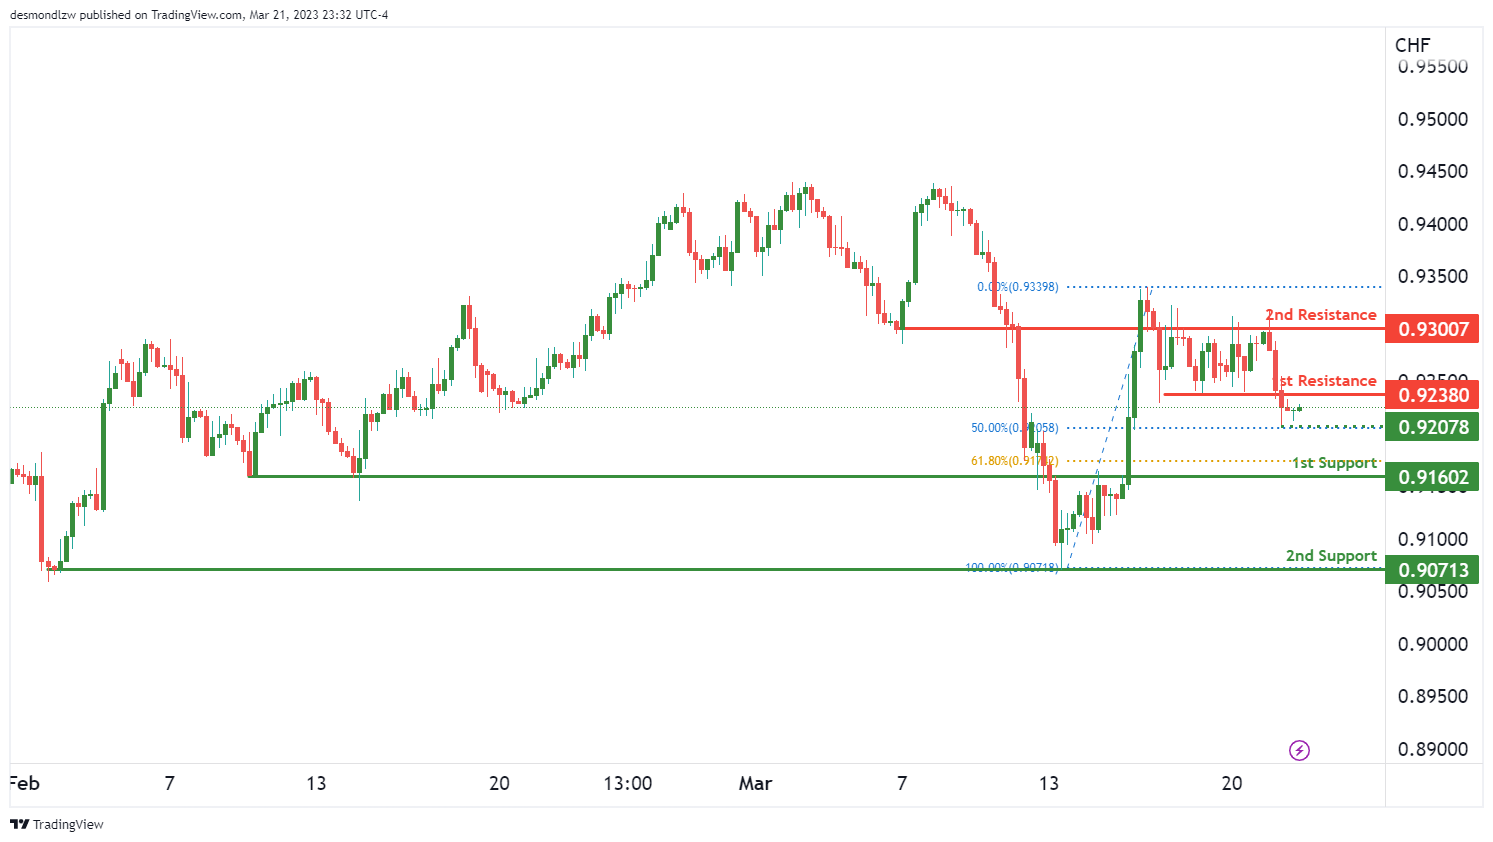
The USD/CHF chart is showing a bearish momentum, which suggests a potential drop from resistance to support levels. The overall bias is bearish, and price is below the Ichimoku cloud, which indicates a strong bearish momentum.
The first resistance level is at 0.9238, which is an overlap resistance level. This resistance level could trigger a bearish reaction and push prices down towards the first support level at 0.9160. The 0.9238 resistance level is also significant as it coincides with the descending trend line, which further strengthens the bearish momentum.
If prices drop below the 0.9160 support level, the next support level is at 0.9071. This level is a multi-swing low support level, and it has previously acted as a strong support level. A bounce from this support level could trigger a potential bullish move towards the 0.9238 resistance level.
It’s worth noting that there is an intermediate support level at 0.9307, which is a 50% Fibonacci retracement level. If prices break below this support level, it could lead to a stronger bearish acceleration towards the 0.9160 support level.
USD/JPY:
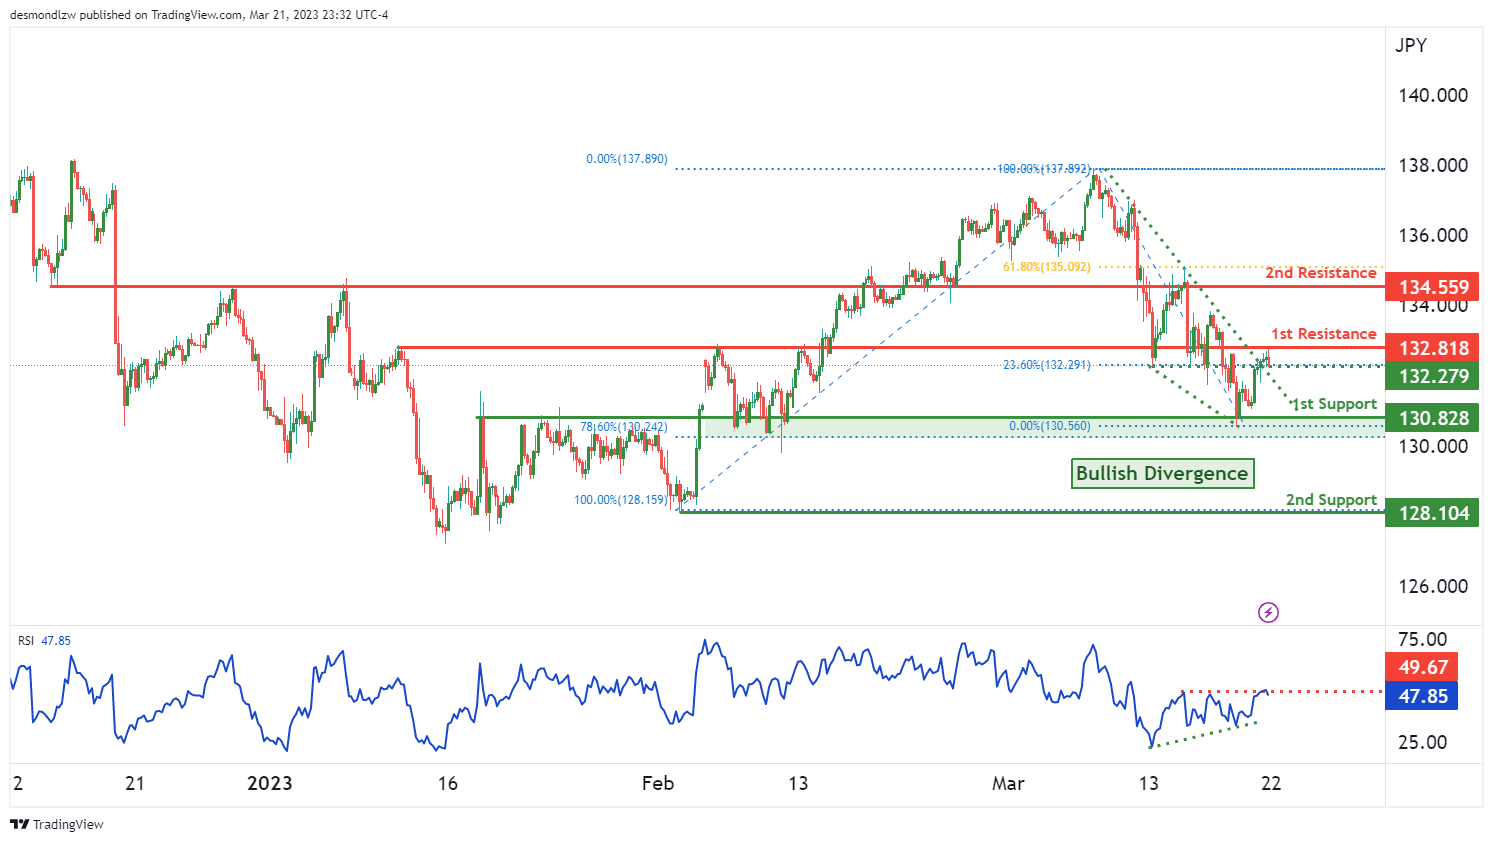
The USD/JPY chart shows a bullish momentum as it is currently above a major ascending trend line, indicating that further bullish momentum may be seen. If price breaks through the 1st resistance level, it could rise to the 2nd resistance level.
The 1st support level is at 130.82, which is a strong overlap support and has a 78.60% Fibonacci retracement lining up with it. The 2nd support level is at 128.10, which is a multi-swing low support that price has bounced off multiple times in the past.
The 1st resistance level is at 132.81, which is an overlap resistance and has a 23.60% Fibonacci retracement lining up with it. The 2nd resistance level is at 134.55, which is an overlap resistance and has a 61.80% Fibonacci retracement lining up with it.
It’s worth noting that the RSI is displaying bullish divergence versus price, suggesting that a bounce may occur soon.
AUD/USD:
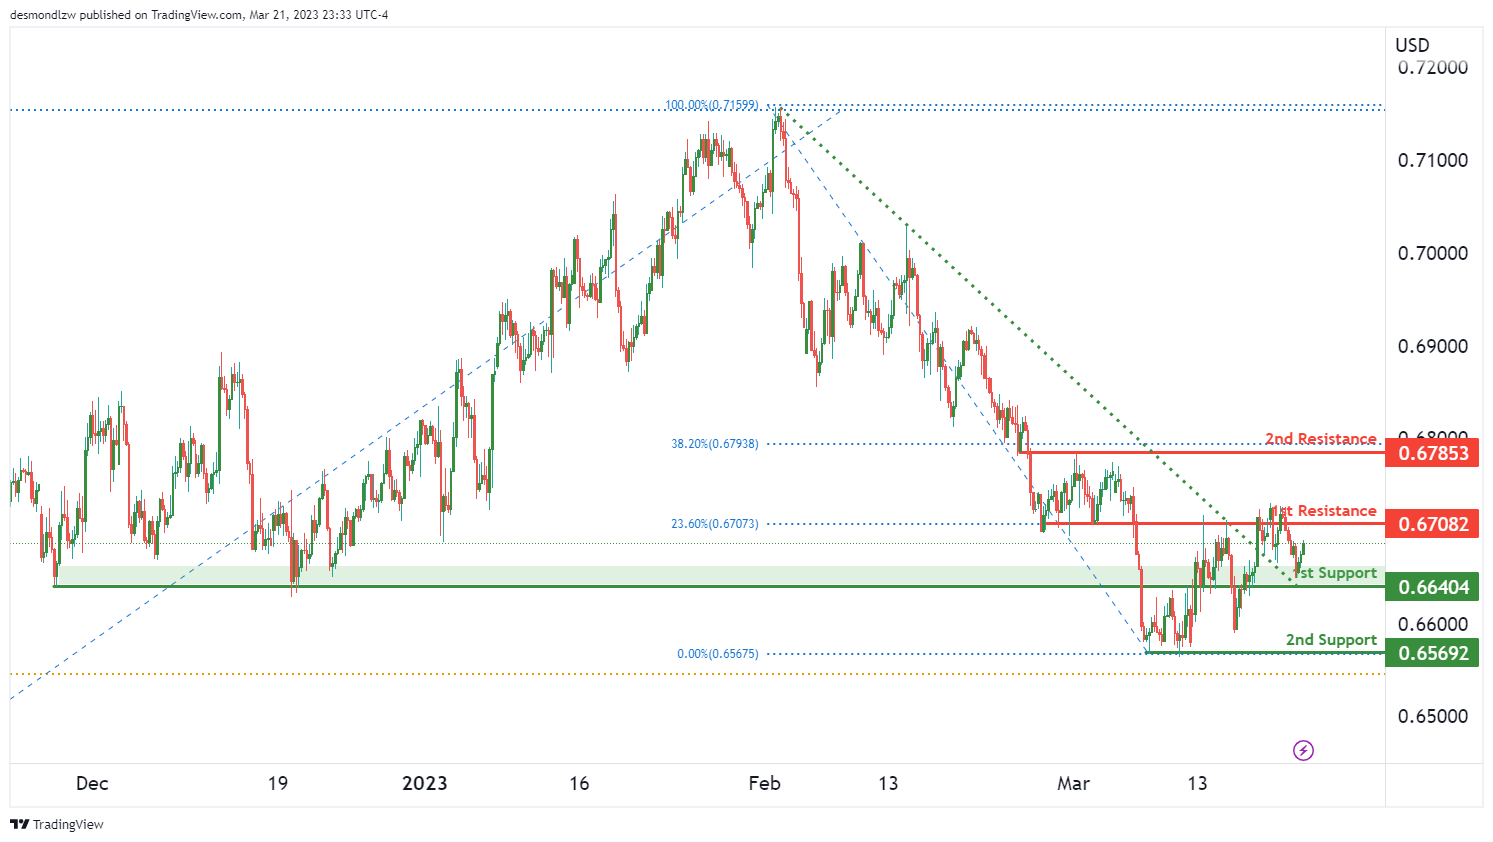
Based on the analysis, the AUD/USD chart is showing bullish momentum, which has been contributed by the price breaking above a descending resistance line, indicating the potential for a bullish move. The first support level is at 0.6640, which is a significant overlap support. The second support level is at 0.6569, which is a multi-swing low support. The first resistance level is at 0.6708, which coincides with a 23.60% Fibonacci retracement, making it a strong overlap resistance. The second resistance level is at 0.6785, which is another overlap resistance and also lines up with a 38.20% Fibonacci retracement.
The potential move for the AUD/USD is a bullish continuation towards the first resistance level at 0.6708. If the price can break through this resistance, it could potentially rise towards the second resistance level at 0.6785. However, in case the price drops, it could find support at the first support level of 0.6640, and a break below that could lead to a drop towards the second support level at 0.6569.
It is worth noting that there is a strong bullish momentum on the chart, which could potentially continue to drive the price higher
NZD/USD:
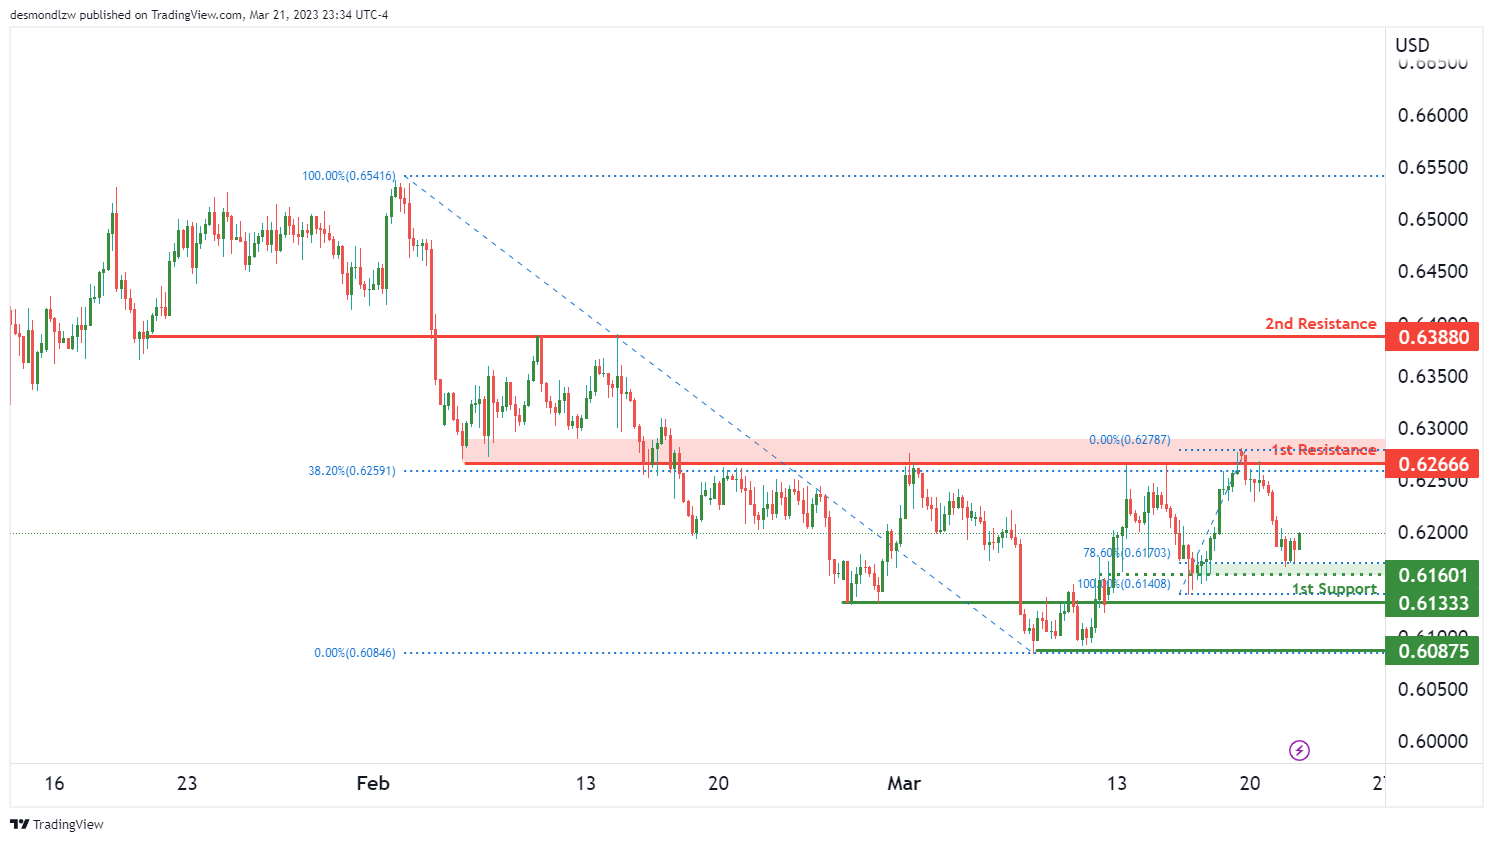
NZD/USD has a bullish overall momentum with potential for a bullish continuation towards the first resistance. The first support is at 0.6133, which is an overlap support, while the second support is at 0.6087, a multi-swing low support. The first resistance at 0.6266 is an overlap resistance and lines up with the 38.20% Fibonacci retracement. There is also a second resistance at 0.6388 which is also an overlap resistance. An intermediate support level is at 0.6160, which lines up with the 78.60% Fibonacci retracement. Traders should keep an eye on these levels for potential price reactions.
It’s worth noting that NZD/USD has a bullish overall momentum, and the price has the potential to continue its upward trend. However, traders should also be cautious and watch for any potential pullbacks or reversals. A break below the support levels could indicate a change in the momentum, while a break above the resistance levels could lead to further bullish momentum.
USD/CAD:
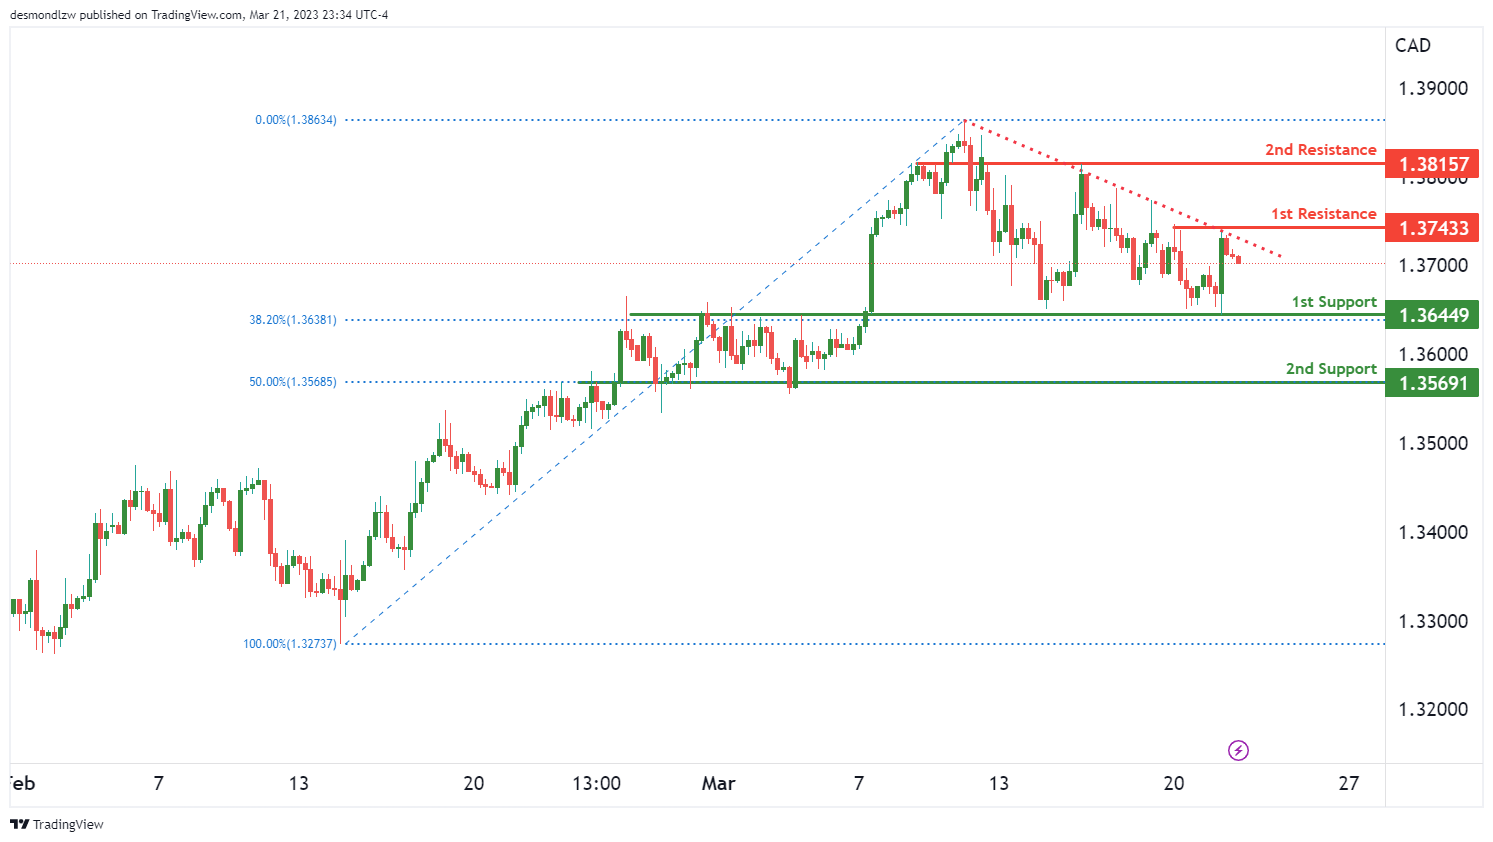
NZD/USD has a bullish overall momentum with potential for a bullish continuation towards the first resistance. The first support is at 0.6133, which is an overlap support, while the second support is at 0.6087, a multi-swing low support. The first resistance at 0.6266 is an overlap resistance and lines up with the 38.20% Fibonacci retracement. There is also a second resistance at 0.6388 which is also an overlap resistance. An intermediate support level is at 0.6160, which lines up with the 78.60% Fibonacci retracement. Traders should keep an eye on these levels for potential price reactions.
It’s worth noting that NZD/USD has a bullish overall momentum, and the price has the potential to continue its upward trend. However, traders should also be cautious and watch for any potential pullbacks or reversals. A break below the support levels could indicate a change in the momentum, while a break above the resistance levels could lead to further bullish momentum.
DJ30:
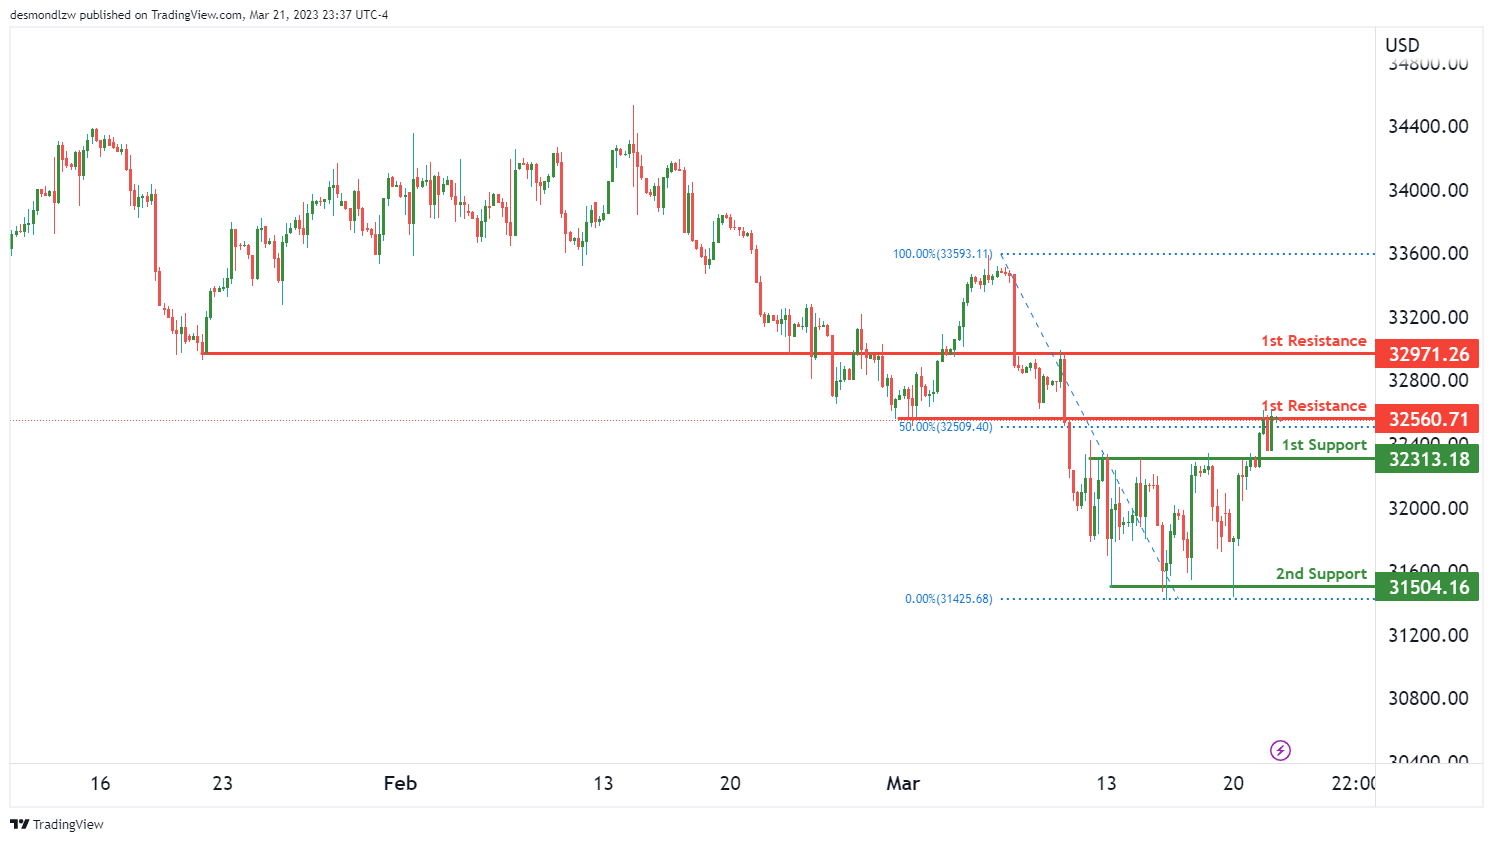
The DJ30 chart is currently showing bearish momentum with potential for a bearish reaction off the 1st resistance and a drop towards the 1st support. The overall trend of the chart suggests that prices could continue to fall in the short term.
The 1st support level is at 32313, which is a strong overlap support level. If prices were to break this level, the next support level would be at 31504, which is a multi-swing low support level.
On the resistance side, the 1st resistance is at 32560, which is an overlap resistance level and also has a 50% Fibonacci retracement lining up with it. If prices were to break this level, the next resistance level would be at 32971, which is also an overlap resistance level.
It’s important to note that if prices break above the 1st resistance, this could potentially signal a shift towards a bullish momentum. However, the current bearish momentum suggests that prices will likely continue to fall towards the 1st support level.
Overall, the DJ30 chart is showing bearish momentum with potential for a drop towards the 1st support level at 32313. It’s important to monitor the chart for any potential breakouts above the 1st resistance level, which could signal a shift towards a bullish momentum.
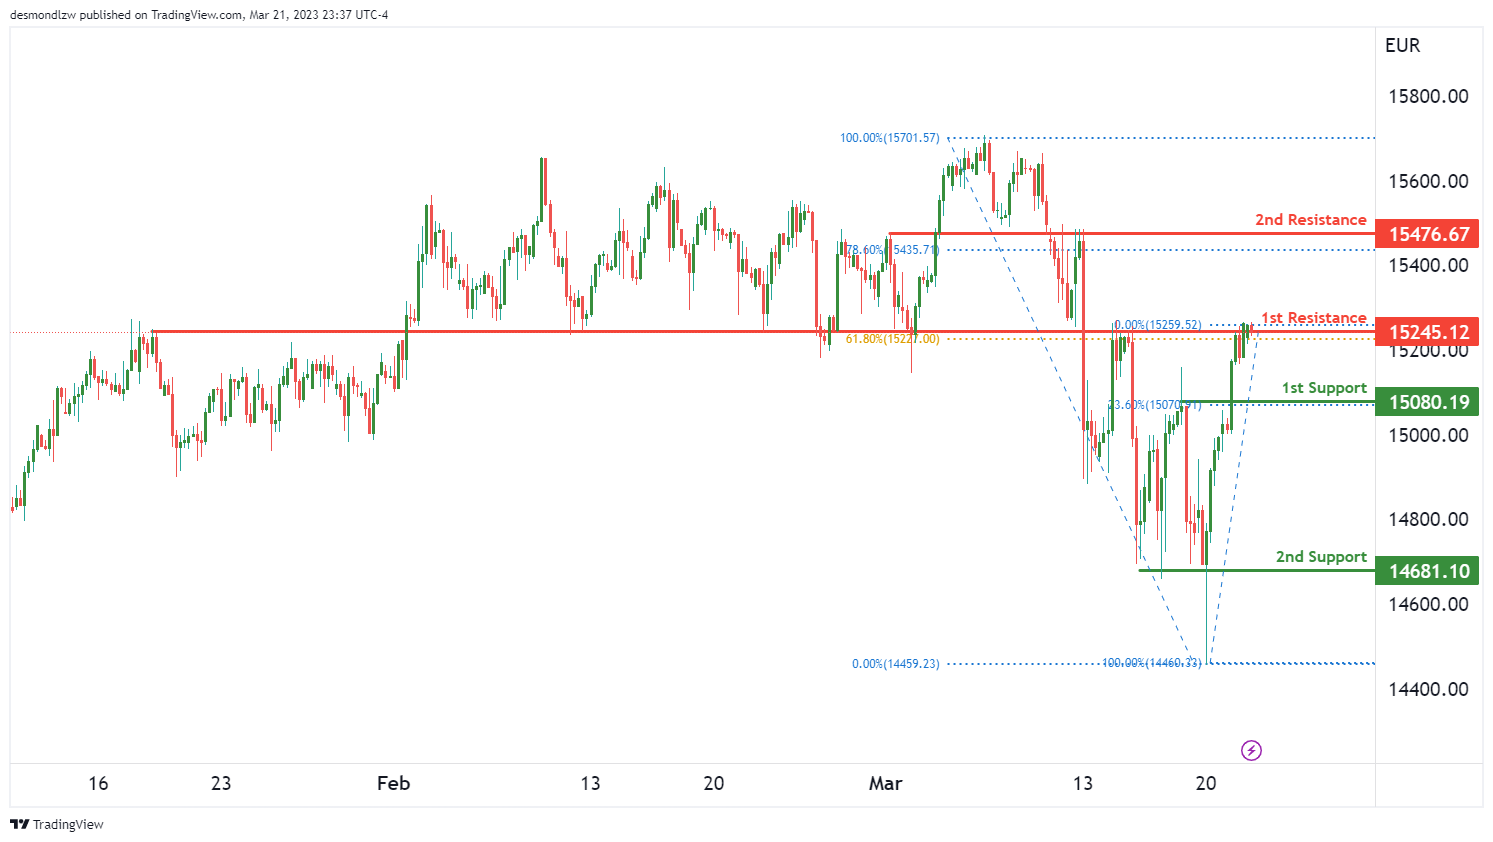
GER30:
The GER30 chart is showing bearish momentum, which could continue if the price reacts negatively to the 1st resistance level and drops towards the 1st support level.
The 1st support is at 15080 and is considered a pullback support, as it aligns with the 23.60% Fibonacci retracement level. If the price bounces from this support level, it could potentially rise towards the 1st resistance level at 15245, which is an overlap resistance level and lines up with the 61.80% Fibonacci retracement.
However, if the price breaks through the 1st support level, it could drop to the 2nd support at 147, which is a multi-swing low support level.
On the other hand, if the price manages to break through the 1st resistance level, it could potentially rise towards the 2nd resistance level at 15476, which is an overlap resistance level and lines up with the 78.60% Fibonacci retracement.
Overall, the GER30 chart is showing bearish momentum, and a drop towards the 1st support level could occur if the price reacts negatively to the 1st resistance level. However, if the price manages to break through the resistance level, there is potential for a bullish move towards the 2nd resistance level.
BTC/USD:
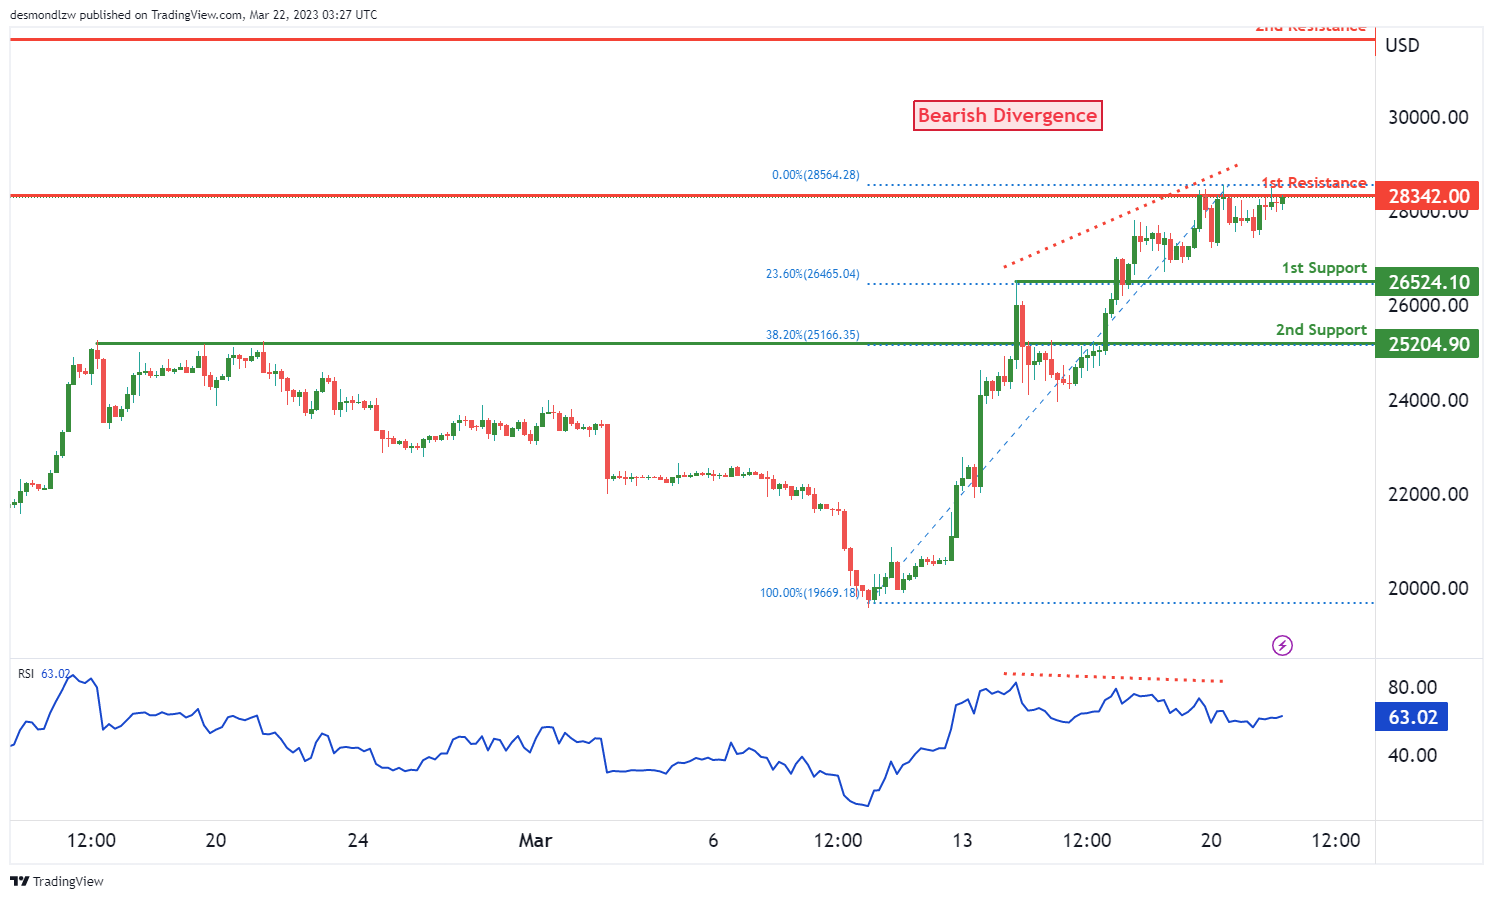
The overall momentum of the BTC/USD chart is bearish, with the potential for a bearish reaction off the 1st resistance and a drop to the 1st support. The 1st support level is at 26524, which is an overlap support and coincides with the 23.60% Fibonacci retracement. The 2nd support level is at 25204, which is also an overlap support and lines up with the 38.20% Fibonacci retracement.
On the other hand, the 1st resistance level is at 28342, which is an overlap resistance. The 2nd resistance level is at 31662, which is a swing high resistance. If the price were to break through the 1st resistance level, it could potentially rise towards the 2nd resistance level.
The RSI is also displaying bearish divergence versus price, which suggests that a reversal might occur soon.
US500
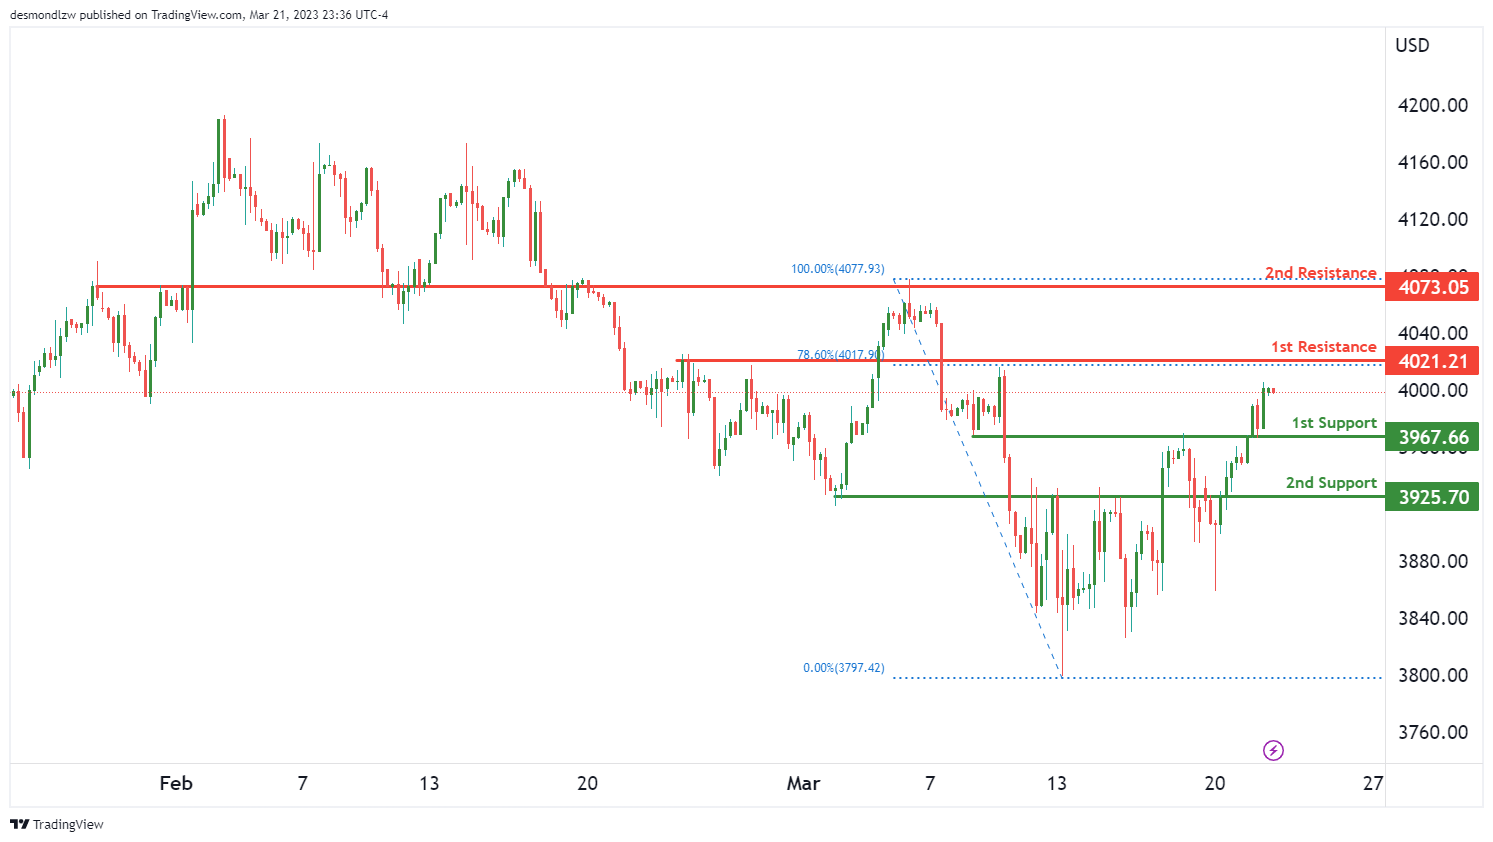
The US500 chart is showing strong bullish momentum, with price potentially continuing its upward trend towards the 1st resistance level at 4021.
Support and Resistance Levels
The first support level is at 3967, which is an overlap support. The second support level is at 3925, which is also an overlap support.
The first resistance level is at 4021, which is an overlap resistance and has a 78.60% Fibonacci retracement lining up with it. The second resistance level is at 4073, which is a swing high resistance.
Overall Momentum
The overall momentum of the chart is bullish, indicating that prices may rise further. However, if the price were to break the 3967 support level, it could trigger a drop towards the 2nd support level at 3925.
ETH/USD:
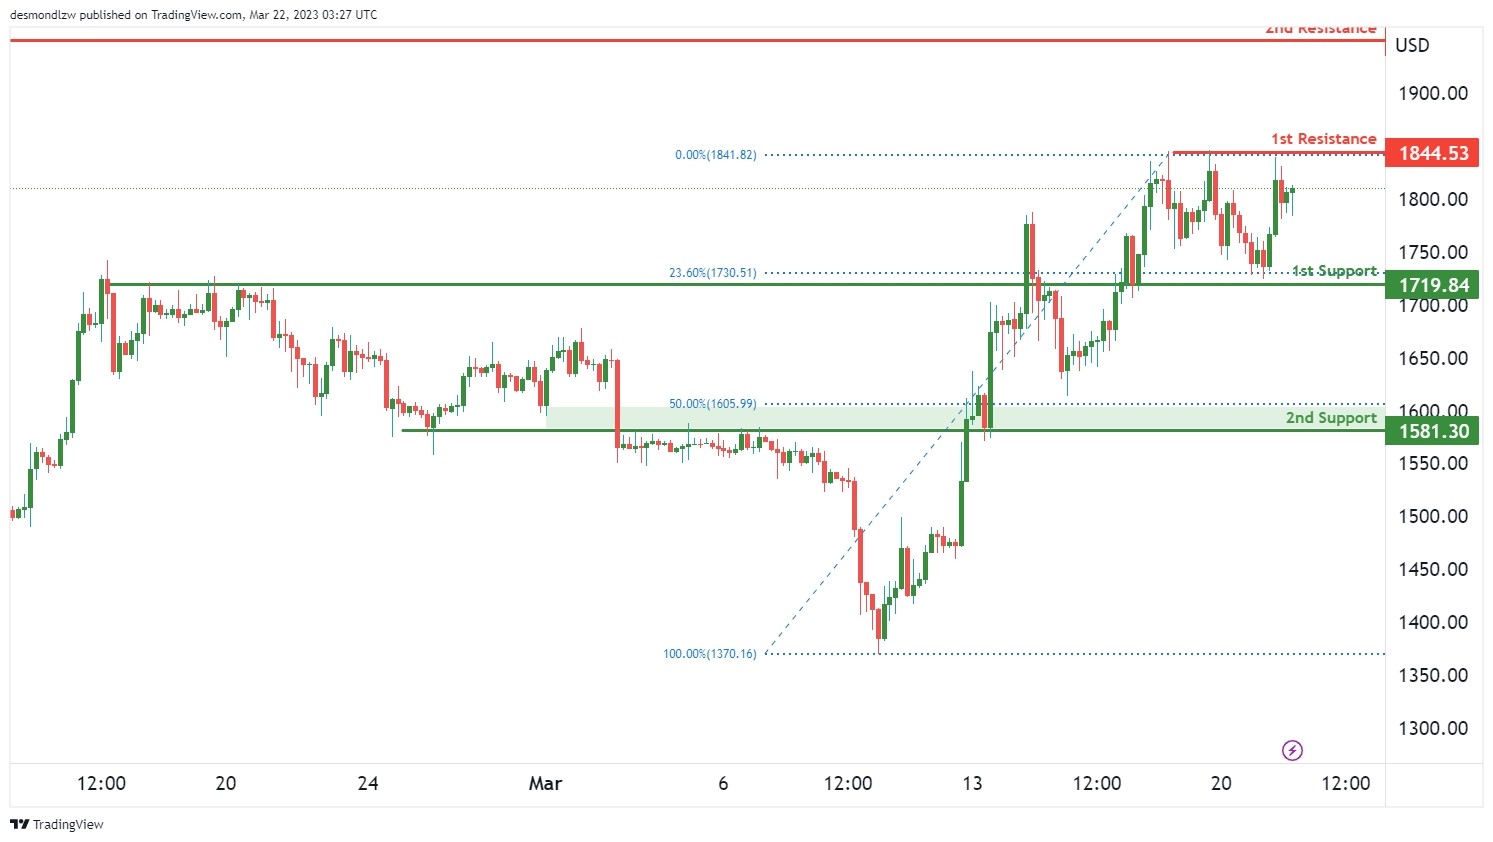
Ethereum’s chart is currently showing bearish momentum. However, there might be a short-term rise towards the first resistance before a potential reversal and drop towards the first support.
The first support level is at 1719.84, which is an overlap support and a 23.60% Fibonacci retracement level. A bounce off this level could potentially happen, leading to a short-term bullish move.
If the bullish move occurs, the first resistance level to watch out for is at 1844.53, which is a multi-swing high resistance. A rise towards this level could be expected in the short term.
However, a potential reversal and drop towards the first support might occur afterwards. The second support level is at 1518.30, which is another overlap support, and a 50% Fibonacci retracement level.
On the upside, the second resistance level to watch out for is at 1950.25, which is a swing high resistance.
WTI/USD:
WTI crude oil has been experiencing a bearish momentum recently. The price is expected to potentially make a bearish reaction off the first resistance at 70.38 and drop to the first support at 67.02. The second support level at 64.36 is also expected to act as a support due to its multi-swing low support status.
In terms of resistance levels, the first resistance level at 70.38 is an overlap resistance, while the second resistance level at 73.40 is a 50% Fibonacci retracement level. Additionally, there is an intermediate resistance level at 69.75.
Overall, the chart’s momentum is bearish, with prices expected to react bearishly off the first resistance level and drop towards the first support level

XAU/USD (GOLD):
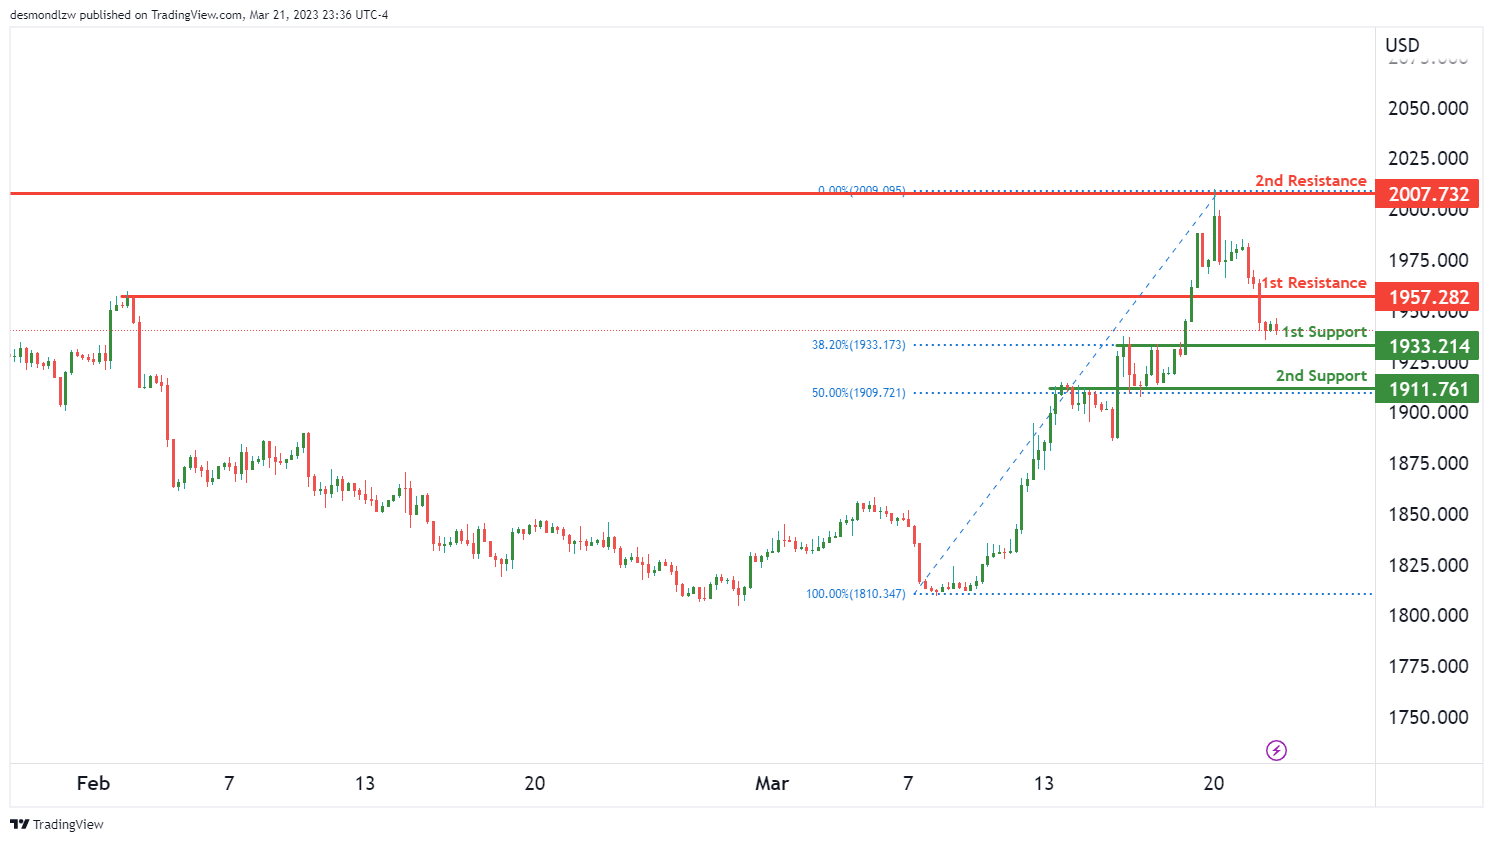
Gold could potentially make a bullish bounce off the first support level at $1933 and head towards the first resistance level at $1957. The $1933 level is an overlap support, coinciding with the 38.20% Fibonacci retracement, which could act as a strong support level. Meanwhile, the $1957 level is also an overlap resistance that may provide a challenge for gold if it reaches that level. The next resistance level is at $2007, which is a swing high resistance.
If gold fails to hold above the $1933 support level, it could potentially drop to the $1911 support level, which is also an overlap support and coincides with the 50% Fibonacci retracement. A break below this level could lead to further downside momentum.
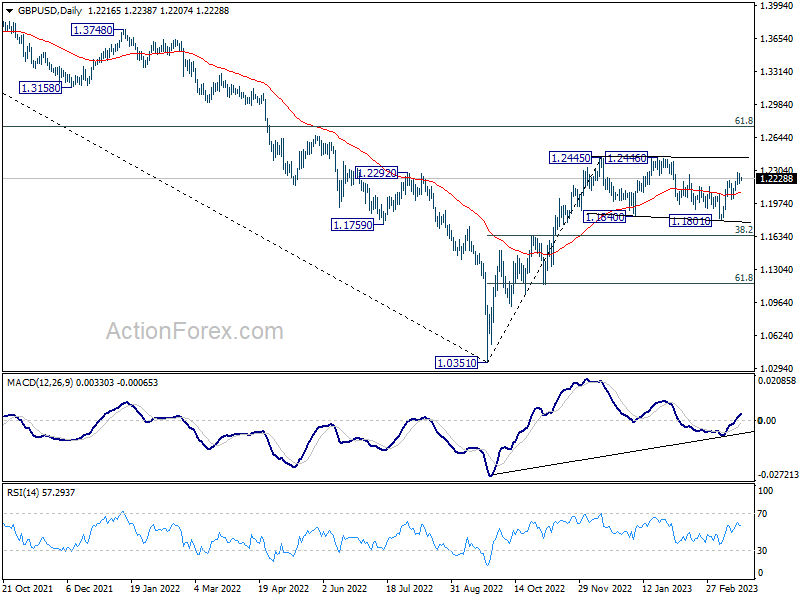
GBP/USD Daily Outlook
Daily Pivots: (S1) 1.2170; (P) 1.2226; (R1) 1.2274; More...
Intraday bias in GBP/USD is turned neutral first with current retreat. Some consolidations could be seen below 1.2283 temporary low. But outlook will stay cautiously bullish as long as 1.2009 support hold. As noted before, corrective pattern from 1.2445 could have completed with three waves to 1.1801 already. Above 1.2283 will extend the rise from 1.1801 to retest 1.2445/6 resistance. Firm break of 1.2445/6 will resume larger rise from 1.0351, and target 1.2759 fibonacci level.
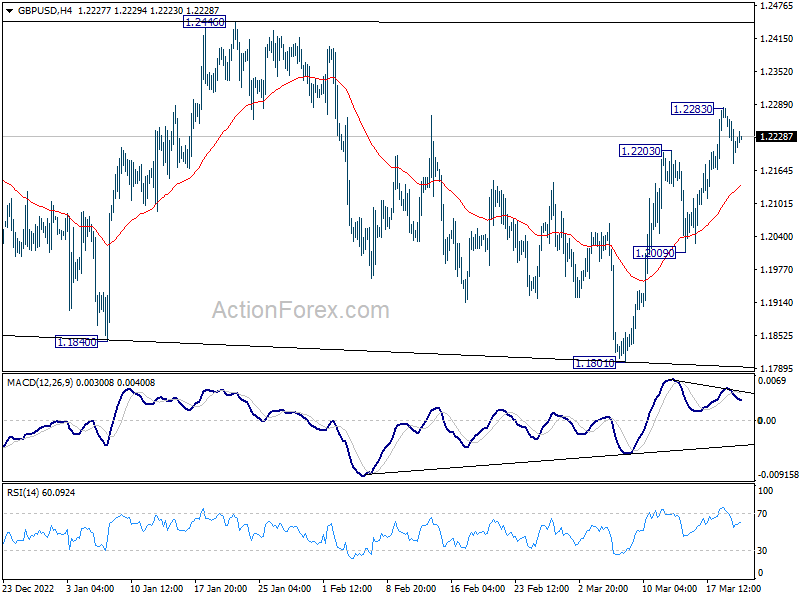
In the bigger picture, price action from 1.2445 are seen as a corrective pattern to rise from 1.0351 medium term bottom (2022 low). Resumption is expected as a later stage and firm break of 1.2446 will target 61.8% retracement of 1.4248 (2021 high) to 1.0351 at 1.2759. This will remain the favored case as long as 38.2% retracement of 1.0351 to 1.2445 at 1.1645 holds.