Sample Category Title
NZDUSD Stuck in Range Ahead of Fed Meeting
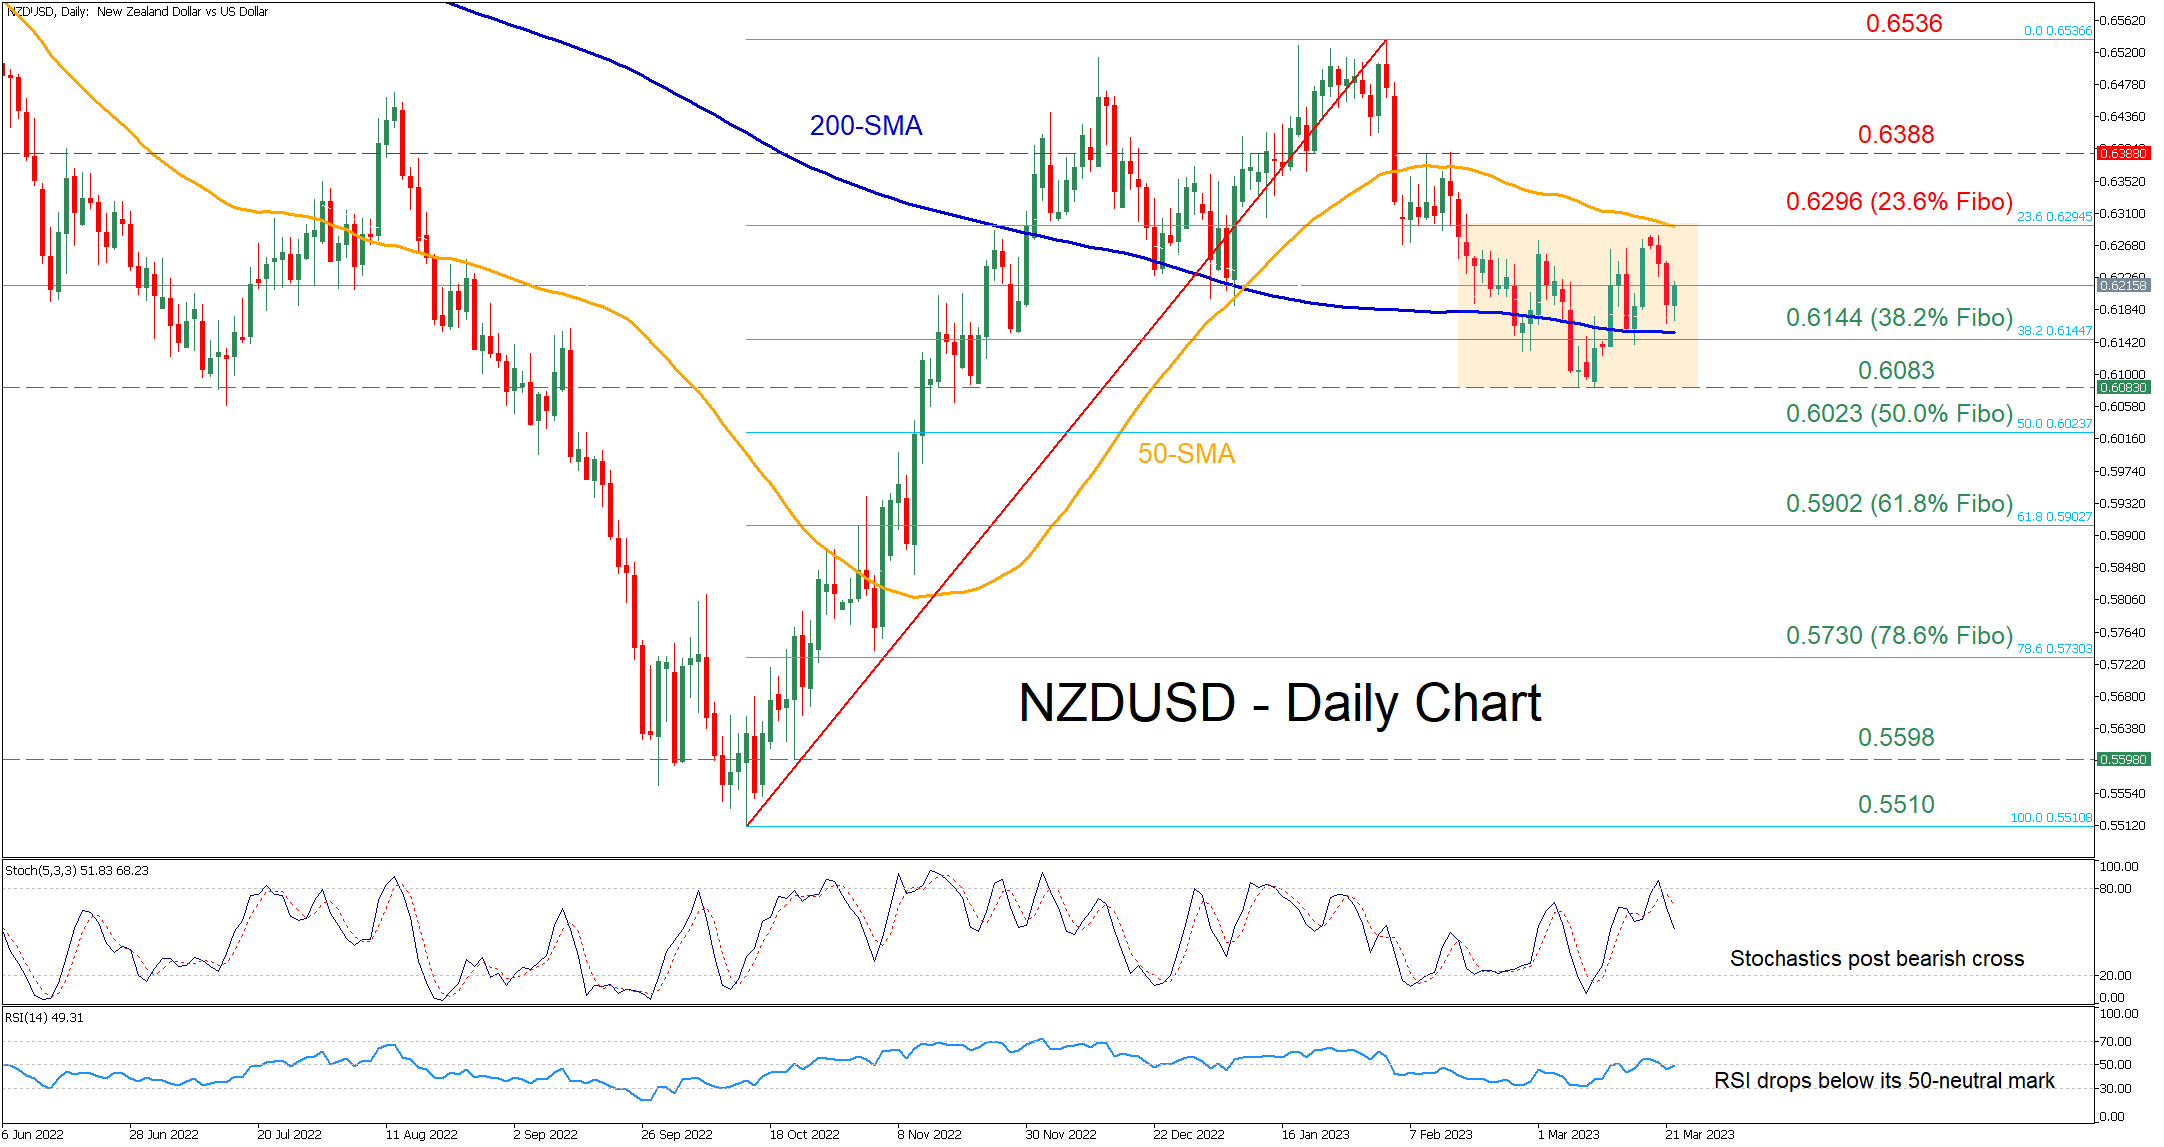
NZDUSD lost ground after peaking at the 2023 high of 0.6536 in early February. Nevertheless, the pair managed to halt its retreat and has been moving sideways within a rectangle pattern for more than a month now.
The momentum indicators currently suggest that near-term risks are tilted to the downside. Specifically, the stochastic oscillator has posted a bearish cross, while the RSI failed to reclaim its 50-neutral mark after breaking below it for the first time in the past seven days.
Should bearish pressures intensify, the price could initially test 0.6144, which is the 38.2% Fibonacci retracement of the 0.5510-0.6536 upleg. If that barricade fails, the 2023 low of 0.6083 might act as the next line of defense. Failing to stop there, the pair could face the 50.0% Fibo of 0.6023.
Alternatively, should buyers re-emerge and push the price higher, immediate resistance could be met at the 23.6% Fibo of 0.6296, which overlaps with the 50-day simple moving average (SMA). Escaping the rangebound pattern, the pair might ascend towards the February resistance of 0.6388. A violation of that territory could set the stage for the 2023 high of 0.6536.
Overall, NZDUSD seems to be in a consolidation phase, waiting for developments that could provide fresh directional impetus. Therefore, a break above or below this sideways pattern is likely to be followed by a significant move in the same direction.
Recovery Rally Pauses ahead of Fed
Equity markets are treading water this morning ahead of the Fed rate decision and following a decent rebound a day earlier.
It very much feels like we're just taking one day at a time at the minute. Every day that passes without drama is one closer to the point at which we can put the mini-banking crisis behind us. But it's still early days and investors are all too aware of that which is why we're seeing a tentative recovery at this point.
This period of calm will no doubt be welcomed by the Fed and allow for it to continue hiking by 25 basis points without much controversy. The question is whether it will adopt a similar position to its counterpart in Europe and refrain from commenting directly on future moves or sending any strong signals.
Unfortunately, it can't entirely avoid offering a view on the outlook as it releases new economic projections including the dot plot, displaying policymakers' views on where rates will go. It could caveat this with a statement that those forecasts were made on the basis of data collected prior to the turmoil of the last couple of weeks but still, it may prove too hard a topic to dodge. Perhaps the caveat will instead be that forecasts are based on the assumption of risks being contained but even that isn't clear cut.
Either way, that is what markets will be monitoring closely, as opposed to the rate hike itself. While 50 basis points were once up for discussion, it would be a big shock if the Fed reverted back to larger rate hikes now considering everything that's happened this past couple of weeks.
A crushing blow for the BoE
Whatever flexibility the Bank of England may have thought it would have tomorrow was wiped out by this morning's inflation data and once more, the topic of conversation has shifted to whether 25 basis points will be enough. The UK CPI report for February showed prices rising by 10.4%, reversing the trend of declines we'd seen in recent months, while the core CPI number also reversed higher to 6.2%.
Considering both were expected to decline, a large increase has come as a nasty shock. And while it could prove to be a blip, there really isn't anything positive we can take away from this release. And certainly, nothing that would justify a pause tomorrow from the MPC, even against the backdrop of financial stability concerns and the knock-on effects of aggressive rate hikes. Inflation is still expected to fall considerably over the course of the year but we need to see much more evidence of that than we've had so far.
Stalled recovery
Oil prices are slipping again today after recovering strongly from the lows over the last couple of days. There's still a lot of lost ground to make up which may highlight the apprehension behind the recovery as well as the potential longer-term consequences for the economy.
Time will tell how significant an impact that will have but the fact that we're already seeing profit-taking isn't a great signal. That said, we're also seeing the recovery in stock markets stalling ahead of the Fed decision so perhaps this is having a similar impact on crude as we await their assessment of the situation.
Pause ahead of the Fed
We're also seeing a pause in the gold correction ahead of the Fed later in the day. It's gone from a rare foray above $2,000 to pulling back almost 4% while remaining well above its pre-banking crisis lows. A hawkish Fed could see it extend the decline, with $1,900 being the next big test below, followed by $1,860.
GBP/USD Pair Consolidating Near 1.2220
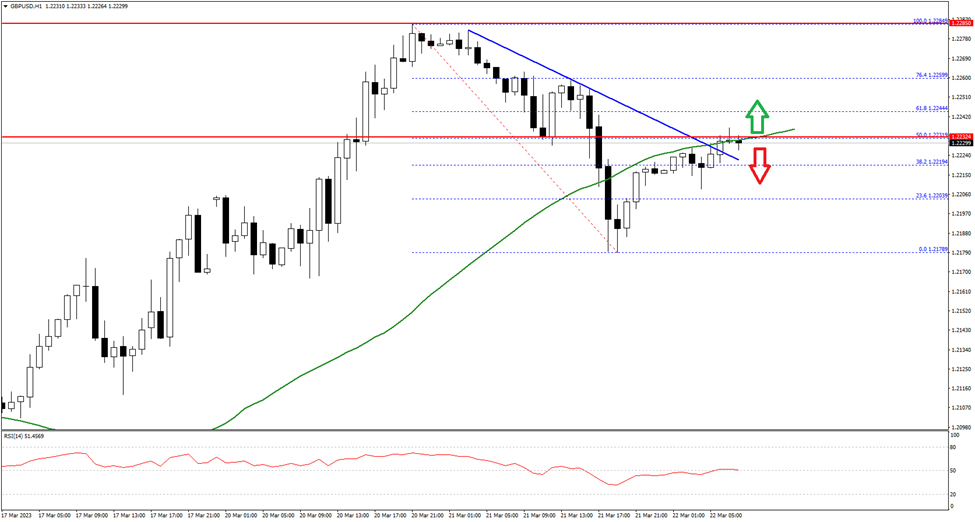
The British Pound started a fresh increase from the 1.2180 zone against the US Dollar. The GBP/USD pair gained pace for a move above the 1.2220 level.
The pair even cleared a major bearish trend line with resistance near 1.2220 on the hourly chart. It is now consolidating near the 1.2220 zone the 50 hourly simple moving average. An immediate resistance is near the 1.2230 level.
The first major resistance is near the 1.2245 level. If there is a clear upside break above the 1.2245 resistance, the pair could rise steadily towards the 1.2280 level in the near term. The next major resistance sits near the 1.2320 level.
On the downside, the first major support is near 1.2200 on FXOpen. The main support is forming near the 1.2180 level. A break below the 1.2180 support could push the pair towards the 1.2140 support.
GBP/JPY Daily Outlook
Daily Pivots: (S1) 159.55; (P) 160.65; (R1) 162.32; More...
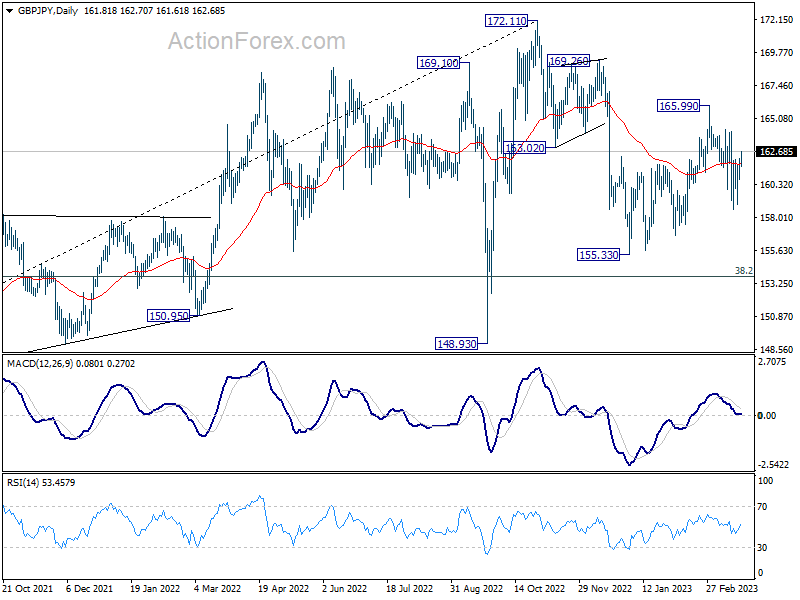
Intraday bias in GBP/JPY remains neutral for the moment. Current development suggests that fall from 165.99 is a falling leg of the whole decline from 172.11. Deeper decline is expected as long as 164.12 resistance holds. Break of 158.54 will target a retest on 155.33 low. However, break of 164.12 resistance will bring stronger rise back to 165.99 resistance.
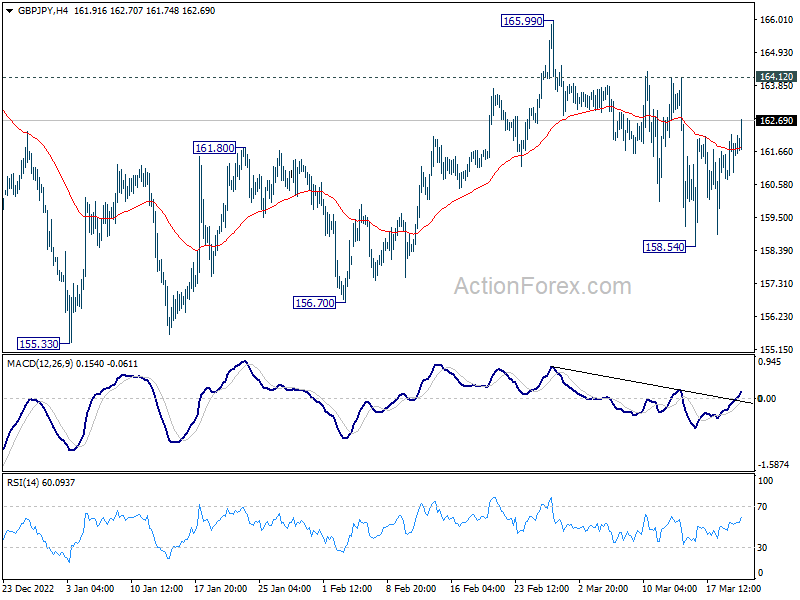
In the bigger picture, as long as 38.2% retracement of 123.94 (2020 low) to 172.11 (2022 high) at 153.70 holds, medium term bullishness is retained. That is, larger up trend from 123.94 (2020 low) is still in progress. Break of 172.11 high to resume such up trend is expected at a later stage.
EUR/JPY Daily Outlook
Daily Pivots: (S1) 141.12; (P) 141.95; (R1) 143.49; More....
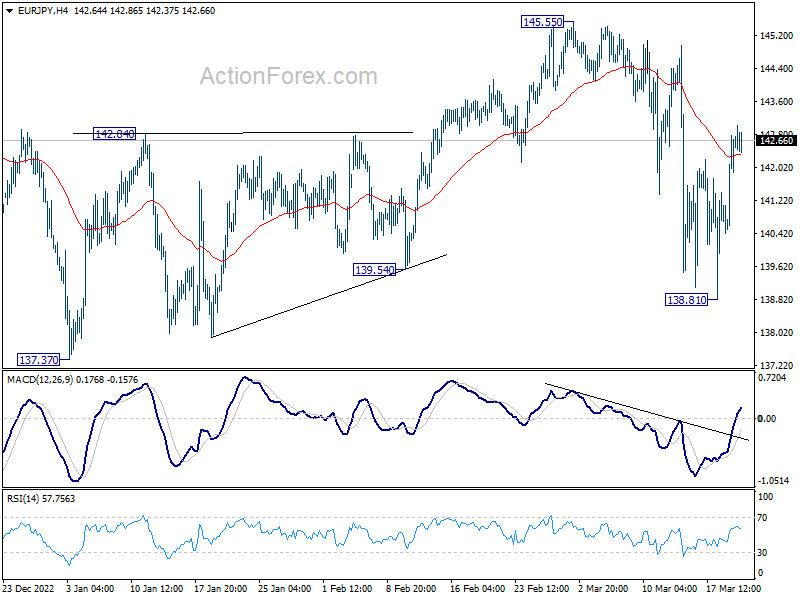
EUR/JPY's rebound from 138.81 extended higher and the break of 4 hour 55 EMA (now at 142.33) mixes up the near term outlook. Intraday bias stays neutral first. On the downside, break of 138.81 will resume the fall from 145.55 to retest 137.37 low. However, break of 145.55 will resume the rebound from 137.37 low instead.
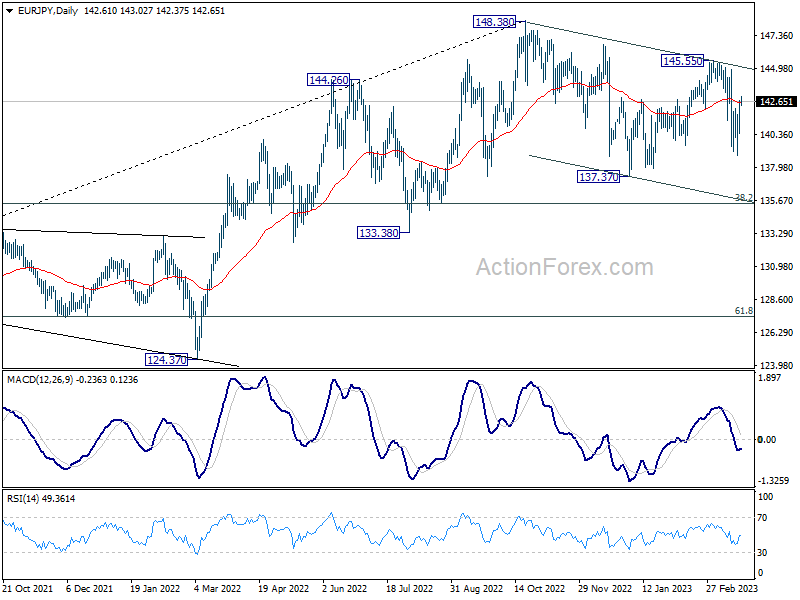
In the bigger picture, as long as 55 week EMA (now at 139.54) holds, larger up trend from 114.42 (2020 low) is still in progress for 149.76 long term resistance. However, firm break of 55 week EMA will bring deeper fall to 38.2% retracement of 114.42 to 148.38 at 135.40. Sustained break there will raise the chance of trend reversal, and target 61.8% retracement at 127.39.
EUR/GBP Daily Outlook
Daily Pivots: (S1) 0.8751; (P) 0.8795; (R1) 0.8860; More...
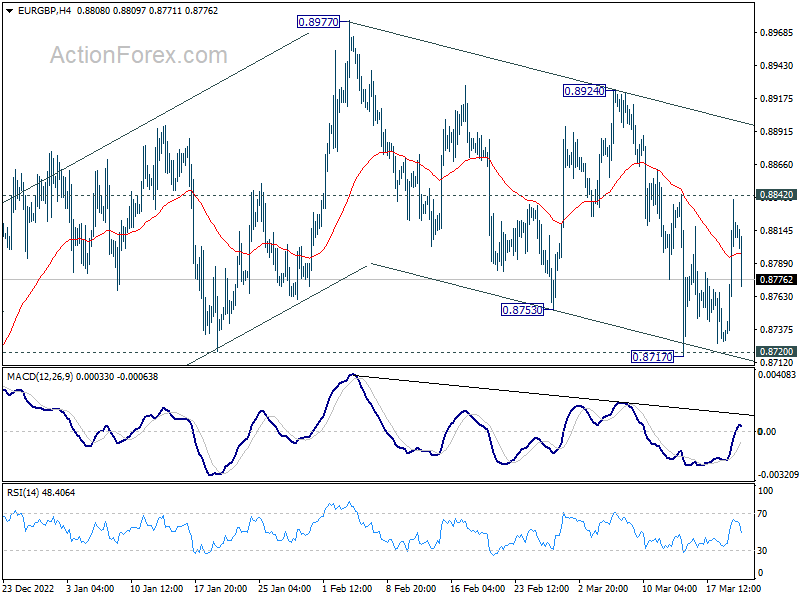
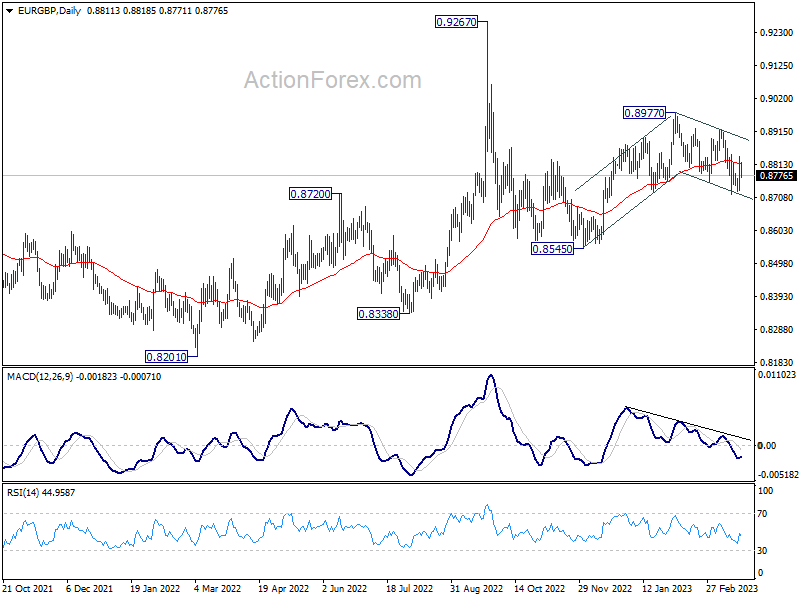
Intraday bias in EUR/GBP remains neutral for the moment. On the upside, break of 0.8842 resistance will argue that corrective fall from 0.8977 has completed, after touching 0.8720 support. Further rise should be seen back to 0.8924 resistance and above. However, sustained break of 0.8720 will bring deeper decline back to 0.8545 instead.
In the bigger picture, outlook is rather mixed for now, except that price actions from 0.9267 (2022 high) are part of the long term range pattern from 0.9499 (2020 high). With 0.8720 support intact, rise from 0.8545 is in favor to continue through 0.8977. However, firm break of 0.8720 will argue that such rebound has completed, and open up deeper fall through this support level.
EUR/AUD Daily Outlook
Daily Pivots: (S1) 1.5994; (P) 1.6095; (R1) 1.6246; More...
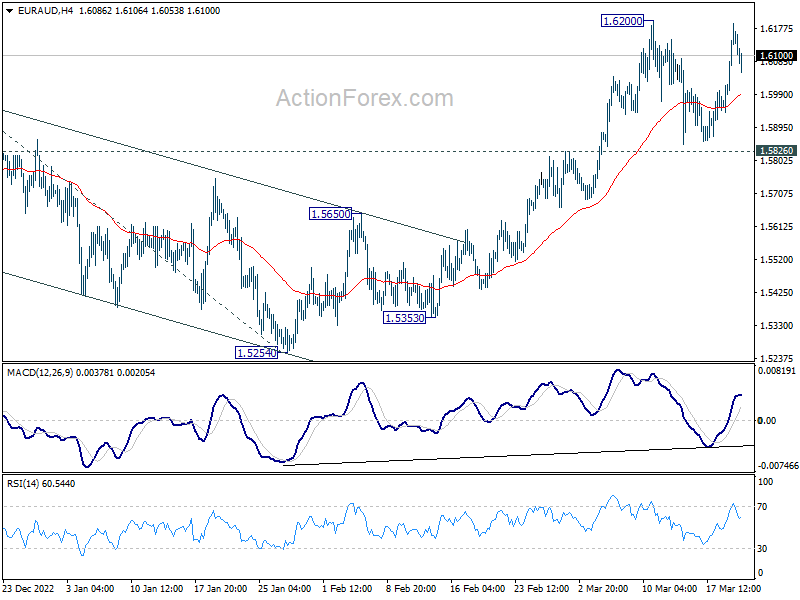
EUR/AUD failed to break through 1.6200 resistance and retreated. Intraday bias remains neutral first. Near term outlook stays stays bullish with 1.5826 resistance turned support intact. On the upside, break of 1.6200 will resume the larger rise from 1.4281 to 61.8% projection of 1.4281 to 1.5976 from 1.5254 at 1.6302 next. However, firm break of 1.5826 will confirm short term topping, and bring deeper fall to 55 day EMA (now at 1.5725).
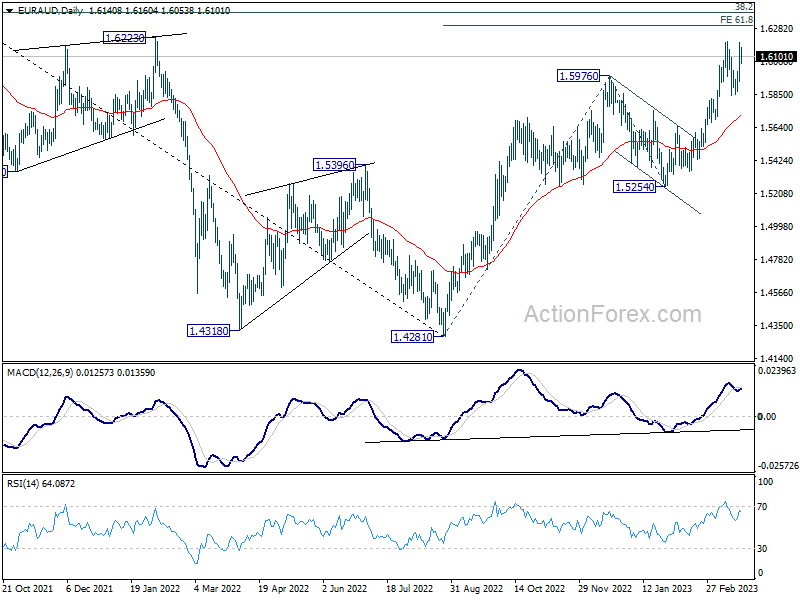
In the bigger picture, the strong support from 55 week EMA (now at 1.5404) is raising the chance of bullish trend reversal. Focus is now on 1.6434 cluster resistance (38.2% retracement of 1.9799 to 1.4281 at 1.6389). Sustained break there should confirm that whole down trend from 1.9799 (2020 high) has completed. Further rally should then be seen to 61.8% retracement at 1.7691. However, rejection by this cluster resistance will make medium term outlook neutral at best.
EUR/CHF Daily Outlook
Daily Pivots: (S1) 0.9914; (P) 0.9946; (R1) 0.9966; More...
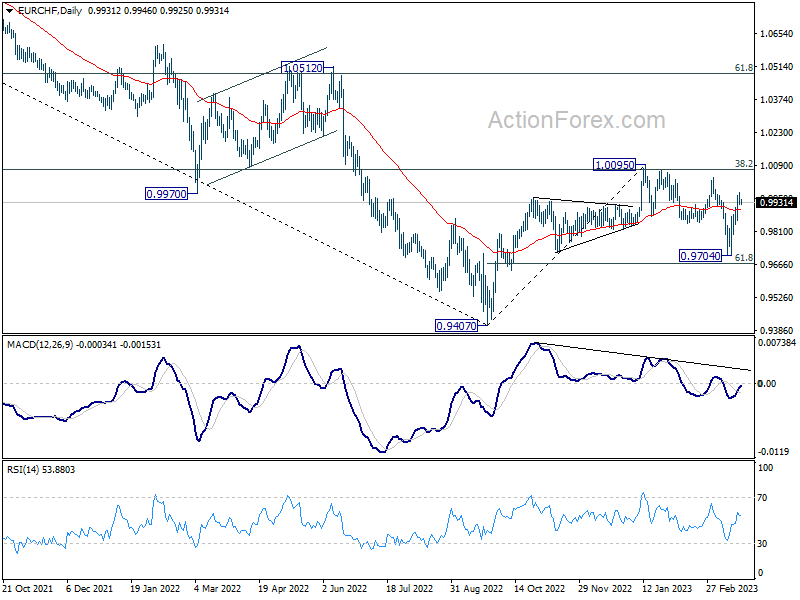
A temporary top was formed at 0.9976 in EUR/CHF with current retreat. Intraday bias is turned neutral first. Outlook is unchanged that corrective decline from 1.0095 should have completed at 0.9704. Further rally is in favor as long as 0.9856 minor support holds. Above 0.9976 will target 1.0004 and then 1.0095. However, firm break of 0.9856 will dampen this bullish view and turn bias back to the downside for 0.9704 support instead.
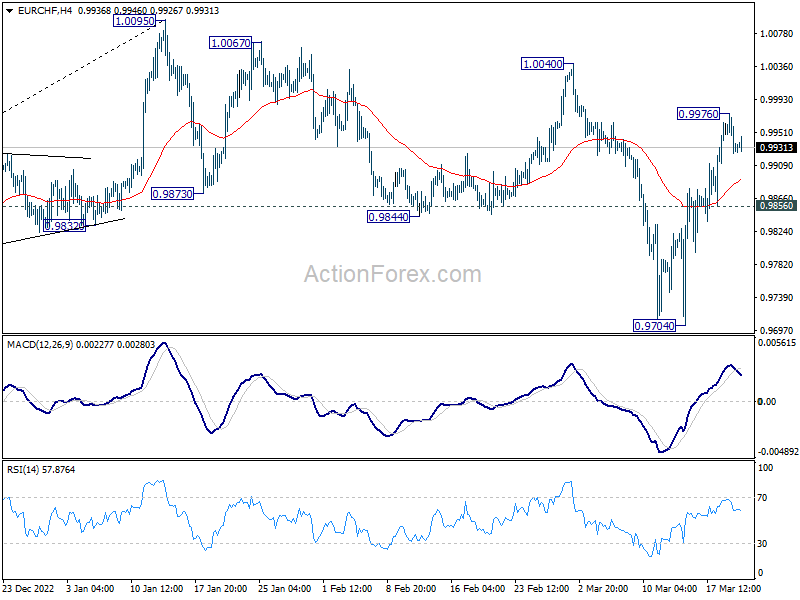
In the bigger picture, prior rejection by 55 week EMA (now at 1.0011) and 38.2% retracement of 1.1149 to 0.9407 at 1.0072 suggests that medium term outlook is staying bearish. That is, down trend from 1.2004 is not completed yet and is in favor to resume through 0.9407 at a later stage. However, decisive break of 1.0095 resistance will raise the chance of bullish trend reversal. Rise from 0.9407 should then target 1.0505 cluster resistance (2020 low at 1.0505, 61.8% retracement of 1.1149 to 0.9407 at 1.1484).
USD/CAD Daily Outlook
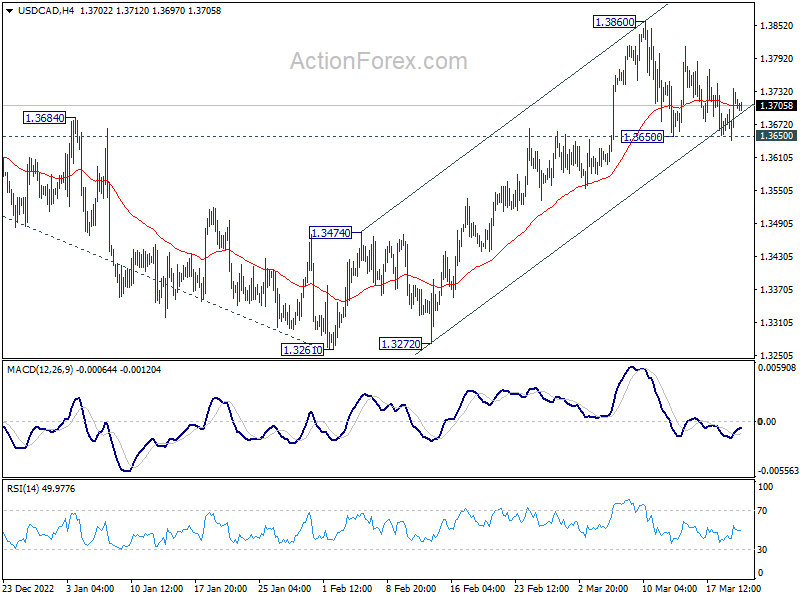
Daily Pivots: (S1) 1.3659; (P) 1.3698; (R1) 1.3752; More....
Intraday bias in USD/CAD stays neutral and outlook is unchanged. Further rally is expected with 1.3650 support intact. On the upside, break of 1.3860 will resume the rally from 1.3261 to retest 1.3976 high. However, firm break of 1.3650 will mix up the near term outlook and bring deeper pullback to 55 day EMA (now at 1.3572) first.
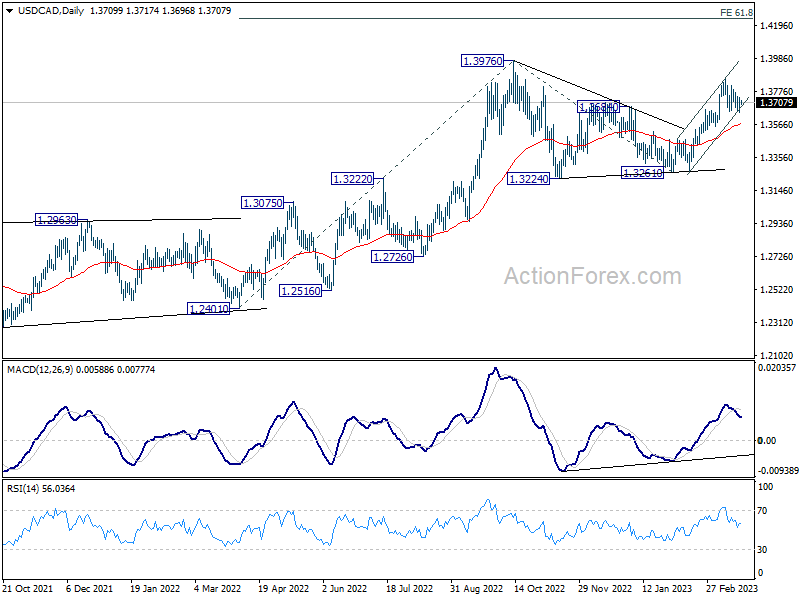
In the bigger picture, the up trend from 1.2005 (2021 low) is still in progress. Break of 1.3976 will confirm resumption and target 61.8% projection of 1.2401 to 1.3976 from 1.3261 at 1.4234. Firm break there will pave the way to long term resistance zone at 1.4667/89 (2016, 2020 highs). On the downside, break of 1.3261 support is needed to confirm medium term topping. Otherwise, outlook will remain bullish even in case of deep pull back.
AUD/USD Daily Report
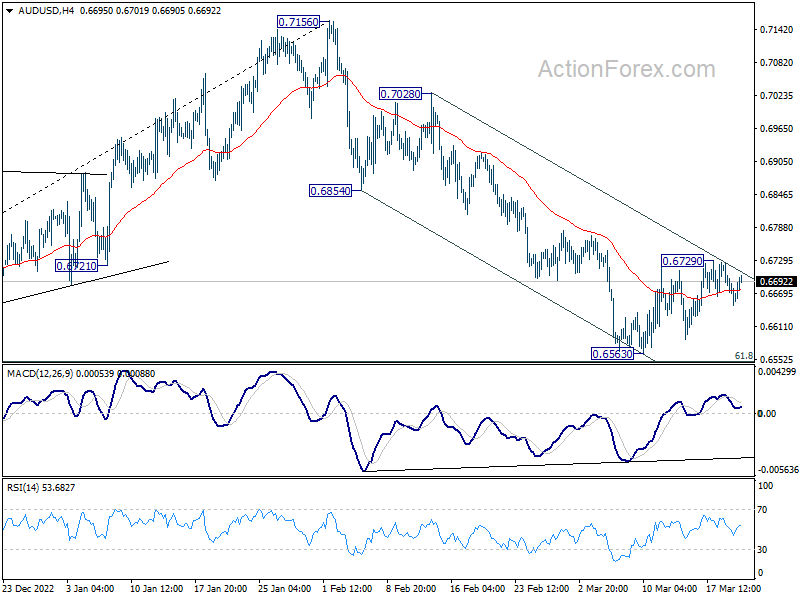
Daily Pivots: (S1) 0.6638; (P) 0.6682; (R1) 0.6715; More...
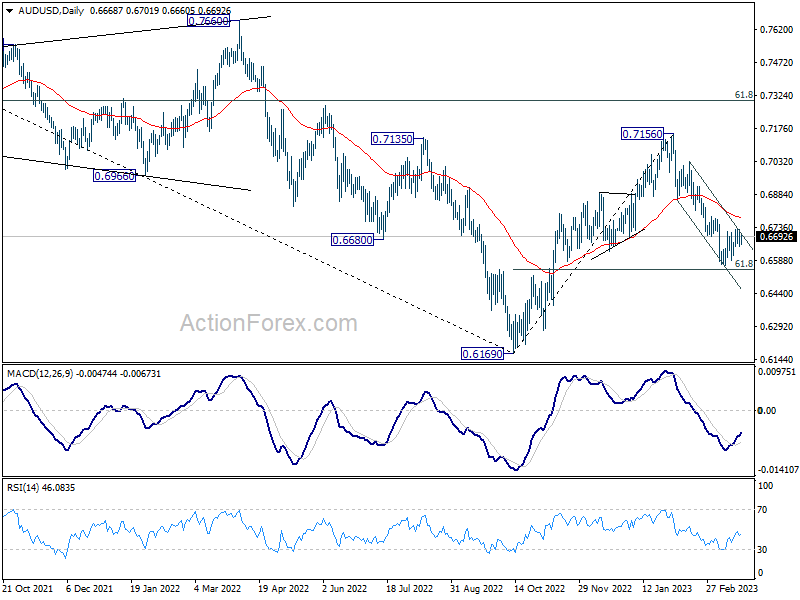
Range trading continues in AUD/USD and intraday bias stays neutral. On the upside, another rise through 0.6729 should confirm short term bottoming at 0.6563, just ahead of 0.6546 fibonacci level. Intraday bias will be back on the upside for 55 day EMA (now at 0.6774). Sustained break there will pave the way back to retest 0.7156 high. On the downside, however, sustained break of 0.6546 will carry larger bearish implication and target 0.6169 low.
In the bigger picture, rise from 0.6169 (2022 low) has completed at 0.7156, after rejection by 55 month EMA (now at 0.7158). Deeper decline would then be see back to 61.8% retracement of 0.6169 to 0.7156 at 0.6546, even as a corrective fall. Sustained break there will raise the chance of long term down trend resumption through 0.6169 low.