Sample Category Title
Fed Expectations Back a 25bp Hike in the Wake of CPI Data
Global banks, including the US regional banks, rebounded sharply on Tuesday.
As such, the past days’ banking stress has been rapidly contained after the US government put in place the necessary measures to restore confidence.
The return of confidence in the banking sector sent the US bond prices lower, and the yields higher. But the big jump in US yields was the countercoup of a historic slump and didn’t prevent the S&P500 from recording a 1.65% advance on Tuesday. Nasdaq 100 rallied 2.30%.
A collision between a Russian jet and a US drone over the Black Sea – denied by Russia, and the US inflation report came to tame a part of the joy over the banking relief.
US futures hint at a flat open.
US inflation cements 25bp hike expectations
The US inflation data came in line with expectations on a yearly basis. The headline inflation fell from 6.4% to 6% as expected, and core inflation eased from 5.6% to 5.5%, as expected.
Yet, the uptick in core inflation on a monthly basis to 0.5% - a five-month high, and the stickiness of services inflation above the 7% mark, revived the Federal Reserve (Fed) hawks on fear that we may no longer see inflation trend lower in the coming months, if the Fed stopped tightening now and here.
Discomfort regarding the US inflation data, combined with the gently waning stress in banks, brought the expectation of a 25bp hike back on the table.
Note that, if we hadn’t had the SVB debacle, that expectation would’ve easily been stuck around 50bp. And this is something that we could see reflected in the Fed’s March dot plot.
Today, investors will keep an eye on US PPI data and the Empire Manufacturing index.
ECB will likely stick to 50bp hike
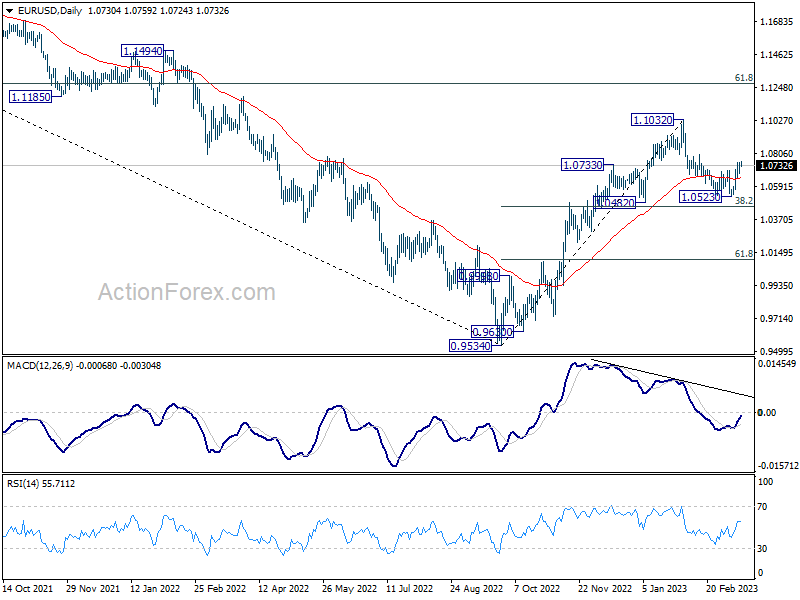
The EURUSD is drilling above its 50-DMA, 1.0730, in the run up to Thursday’s European Central Bank (ECB) meeting.
Many wonder whether the ECB will soften its tone in the wake of tensions across bank stocks over the past week.
But the chances are that the ECB will maintain its plan to raise the rates by 50bp at tomorrow’s policy meeting, and the divergence between a more dovish Fed due to the US banking stress, and a confidently hawkish ECB could help the euro recover against the greenback, and bring the 1.10 target back in sight.
Budget day
In the UK, the Chancellor of Exchequer will make a budget statement to the MPs in the House of Commons today.
At today’s statement, there will likely be no tax cuts despite a terrible cost-of-living crisis, however the government will likely keep the £2500 per year limit on energy bills for three more months, instead of letting them run to £3000 from April.
The latter would be good news for inflation as inflation in Britain is worse than in Europe or in the US. Goldman Sachs predicts that if the government kept the limit at £2500, inflation in Britain would fall to 1.8% in the Q4, which is below the Bank of England’s (BoE) 2% target.
On the investment side, Jeremy Hunt will likely announce measures to boost investment in the UK, including generous tax incentives to attract businesses back to the UK to make sure that growth in Britain catches up its European peers, now that Sunak’s government seemed to have eased a part of the Brexit headache that prevented investors from full heartedly invest in the UK.
What’s important for investors today is how the UK will boost growth, how it will finance it, and how the bond markets will react to the budget statement. There will probably not be an unexpected reaction, or a meltdown as was the case in September with Liz Truss’ budget disaster. The confidence in Sunak’s government is strong and the actual government’s sense of budget discipline should ensure a smooth budget day.
On the currency front, Cable jumped above the 50-DMA as a result of a broadly weaker US dollar on the US banking stress, but a correction in the dollar’s value will likely keep the topside limited at 1.22 and encourage a correction toward the 100-DMA, which stands a couple of pips below the 1.2050 mark.
Easing Fears
Market movers today
From the US, we get producer prices and retail sales for February. Like the CPI, the PPI is expected to show declining headline inflation but still too high core inflation at the producer level. Consensus is for a small decline in retail sales after the big 1.7% m/m increase in January, but keep in mind that the data is prone to large revisions.
Swedish y/y inflation for February should decline a little from the high January levels, but we still call for 8.6% for CPIF excluding energy which would be 0.6 percentage points above the Riksbank's forecast and hence supporting the widely held expectation of a 50bp hike in April. That said, even a low outcome is unlikely to change that expectation.
The 60 second overview
In particular rates markets reversed a portion of Monday's rally yesterday as markets see the US banking crisis as more contained than the initial assessment. The front end led the sell-off across the curve. The 2y Schatz rose 20bp yesterday, reversing around half of Monday's rally, while 10y German Bunds rose 15bp to 2.42%. ECB peak policy rate expectations now stand at 3.67%, which compares to a low of 3.10% on Monday. The Fed's equivalent rose to almost 5% yesterday.
The US February CPI continued to illustrate persistent underlying inflation pressures. Core CPI came out above expectations at 0.45% m/m (forecast 0.4%) driven by core services, and while the shelter component explained part of the uptick, broader core services ex. housing and healthcare inflation accelerated to 0.8% m/m (from 0.65%). Similarly, Atlanta Fed's sticky CPI picked up to 6.8% on annualized m/m basis (5-month high), which remains clearly too fast for the Fed. Energy and core goods CPI came out below expectations, but as the labour market remains tight, services remain the key focus for monetary policy. The Fed faces a challenging decision next week balancing price and financial stability risks, but with risk markets stabilizing for now, short-term inflation expectations recovering and underlying price pressures still elevated, we stick to our call for two more 25bp Fed hikes in March and May.
We argue that we expect ECB to largely look through the recent events from a decision point of view arguing it is primarily a US isolated case, but we see a dovish 50bp rate hike due to communication and the uncertain outlook being chosen. Contrary to our anticipation last week, we do not think Lagarde will give firm guidance for a May hike but emphasise data dependence and a meeting by meeting approach. This leaves markets in the driver's seat for financial conditions. We do not see ECB announcing new liquidity lines now, but they will sound ready.
Equities: Global equities ended 1% higher yesterday despite the Asian markets dragging the overall performance down. A staggering turnaround took place during the European cash session, and in our opinion, this had nothing to do with macro data. The turnaround is happening as investors are starting to realize the SVB failure will not lead to a systemic risk. Look at the banks in Europe yesterday, they started out as the worst performer but ended 2.4% high as the third best industry yesterday. In the US, bank performance was much more mixed or selective with First Republic Bank up 27%. Another sign of the improving risk sentiment, cyclicals outperformed defensive, min vol underperformed and VIX came off the highs from Monday. All indices were higher in US with Dow +1.1%, S&P 500 +1.7%, Nasdaq +2.1%, Russell 2000 +1.9%. Most Asian markets are playing catch-up this morning though with Nikkei going against the trend. Futures in Europe and US haven been fluctuating between gains and losses this morning.
FI: The German ASW spreads tightened 5bp in both the Bobl and Bund, while tightening 9bp in the Schatz ASW yesterday. German ASW are still elevated compared to last week - and further tightening is expected although the pace in light of increased volatility is uncertainty.
FX: Yesterday we saw some reversal of Monday's moves, with front-end treasuries underperforming and markets once again re-pricing Fed back to expecting 25bp next week following the inflation data. In FX, however, USD and JPY underperformed while SEK was among the winners, with EUR/SEK sharply lower in line with improving risk sentiment.
Credit: Credit markets saw a rebound on Tuesday following the negative sentiment from the SVB fallout at the start of the week. Itraxx main tightened 5bp to close at 89.6bp, while Itraxx Xover tightened 19.6bp to close at 457bp. Primary markets were once again somewhat muted, with issuers weighing the right moment to step back into the market given the current high uncertainty on the future path of rates and spreads.
Nordic macro
In Sweden, the February inflation outcome is today's clue. We expect both CPIF and CPIF ex energy to decline marginally compared to January, to 9.0 % yoy and 8.6 % yoy, respectively. This is 0.4 percentage points below and 0.6 percentage points above the Riksbank's respective forecasts. The Riksbank is currently focused on the latter. In the parliamentary hearing yesterday, Erik Thedéen again stressed that they are worried about the still rising trend in core inflation, the risk that there has been a problematic shift in price setting behaviour. He did not sound dovish at all even in light of recent financial market turmoil. Needless to say today's and the next and final sets of inflation data will be key for the April decision. A bit surprisingly, there were no questions or discussion about the SEK at the hearing. We still look for 50bp in April and a final 25bp in June while we also expect that by then core inflation will have moderated for a couple of months.
USD/CAD Daily Outlook
Daily Pivots: (S1) 1.3641; (P) 1.3695; (R1) 1.3739; More....
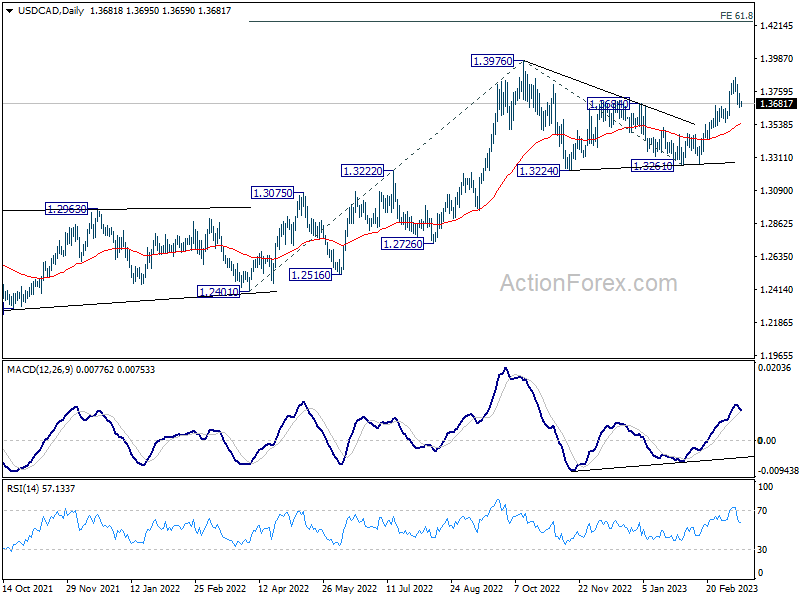
Intraday bias in USD/CAD remains neutral at this point. Further rally is still expected with 1.3664 support intact. On the upside, break of 1.3860 will resume the rally from 1.3261 to retest 1.3976 high. However, firm break of 1.3664 will mix up the near term outlook and bring deeper pullback first.
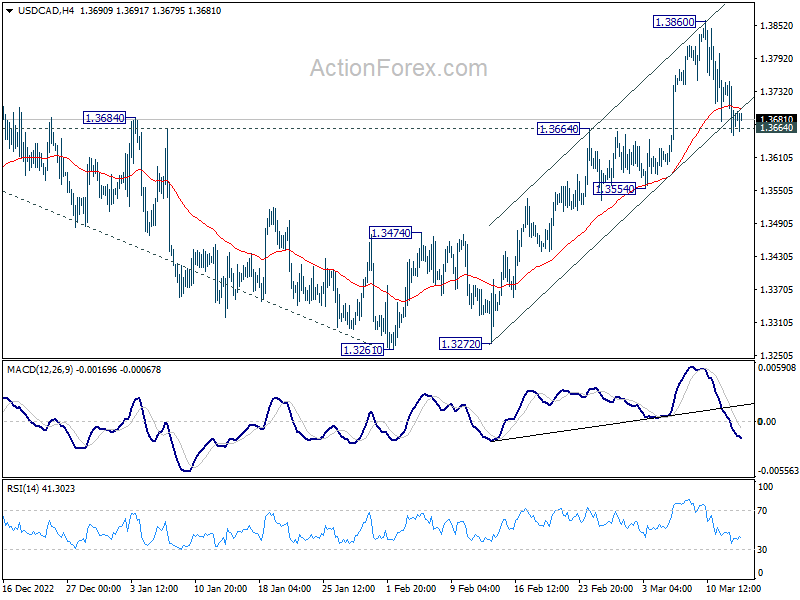
In the bigger picture, the up trend from 1.2005 (2021 low) is still in progress. Break of 1.3976 will confirm resumption and target 61.8% projection of 1.2401 to 1.3976 from 1.3261 at 1.4234. Firm break there will pave the way to long term resistance zone at 1.4667/89 (2016, 2020 highs). On the downside, break of 1.3261 support is needed to confirm medium term topping. Otherwise, outlook will remain bullish even in case of deep pull back.
AUD/USD Daily Report
Daily Pivots: (S1) 0.6645; (P) 0.6670; (R1) 0.6709; More...
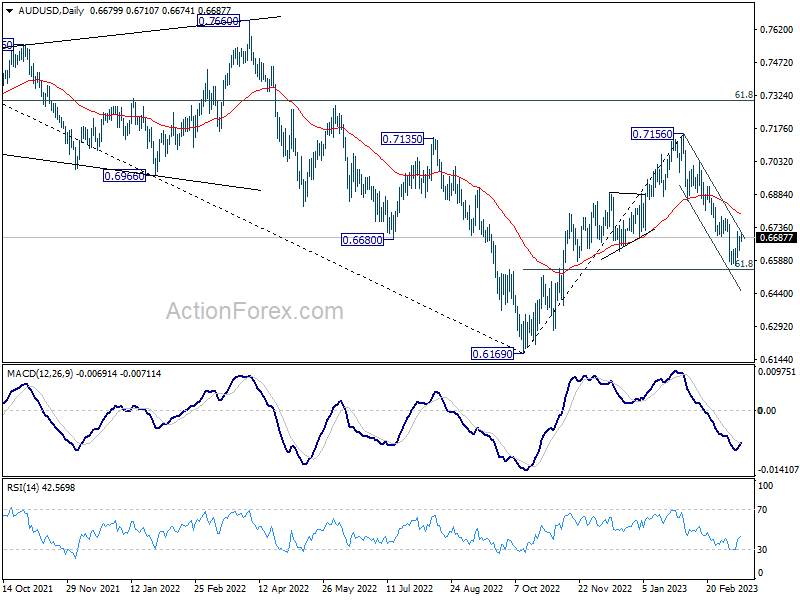
Intraday bias in AUD/USD stays neutral as it's still struggling to break through 0.6694 resistance decisively. Focus is on whether 0.6546 fibonacci level would provide strong support to bring reversal. On the upside,firm break of 0.6694 support turned resistance will indicate short term bottoming, and turn bias back to the upside for rebound to 55 day EMA (now at 0.6795). However, sustained break of 0.6546 will carry larger bearish implication and target 0.6169 low.
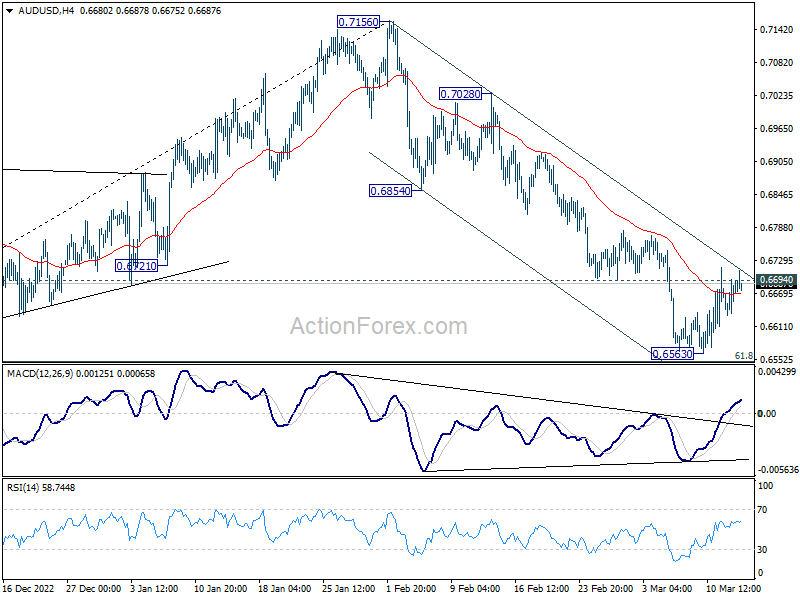
In the bigger picture, rise from 0.6169 (2022 low) has completed at 0.7156, after rejection by 55 month EMA (now at 0.7158). Deeper decline would then be see back to 61.8% retracement of 0.6169 to 0.7156 at 0.6546, even as a corrective fall. Sustained break there will raise the chance of long term down trend resumption through 0.6169 low.
USD/JPY Daily Outlook
Daily Pivots: (S1) 133.20; (P) 134.05; (R1) 135.06; More...
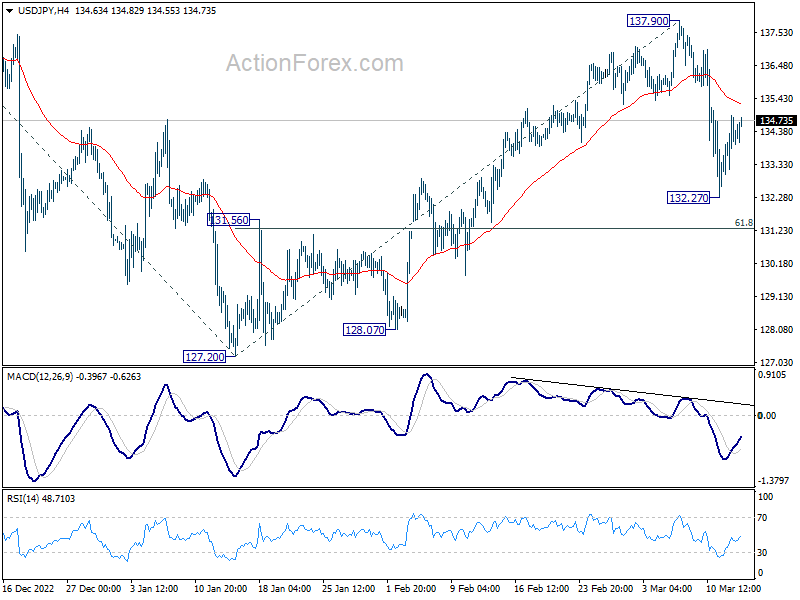
Intraday bias in USD/JPY remains neutral for the moment. Fall from 137.90 could still extend lower and break of 132.27 will target 61.8% retracement of 127.20 to 137.90 at 131.28. Break of 137.90 resistance is needed to confirm resumption of the rally from 127.20, or risk will stay mildly on the downside.
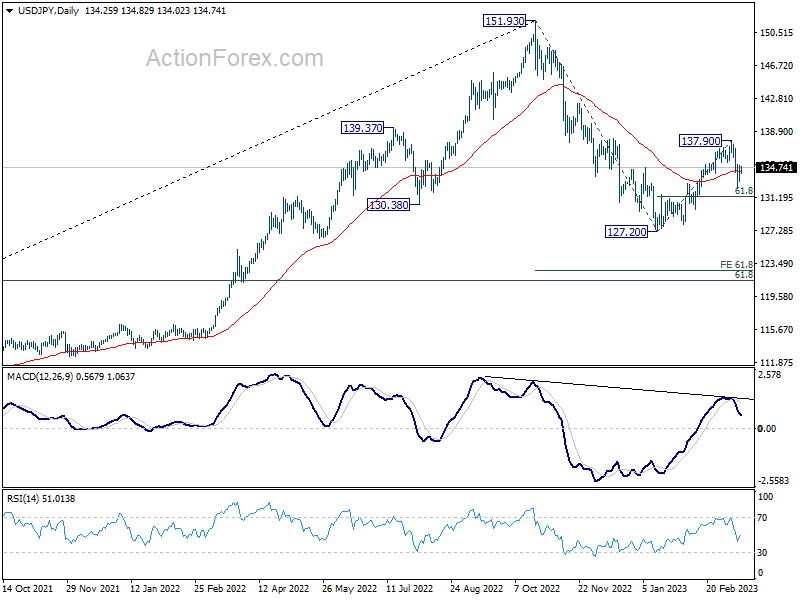
In the bigger picture, rebound from 127.20 should have completed at 137.90 as a corrective move, with strong break of 55 day EMA. The down trend from 151.93 (2022 high) is not over yet. Break of 127.20 will resume this down trend and target 61.8% projection of 151.93 to 127.20 from 137.90 at 122.61. This will now be the favored case as long as 137.90 resistance holds.
USD/CHF Daily Outlook
Daily Pivots: (S1) 0.9104; (P) 0.9134; (R1) 0.9173; More...
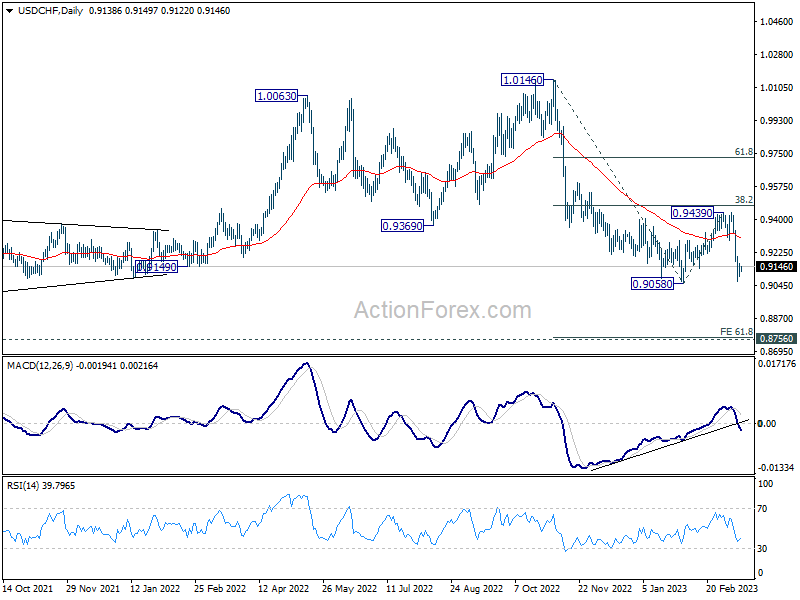
Intraday bias in USD/CHF is turned neutral first with current recovery. Outlook is unchanged that fall from 0.9439 is probably resuming larger decline from 1.1046. Decisive break of 0.9070 will confirm this bearish case and target 61.8% projection of 1.0146 to 0.9058 from 0.9439 at 0.8767. However, break of 0.9219 resistance will turn bias back to the upside, and extend the corrective pattern from 0.9058 with another rising leg.
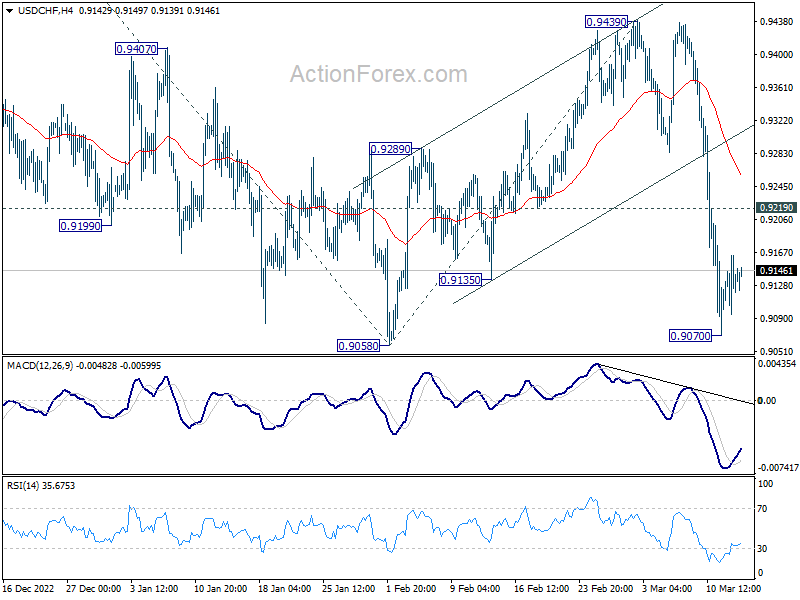
In the bigger picture, fall from 1.1046 (2022 high) is should still be in progress with 38.2% retracement of 1.0146 to 0.9058 at 0.9474 intact. Rejection by 55 week EMA is also a medium term bearish sign. Break of 0.9058 will resume such decline towards 0.8756 support (2021 low). But overall, such fall is still as a leg in the long term range pattern from 1.0342 (2016 high). So, downside should be contained by 0.8756 to bring reversal. For now, this will remain the favored case as long as 0.9439 resistance holds.
GBP/USD Daily Outlook
Daily Pivots: (S1) 1.2130; (P) 1.2166; (R1) 1.2196; More...
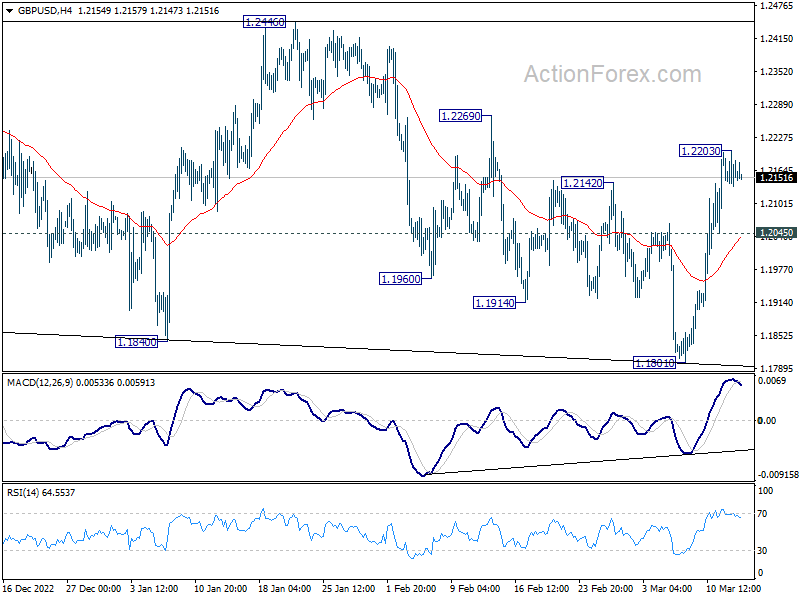
Intraday bias in GBP/USD is turned neutral with 4 hour MACD crossed below signal line. Outlook is unchanged that corrective pattern from 1.2445 should have completed with three waves to 1.1801. Above 1.2203 will resume the rise from 1.1801 to retest 1.2445/6 resistance zone next. On the downside, below 1.2045 minor support dampen the bullish view and turn bias back to the downside instead.
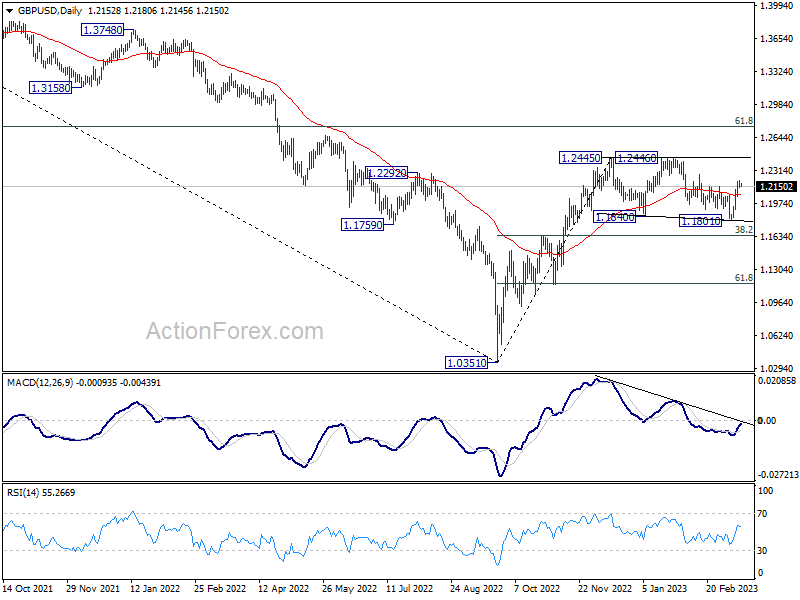
In the bigger picture, price action from 1.2445 are seen as a corrective pattern to rise from 1.0351 medium term bottom (2022 low). Resumption is expected as a later stage and firm break of 1.2446 will target 61.8% retracement of 1.4248 (2021 high) to 1.0351 at 1.2759. This will remain the favored case as long as 38.2% retracement of 1.0351 to 1.2445 at 1.1645 holds.
EUR/USD Daily Outlook
Daily Pivots: (S1) 1.0691; (P) 1.0721; (R1) 1.0762; More...
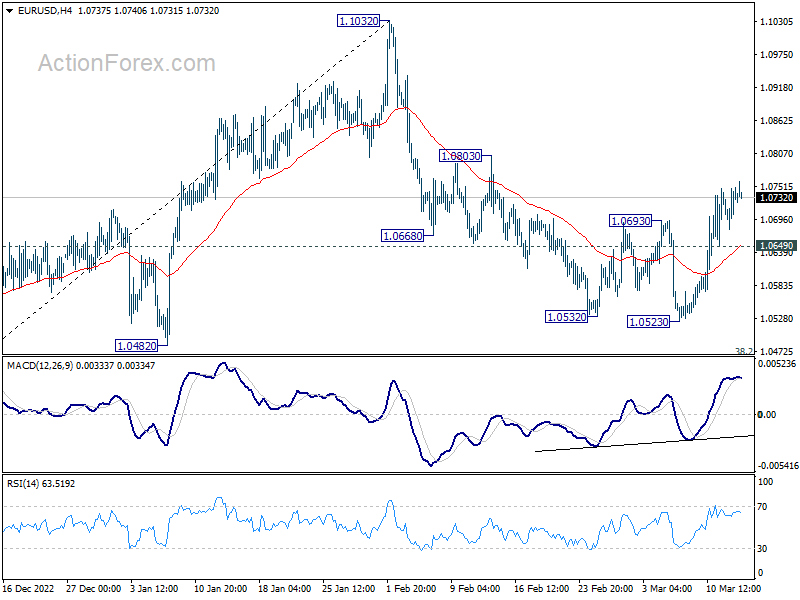
Intraday bias in EUR/USD stays on the upside and outlook is unchanged. Corrective decline from 1.1032 should have completed at 1.5023, ahead of 1.0482 key support. Break of 1.0803 resistance will bring retest of 1.1032 high next. On the downside, below 1.0649 minor support will turn bias back to the downside. In this case, decline from 1.1032 could resume through 1.0523 to keys structural support at 1.0482.
In the bigger picture, as long as 1.0482 support holds, rise from 0.9534 (2022 low) should continue to 61.8% retracement of 1.2348 (2021 high) to 0.9534 at 1.1273. However, sustained break of 1.0482 will bring deeper fall to 61.8% retracement of 0.9534 to 1.1032 at 1.0106, even as a corrective pull back.
Calm Markets Shrug Mixed China Data, Euro Lacks Momentum ahead of ECB
After days of market turbulence, Asian session has been relatively calm today. US stocks recovered overnight with a strong rebound in treasury yields, helping to calm market sentiments. Mixed economic data from China did not seem to have any significant impact on the markets.
With the banking crisis slowly fading into the background, focus is expected to shift back to economic data and central bank policies. The Euro is showing signs of firming up ahead of the ECB rate decision on Thursday, but there seems to be a lack of follow-through momentum. While there is some uncertainty, ECB is still expected to hike rates by 50bps. The key will be on the new economic projections and any guidance on the rate path forward.
Dollar, Yen, and Swiss Franc are currently the weakest currencies for the week, while the Australian dollar, New Zealand dollar, and Sterling are the strongest. However, the recovery in commodity currencies remains weak, so it's hardly a return to a risk-on environment yet.
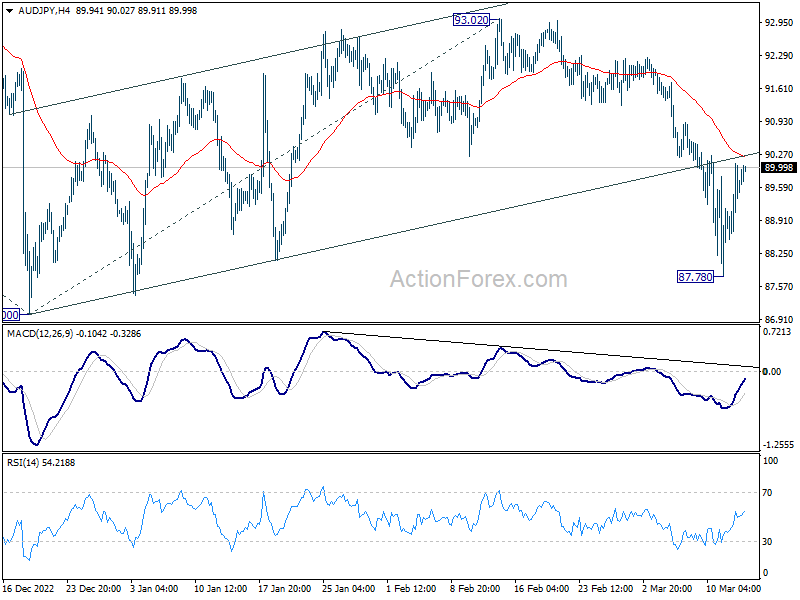
Technically, AUD/JPY recovered ahead of 87.00 support. But outlook is unchanged that corrective rise from 87.00 has completed at 93.02. Another decline to retest 87.00 is expected sooner rather than later. Decisive break there will resume larger decline from 99.32. However, sustained trading above 4 hour 55 EMA will argue that corrective pattern from 87.00 is extending with another rising leg, and stronger rebound could be seen back to 93.02.
In Asia, at the time of writing, Nikkei is down -0.30%. Hong Kong HSI is up 1.26%. China Shanghai SSE is up 0.60%. Singapore Strait Times is up 1.24%. Japan 10-yaer JGB yield is up 0.0466 at 0.330. Overnight, DOW rose 1.06%. S&P 500 rose 1.65%. NASDAQ rose 2.14%. 10-year yield rose 0.123 to 3.638.
China posts mixed economic data in Jan-Feb period
China's economic data for the first two months of 2023 showed mixed results, with industrial production growth falling short of expectations but retail sales and fixed asset investment exceeding them.
According to China's National Bureau of Statistics, industrial production grew by 2.4% yoy, below the forecasted 2.6% yoy. Retail sales, on the other hand, rose by 3.5% yoy, slightly above expectations of 3.4% yoy.
Fixed asset investment also exceeded expectations, growing by 5.5% yoy, compared to the forecasted 4.5% yoy. Infrastructure investment saw a rise of 9.0% yoy. However, property investment showed a decline of -5.7% yoy, indicating a slowdown in the real estate sector.
The NBS released a statement that highlighted the challenges facing China's economy. "The external environment is even more complex, inadequate demand remains prominent and the foundation for economic recovery is not solid yet," the statement said.
The economic data for January and February is combined to smooth out the impact of the Lunar New Year holiday, which falls at different times during the two months in different years.
BoJ minutes: Basic stance to continue with current monetary easing
BoJ has reaffirmed its commitment to continuing with its current monetary easing policy, including yield curve control, to achieve the price stability target, according to the minutes of its meeting in January 17-18.
One member noted that there is "still a long way to go to achieve the price stability target", and thus the Bank should continue with the current monetary easing to firmly support the economy.
To encourage firms' efforts with regard to business transformation until sustained wage increases can be expected, the Bank needs to "curb interest rate rises across the entire yield curve" while paying attention to the functioning of bond markets, according to another member.
Another member added that it was "inappropriate to rush to an exit" from the current monetary policy, as overseas economies were currently heading toward slowdowns.
However, one member recognized that "at some point in the future", it will be necessary to examine and assess the balance between the positive effects and side effects of the current monetary easing policy.
The Bank's "basic stance on its future conduct of monetary policy" is to "continue with the current monetary easing -- including the conduct of yield curve control -- and thereby achieve the price stability target in a sustainable and stable manner accompanied by wage increases," the minutes read.
Looking ahead
Eurozone will release industrial production in European session. Main focuses, however, are on US retail sales and PPI to be released later in the day. US business inventories, Empire State manufacturing index, NAHB housing index, and Canada housing starts will also be released.
EUR/USD Daily Outlook
Daily Pivots: (S1) 1.0691; (P) 1.0721; (R1) 1.0762; More...
Intraday bias in EUR/USD stays on the upside and outlook is unchanged. Corrective decline from 1.1032 should have completed at 1.5023, ahead of 1.0482 key support. Break of 1.0803 resistance will bring retest of 1.1032 high next. On the downside, below 1.0649 minor support will turn bias back to the downside. In this case, decline from 1.1032 could resume through 1.0523 to keys structural support at 1.0482.
In the bigger picture, as long as 1.0482 support holds, rise from 0.9534 (2022 low) should continue to 61.8% retracement of 1.2348 (2021 high) to 0.9534 at 1.1273. However, sustained break of 1.0482 will bring deeper fall to 61.8% retracement of 0.9534 to 1.1032 at 1.0106, even as a corrective pull back.
Economic Indicators Update
| GMT | Ccy | Events | Actual | Forecast | Previous | Revised |
|---|---|---|---|---|---|---|
| 21:45 | NZD | Current Account (NZD) Q4 | -9.46B | -7.65B | -10.21B | -11.40B |
| 23:50 | JPY | BoJ Minutes | ||||
| 02:00 | CNY | Retail Sales Y/Y Feb | 3.50% | 3.40% | -1.80% | |
| 02:00 | CNY | Industrial Production Y/Y Feb | 2.40% | 2.60% | 1.30% | |
| 02:00 | CNY | Fixed Asset Investment YTD Y/Y Feb | 5.50% | 4.50% | 5.10% | |
| 10:00 | EUR | Eurozone Industrial Production M/M Jan | 0.50% | -1.10% | ||
| 12:15 | CAD | Housing Starts Feb | 225K | 215K | ||
| 12:30 | USD | Empire State Manufacturing Index Mar | -7.5 | -5.8 | ||
| 12:30 | USD | Retail Sales M/M Feb | 0.20% | 3.00% | ||
| 12:30 | USD | Retail Sales ex Autos M/M Feb | -0.10% | 2.30% | ||
| 12:30 | USD | PPI M/M Feb | 0.30% | 0.70% | ||
| 12:30 | USD | PPI Y/Y Feb | 5.10% | 6.00% | ||
| 12:30 | USD | PPI Core M/M Feb | 0.40% | 0.50% | ||
| 12:30 | USD | PPI Core Y/Y Feb | 5.00% | 5.40% | ||
| 14:00 | USD | Business Inventories Jan | 0.00% | 0.30% | ||
| 14:00 | USD | NAHB Housing Market Index Mar | 42 | 42 | ||
| 14:30 | USD | Crude Oil Inventories | -0.2M | -1.7M |
Technical Outlook and Review
DXY:
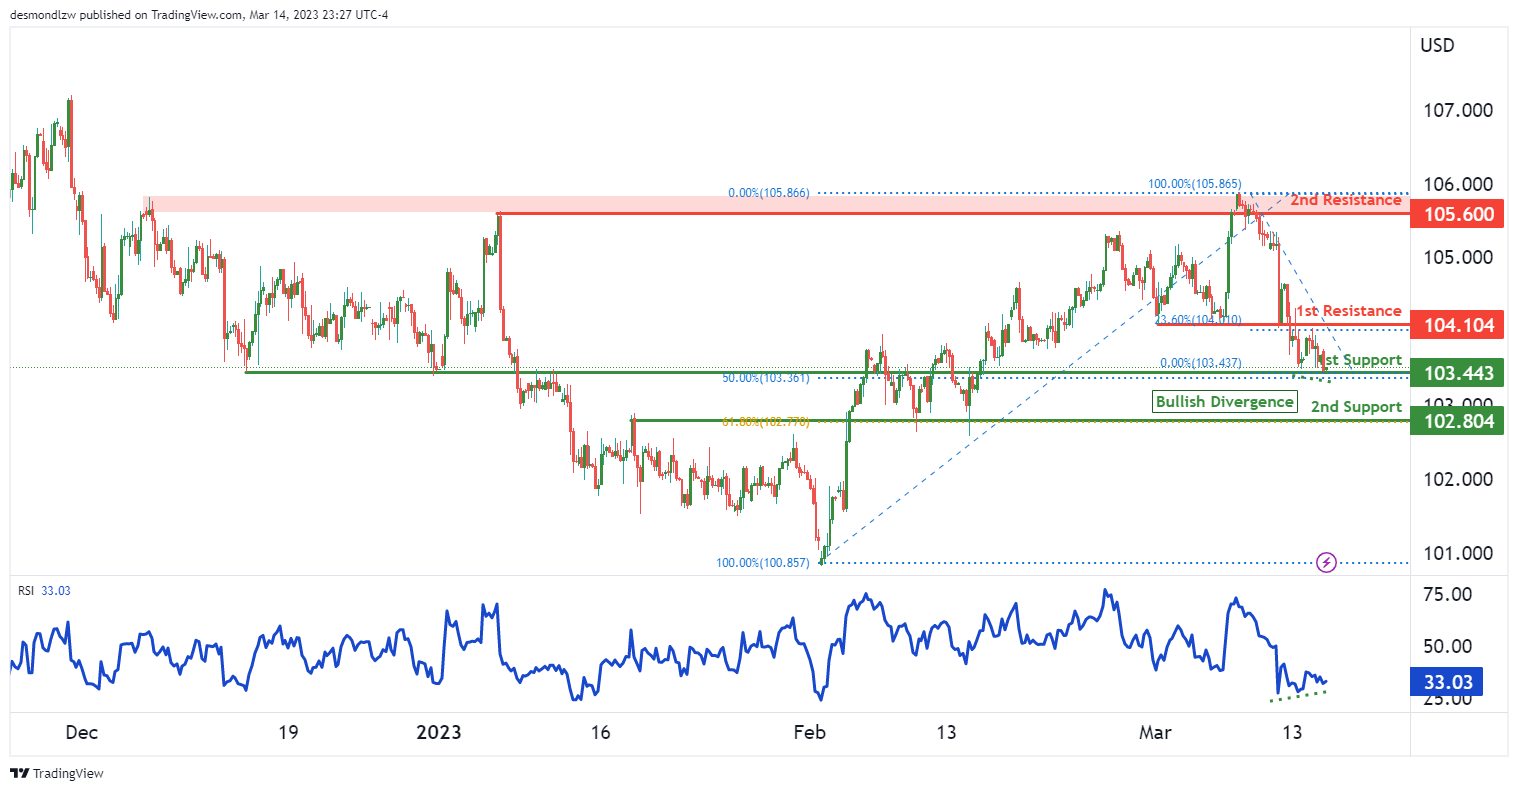
Price is currently lingering near our 1st support level at 103.44, which lines up with the 50% Fibonacci retracement. If the price were to reverse from this level, it could potentially push up to our 1st resistance at 104.10, which lines up with the 23.6% Fibonacci retracement. If the price were to break above our 1st resistance level, it could potentially push up to our 2nd resistance level at 105.60.
Regarding support levels, if the price were to break below our 1st support level, it could drop down to our 2nd support level at 102.80. It’s worth noting that there is a bullish divergence vs the RSI, which suggests a potential reversal from this level to push prices up to our 1st resistance level.
EUR/USD:
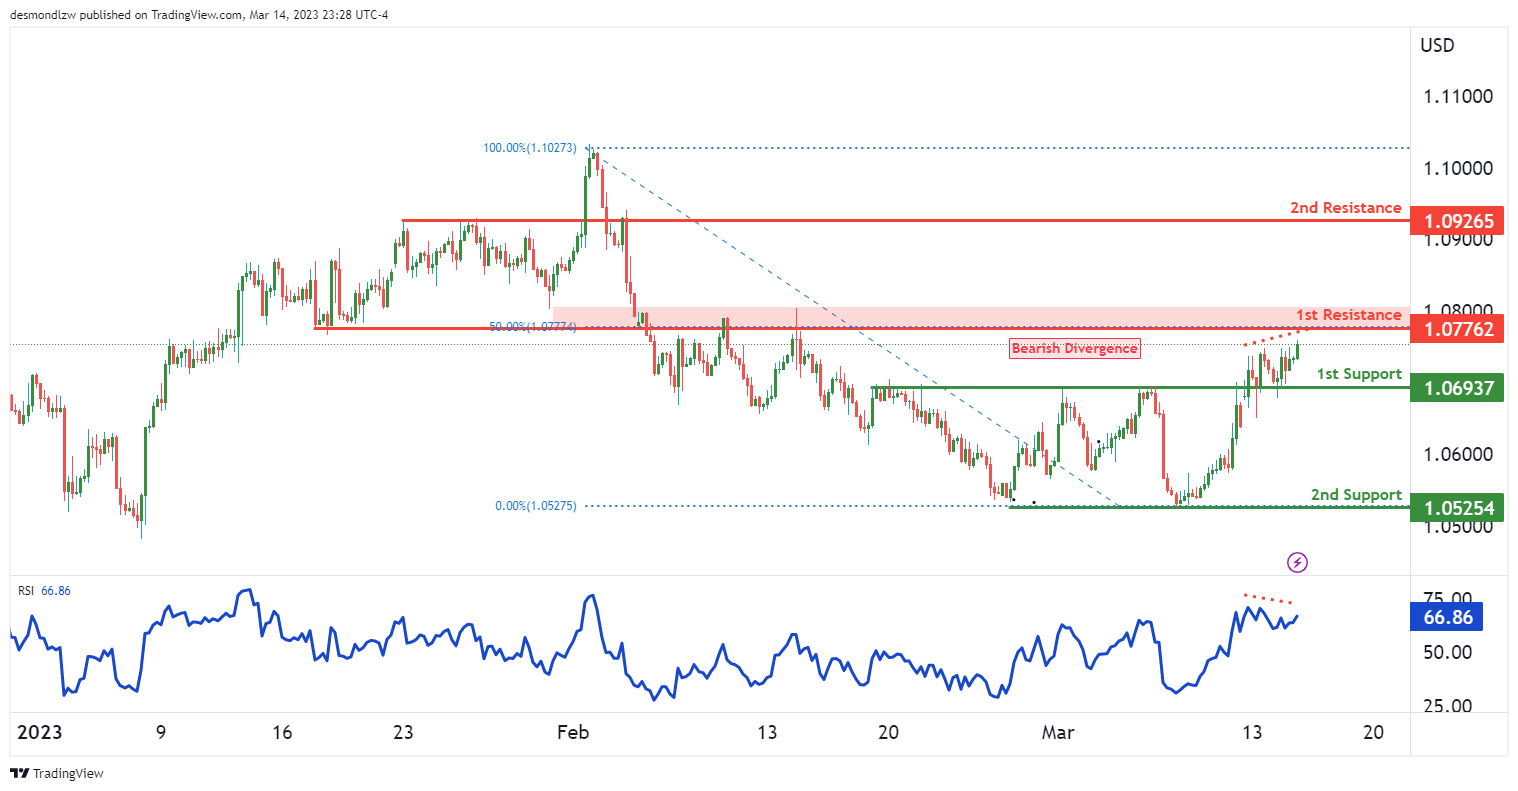
Price is currently approaching our 1st resistance level at 1.0776, which lines up with the 50% Fibonacci retracement. If the price were to break above this level, it could potentially push up to our 2nd resistance level at 1.0926.
However, it’s worth noting that there is a bearish divergence vs the RSI, which suggests a potential reversal. If the price were to reverse from our 1st resistance level, it could drop down to our 1st support level at 1.0693. If the price were to break below our 1st support level, it could potentially drop further down to our 2nd support level at 1.0525.
GBP/USD:
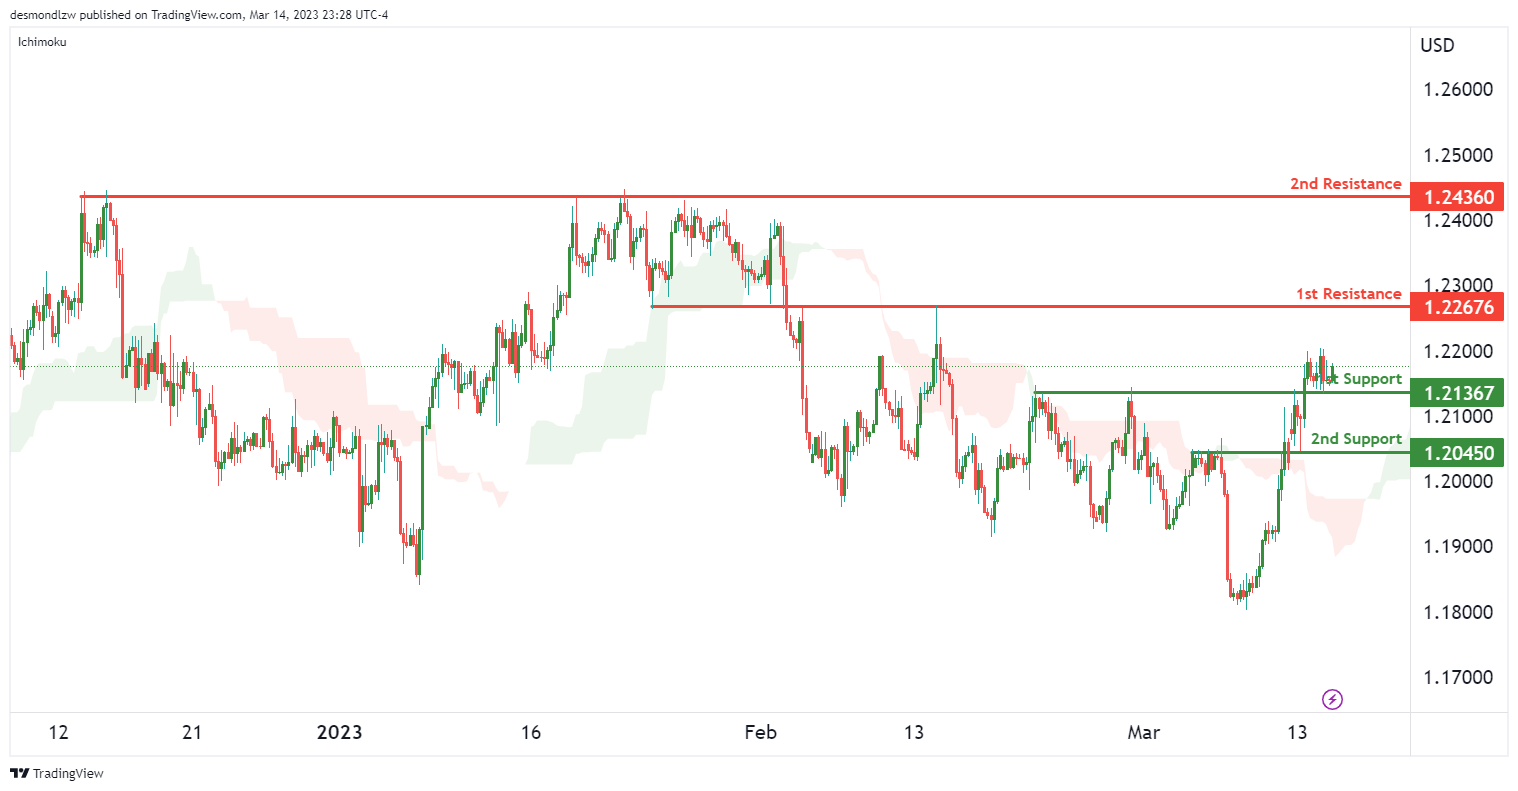
Price has respected our 1st support level at 1.2136, which is an overlap support level. If the price were to reverse from this level, we could potentially see it push up to our 2nd resistance level at 1.2360.
Regarding support levels, if the price were to break below our 1st support level, it could potentially drop down to our 2nd support level at 1.2045, which is another overlap support level.
USD/CHF:
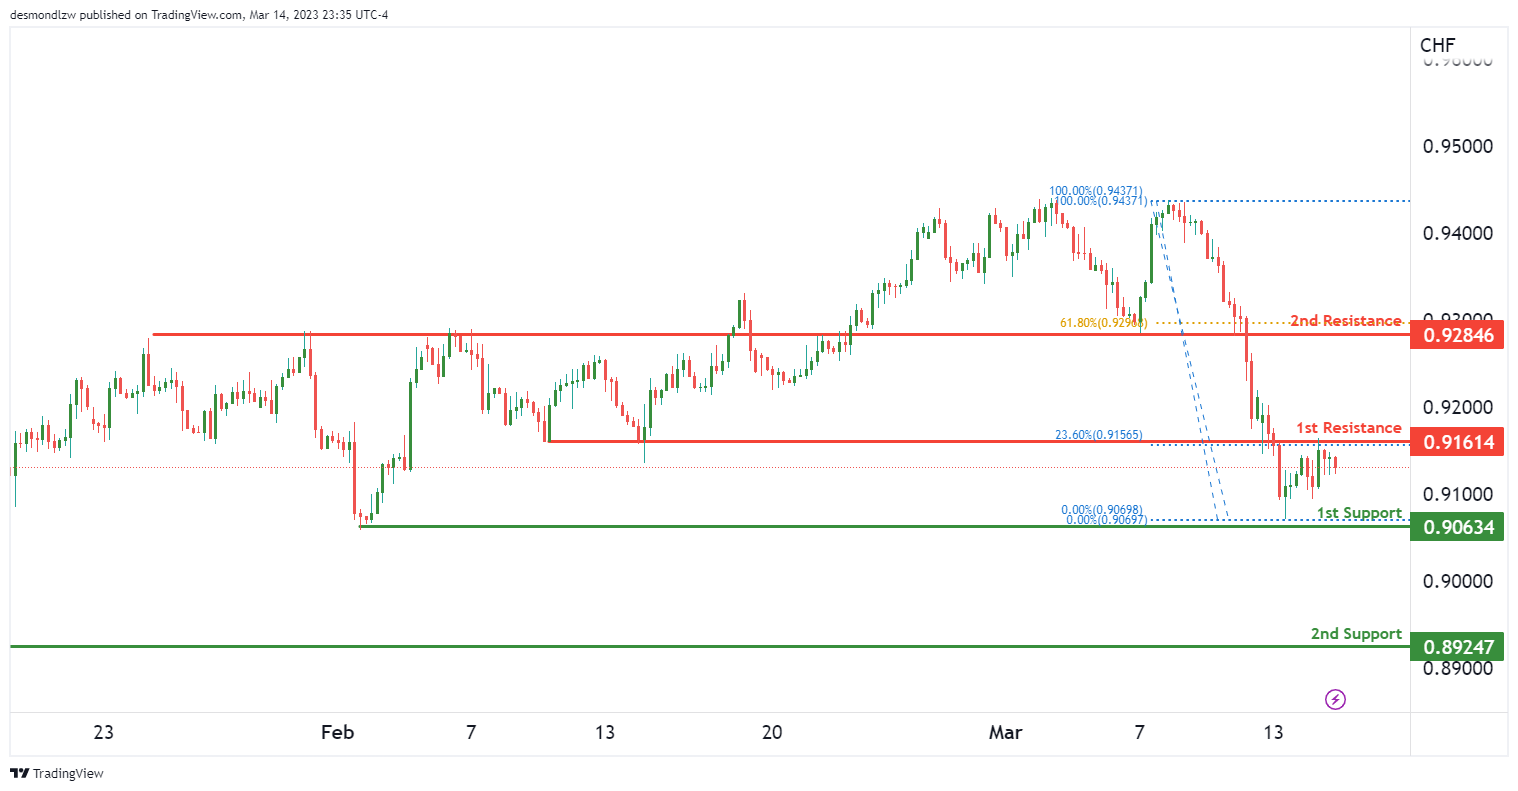
Price has tested our 1st resistance level at 0.9161, which lines up with the 23.6% Fibonacci retracement. If the price were to reverse from this level, we could potentially see it drop down to our 1st support level at 0.9063, and if the price were to break below that, it could potentially drop further down to our 2nd support level at 0.8924.
Regarding resistance levels, if the price were to break above our 1st resistance level, it could potentially push up to our 2nd resistance level at 0.9284, which lines up with the 61.8% Fibonacci retracement and is also an overlap resistance level.
USD/JPY:
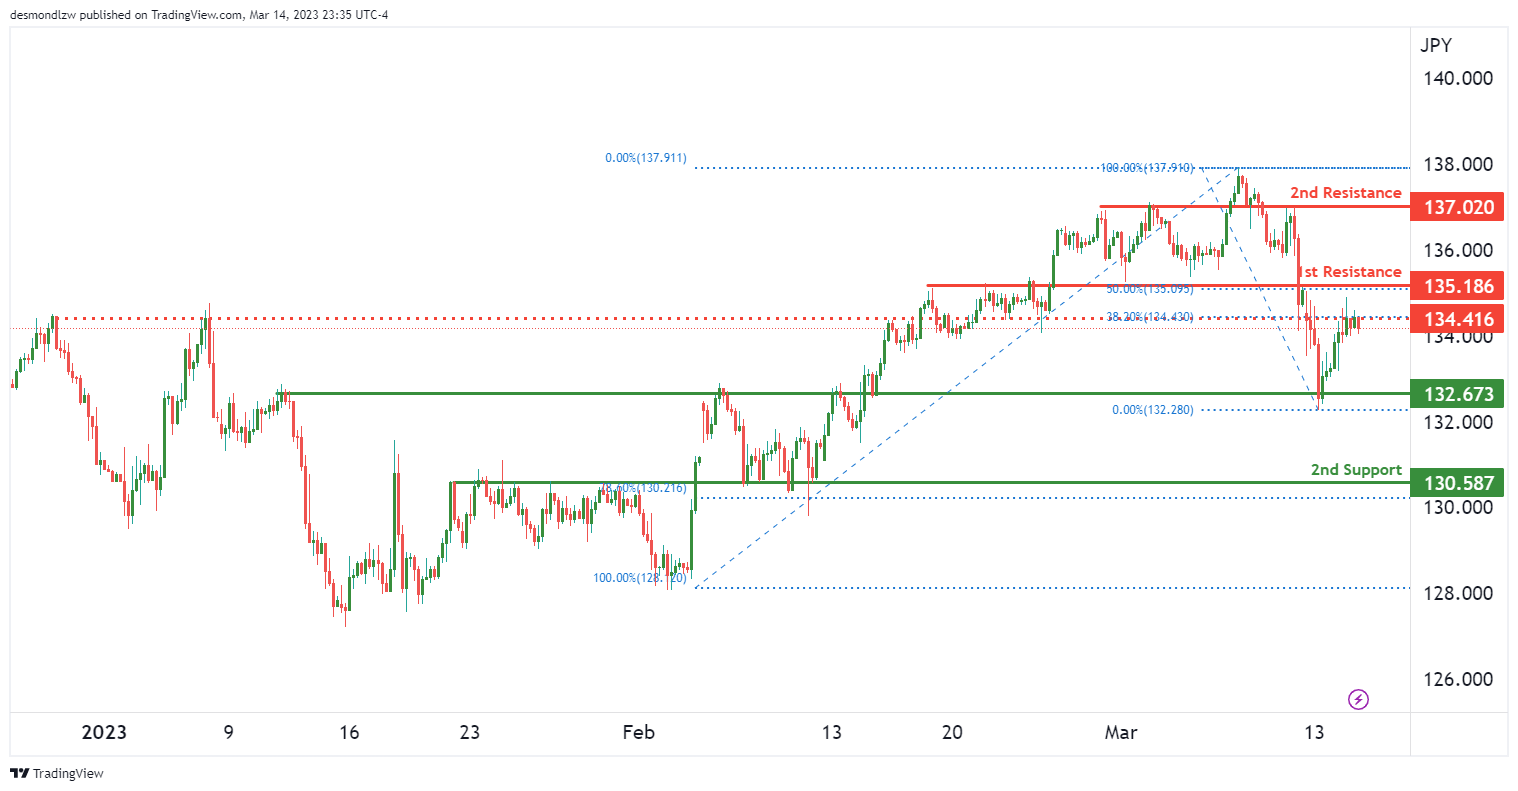
The price has strongly reversed from our 1st support level at 132.67 and is currently testing our intermediate resistance level at 134.41, which lines up with the 38.2% Fibonacci retracement. If the price were to break through this level, it could potentially push up to our 1st resistance level, which lines up with the 50% Fibonacci retracement, and our 2nd resistance level is at 137.02.
Regarding support levels, there’s a 1st support level at 132.67, which is an overlap support level, and the 2nd support level is at 130.58, with a 78.6% Fibonacci retracement and overlap support level
AUD/USD:
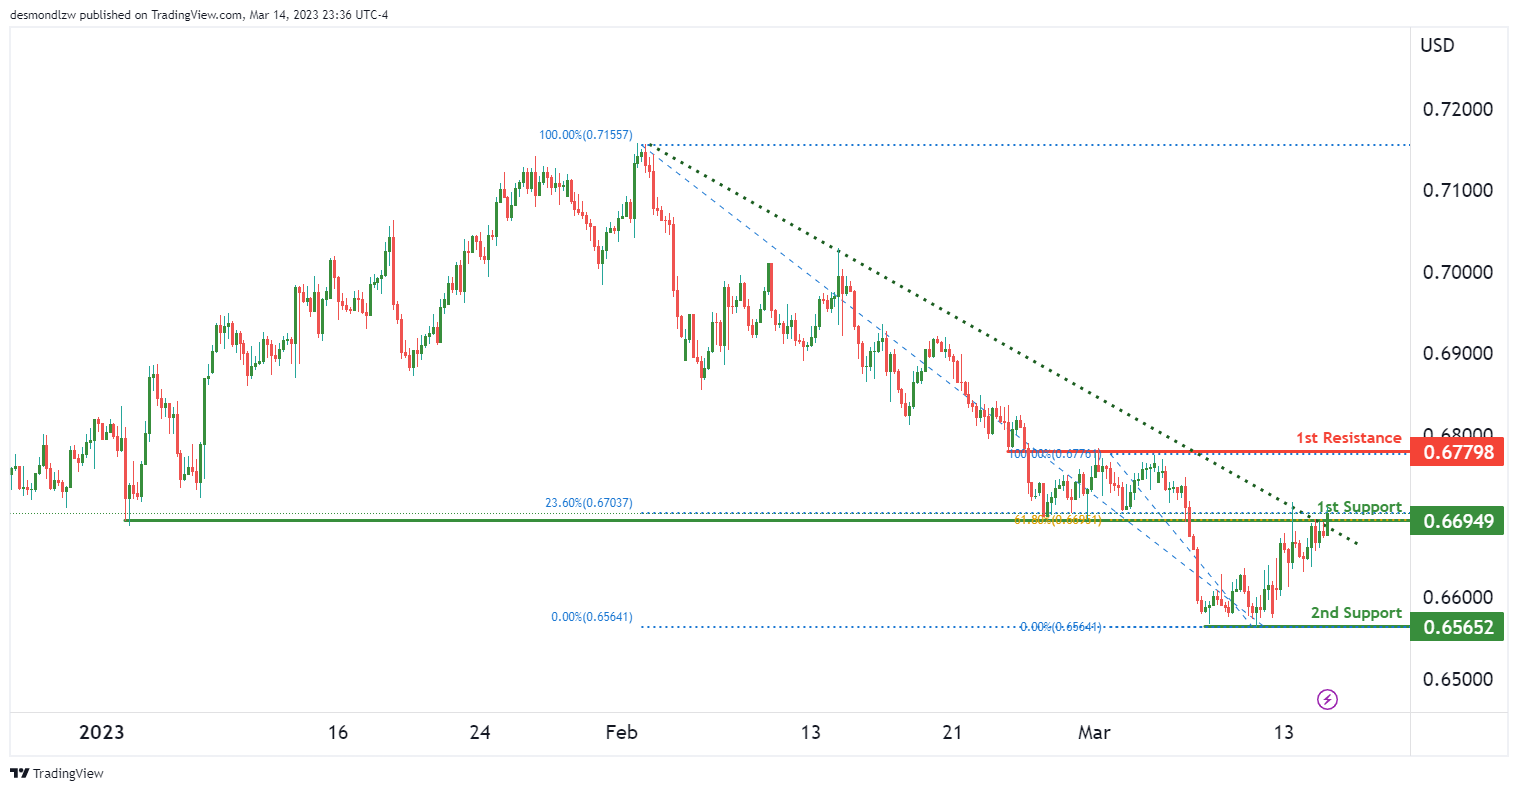
Price is currently in our 1st support area at 0.6694, which lines up with the 61.8% Fibonacci retracement. It’s worth noting that if the price were to break from the descending trendline, it could push up to our 1st resistance at 0.6779.
However, if the price were to reverse from our 1st support, which is an overlap support, it could drop to the 2nd support level at 0.6565.
NZD/USD:
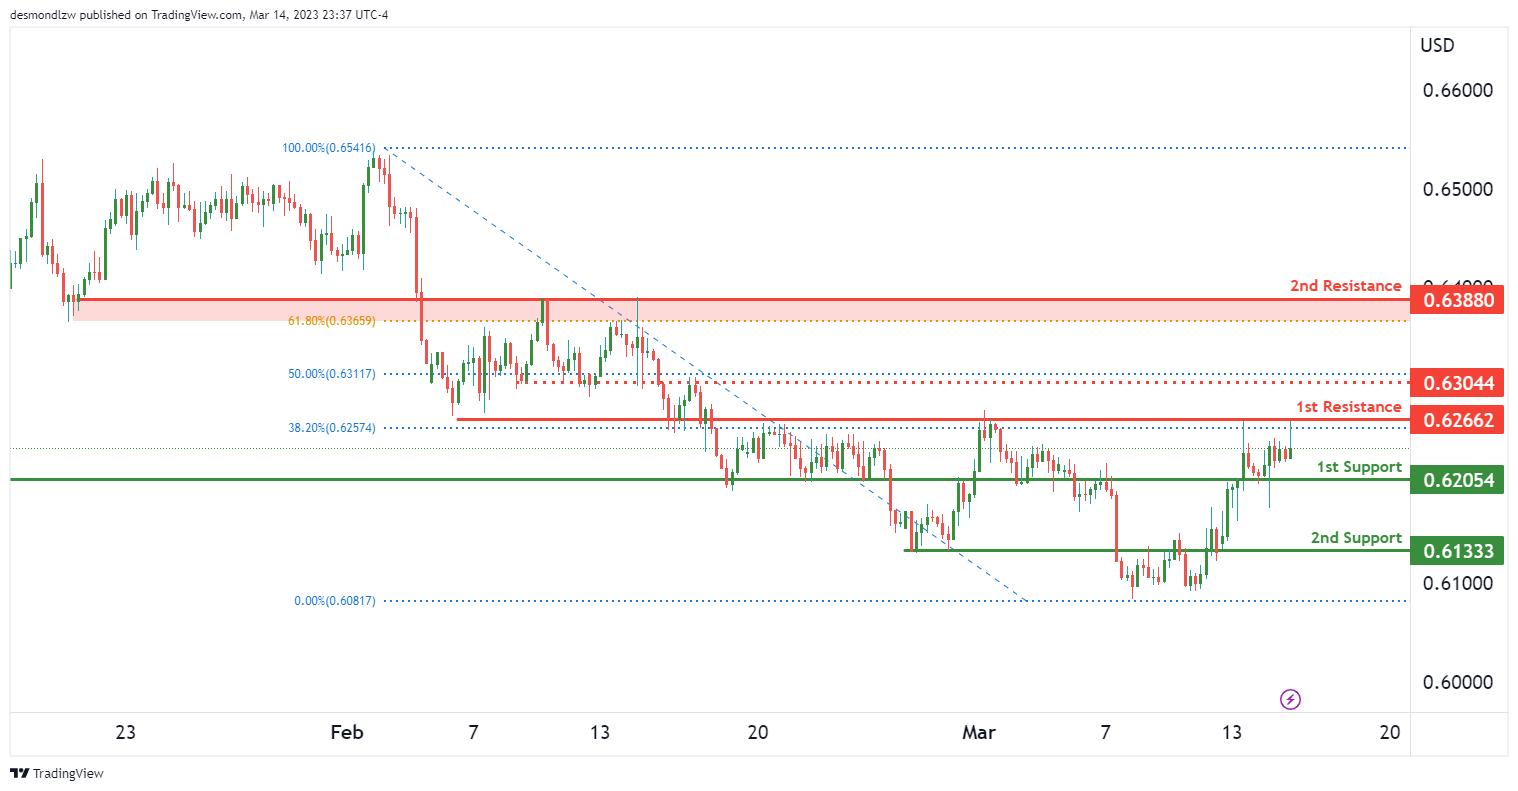
Price has nicely rejected from our 1st resistance at 0.6304, which is an overlapping resistance that lines up with the 38.2% Fibonacci retracement. If the price were to break this level, it could push up to our 2nd resistance at 0.6388, which is an overlapping resistance.
As for support levels, our 1st support is at 0.6205, which is an overlap support, and our 2nd support is at 0.6133, which is another overlap support.
USD/CAD:
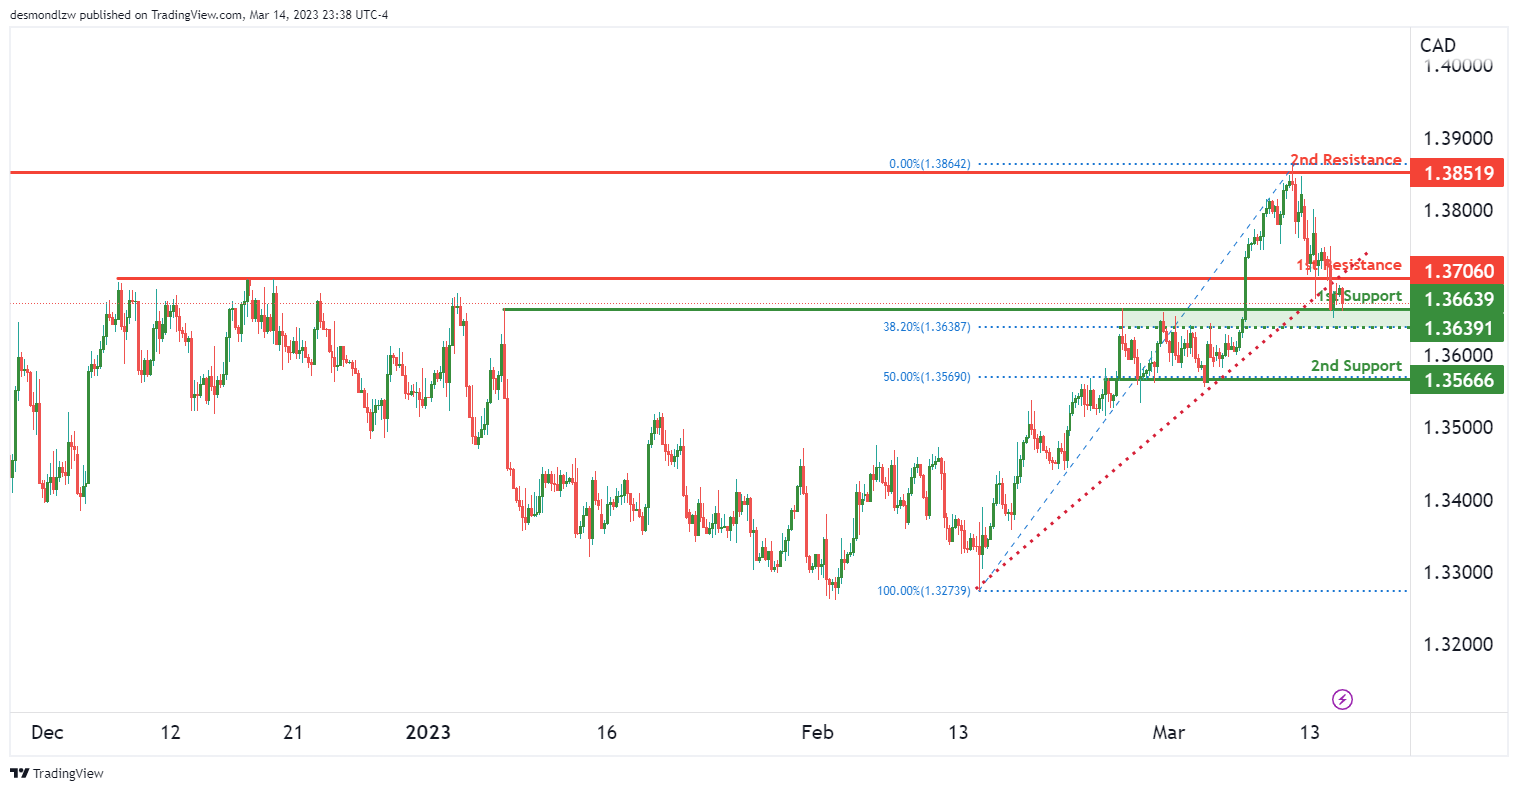
Price is approaching our 1st support area at 1.3663, which lines up with the 38.2% Fibonacci retracement. If the price were to reverse from this level, we could see it push up to our 1st resistance at 1.3706, which is an overlap resistance. Our 2nd resistance is at 1.3851.
On the other hand, if the price were to break from our 1st support, it could drop to our 2nd support at 1.3566, which lines up with the 50% Fibonacci retracement and overlap support.
DJ30:
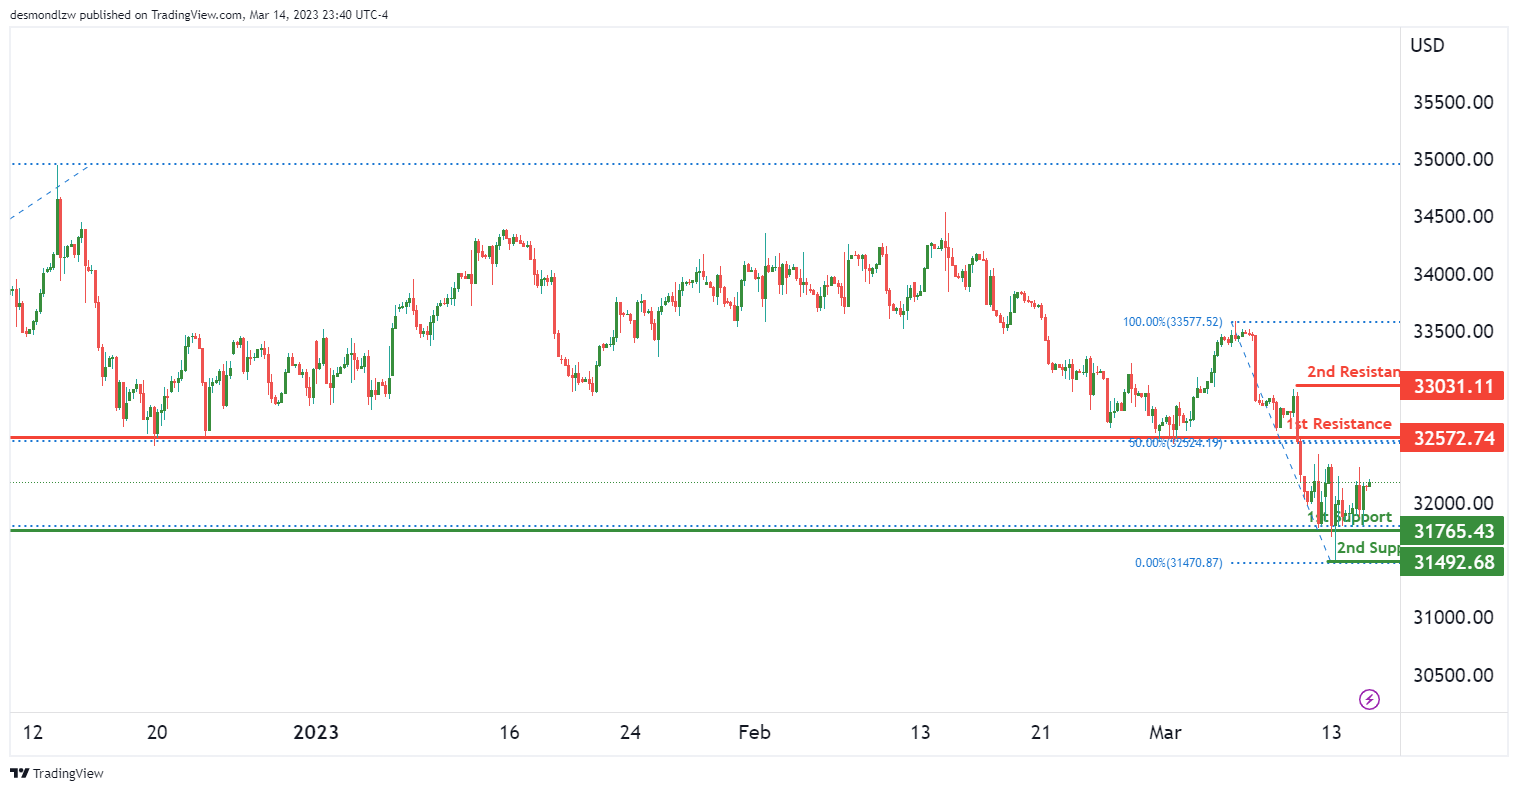
Price has reversed from our 1st support at 31765. It could potentially push up to our 1st resistance at 32572, which is an overlap resistance along with the 50% Fibonacci retracement. If the price were to pass through, it could push up further to our 2nd resistance at 3303.
Regarding support levels, our 2nd support is at 31492, which is a swing low support.
GER30:
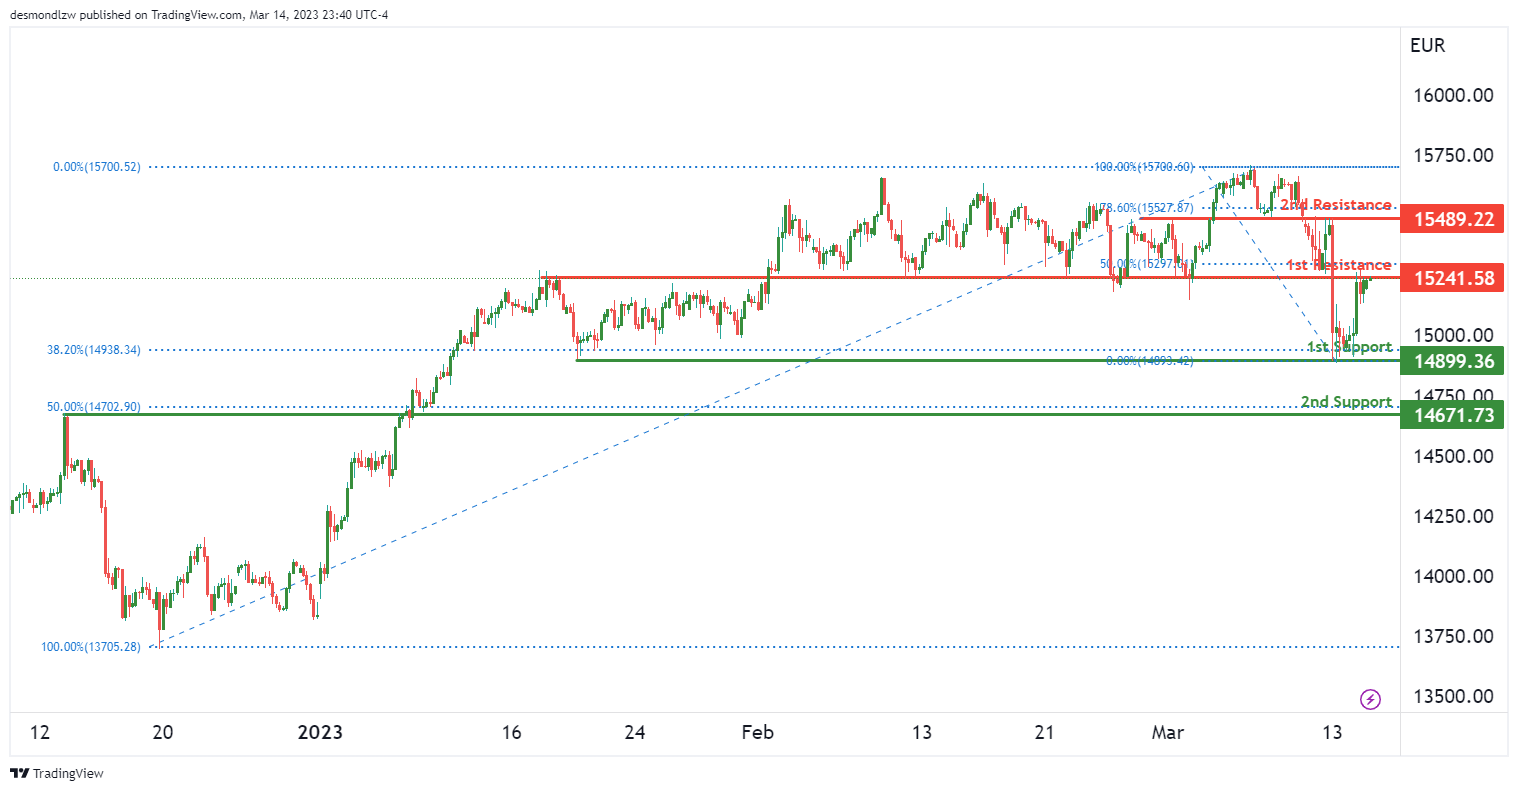
Price is currently at our 1st resistance level at 15241, which is an overlapping resistance along with the 50% Fibonacci retracement. If the price were to break through, it could potentially push up to our 2nd resistance at 15489, along with the 78.6% Fibonacci retracement.
Regarding support levels, our 1st support is at 14899, which lines up with the 38.2% Fibonacci retracement. If the price were to break below this level, it could drop further down to our 2nd support at 14671, which is an overlap support along with the 50% Fibonacci retracement.
BTC/USD:
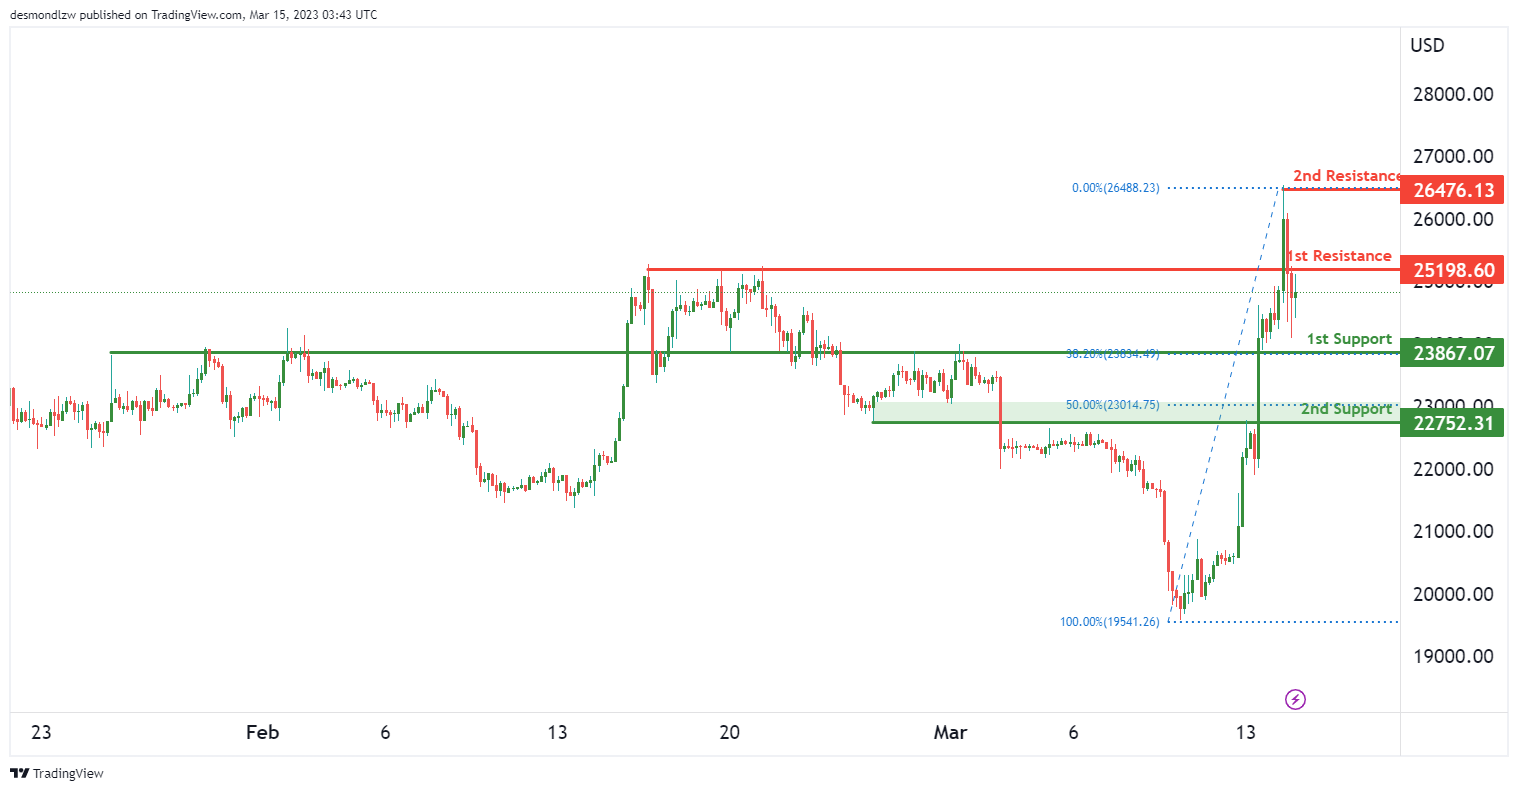
Price is currently testing our 1st resistance at 25198. If the price were to reverse from this level, it could drop to our 1st support at 23867, which is an overlap support along with the 38.2% Fibonacci retracement. Our 2nd support level is 22752, which is also an overlap support along with the 50% Fibonacci retracement.
On the other hand, if the price were to break the 1st resistance, it could potentially push up to the 2nd resistance at 26476.
US500
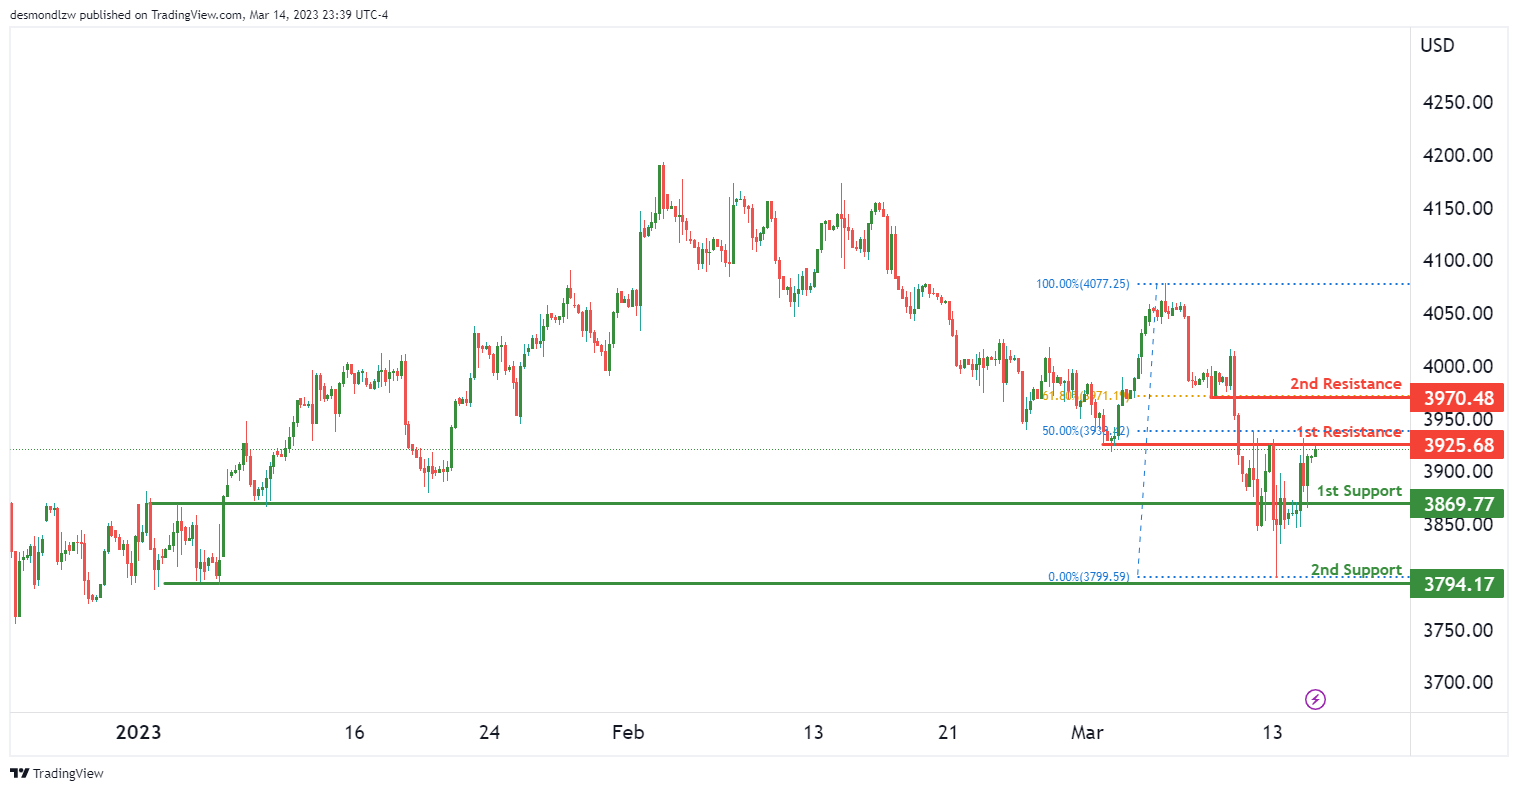
Price has recently been rejected from our 1st resistance level at 3925, which is an overlap resistance along with the 50% Fibonacci retracement. If the price were to break above this level, it could push up to our 2nd resistance at 3970, which is another overlap resistance along with the 61.8% Fibonacci retracement.
Regarding the support levels, if the price were to reverse from the 1st resistance level, our 1st support is at 3869, and the 2nd support is at 3794, which is another swing low support.
ETH/USD:
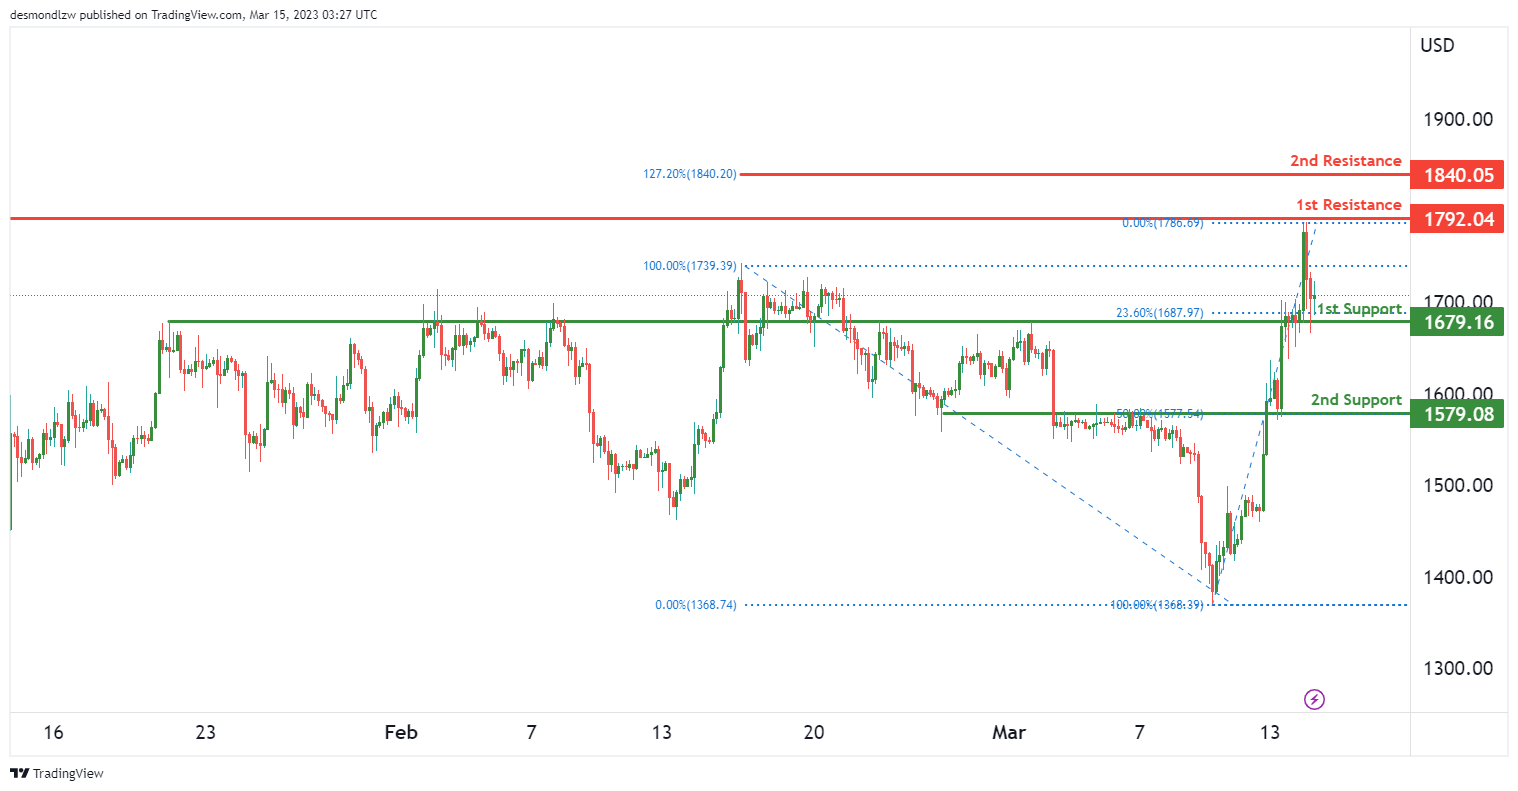
Price has recently reversed from our 1st support at 1679, which is an overlap support level along with the 23.6% Fibonacci retracement. If the price were to break below this level, it could potentially drop further down to our 2nd support at 1579, which is an overlap support level along with the 50% Fibonacci retracement.
WTI/USD:
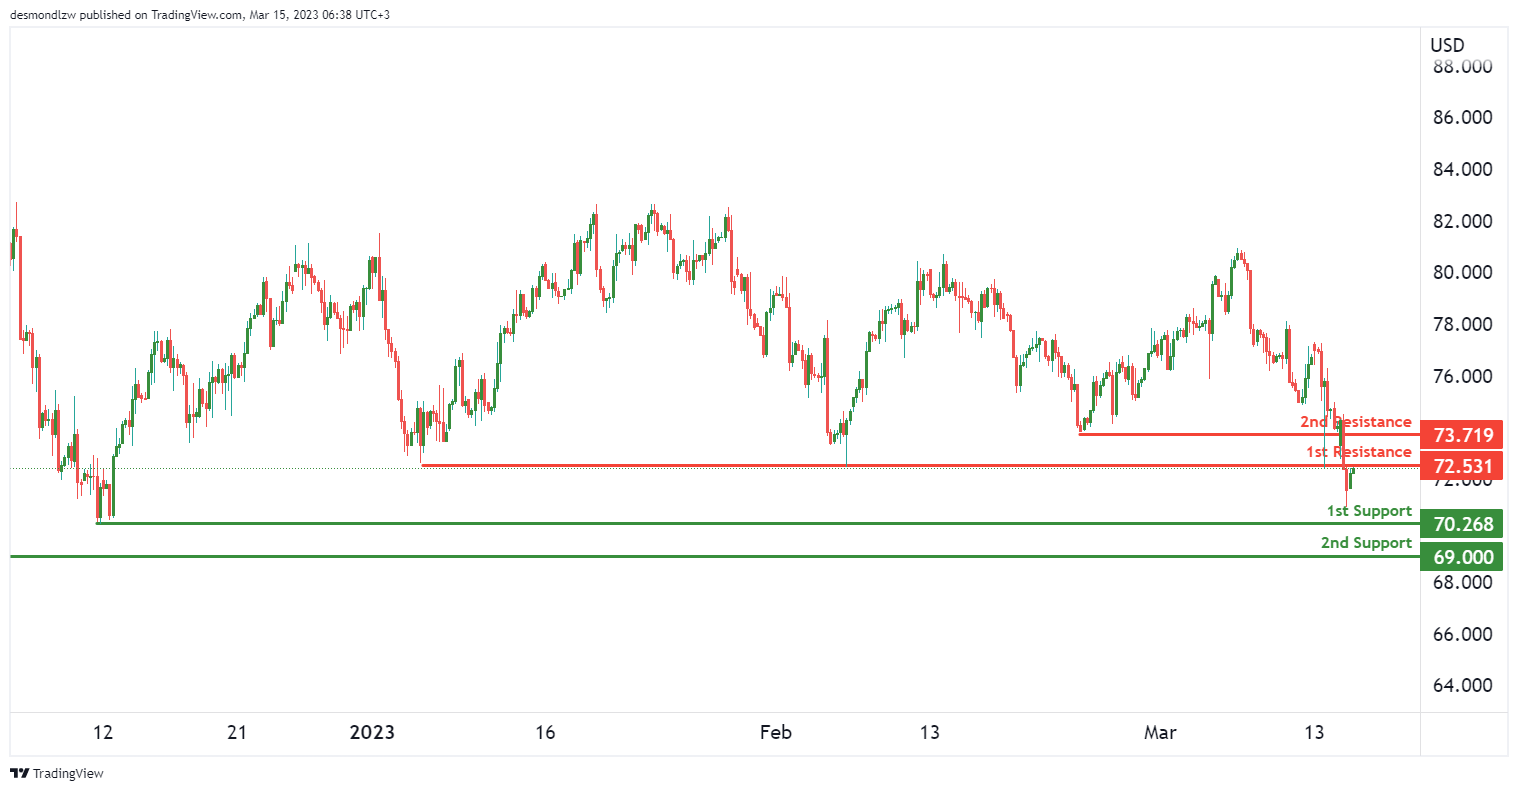
Price is currently at our 1st resistance level at 72.53, which is an overlap resistance level. If the price were to break above this level, it could potentially push up to our 2nd resistance level at 73.71.
Regarding support levels, our 1st support is at 70.26, and the 2nd support level is at 69.00
XAU/USD (GOLD):
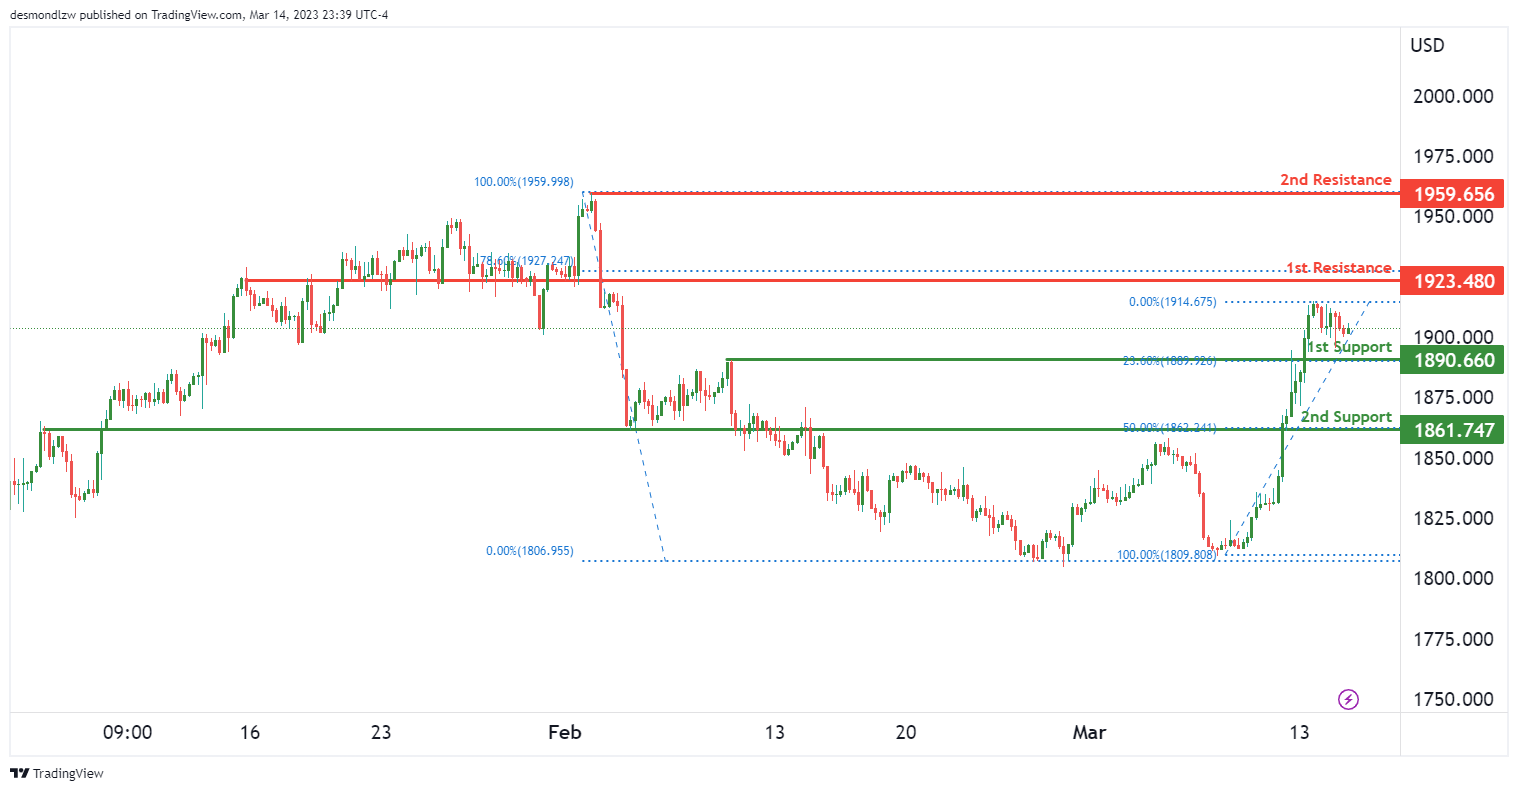
Price is currently lingering between our 1st support and resistance levels. If the price were to reverse from our 1st resistance at 1923, which is an overlapping resistance level, it could drop to our 1st support at 1890, which is an overlap support level along with the 23.6% Fibonacci retracement. If the selling momentum is strong, the price could drop further down to our 2nd support at 1861, which is another overlap support level along with the 50% Fibonacci retracement.
However, if the price were to break above our 1st resistance level, it could potentially push up to our 2nd resistance at 1959, which is a swing-high resistance level.