

Sample Category Title
China posts mixed economic data in Jan-Feb period
China's economic data for the first two months of 2023 showed mixed results, with industrial production growth falling short of expectations but retail sales and fixed asset investment exceeding them.
According to China's National Bureau of Statistics, industrial production grew by 2.4% yoy, below the forecasted 2.6% yoy. Retail sales, on the other hand, rose by 3.5% yoy, slightly above expectations of 3.4% yoy.
Fixed asset investment also exceeded expectations, growing by 5.5% yoy, compared to the forecasted 4.5% yoy. Infrastructure investment saw a rise of 9.0% yoy. However, property investment showed a decline of -5.7% yoy, indicating a slowdown in the real estate sector.
The NBS released a statement that highlighted the challenges facing China's economy. "The external environment is even more complex, inadequate demand remains prominent and the foundation for economic recovery is not solid yet," the statement said.
The economic data for January and February is combined to smooth out the impact of the Lunar New Year holiday, which falls at different times during the two months in different years.
BoJ minutes: Basic stance to continue with current monetary easing
BoJ has reaffirmed its commitment to continuing with its current monetary easing policy, including yield curve control, to achieve the price stability target, according to the minutes of its meeting in January 17-18.
One member noted that there is "still a long way to go to achieve the price stability target", and thus the Bank should continue with the current monetary easing to firmly support the economy.
To encourage firms' efforts with regard to business transformation until sustained wage increases can be expected, the Bank needs to "curb interest rate rises across the entire yield curve" while paying attention to the functioning of bond markets, according to another member.
Another member added that it was "inappropriate to rush to an exit" from the current monetary policy, as overseas economies were currently heading toward slowdowns.
However, one member recognized that "at some point in the future", it will be necessary to examine and assess the balance between the positive effects and side effects of the current monetary easing policy.
The Bank's "basic stance on its future conduct of monetary policy" is to "continue with the current monetary easing -- including the conduct of yield curve control -- and thereby achieve the price stability target in a sustainable and stable manner accompanied by wage increases," the minutes read.
Gold Price Consolidates Gains, US CPI Slides Further
Key Highlights
- Gold price rallied towards $1,915 before the bears appeared.
- A connecting bullish trend line is forming with support near $1,895 on the 4-hours chart.
- EUR/USD and GBP/USD might continue to recover higher.
- The US CPI declined from 6.4% to 6% in Feb 2023.
Gold Price Technical Analysis
Gold price started a major increase above the $1,850 resistance against the US Dollar. The price gained momentum after there was a close above the $1,880 level.
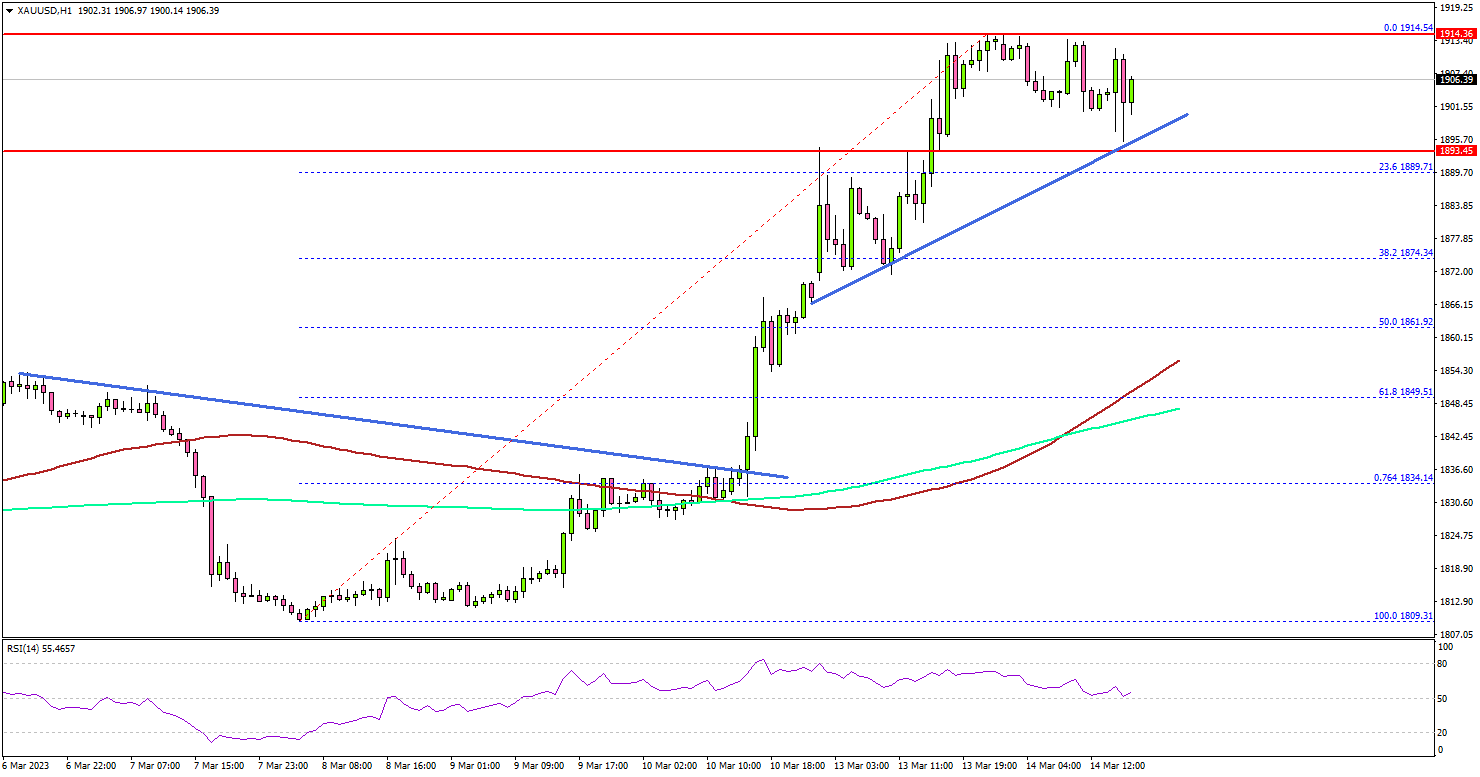
The 4-hours chart of XAU/USD indicates that the price even settled above the $1,880 level, the 100 simple moving average (red, 4-hours), and the 200 simple moving average (green, 4-hours).
Finally, there was a spike above the $1,900 resistance. The price traded as high as $1,914 before a consolidation phase kicked in. On the downside, an initial support is near the $1,895 level.
There is also a connecting bullish trend line forming with support near $1,895 on the same chart. The next major support is near the $1,882 level, below which there is a risk of a move towards the $1,875 level.
The next major support is near the $1,865 level, below which gold price might struggle to stay above the $1,850 zone. In the stated case, gold price could slide towards the $1,832 support.
On the upside, the price is facing resistance near the $1,915 level. The main resistance is near the $1,920 zone and the, above which the price might rise towards the $1,950 level.
Looking at EUR/USD, the pair might soon attempt an upside break and it could even clear the 1.0800 resistance zone.
Economic Releases to Watch Today
- US Retail Sales for Feb 2023 (MoM) – Forecast -0.3%, versus +3.0% previous.
- US Producer Price Index for Feb 2023 (MoM) – Forecast +0.3%, versus +0.7% previous.
- US Producer Price Index for Feb 2023 (YoY) – Forecast +5.4%, versus +6.0% previous.
PPI Forecast and the State of the Dollar
Since the fateful events of March 10th, 2023, I mean the SVB and Signature Bank crash, there has been a lot of attention on the US economy and the Dollar from the international community. In this light, examining the effects, this attention might have on the US Dollar ahead of the upcoming PPI data is crucial.
DXY - US DOLLAR
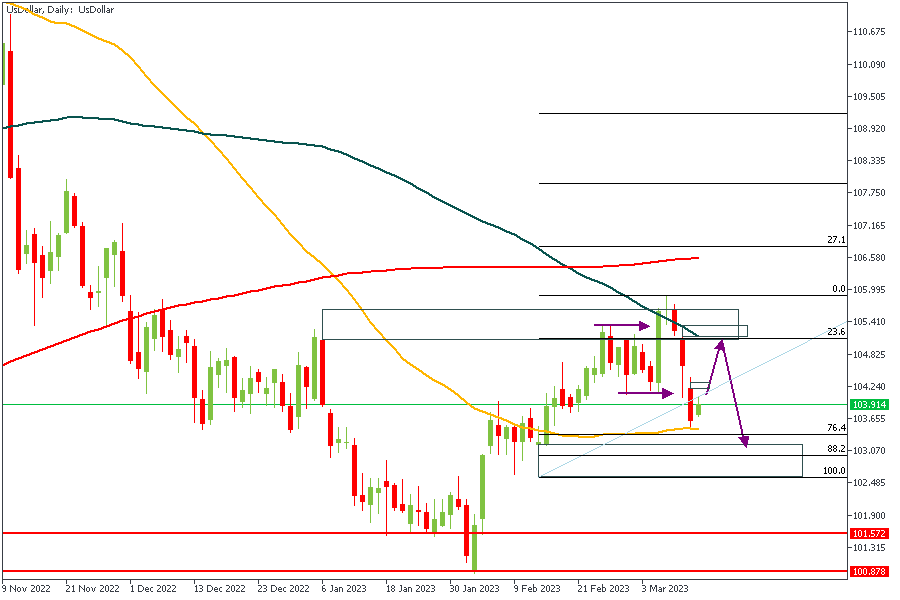
DXY has just recently broken below the previous low at 104.116. There is usually a bit of retracement after a breakout in the market. On this premise, I will maintain a bullish sentiment on the Dollar, with a target of 105. However, please note that the overall trend is still bearish, based on the position of the Moving Averages, the recent break below the previous low, and the Fibonacci of the breakout move; we are simply trying to capitalize on the retracement move here!
Analysts’ Expectations:
- Direction: Bullish
- Target: 105
- Invalidation: 103.4
EURUSD
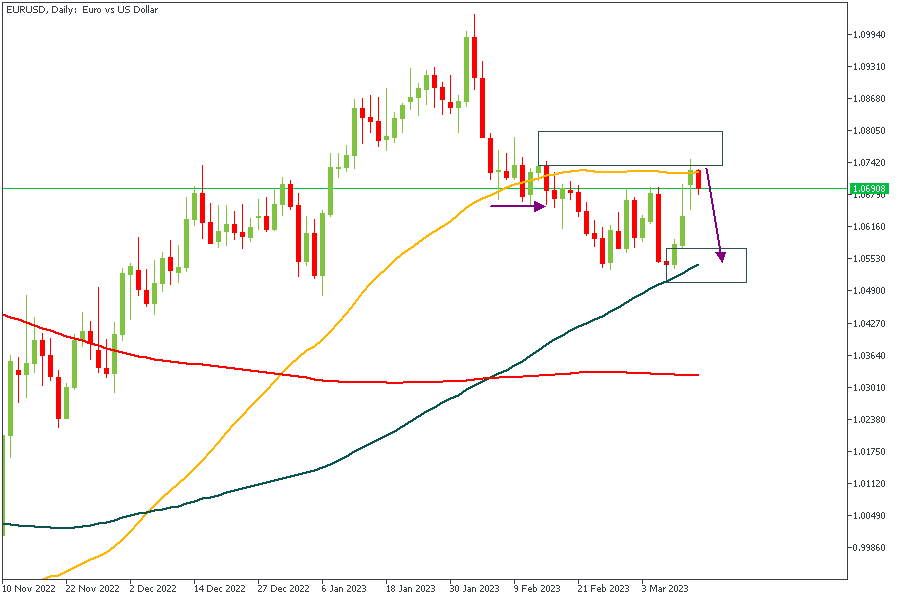
As for EURUSD, if we expect the US Dollar to be stronger, it means EURUSD should be bearish by correlation. Combine that with the fact that the price has just recently been rejected from the 100-Day Moving Average and the rally-base-drop supply zone on top of it, and you will end up with a clear bearish sentiment.
Analysts’ Expectations:
- Direction: Bearish
- Target: 1.05799
- Invalidation: 1.07551
GBPUSD
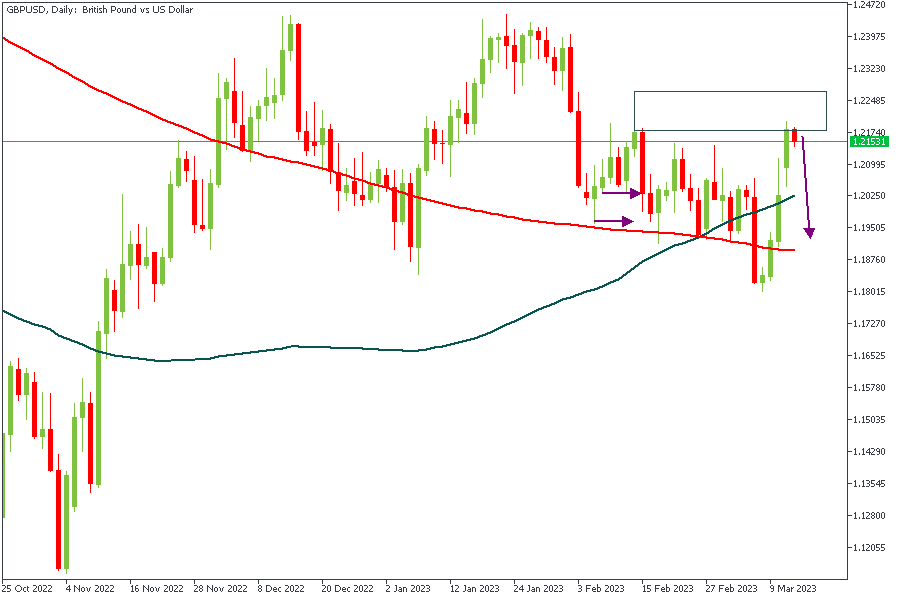
Similar to the setup on EURUSD, we see how GBPUSD reacts to the supply zone around the 76% Fibonacci retracement level. My target price here is 1.19226.
Analysts’ Expectations:
- Direction: Bullish
- Target: 1.19226
- Invalidation: 1.22065
XAUUSD
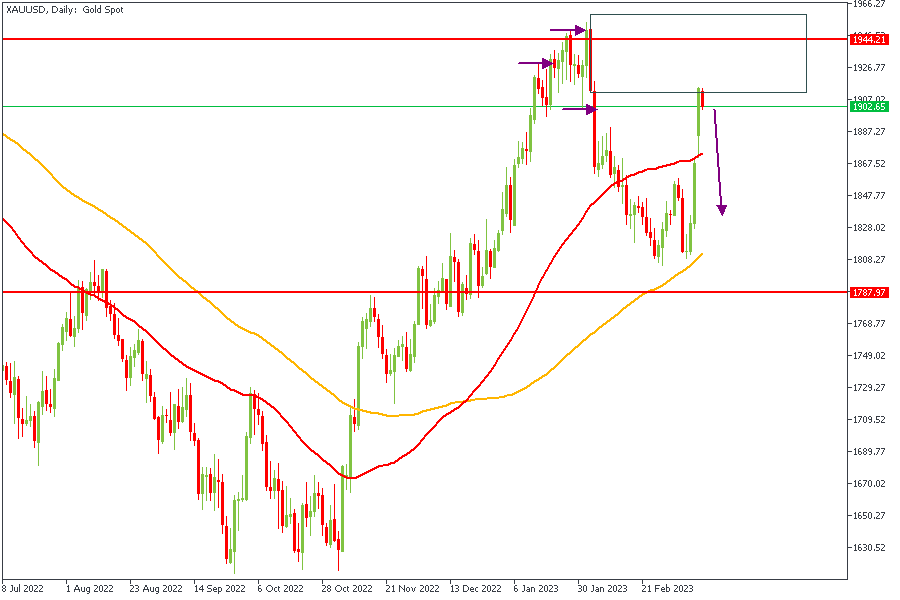
XAUUSD aligns with our US dollar sentiment based on the DXY chart. On the Daily timeframe, we see the recent break below the low at 1897.55 and the rejection from the rally-base-drop supply zone at 76% of the Fibonacci retracement. This goes to confirm our expectation of a stronger US Dollar.
Analysts’ Expectations:
- Direction: Bearish
- Target: 1915.7
- Invalidation: 1881.00
US500
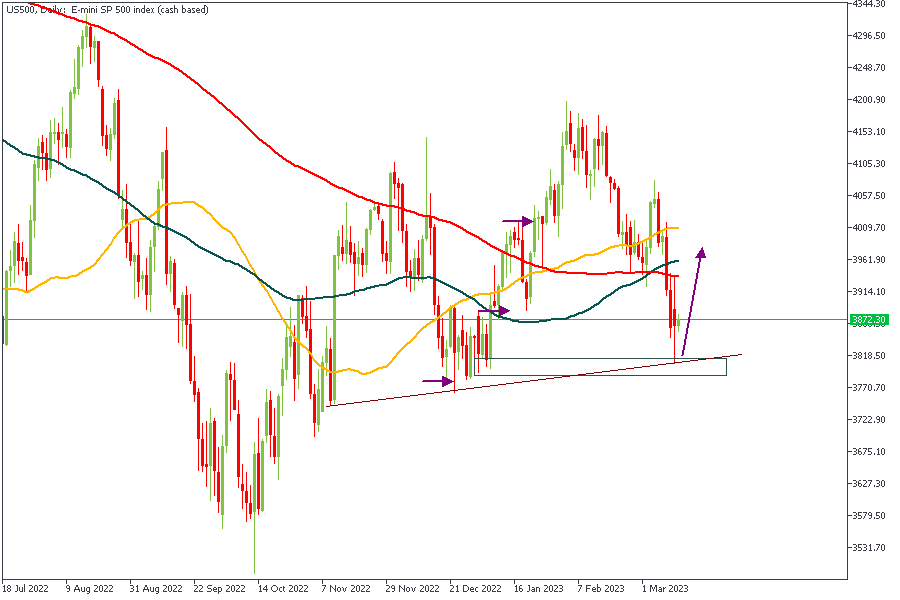
US500 paints a very clear picture. The trendline support, a breakout above the previous high, the drop-base-rally demand zone, the 88% Fibonacci retracement level, and the relative position of the moving averages to one another all speak in favor of a bullish movement.
Analysts’ Expectations:
- Direction: Bullish
- Target: 3967.55
- Invalidation: 3786.32
CONCLUSION
The trading of CFDs comes at a risk. Thus, to succeed, you have to manage risks properly. To avoid costly mistakes while you look to trade these opportunities, be sure to do your due diligence and manage your risk appropriately.
EURCHF Wave Analysis
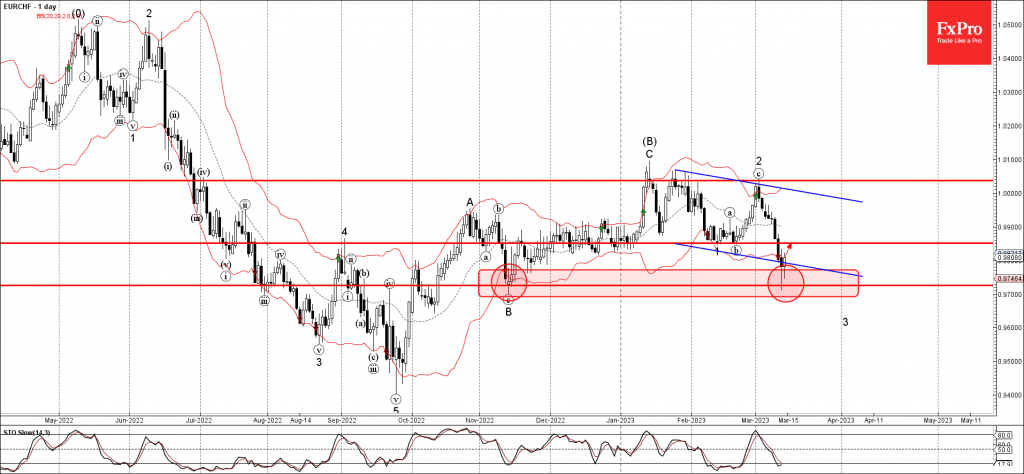
- EURCHF reversed from support level 0.9725
- Likely to rise to resistance level 0.9850
EURCHF recently reversed up from the support area located between the support level 0.9725 (which reversed the price in November) standing well below the lower daily Bollinger Band.
The support level 0.9725 was further strengthened by the support trendline of the daily down channel from January.
Given the oversold daily Stochastic, EURCHF can be expected to rise further toward the next resistance level 0.9850 (former double bottom from the middle of February).
WTI Wave Analysis
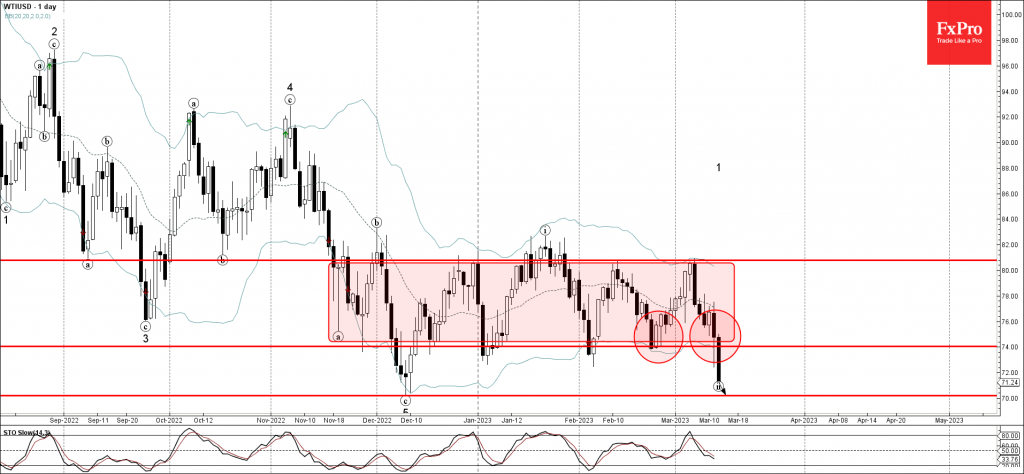
- WTI broke key support level 74.00
- Likely to fall to support level 70.20
WTI crude oil under the bearish pressure after the earlier breakout of the key support level 74.00 (which is the lower boundary of the sideways price range from the middle of November).
The breakout of the support level 74.00 accelerated the active corrective wave (ii).
WTI crude oil can be expected to fall further toward the next support level 70.20 (former multi-month low from February, target for the completion of the active wave (ii)) – from where the upward correction is likely.
US Inflation Sparks Risk Appetite
The US consumer price index rose 0.4% in February, slowing the annual rate to 6.0%, in line with economists’ expectations. The core price index, which excludes food and energy, rose 0.5% for the month (0.4% expected) and slowed slightly to 5.5% for the year from 5.6%.
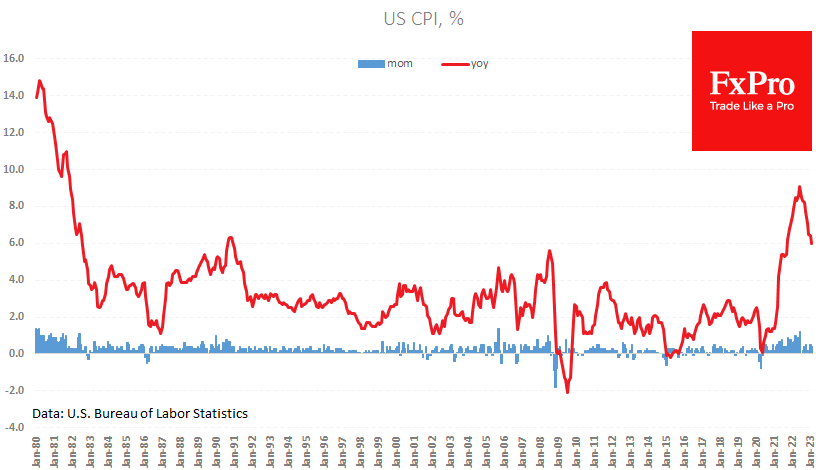
It is important to note that the monthly price increase remains above the 0.17% needed to reach an annual inflation rate of 2%. This is despite falling commodity prices. Technically, the latest figures do not support the hypothesis of a sustained slowdown in inflation.
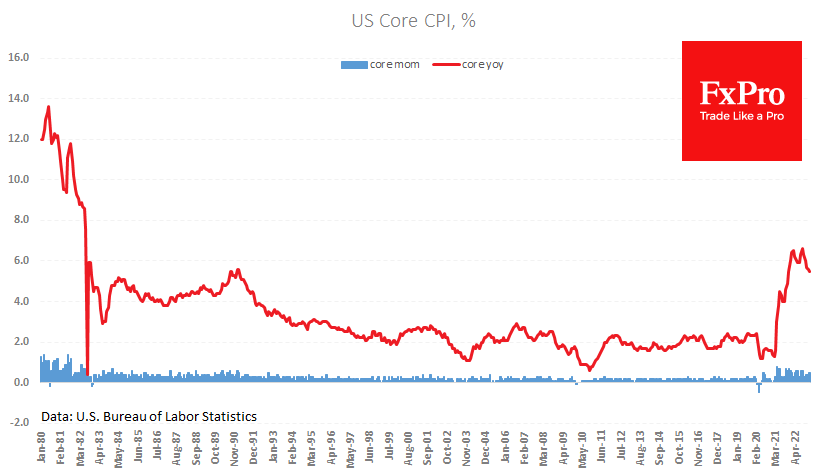
Nevertheless, price increases are not out of control, and the effects of the previous policy tightening are not yet fully reflected in the economic data. The robust labour market data of the last two months has not led to a significant acceleration in the rate of price and wage increases, and this seems to be a good reason for the Fed to raise rates by 25 points and not 50 as feared a week ago, but also not to abandon the rate hike altogether, as was almost done at the height of the banking mini-panic on Monday.
The inflation data did not initially trigger a strong reaction in the currency market. However, in the last few minutes there was some demand for the dollar and for equities, as we see a return of capital to US assets after yesterday’s near-panic selling. Looking beyond the next few minutes, it is worth remembering that the recovery in risk demand (stock buying) is also feeding a weaker dollar and supporting commodity prices.
Sunset Market Commentary
Markets
A sense of calm returned to markets after the extreme risk-off repositioning all day yesterday. The Asian trading session was still marked by wild intraday swings, with short-term US yields at some point up 20 bps before suddenly collapsing 25 bps only to recover again. The 2-y is currently up 36 bps, recouping more than half of the loss incurred on Monday. US February inflation came in at 0.4% m/m for the headline reading and 0.5% in the core measure. The latter was a basis point higher than expected. The yearly measures (6% headline, 5.5% core) hit the bar exactly. US money markets discount an 80% chance of a 25 bps rate increase next week. The safe haven bid in other parts of the US yield curve eased as well with moves ranging from 5 bps (30-y) to 16.4 bps (5-y). German/European (swap) yields gapped lower at the open but recovered swiftly thereafter. Current changes vary between 16-27 bps in Germany with the front-end underperforming. European swap yields add less (8-12.1 bps) but didn’t suffer as much as Bund yields did. Money markets in the euro area have raised bets for the terminal rate again to <3.5% with a(n in our view unjustified) less than 50 bps hike priced in for Thursday’s ECB meeting. UK gilt yields rebound between 9.5 bps and 13.7 bps in a similar inversion deepener in an obvious trend-joining move. However, a solid UK labour report supported yields as well. The jobless rate stabilized at 3.7% in January, defying expectations for a small uptick. Employment in the three months through January rose by 65k vs 53k expected with a preliminary February reading also topping estimates. Weekly earnings growth (ex. bonus) came in more or less as expected, at 6.5%.
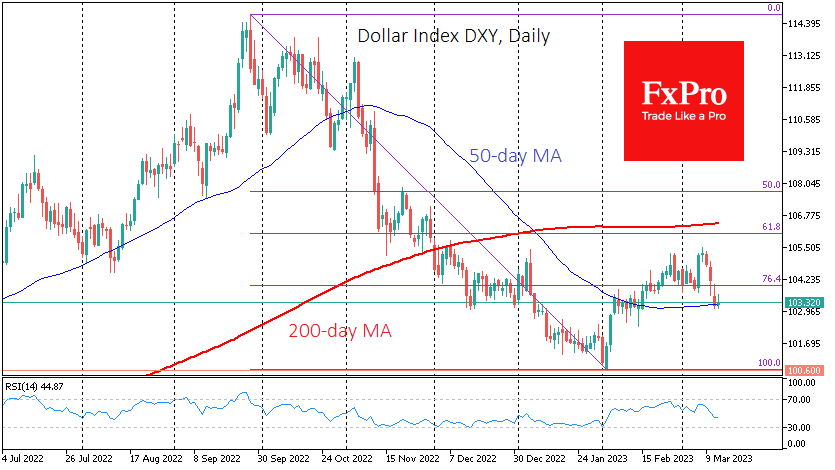
The absence of an upward US CPI surprise is welcomed by the riskier parts of the markets. One can only imagine the carnage if inflation came in even hotter, putting the Fed between a rock and a hard place (if it isn’t there already). Stocks in Europe and the US rebound. The Euro Stoxx 50 rises more than 2%. The index is trying to recoup support-turned-into-resistance at around 4172.95 – the neckline of a double top formation. Wall Street adds 1.37-2.19% with the financial subindex taking the lead. An improved risk sentiment doesn’t help the likes of oil though. Brent at some point was down 2%, losing the $80/b mark. A gold surge over the past few days eases today. Yet, underscoring the lingering nervousness, once ounce of the precious metal is still being sold at levels of around $1900. Turning to currency markets, the US dollar is catching a (tiny) bid. EUR/USD bounced of 1.0735 resistance to trade a tad lower at 1.072. The trade-weighted DXY inches up marginally from 103.67 to 103.77 and USD/JPY rises to 134.85 (from 133.21). Sterling is unable to bank on the labour market report against the euro or the dollar as the yield rebound in the latter two regions outpaces the UK. EUR/GBP oscillates around 0.88. The Swedish crown rallies to EUR/SEK 11.268 though that remains one of the weakest levels in history. Central-European currencies trade mixed. The Polish zloty and the Czech koruna underperform. The Hungarian forint initially lost further ground to hit the lowest level since mid-January. After hitting EUR/HUF 396, a turnaround kicked in, bringing the pair back sub 390 currently. News & Views
According to the Czech Statistical Office, real retail sales in the country in January increased by 0.3% M/M as sales of automotive fuel increased by 2.5% and food sales gained 1.7%. Sales of non-food goods decreased by 1.1% M/M. Even so, real sales still were 7.7% lower compared to the same month last year, the ninth successive month of declining sales. In December and November Y/Y sales declined 8.1% and 9.1% respectively. Negative Y/Y figures still were recorded for household equipment (minus 14.8%), sales of cultural and recreation goods (minus 10.0%), information and communication equipment (minus 3.7%) and dispensing chemist and medical goods (minus 2.6%). On the other hand, sales in retail clothing, footwear and leather goods increased by 5.8% Y/Y and sales of cosmetic articles rose by 1.8%. Sales of food also decreased by 8.0% Y/Y. Sales via mail order houses or via internet decreased by 11.9 Y/Y. The Czech koruna today continued its recent correction of multi-year peak levels reached early this month. EUR/CZK trades near 23.81 compared to the EUR/CZK 24.35 area early this month.
AUD/JPY: Broken Channel Can Cause More Weakness
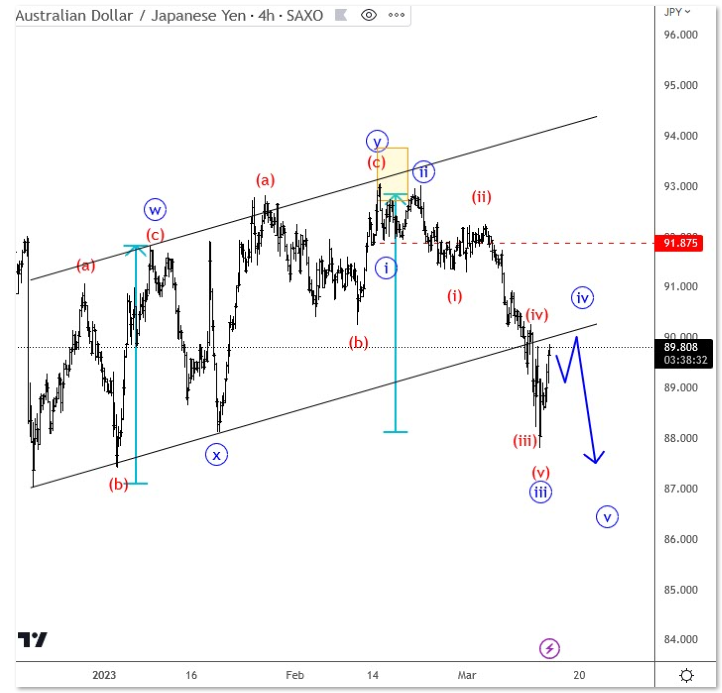
AUDJPY is trading nicely down after seven swing corrective rally to 93.00, where wave Y was equal to wave W. So far we can see a strong turn down which looks like an impulse that also took out the lower side of a corrective channel so more weakness can be seen here after the current intraday bounce. Nice resistance is at 90.00, where broken trendline can become a resistance.
https://www.youtube.com/watch?v=6A5fiXJMSys