Sample Category Title
EURGBP at Risk of Breaking Below Sideways Range
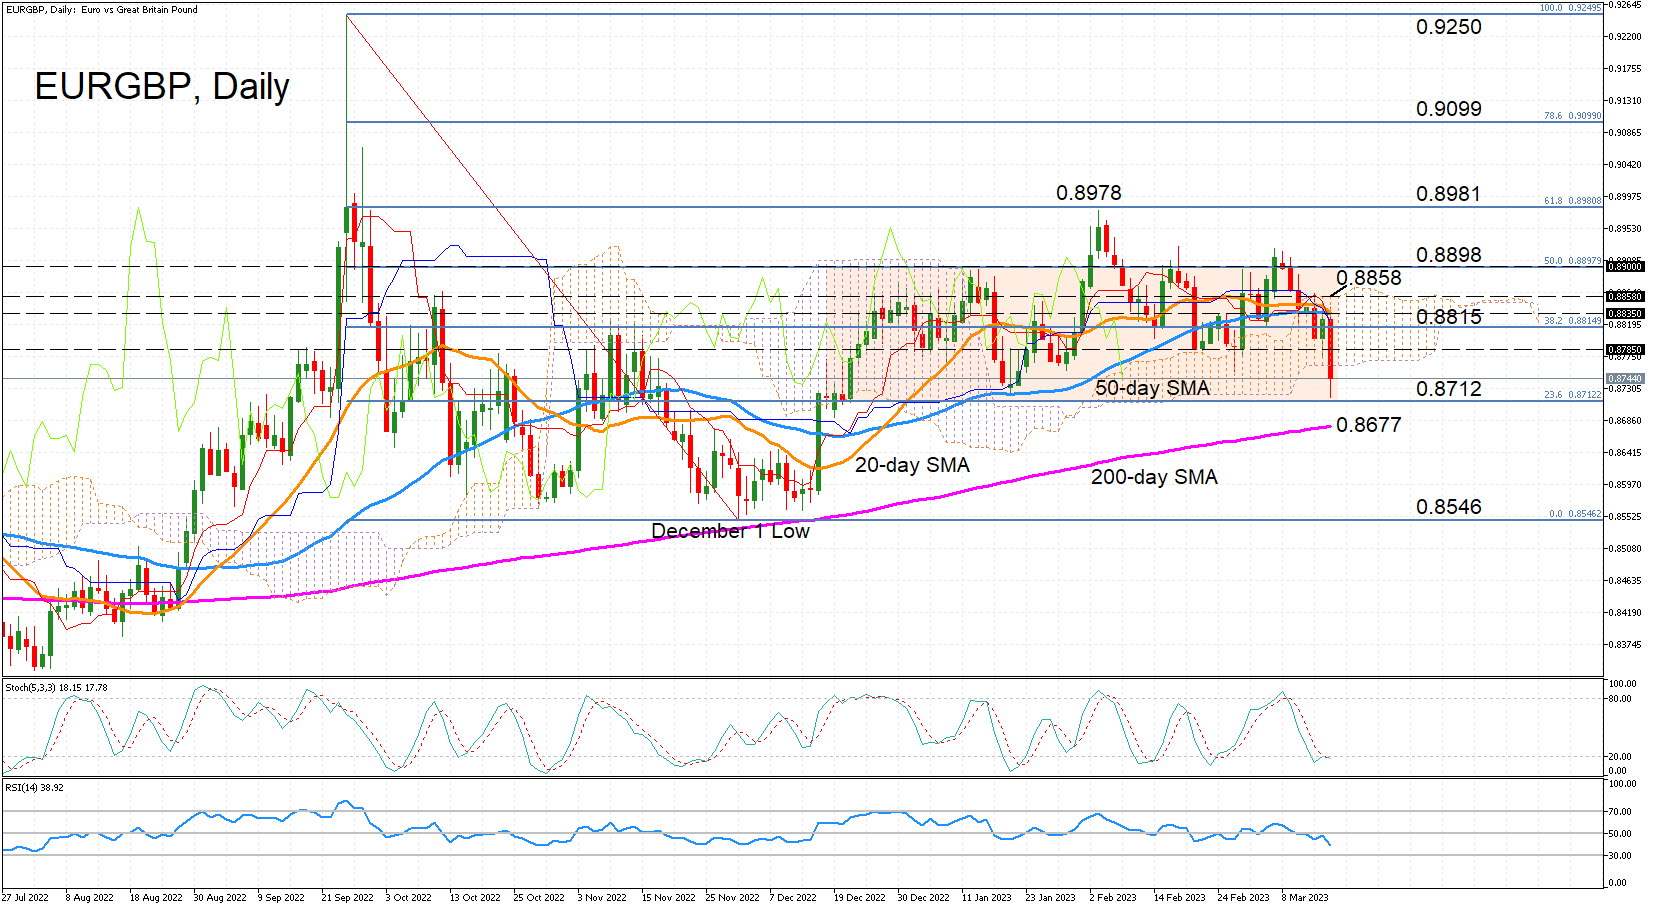
EURGBP has mostly been trading between the 23.6% and 50% Fibonacci retracement levels of the September-December 2022 downtrend over the past three months, but the lower bound of that range came under attack on Wednesday. Sellers swarmed into the market after the 20- and 50-day simple moving averages (SMA) caved in on the price.
The 20-day SMA is in the process of crossing below the 50-day one, while the Tenkan-sen and Kijun-sen lines of the Ichimoku cloud are sloping downwards too, pointing to an increasingly bearish bias. The momentum indicators are underlining the short-term negative picture. The stochastics are converging on the 20 oversold mark and the RSI is diving deeper below 50.
Immediate support comes at the 23.6% Fibonacci of 0.8712, which hasn’t been tested since mid-to-late December. A drop below it would instantly bring into view the 200-day SMA 0.8677, after which, the December 1 low of 0.8546 would be eyed by the bears.
However, if the sideways range holds and the price bounces off the 23.6% Fibo, a difficult battle lies to the north. The entire zone around the 38.2% Fibonacci of 0.8815 is surrounded with obstacles. Particularly, the 20- and 50-day SMAs and the cloud top at 0.8858. Even if these barriers are cleared, the 50% Fibonacci just below 0.8900 that forms the upper bound of the range could prove difficult to overcome. Not to mention the February top of 0.8978, which coincides with the 61.8% Fibonacci.
In brief, a break below the range’s lower bound would increase the risk of the neutral medium-term outlook turning bearish, and only a climb above the February top can sustain the weak positive trend in the longer run.
Sunset Market Commentary
Markets
News this morning of a major Credit Suisse shareholder ruling out a capital injection in the ailing Swiss bank not only rekindled a still lingering fire, it fanned it into an roaring blaze. Investors are running towards the exit, concerned about a potential collapse and the repercussions of this systemically important bank on the broader financial system. European stocks indices wipe out yesterday’s sharp, dead cat rebound. The Euro Stoxx 50 drops about 3%, closing in on the 4K support area. Losses on WS range between 1.4-1.8%. Commodities went in a tailspin with the likes of iron and oil losing 1 to >3%. Brent ($74.8/b) is testing the December 2022 support. Cash is hurled towards assets considered to be safe havens, including gold (+1.3% to $1928/oz). US Treasuries and Bunds are going through the roof, though volumes are lower than on Monday and yesterday. Yields in the US tumble 18.4-44.3 bps with the front outperforming. There’s about 125 bps of rate cuts priced in by the end of the year. German yields implode by 21.9-41.8 bps with the 2y yield now effectively being below the ECB’s 2.5% deposit rate. European swap yields are down 13.8-22.6 bps, sharply widening the spread over German yields from the tightest in a year to the widest levels since November 2022 in just a matter of days. Peripheral spreads with the German 10y yield soar with Italy (+10 bps) and Greece (+18 bps) underperforming. Corporate CDS since last Friday have jumped by 100 bps in the high-yield segment and about 25 bps for IG companies. Both are at their highest levels since early December. Unlike the previous days, the dollar stands to benefit from the outright risk-off. Concerns have now spread to the other side of the Atlantic as well, potentially turning an initial US issue into a broader/global (?) one. The trade-weighted index jumps from 103.73 to 104.85. EUR/USD erased all dollar-driven gains since the SVB story hit the wires last Friday. The pair fell from a 1.076 high to 1.0547 currently. The Japanese yen outperforms everything and everyone. USD/JPY tested the 135 barrier this morning but now trades at 132.87. EUR/JPY (140.00) loses almost 5 big figures. Sterling holds up pretty well given the circumstances. EUR/GBP tested 0.872 support before rebounding a bit to 0.875 currently. At the open this morning, the pair hit an intraday high of 0.883. The pound obviously is no match for the USD but damage could have been way bigger. GBP/USD slips to 1.205. Not that it got any market attention, but UK MinFin Hunt loosened the belts a bit and unveiled a yearly £22bn (on average over the next three years) of fiscal stimulus in his budget presentation. He used the room made available by a less-worse-than-feared economic situation as the OBR no longer forecasts a recession this year.
News & Views
After a monthly decline in January (-1.1% M/M), inflation in Sweden again accelerated at a faster pace than expected. Headline CPI jumped 1.1% M/M bringing the overall price level to 12% Y/Y (11.7% Y/Y in January). The CPIF (CPI with a fixed mortgage interest rate), the preferred inflation gauge of the Riksbank (RB) rose 0.9% M/M and 9.4% Y/Y. CPIF ex energy showed an even bigger upward surprise (1.5% M/M to 9.3% Y/Y, was 8.7%). The uptick occurred despite a 0.4 ppts negative contribution from lower electricity prices. The numbers put further pressure on the RB to continue decisive monetary tightening at the April 26 meeting. In February, the Riksbank indicated to raise to policy rate to a cycle peak somewhere between 3.25% and 3.5%. It also signaled a further weakening of the krone is undesirable as it makes it more difficult to for the RB to sustainably return to the target. However, until now the RB engagement provided only limited support to the krone as the ECB also continued to tighten aggressively. EUR/SEK this morning gained modestly despite the global risk-off (currently EUR/SEK 11.20). Even so, this level of the krone probably stays well below what is needed to contribute to the RB’s efforts to tame inflation.
According to Statistics Poland, consumer prices in February rose 1.2% M/M 18.4% Y/Y. Goods prices increased 20.2% and services prices 13.3%. In a monthly perspective, the biggest contribution came from higher food prices (0.44 ppts). The 1.2% M/M rise was faster than expected, but a downward revision of the January inflation brought the Y/Y measure close to expectations. At last week’s policy meeting, the National Bank of Poland kept the policy rate at 6.75% as it hopes that inflation will gradually cool. The NBP also would like to see a stronger zloty in line with the economic fundamentals. The initially reaction of the zloty to the release was modest, but the Polish currency later in the session outperformed the region, despite the broader risk-off sentiment (currently EUR/PLN 4.69).
EUR/USD head and shoulder in the making, ECB to hike how much?
ECB faces mounting pressure to deliver a decisive response to the recent bank rout that is raising serious doubts on whether they will raise interest rates by 50bps tomorrow as previously indicated. Market expectations for a 50bps hike have dropped to less than 30%, with a 70% chance of just a 25bps hike.
In February's statement, ECB said explicitly that "the Governing Council intends to raise interest rates by another 50 basis points at its next monetary policy meeting in March". However, the central bank has a recent history of overturning its intentions, leaving investors uncertain of their next move.
In June 2022 statement, it said "the Governing Council intends to raise the key ECB interest rates by 25 basis points at its July monetary policy meeting". But then in July, it hiked the three key interest rates by 50bps.
But of course, that's just an "intention". ECB never pre-commits to any policy move.
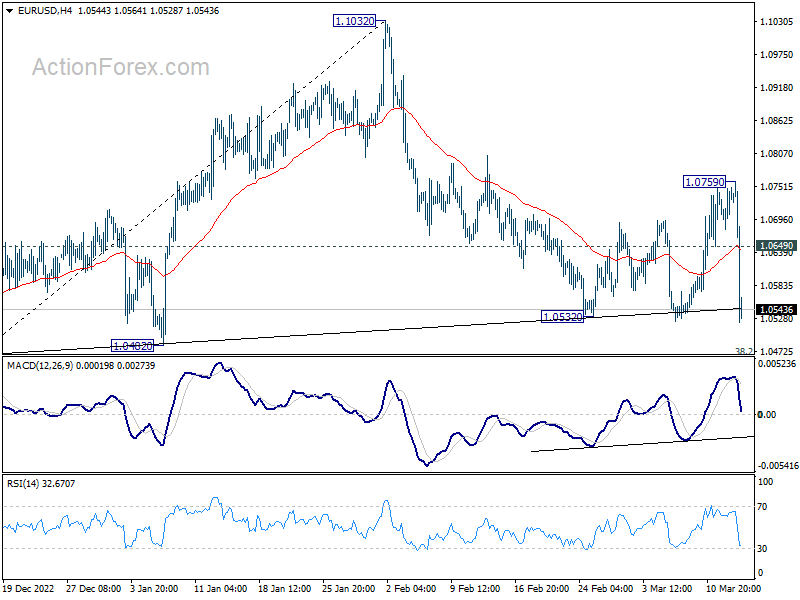
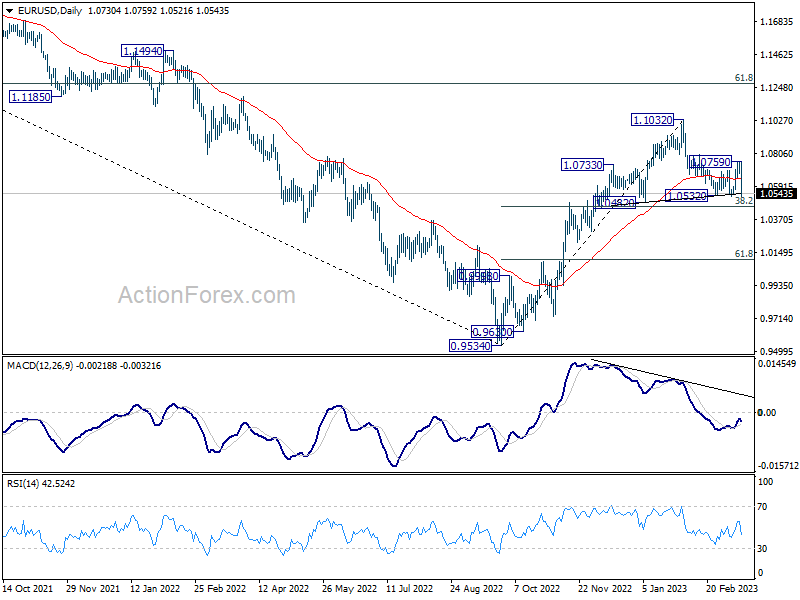
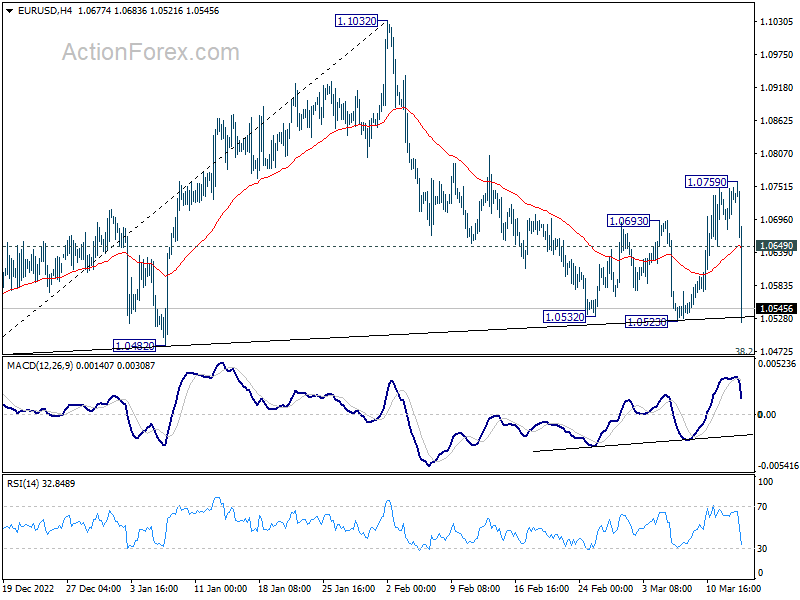
EUR/USD is now close to completing a head and shoulder top, with left shoulder at 1.0733, head at 1.1032, and right shoulder at 1.0759. Theoretically speaking, firm break of the neckline should have confirmed the reversal pattern already. On the other hand, strictly speaking, the ideal short entry should be on recovery back to the neckline, which might never happen.
To take a middle, decisive break of 38.2% retracement of 0.9534 to 1.1032 at 1.0258 will be taken as confirmation of the reversal. 61.8% retracement at 1.0106 will be the immediate near term target.
Let's see whether ECB would help complete this technical formation.
Gold Spikes Higher as Uncertainty Floods Markets
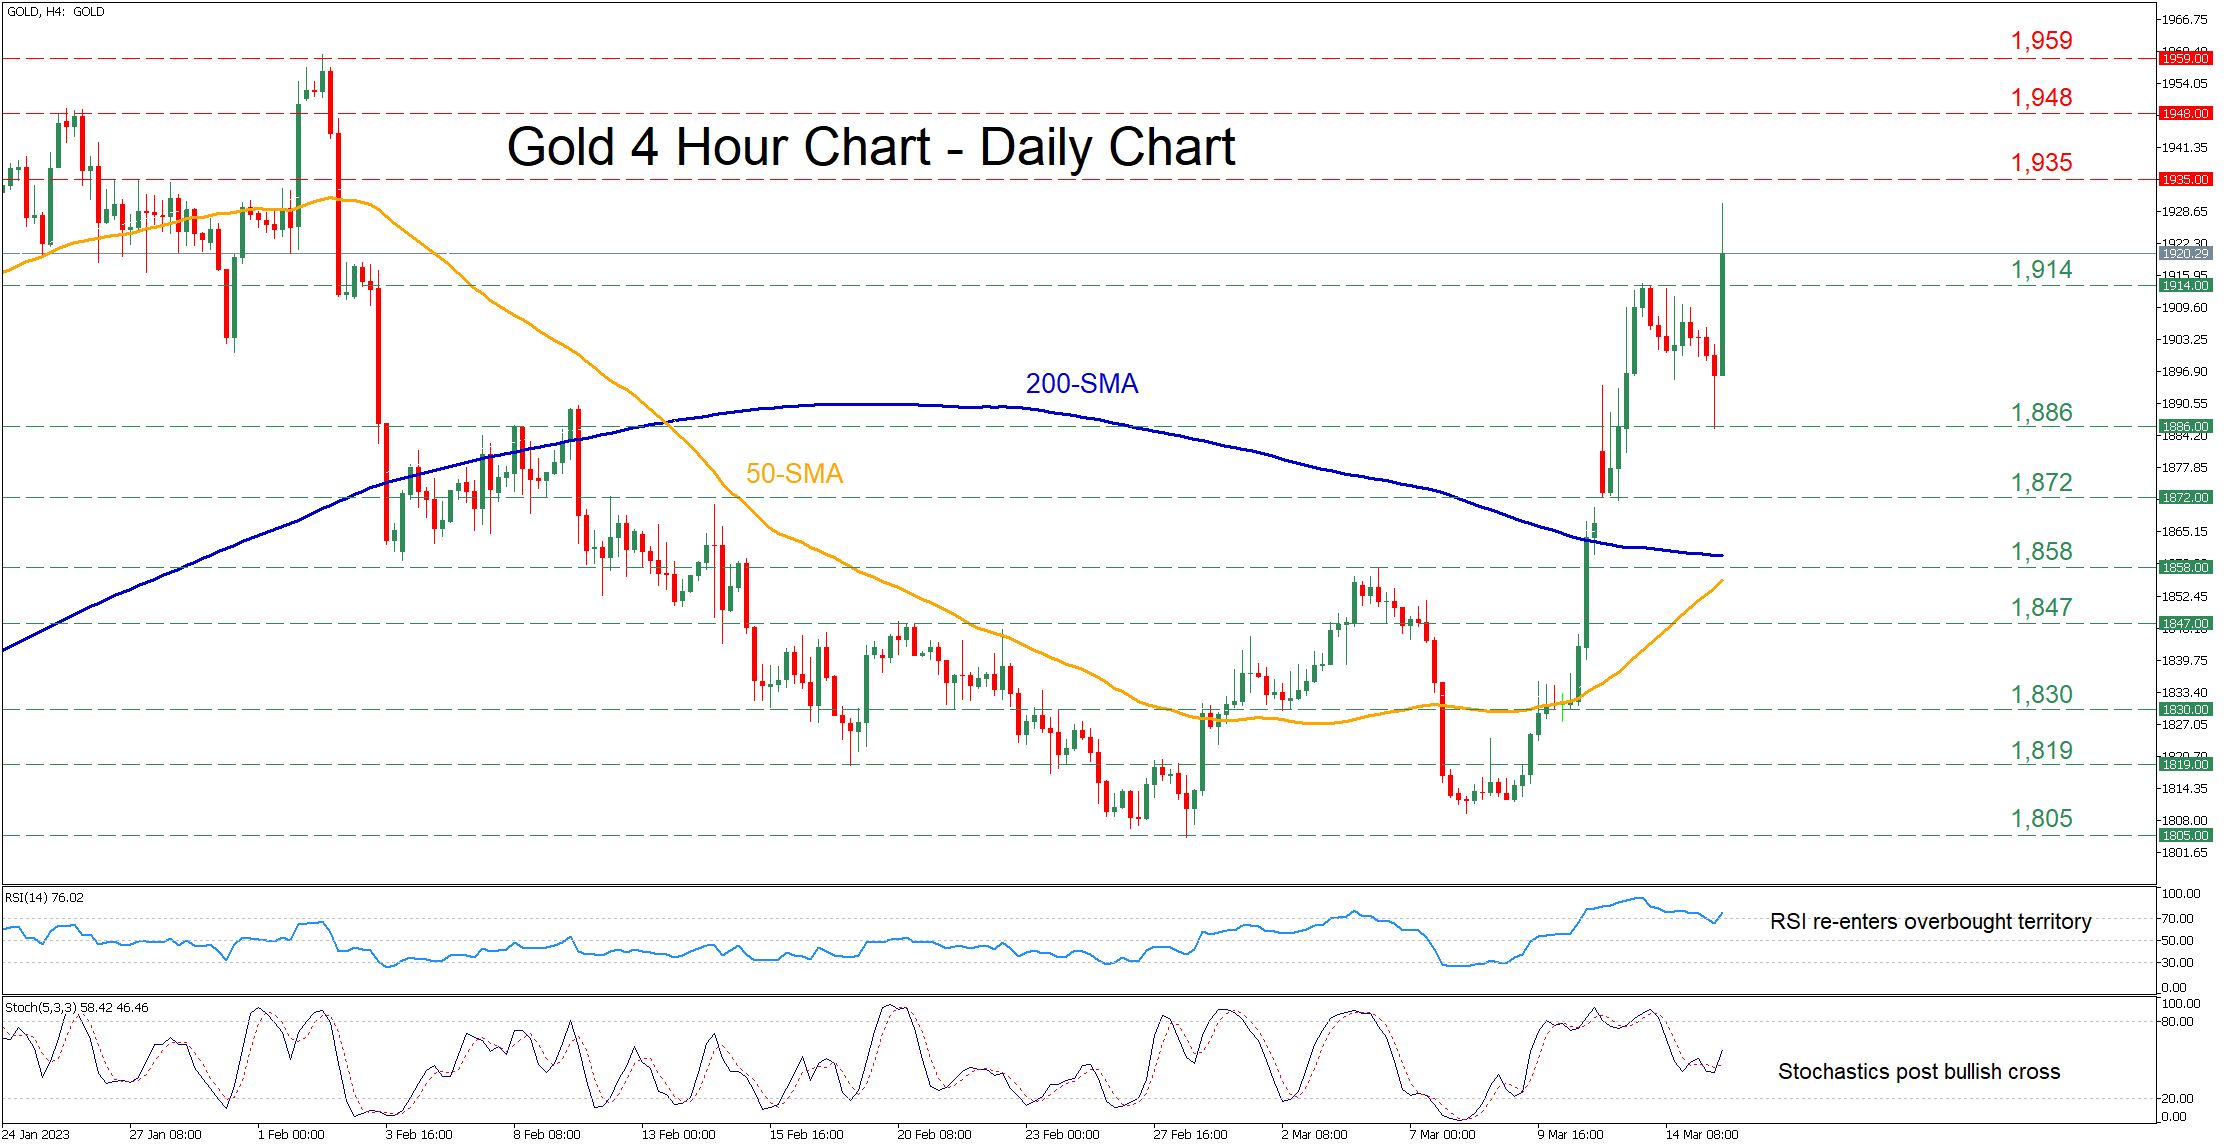
Gold has been in an uptrend in the four-hour chart, which temporarily paused near the 1,914 territory. However, gold spiked higher as markets turned pessimistic over Credit Suisse’s solvency, while technically, the ascending 50-period period moving average (SMA) is positively closing the gap with the 200-period SMA.
The momentum indicators are endorsing this bullish breakout. Specifically, the RSI is ascending sharply within the overbought zone, while the stochastic oscillator is sloping upwards after posting a bullish cross.
Should gold extend its advance, the 1,935 resistance territory could curb its upside. Surpassing that zone, the price might ascend to test the 1,948 barrier. Failing to stop there, the bulls might aim for the February peak of 1,959.
On the flipside, if sellers re-emerge and push the price lower, the resistance region of 1,914 could now act as support. Diving lower, the commodity could face the recent low of 1,886 before the spotlight turns to 1,872. Even lower, the 1,858 hurdle could provide downside protection.
Overall, gold appears ready to edge higher as the completion of a golden cross could boost bulls’ appetite. Nevertheless, short-term oscillators are currently approaching overbought territories, so a move to the downside could not be ruled out.
EUR/USD Mid-Day Outlook
Daily Pivots: (S1) 1.0691; (P) 1.0721; (R1) 1.0762; More...
Intraday bias in EUR/USD is back on the downside with today's sharp decline. Fall from 1.1032 is resuming through 1.0523 support. Main focus is now on support zone between 38.2% retracement of 0.9534 to 1.1032 at 1.0258 and 1.0482. Strong support from there, followed by rebound through 1.0759 resistance, will retain near term bullishness. However, sustained break of 1.0258 will complete a head and shoulder top (ls: 1.0733, h: 1.1032, rs: 1.0759). Outlook will be turned bearish for 61.8% retracement at 1.0106.
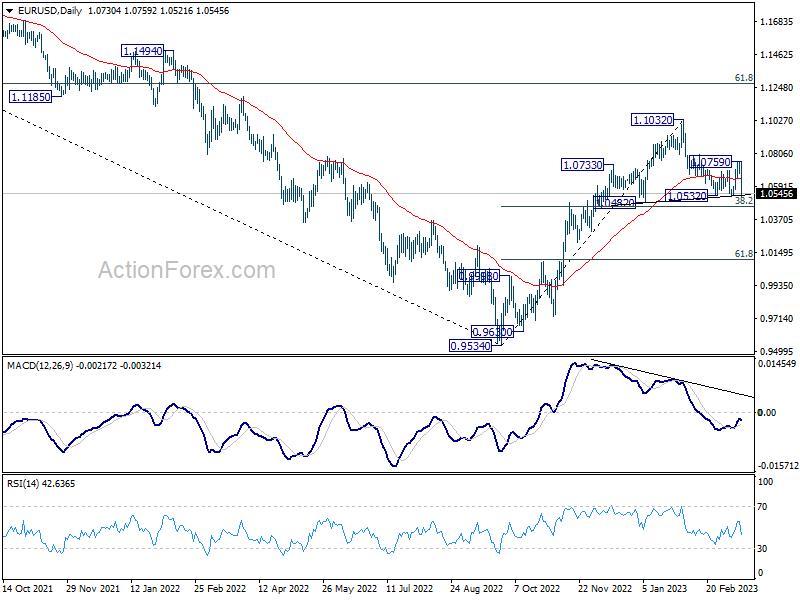
In the bigger picture, as long as 1.0482 support holds, rise from 0.9534 (2022 low) should continue to 61.8% retracement of 1.2348 (2021 high) to 0.9534 at 1.1273. However, sustained break of 1.0482 will bring deeper fall to 61.8% retracement of 0.9534 to 1.1032 at 1.0106, with risk of breaking through 0.9534 eventually.
GBP/USD Mid-Day Outlook
Daily Pivots: (S1) 1.2130; (P) 1.2166; (R1) 1.2196; More...
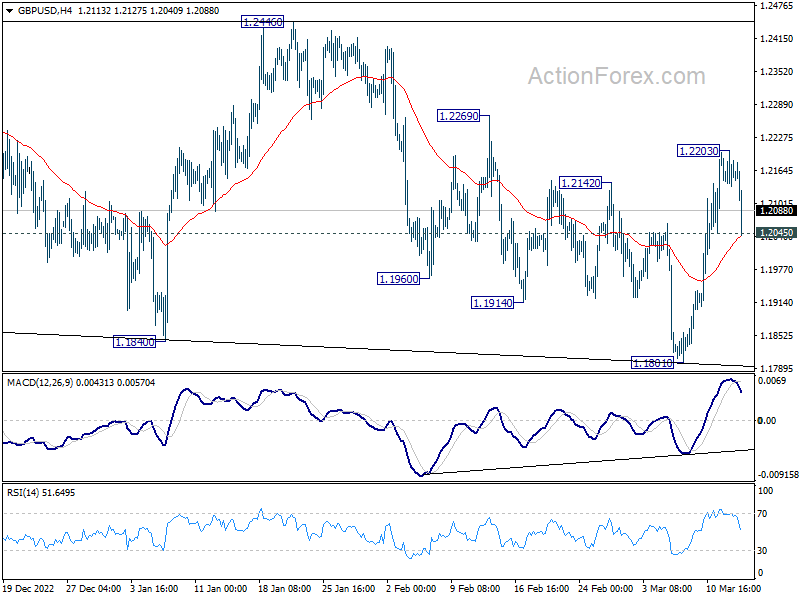
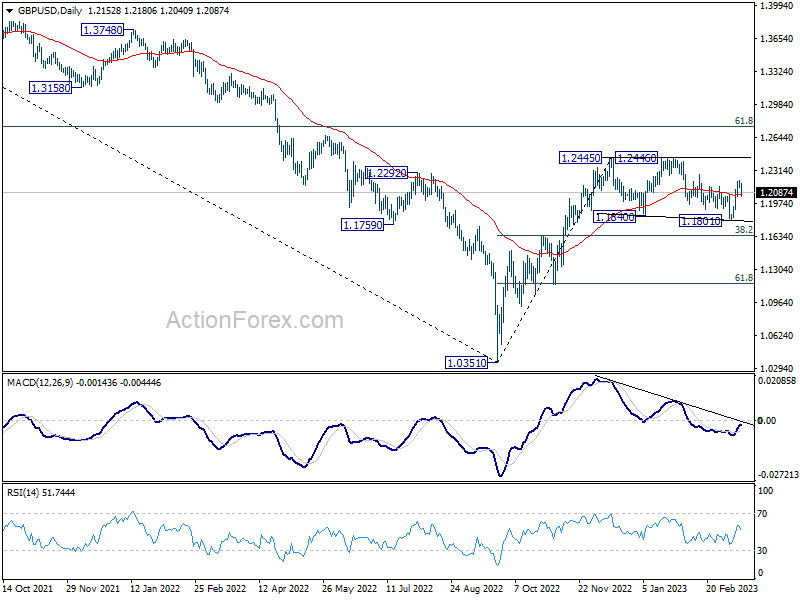
Intraday bias in GBP/USD stays neutral first as it's still holding on to 1.2045 support. On the upside, above 1.2203 will resume the rally from 1.2445/6 resistance zone next. However, decisive break of 1.2045 and 4 hour 55 EMA (now at 1.2039) will argue that the pattern from 1.2445 is extending with another falling leg, and turn bias to the downside for 1.1801 again.
In the bigger picture, price action from 1.2445 are seen as a corrective pattern to rise from 1.0351 medium term bottom (2022 low). Resumption is expected as a later stage and firm break of 1.2446 will target 61.8% retracement of 1.4248 (2021 high) to 1.0351 at 1.2759. This will remain the favored case as long as 38.2% retracement of 1.0351 to 1.2445 at 1.1645 holds.
USD/CHF Mid-Day Outlook
Daily Pivots: (S1) 0.9104; (P) 0.9134; (R1) 0.9173; More...
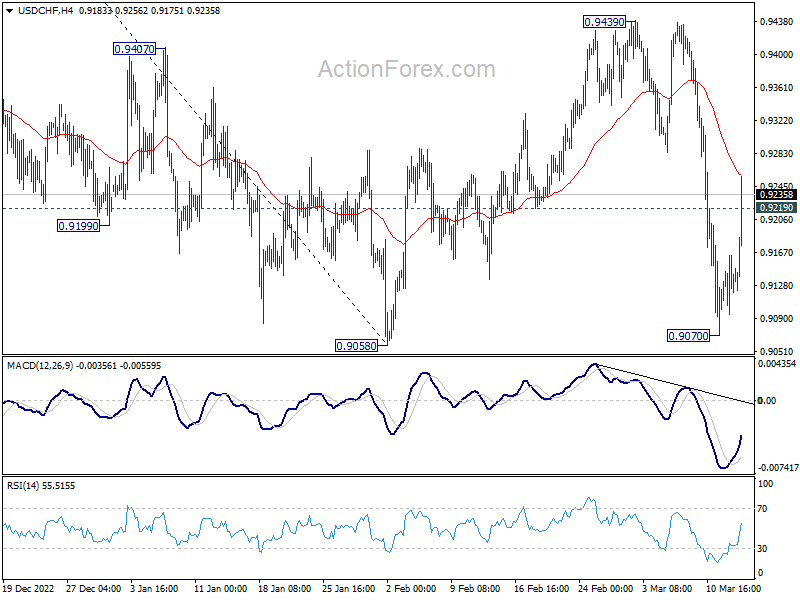
USD/CHF's break of 0.9219 resistance argues that fall from 0.9439 has completed at 0.9070, head of 0.9058 low. Intraday bias is back on the upside as corrective pattern from 0.9058 is now in another rising leg. Further rally should be seen to 55 day EMA (now at 0.9304) and above). But overall, outlook will stay bearish as long as 0.9474 fibonacci level holds, and another decline through 0.9058 is expected at a later stage.
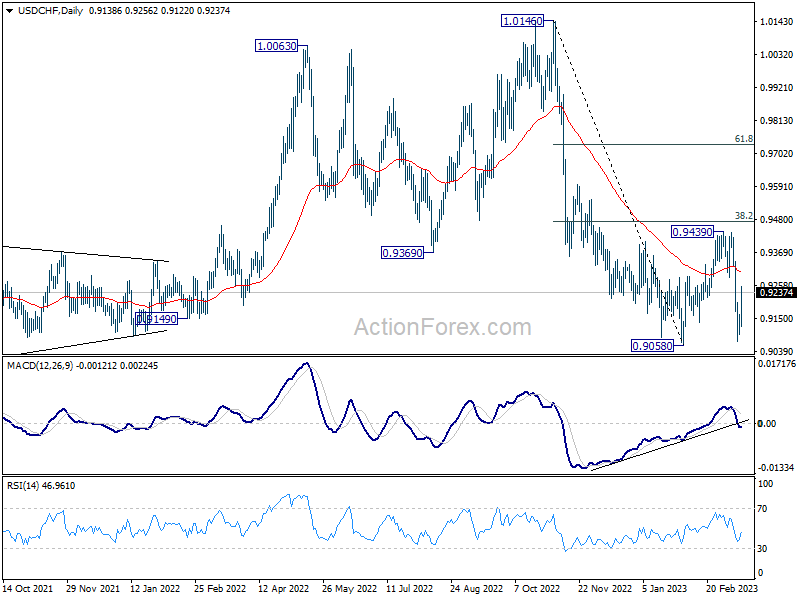
In the bigger picture, fall from 1.1046 (2022 high) is should still be in progress with 38.2% retracement of 1.0146 to 0.9058 at 0.9474 intact. Rejection by 55 week EMA is also a medium term bearish sign. Break of 0.9058 will resume such decline towards 0.8756 support (2021 low). But overall, such fall is still as a leg in the long term range pattern from 1.0342 (2016 high). So, downside should be contained by 0.8756 to bring reversal. For now, this will remain the favored case as long as 0.9439 resistance holds.
USD/JPY Mid-Day Outlook
Daily Pivots: (S1) 133.20; (P) 134.05; (R1) 135.06; More...
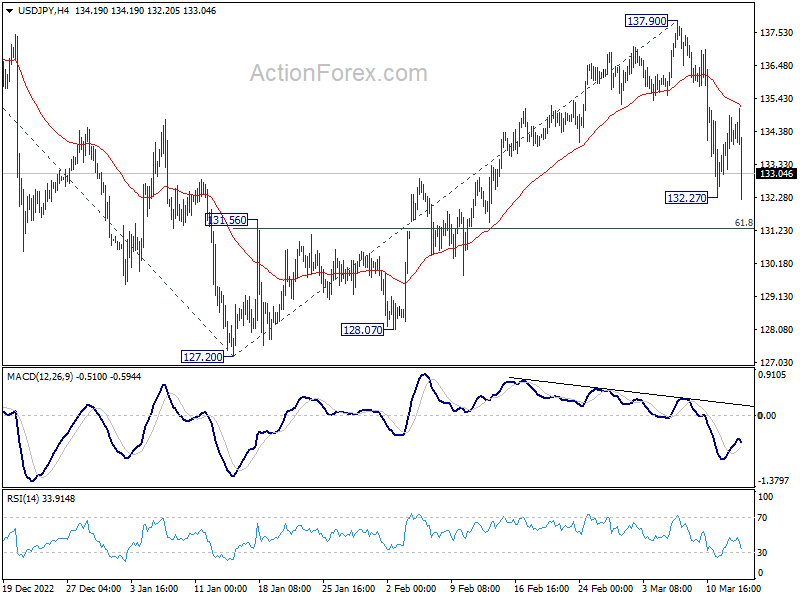
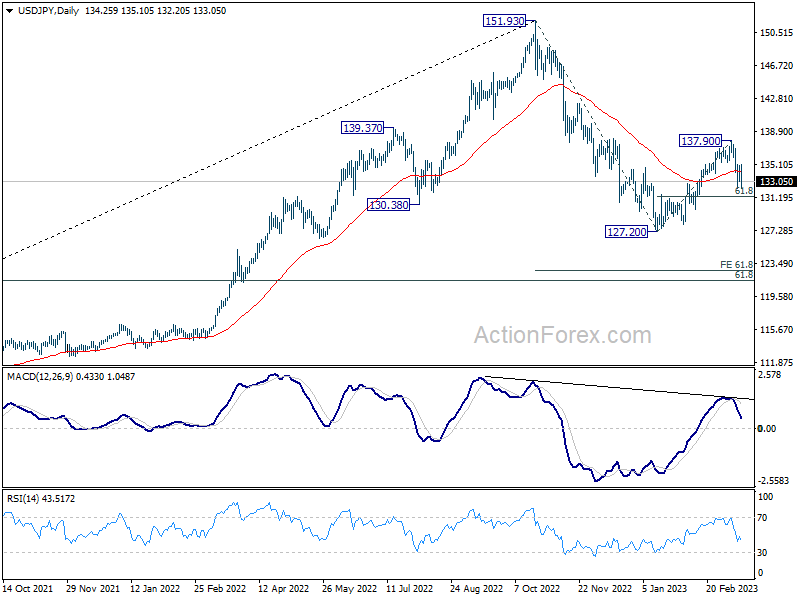
Intraday bias in USD/JPY remains neutral first as it's staying above 132.27 temporary low. Fall from 137.90 could still extend lower and break of 132.27 will target 61.8% retracement of 127.20 to 137.90 at 131.28. Sustained break there will pave the way to retest 127.20 low. Break of 137.90 resistance is needed to confirm resumption of the rally from 127.20, or risk will stay mildly on the downside.
In the bigger picture, rebound from 127.20 should have completed at 137.90 as a corrective move, with strong break of 55 day EMA. The down trend from 151.93 (2022 high) is not over yet. Break of 127.20 will resume this down trend and target 61.8% projection of 151.93 to 127.20 from 137.90 at 122.61. This will now be the favored case as long as 137.90 resistance holds.
US: Retail Sales Soften in February, Meeting Consensus Expectations
Retail sales declined 0.4% month-on-month (m/m) in February, bang on the median consensus forecast. January's reading was revised up to 3.2% (from 3.0%), balancing out today's loss.
Trade in the auto sector was weak, with sales at motor vehicle dealers declining by 1.8%, but from an upwardly revised reading of 7.1% in January (v. 5.9% m/m reported earlier). As we noted previously, this decline likely reflects seasonality distortions. Excluding autos, retail sales declined by 0.1%, on par with expectations.
Sales in other more volatile categories were also weaker in February. The building materials and equipment category fell 0.1% m/m while, sales at gasoline stations declined 0.6% m/m, despite stronger gas prices.
Retail sales in the "control group" which excludes the above categories and is used as a gauge in the BEA's estimation of personal consumption expenditures (PCE), rose by 0.5% m/m from an upwardly revised 2.3% m/m growth in January (+1.7% m/m reported previously). This was above the consensus forecast for a decline of 0.3% m/m.
- The largest contribution came from sales at non-store retailers (+1.6% m/m) and general merchandise stores (+0.5% m/m). Gains were also reported at food and beverage stores (+0.5% m/m) and health & personal care stores (+0.9% m/m).
- The rest of the categories were in the red in February with the biggest losses coming from categories that had oversized gains last month: furniture stores, electronics & appliance stores (-1.5% m/m) and miscellaneous stores retailers (-1.8% m/m).
Food services & drinking places – the only services category in today's report – was down 0.3% m/m, reflecting deceleration of demand growth as reported in the ISM Services.
Key Implications
On the surface it looks like consumers stopped spending in February, but with upward revisions in January, an average nominal growth for this quarter is 8.6% (annualized). We think that this strength is attributable to warmer weather and expect more give back in March. Still, strong momentum puts our estimates of real consumer spending on track to advance by 3.0% (annualized) in the first quarter.
This is the only official report on consumer demand before the FOMC members meet on March 21st. Looking at raw data in isolation, the Fed would have been deliberating on the choice between a 25- or 50-point rate hike. However, the collapse of the SVB and Signature Bank, which today transmitted to the global banking system, made financial stability equally, if not more important than price stability, shifting the debate to whether hike at all. We think that the Fed won't be able to ignore the recent acceleration in demand, which is ultimately helping to fuel price pressures, and will raise the policy rate by 25 basis points in March.
EUR/JPY Mid-Day Outlook
Daily Pivots: (S1) 142.92; (P) 143.67; (R1) 144.79; More....
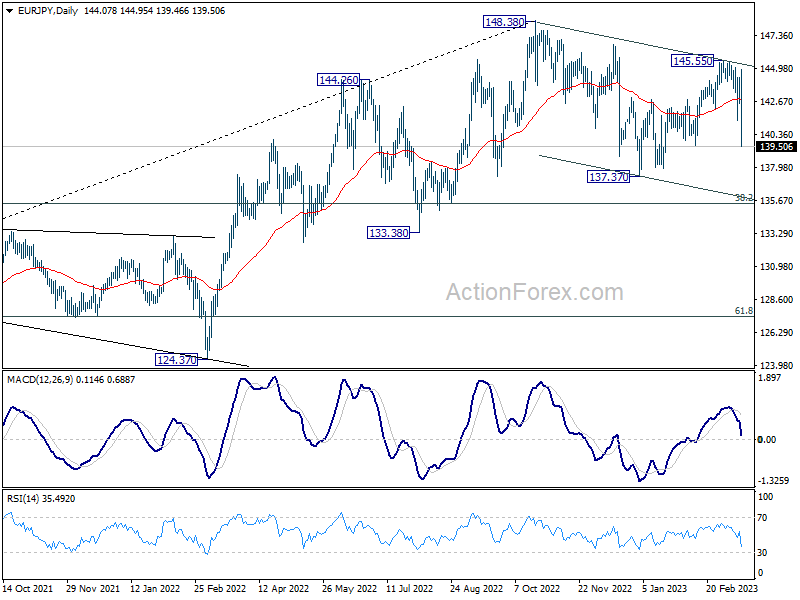
EUR/JPY's steep decline today and strong break of 141.36 confirms resumption of the decline from 145.55. The development also solidify the case that whole correction from 148.38 is in its third leg. Intraday bias is back on the downside for retesting 137.37 low, and then 135.40 fibonacci level. For now, risk will stay heavily on the downside as long as 141.36 resistance holds.
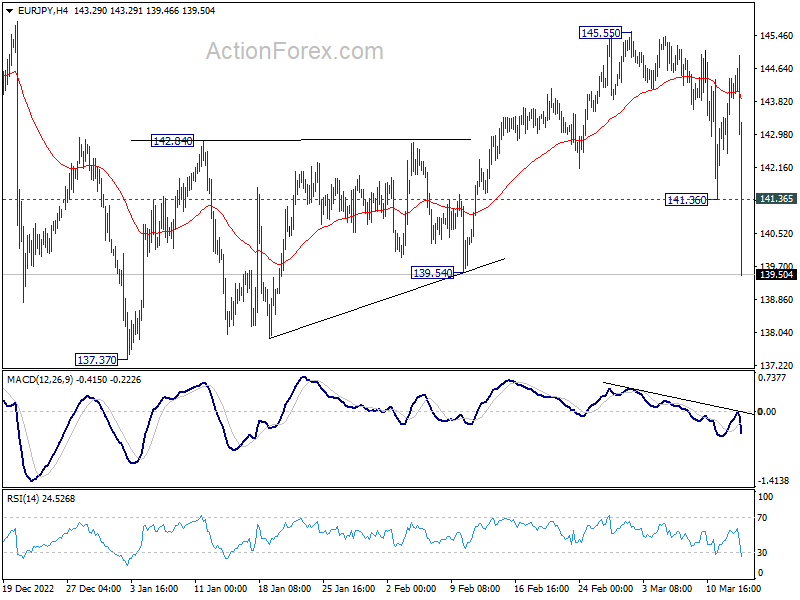
In the bigger picture, as long as 55 week EMA (now at 139.54) holds, larger up trend from 114.42 (2020 low) is still in progress for 149.76 long term resistance. However, firm break of 55 week EMA will bring deeper fall to 38.2% retracement of 114.42 to 148.38 at 135.40. Sustained break there will raise the chance of trend reversal, and target 61.8% retracement at 127.39.