Sample Category Title
EUR/USD Daily Outlook
Daily Pivots: (S1) 1.0516; (P) 1.0566; (R1) 1.0595; More...
Intraday bias in EUR/USD remains on the downside at this point. Fall from 1.1032 is in progress for 38.2% retracement of 0.9534 to 1.1032 at 1.0463. Strong support could be seen around there to bring rebound, at least on first attempt. Break of 1.0668 support turned resistance will turn bias back to the upside for 1.0803 resistance and above. However, sustained break of 1.0463 will carry larger bearish implications.
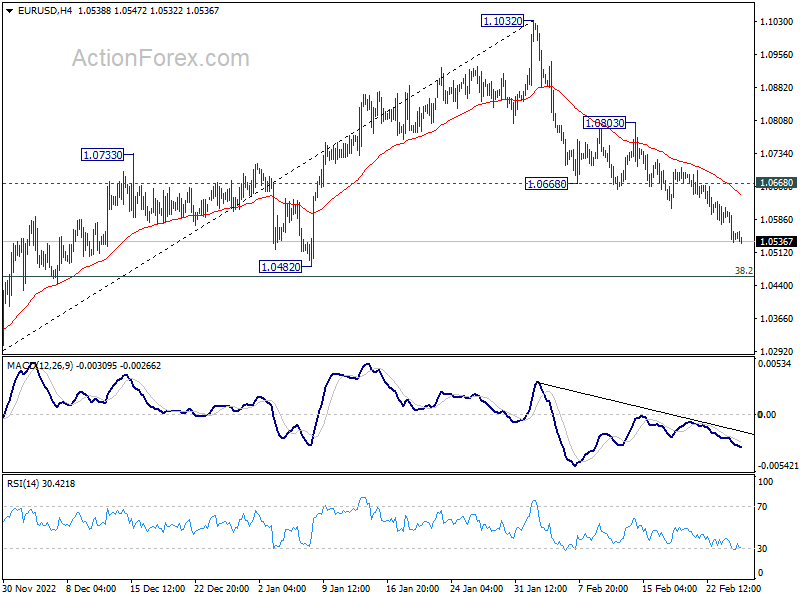
In the bigger picture, as long as 1.0482 support holds, rise from 0.9534 (2022 low) should continue to 61.8% retracement of 1.2348 (2021 high) to 0.9534 at 1.1273. However, sustained break of 1.0482 will bring deeper fall to 61.8% retracement of 0.9534 to 1.1032 at 1.0106, even as a corrective pull back.
GBP/USD Daily Outlook
Daily Pivots: (S1) 1.1899; (P) 1.1971; (R1) 1.2012; More...
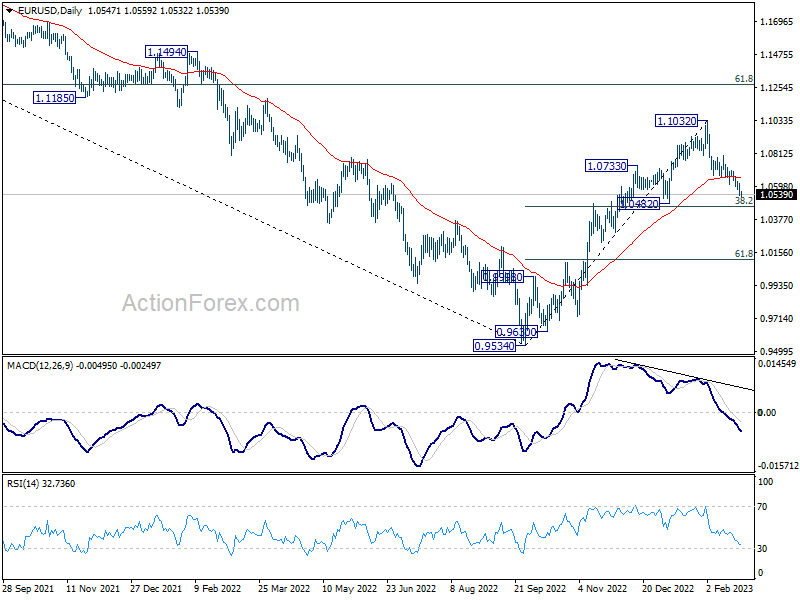
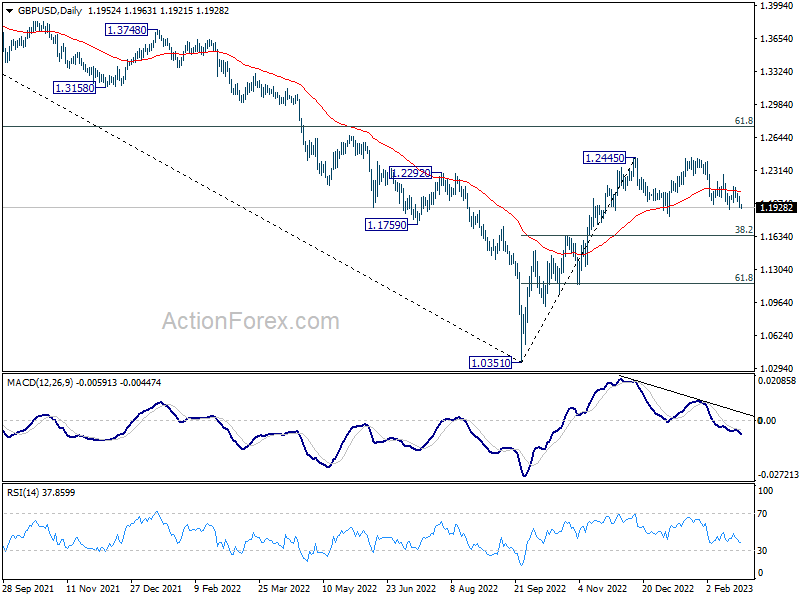
Intraday bias in GBP/USD is mildly on the downside with focus on 1.1914 support. Firm break there will resume the decline from 1.2446 for 1.1840 support and possibly below. On the upside, break of 1.2146 resistance will turn bias back to the upside for further rebound to 1.2269 and above.
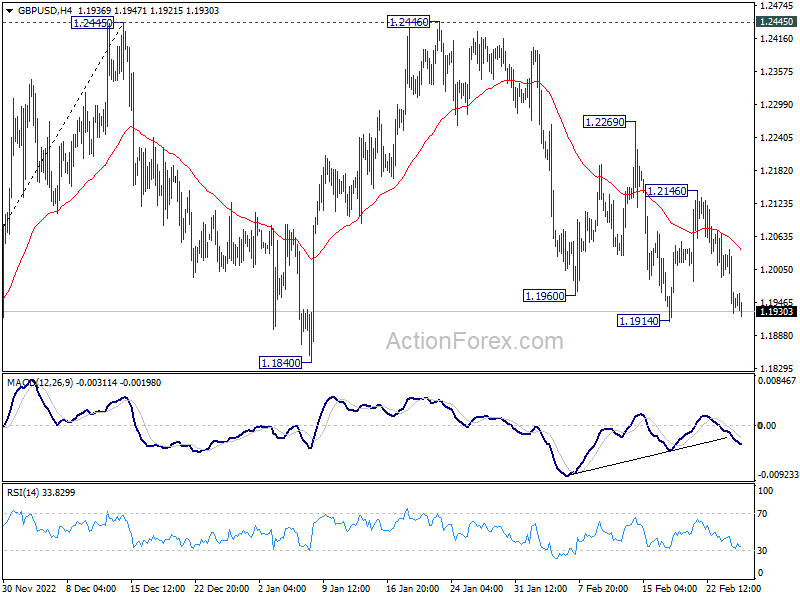
In the bigger picture,as long as 1.1840 support holds, rise from 1.0351 medium term bottom (2022 low) should still continue to 61.8% retracement of 1.4248 (2021 high) to 1.0351 at 1.2759. However, decisive break of 1.1840 will complete a double top pattern (1.2445, 1.2446) after rejection by 55 week EMA (now at 1.2251). Deeper decline should be seen back to 38.2% retracement of 1.0351 to 1.2445 at 1.1645.
USD/CHF Daily Outlook
Daily Pivots: (S1) 0.9354; (P) 0.9383; (R1) 0.9441; More...
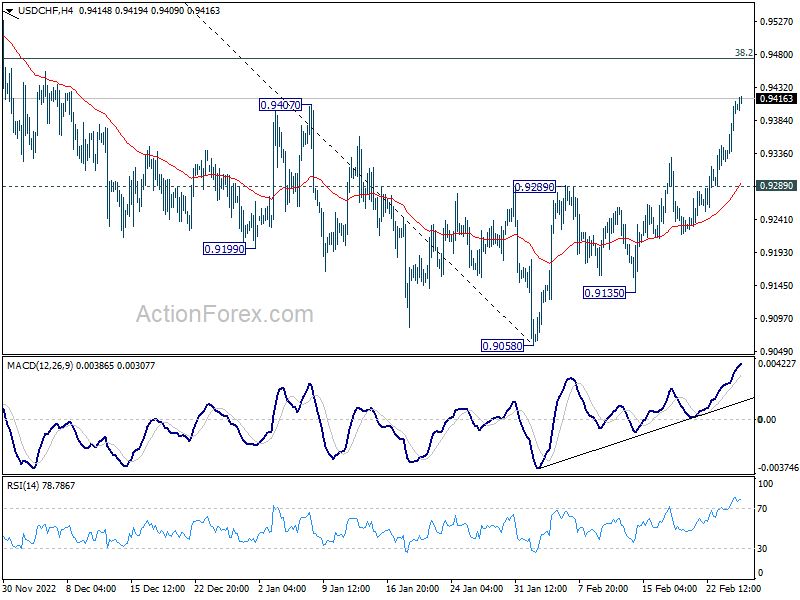
Intraday bias in USD/CHF remains on the upside for 38.2% retracement of 1.0146 to 0.9058 at 0.9474. Decisive break there will carry larger bullish implications and target 61.8% retracement at 0.9730. On the downside, break of 0.9289 resistance turned support is needed to indicate completion of the rebound. Otherwise, further rally will remain in favor in case of retreat.
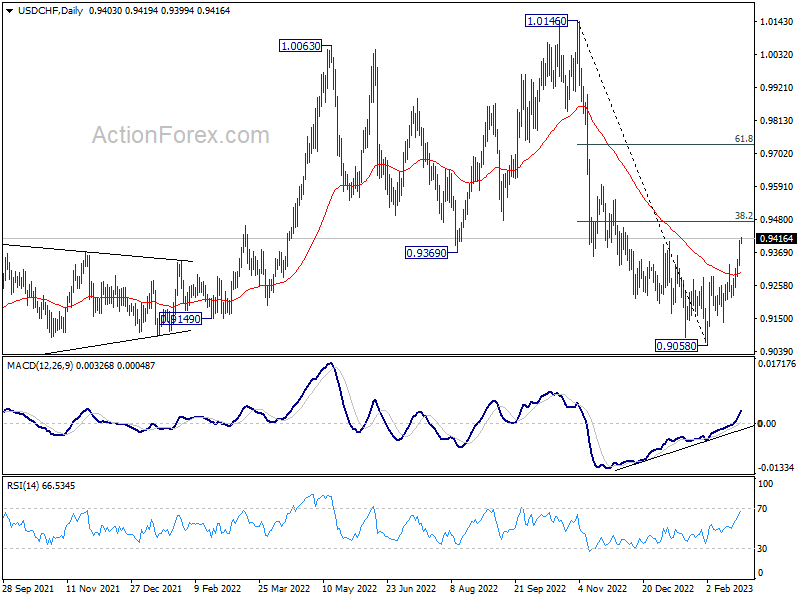
In the bigger picture, decline from 1.0146 is seen as part of a long term sideway pattern. As long as 38.2% retracement of 1.0146 to 0.9058 at 0.9474 holds, another fall is in favor through 0.9058. However, sustained trading above 0.9474 will indicate that the medium term trend has reversed, and open up further rally to 61.8% retracement at 0.9730 and above.
USD/JPY Daily Outlook
Daily Pivots: (S1) 134.87; (P) 135.69; (R1) 137.33; More...
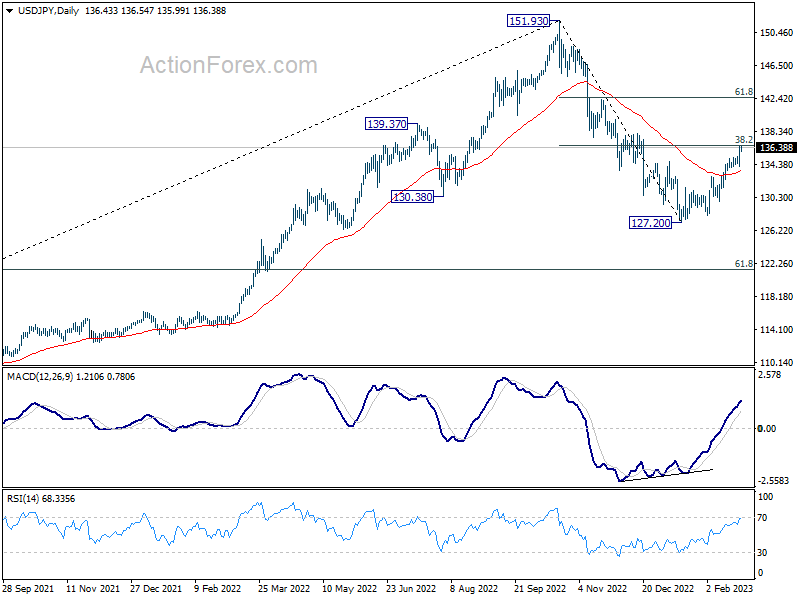
Intraday bias in USD/JPY remains on the upside as rise from 127.20 is in progress. Immediate focus is on 38.2% retracement of 151.93 to 127.20 at 136.64. Rejection by this fibonacci level, followed by break of 134.04 support, will argue that such rebound from 127.20 has completed, and turn bias back to the downside. However, sustained trading above 136.64 will indicate that fall from 151.93 has completed, and bring further rally to 61.8% retracement at 142.48.
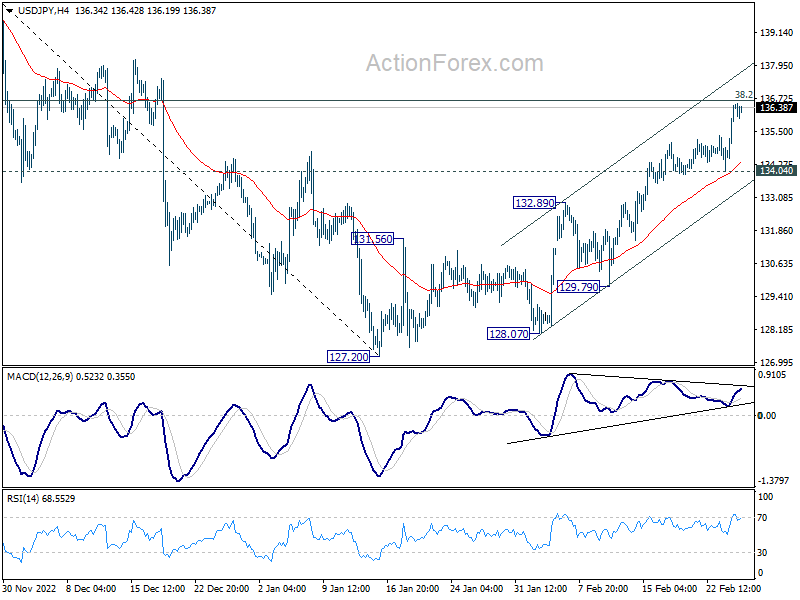
In the bigger picture, focus is now on 38.2% retracement of 151.93 to 127.20 at 136.64. Sustained break there will indicate that price actions from 151.93 medium term are merely a corrective pattern. Such development will maintain long term bullishness. Rejection by 136.64 will, on the downside, extend the fall from 151.93 to 61.8% retracement of 102.58 to 151.93 at 121.43 at a later stage.
USD/CAD Daily Outlook
Daily Pivots: (S1) 1.3534; (P) 1.3600; (R1) 1.3672; More....
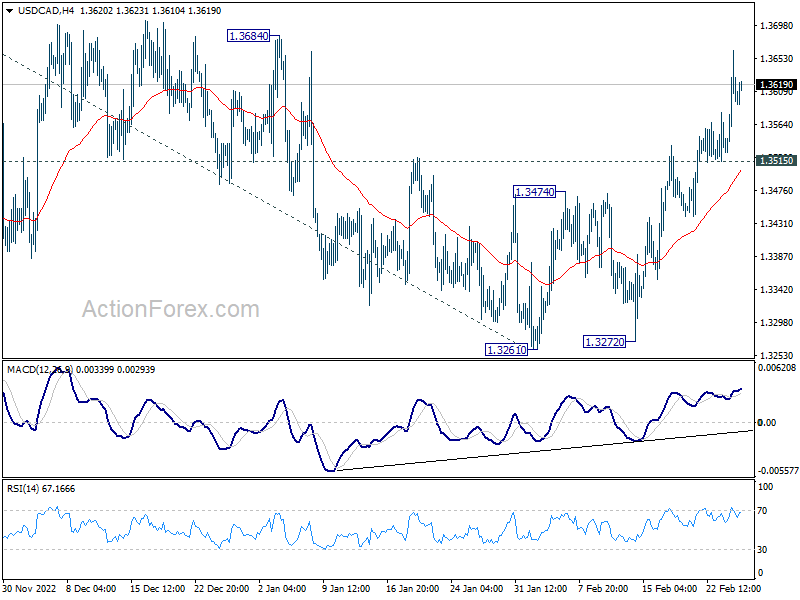
USD/CAD's rally from 1.3261 is in progress and intraday bias stays on the upside for 1.3684 resistance. As noted before, corrective pattern from 1.3976 should have completed at 1.3261. Firm break of 1.3684 will bring retest of 1.3976 high. In case of retreat, further rally will remain in favor as long as 1.3515 support holds.
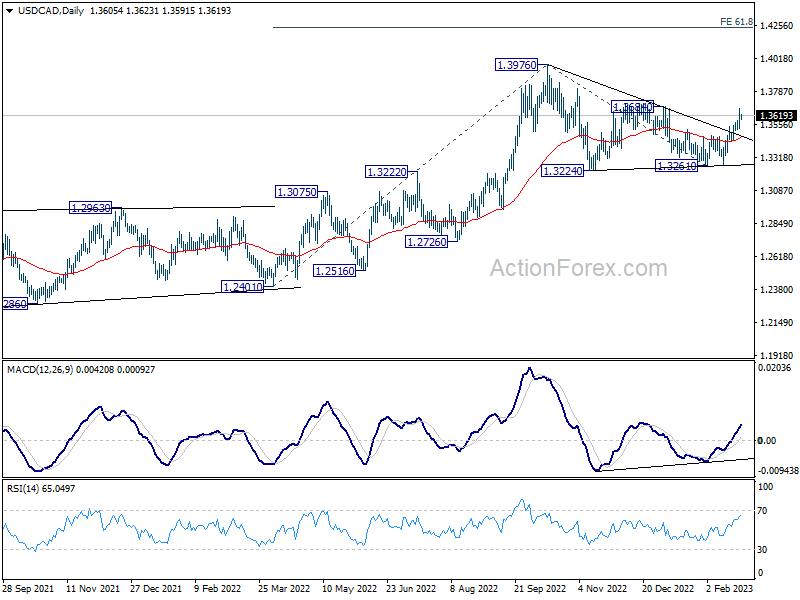
In the bigger picture, outlook stays bullish with 1.3222 cluster support (38.2% retracement of 1.2005 to 1.3976 at 1.3223) intact. Break of 1.3976 resistance will resume larger up trend from 1.2005 (2021 low) to 61.8% projection of 1.2401 to 1.3976 from 1.3261 at 1.4234.
AUD/USD Daily Report
Daily Pivots: (S1) 0.6688; (P) 0.6756; (R1) 0.6793; More...
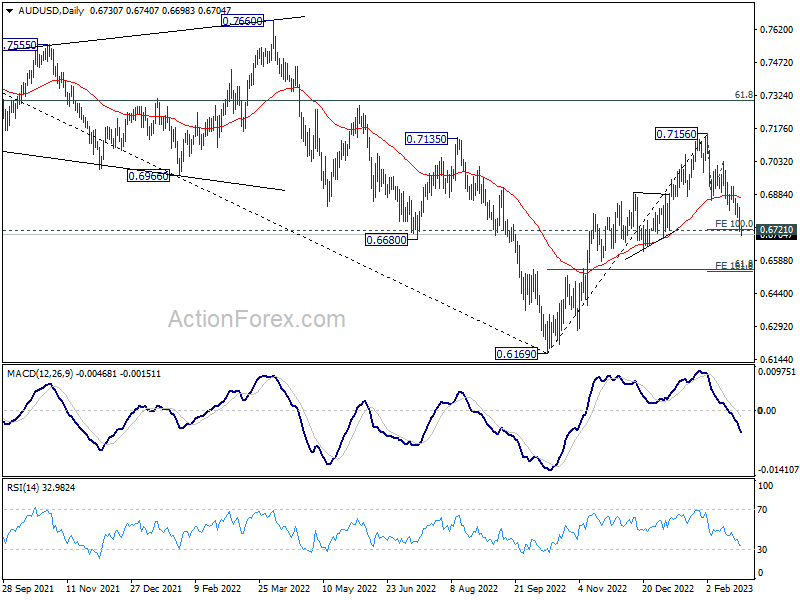
AUD/USD's fall from 0.7156 continues today and breaks 0.6721 support. Current development argues that near term trend could be reversing. Intraday bias stays on the downside. Deeper decline would be seen to 161.8% projection of of 0.6854 to 0.7028 from 0.6854 at 0.6539. On the upside, break of 0.6854 support turned resistance is needed to indicate completion of the fall, or risk will stay on the downside in case of recovery.
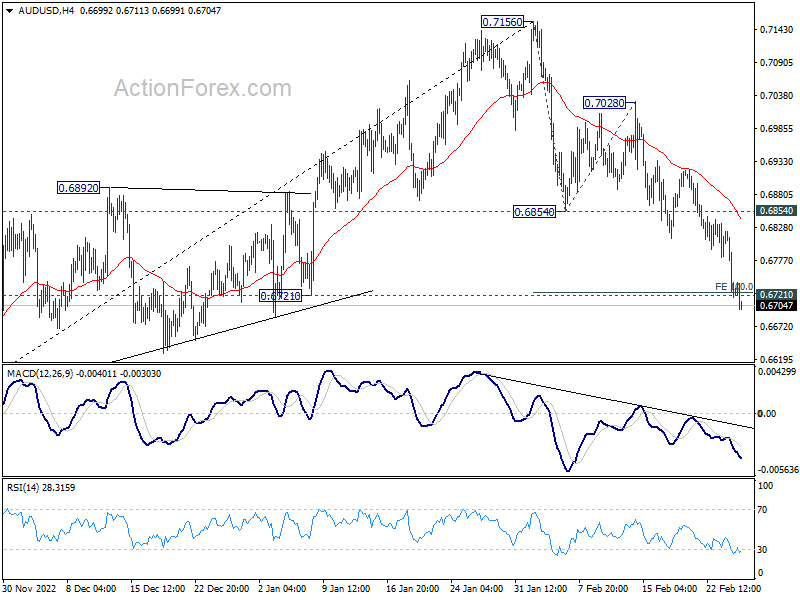
In the bigger picture, focus is now on 0.6721 structural support. Sustained break there will argue that whole rise from 0.6169 (2022 low) has completed at 0.7156, after rejection by 55 month EMA (now at 0.7179). Deeper decline would then be see back to 61.8% retracement of 0.6169 to 0.7156 at 0.6546, even as a corrective fall. Nevertheless, strong rebound from current level will retain medium term bullishness for another rise through 0.7156 later.
NZD Down after Poor Retail Sales, USD Extending Rally
Commodity currencies are experiencing selling pressure in Asian trading due to mild risk off sentiment. New Zealand Dollar is under added pressure following poor retail sales data. US Dollar and Japanese Yen are currently among the stronger currencies, with the latter showing little reaction to the dovish remarks made by the incoming BoJ Governor. Meanwhile, the European majors are showing a mixed performance, with Sterling having a slight advantage.
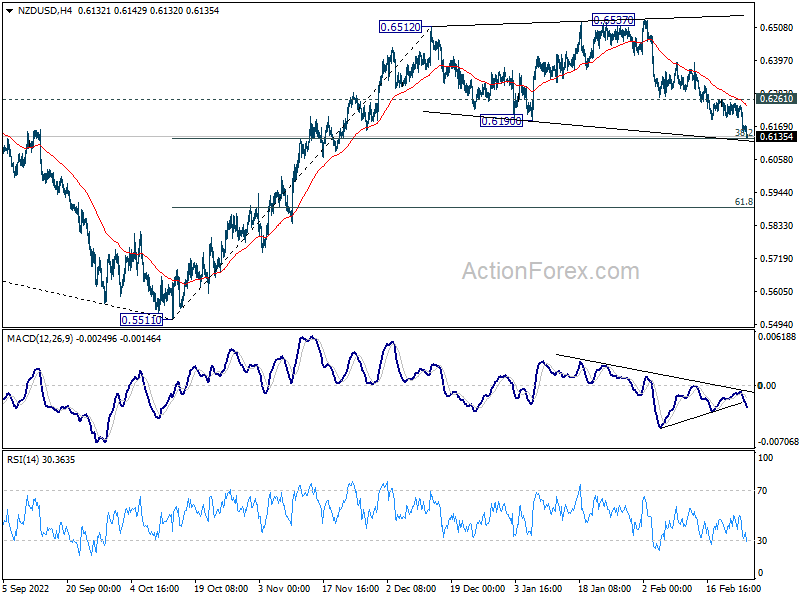
Technically, NZD/USD is extending the decline from 0.6537 and it's pressing key fibonacci level at 38.2% retracement of 0.5511 to 0.6512 at 0.6130. Strong support could be seen there to bring rebound, and break of 0.6261 resistance will indicate short term bottoming. However, sustained break of 0.6130 increase the likelihood of bearish reversal and lead to a deeper fall towards the 61.8% retracement at 0.5893.
In Asia, Nikkei closed down -0.11%. Hong Kong HSI is down -0.67%. China Shanghai SSE is down -0.23%. Singapore Strait Times is down -0.31%. Japan 10-year JGB yield is down -0.0011 at 0.504.
ECB Visco: If we need to be more restrictive, we'll be more restrictive
ECB Governing Council member Ignazio Visco told Bloomberg TV on Saturday, "I don't think that we can indicate now what the terminal rate will be, not even if it'll be 3.5%, 3.25% or 3.75%, because really it is data-dependent.
"Our objective is to go back to an inflation rate of 2% in the medium term. If we need to be more restrictive, we'll be more restrictive," he said.
Visco said "determined" steps are needed in Q2. "We have to be sure that core inflation isn't remaining at this high level... This may induce wage increases beyond what is compatible with a medium-term 2% inflation rate, which is our target. So that is why we are observing this with a lot of care — but I'm not worried."
BoJ Ueda: Benefits of current policy exceed the costs
Incoming BoJ Governor Kazuo Ueda told the upper house of parliament today, "there's still some distance for Japan to see inflation sustainably and stably meet the BoJ's 2% target."
"Big improvements must be made in Japan's trend inflation for the BoJ to shift towards monetary tightening," he said."It's not that I have no ideas on how to tweak the BoJ's current policy. But the desirable tweak will vary depending on economic changes at the time."
"In guiding monetary policy, central banks must weigh the benefits and costs of each step," Ueda said. "At present, the benefits of the BoJ's current policy exceed the costs."
"There are various side-effects emerging, but the BoJ's current policy is necessary and appropriate" to achieve its 2% inflation target, he said.
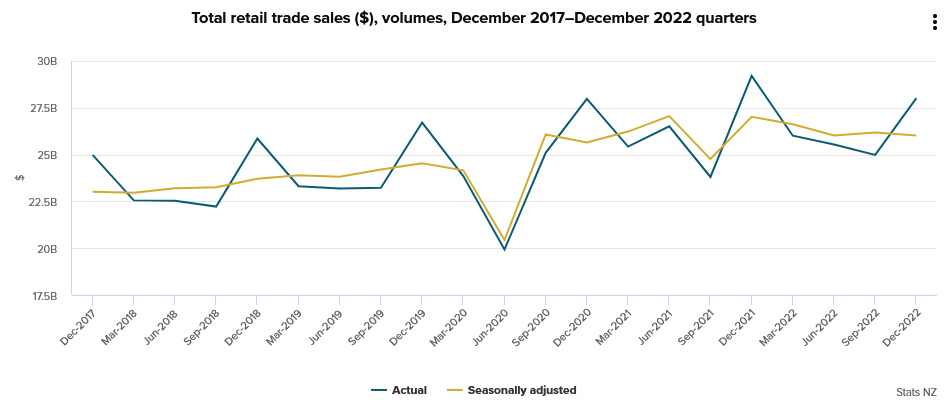
NZ retail sales volume dropped -0.6% qoq in Q4, value up 1.7% qoq
New Zealand retail sales volume dropped -0.6% qoq in Q4, below expectation of 0.2% qoq rise. Retail sales value rose 1.7% qoq.
By industry, the largest movements in sales volume were: electrical and electronic goods retailing (down -9.7%), motor vehicle and parts retailing (up 2.3%), food and beverage services (up 2.4%), fuel retailing (up 2.6%), furniture, floor coverings, houseware, and textile goods (down -5.2%).
Focuses turn back to economic data
Major focuses will turn back economic data this week. Most attention will be on US consumer confidence and ISMs, Eurozone CPI flash', Canada GDP, Australia CPI and GDP, New Zealand retail sales and business confidence, and. China PMIs
ECB minutes will also be watched closely. But they'll likely just repeat that March move would be a 50bps rate hike. Beyond that, the path will depend on incoming data and economic outlook, in particular the economic projections to be published at next meeting.
Here are some highlights for the week:
- Monday: New Zealand retail sales; Eurozone M3 money supply; Canada current account; US durable goods orders, pending home sales.
- Tuesday: Japan industrial production, retail sales, housing starts; New Zealand ANZ business confidence; Australia current account, retail sales; Germany import prices; France GDP, consumer spending; Swiss GDP, KOF economic barometer; Canada GDP, US goods trade balance, house price index, Chicago PMI; consumer confidence.
- Wednesday: New Zealand building permits; Australia GDP, CPI; Japan PMI manufacturing final; China PMIs, Caixin PMI manufacturing; Germany CPI flash; Swiss retail sales, PMI manufacturing; Eurozone PMI manufacturing final; UK PMI manufacturing final, mortgage approvals; Canada PMI manufacturing; US ISM manufacturing, construction spending.
- Thursday: Australia building approvals; Japan monetary base, capital spending, consumer confidence; Eurozone CPI flash, unemployment rate, ECB meeting accounts; US jobless claims.
- Friday: Japan Tokyo CPI, unemployment rate; China Caixin PMI services; Germany trade balance; France industrial production; Eurozone PMI services final, PPI; UK PMI services final; Canada building permits, labor productivity; US ISM services.
AUD/USD Daily Report
Daily Pivots: (S1) 0.6688; (P) 0.6756; (R1) 0.6793; More...
AUD/USD's fall from 0.7156 continues today and breaks 0.6721 support. Current development argues that near term trend could be reversing. Intraday bias stays on the downside. Deeper decline would be seen to 161.8% projection of of 0.6854 to 0.7028 from 0.6854 at 0.6539. On the upside, break of 0.6854 support turned resistance is needed to indicate completion of the fall, or risk will stay on the downside in case of recovery.
In the bigger picture, focus is now on 0.6721 structural support. Sustained break there will argue that whole rise from 0.6169 (2022 low) has completed at 0.7156, after rejection by 55 month EMA (now at 0.7179). Deeper decline would then be see back to 61.8% retracement of 0.6169 to 0.7156 at 0.6546, even as a corrective fall. Nevertheless, strong rebound from current level will retain medium term bullishness for another rise through 0.7156 later.
Economic Indicators Update
| GMT | Ccy | Events | Actual | Forecast | Previous | Revised |
|---|---|---|---|---|---|---|
| 21:45 | NZD | Retail Sales Q/Q Q4 | -0.60% | 0.20% | 0.40% | 0.60% |
| 21:45 | NZD | Retail Sales ex Autos Q/Q Q4 | -1.30% | 0.30% | 0.40% | 0.50% |
| 00:30 | AUD | Company Gross Operating Profits Q/Q Q4 | 10.60% | 1.50% | -12.40% | -11.50% |
| 09:00 | EUR | Eurozone M3 Money Supply Y/Y Jan | 4.20% | 4.10% | ||
| 10:00 | EUR | Eurozone Economic Sentiment Indicator Feb | 101 | 99.9 | ||
| 10:00 | EUR | Eurozone Industrial Confidence Feb | 2 | 1.3 | ||
| 10:00 | EUR | Eurozone Services Sentiment Feb | 12.4 | 10.7 | ||
| 10:00 | EUR | Eurozone Consumer Confidence Feb F | -19 | -19 | ||
| 13:30 | CAD | Current Account (CAD) Q4 | -11.0B | -11.1B | ||
| 13:30 | USD | Durable Goods Orders Jan | -4.00% | 5.60% | ||
| 13:30 | USD | Durable Goods Orders ex Transportation Jan | 0.00% | -0.20% | ||
| 15:00 | USD | Pending Home Sales M/M Jan | 0.90% | 2.50% |
BoJ Ueda: Benefits of current policy exceed the costs
Incoming BoJ Governor Kazuo Ueda told the upper house of parliament today, "there's still some distance for Japan to see inflation sustainably and stably meet the BoJ's 2% target."
"Big improvements must be made in Japan's trend inflation for the BoJ to shift towards monetary tightening," he said."It's not that I have no ideas on how to tweak the BoJ's current policy. But the desirable tweak will vary depending on economic changes at the time."
"In guiding monetary policy, central banks must weigh the benefits and costs of each step," Ueda said. "At present, the benefits of the BoJ's current policy exceed the costs."
"There are various side-effects emerging, but the BoJ's current policy is necessary and appropriate" to achieve its 2% inflation target, he said.
Technical Outlook and Review
USD/JPY:
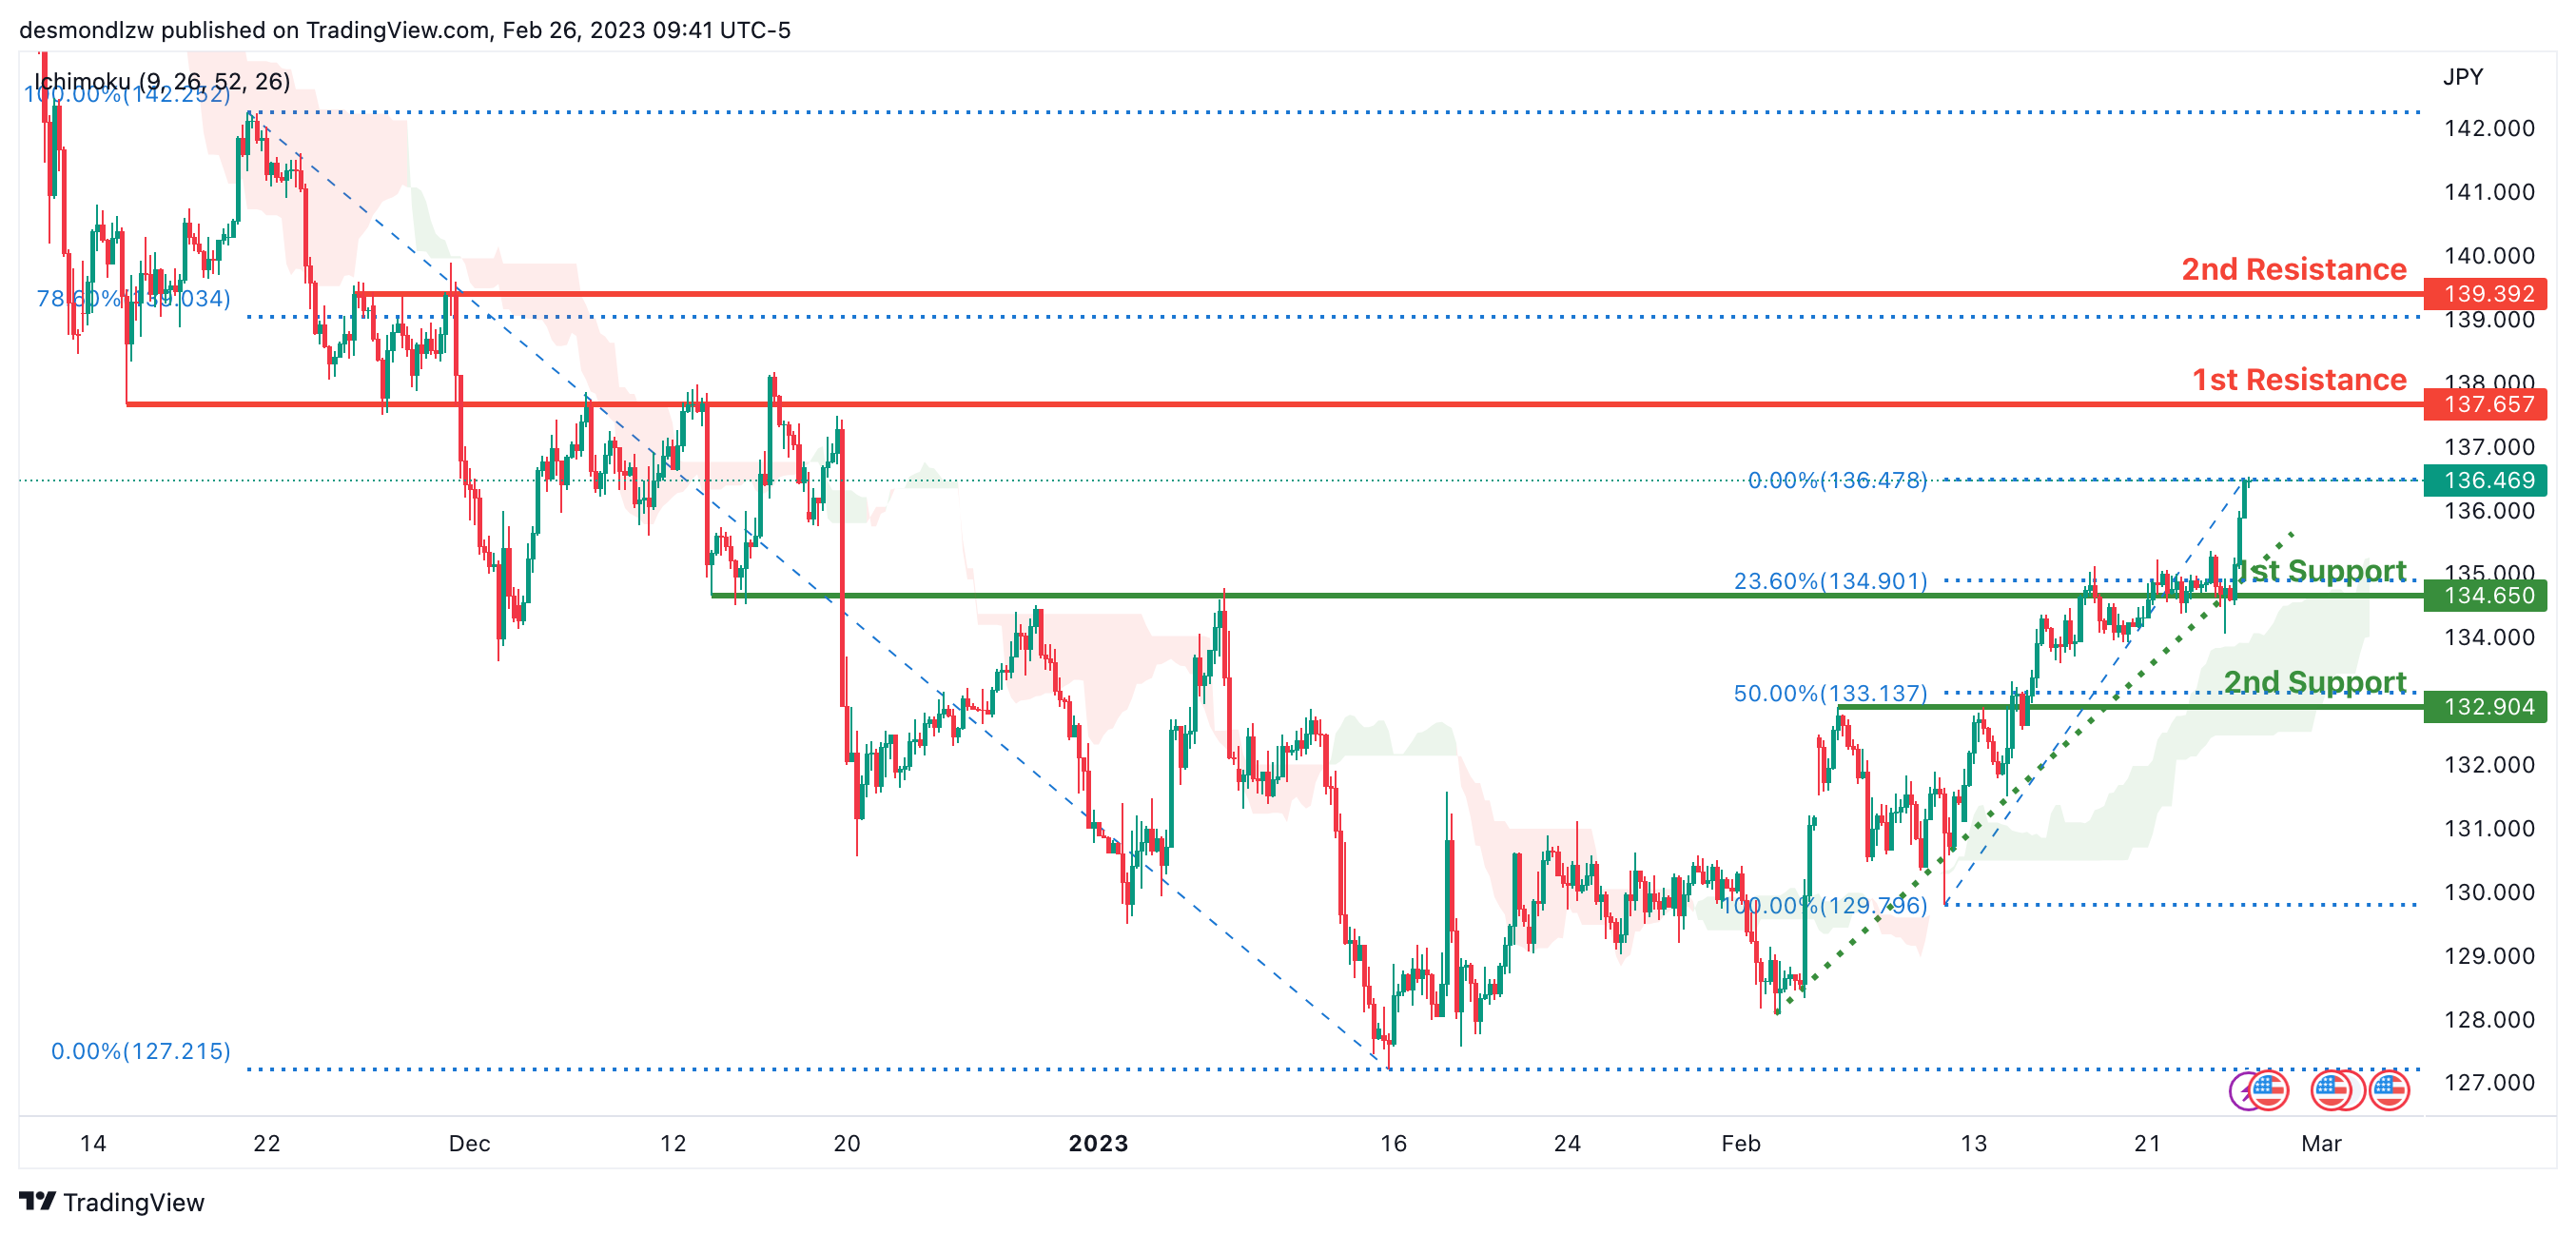
Looking at the H4 chart, my overall bias for USDJPY is bullish due to the current price being above the Ichimoku cloud, indicating a bullish market. To add confluence to this bias, price is also along an ascending trendline.If this bullish momentum continues, expect the price to continue heading towards the 1st resistance at 137.657, where the overlap resistance is.
In an alternate scenario, price could possibly head back down to retest the 1st support at 134.650, where the overlap support intersects with the 23.6% Fibonacci line.
Areas of consideration:
- H4 time frame, 1st resistance at 137.657
- H4 time frame, 1st support at 134.650
DXY:
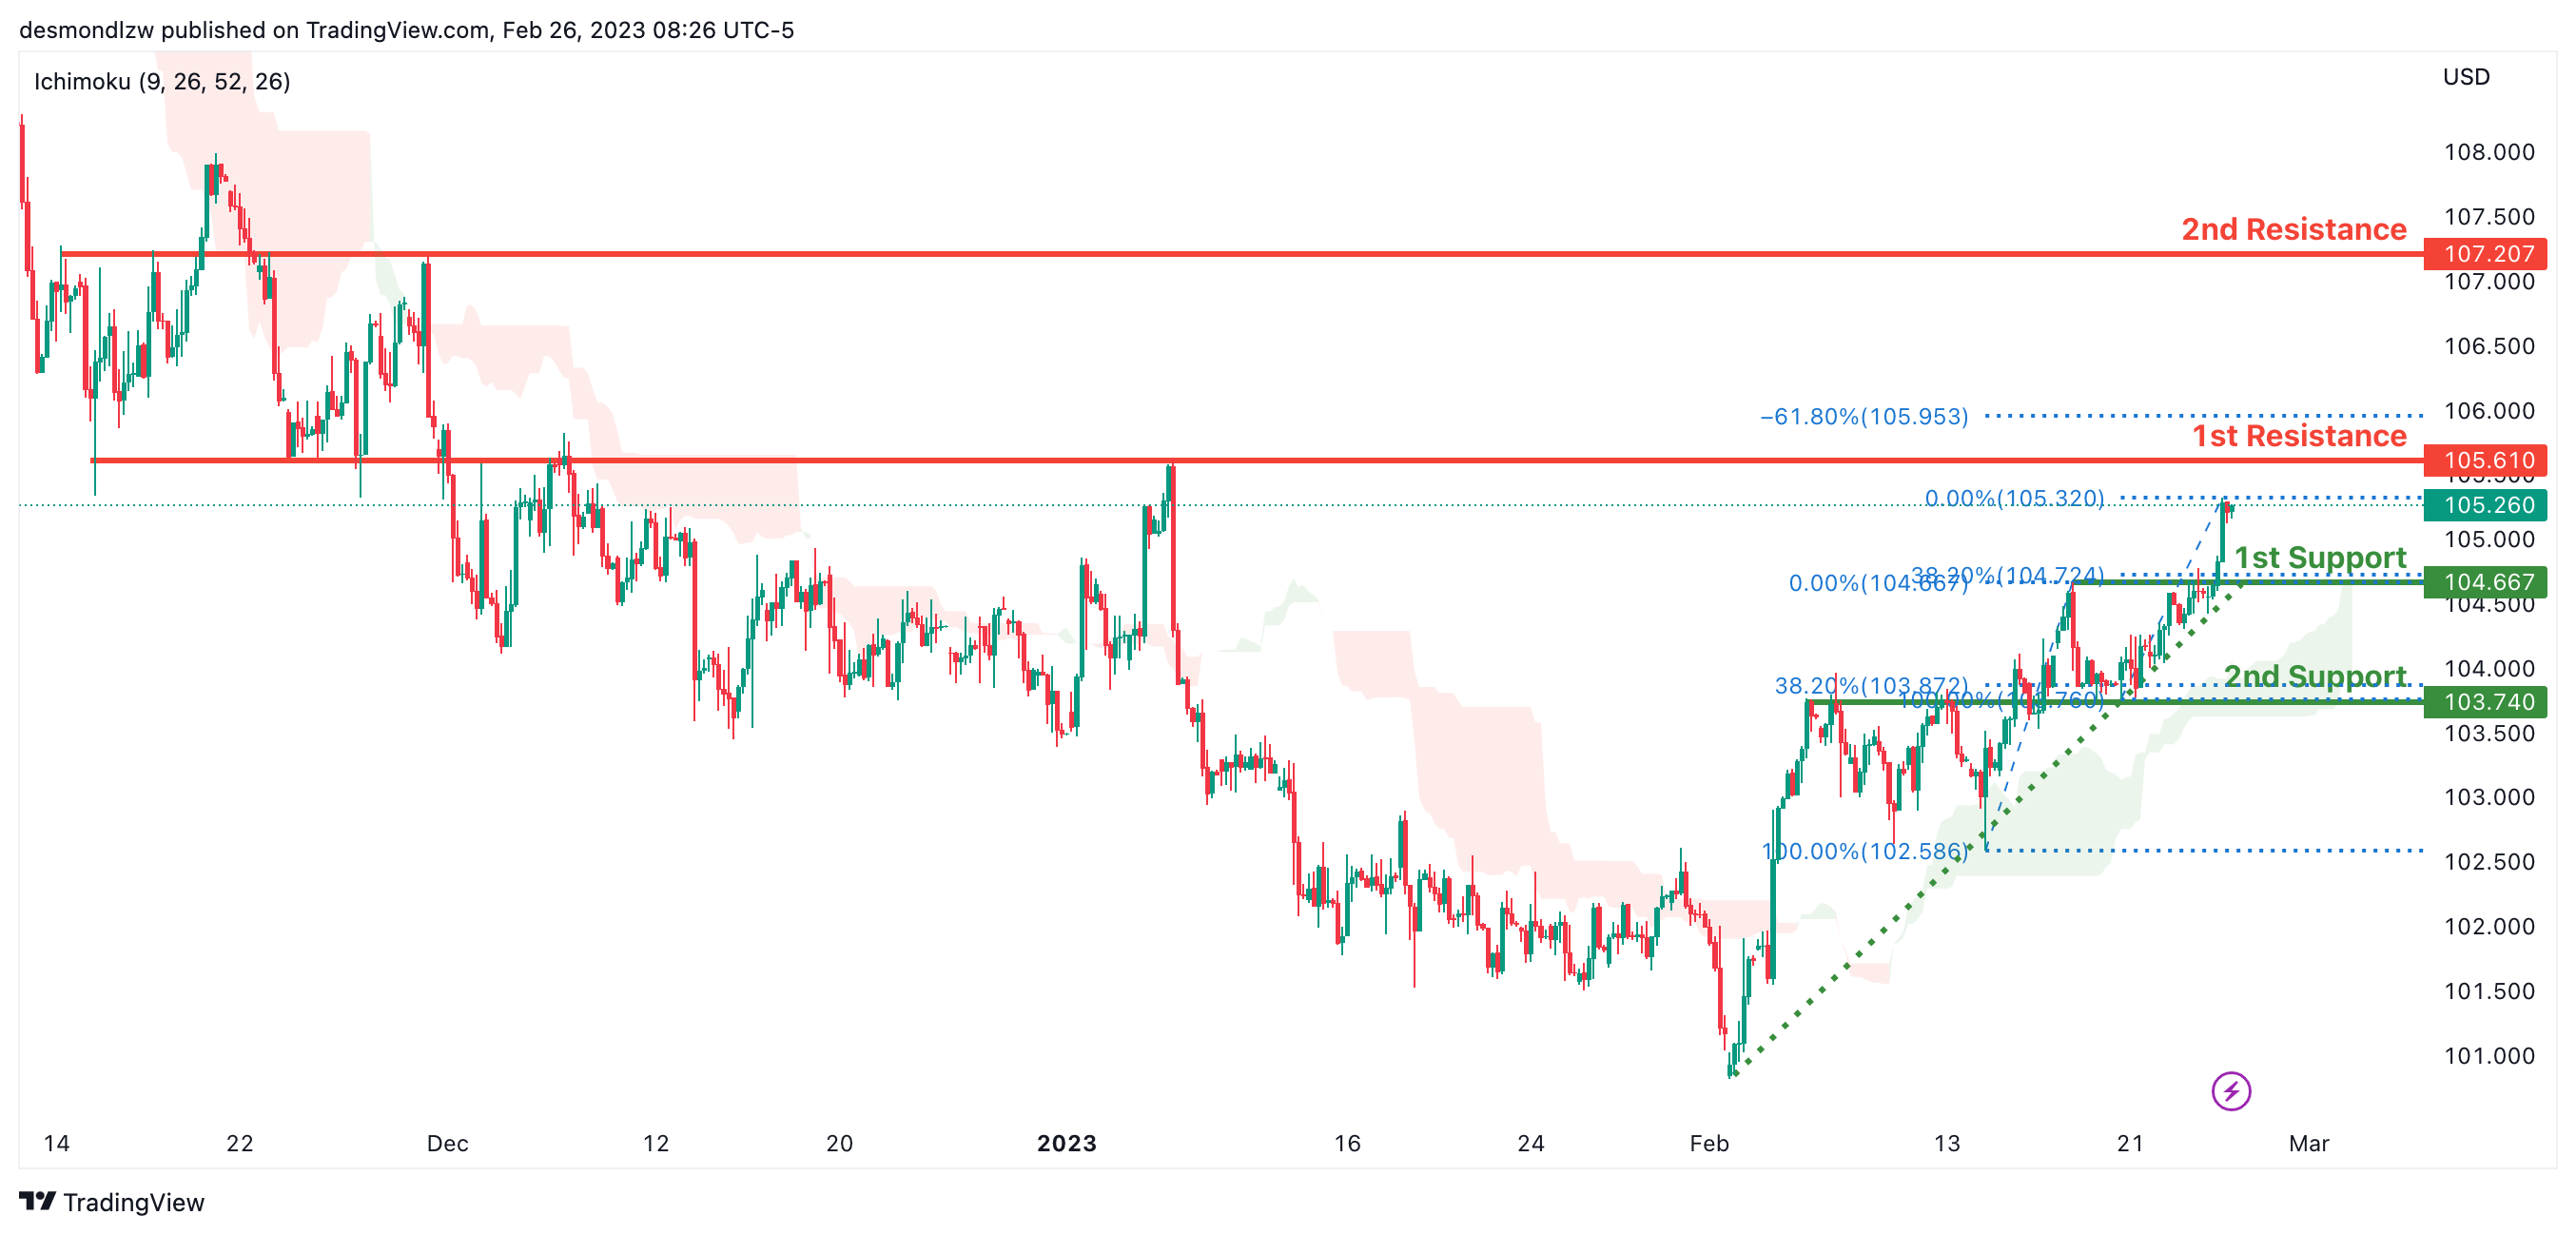
Looking at the H4 chart, my overall bias for DXY is bullish due to the current price crossing above the Ichimoku cloud, indicating a bullish market. To add confluence to this bias, price is also along an ascending trendline.If this bullish momentum continues, expect the price to possibly break the 1st resistance at 105.610, where the overlap resistance and 78.6% Fibonacci line is before heading towards the 2nd resistance at 107.207 which is the overlap resistance.
In an alternative scenario, price could head back down to retest the 1st support at 104.667, where the overlap support and 38.2% Fibonacci line is.
Areas of consideration:
- H4 time frame, 1st resistance at 105.610
- H4 time frame, 2nd resistance at 107.207
- H4 time frame, 1st support at 104.667
EUR/USD:
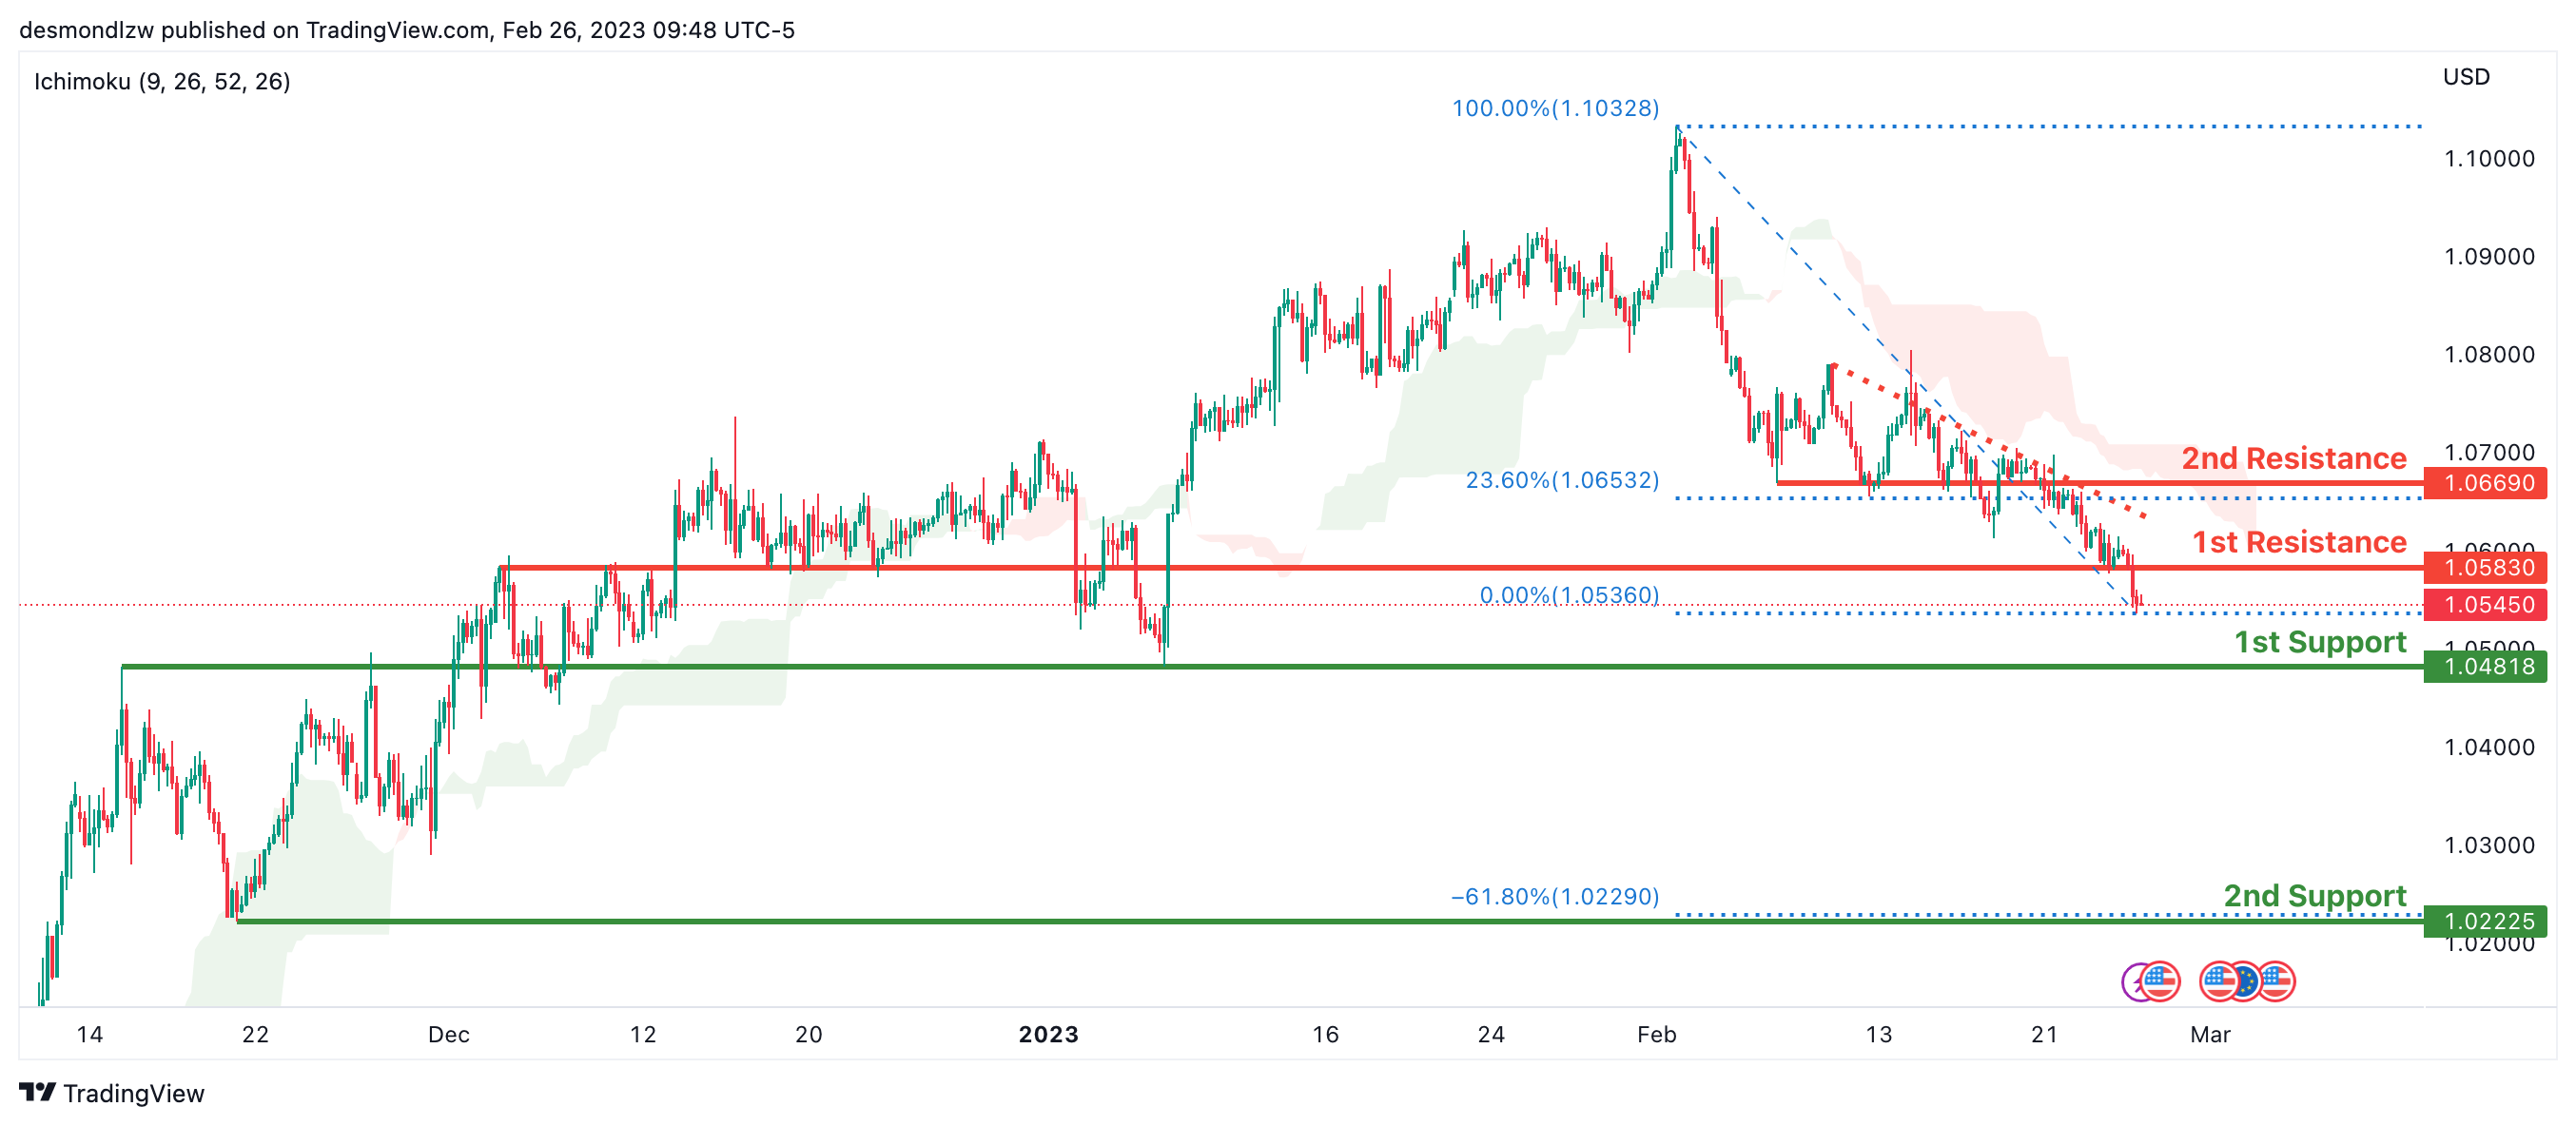
Looking at the H4 chart, my overall bias for EURUSD is bearish due to the current price crossing below the Ichimoku cloud, indicating a bearish market structure. To add confluence to this bias, price is also along a descending trendline.If this bearish momentum continues, expect the price to head towards the 1st support at 1.04818 which is the overlap support.
In an alternate scenario, price could possibly head back up to retest the 1st resistance at 1.05830, where the overlap resistance is.
Areas of consideration :
- H4 1st resistance at 1.05830
- H4 1st support at 1.04818
GBP/USD:
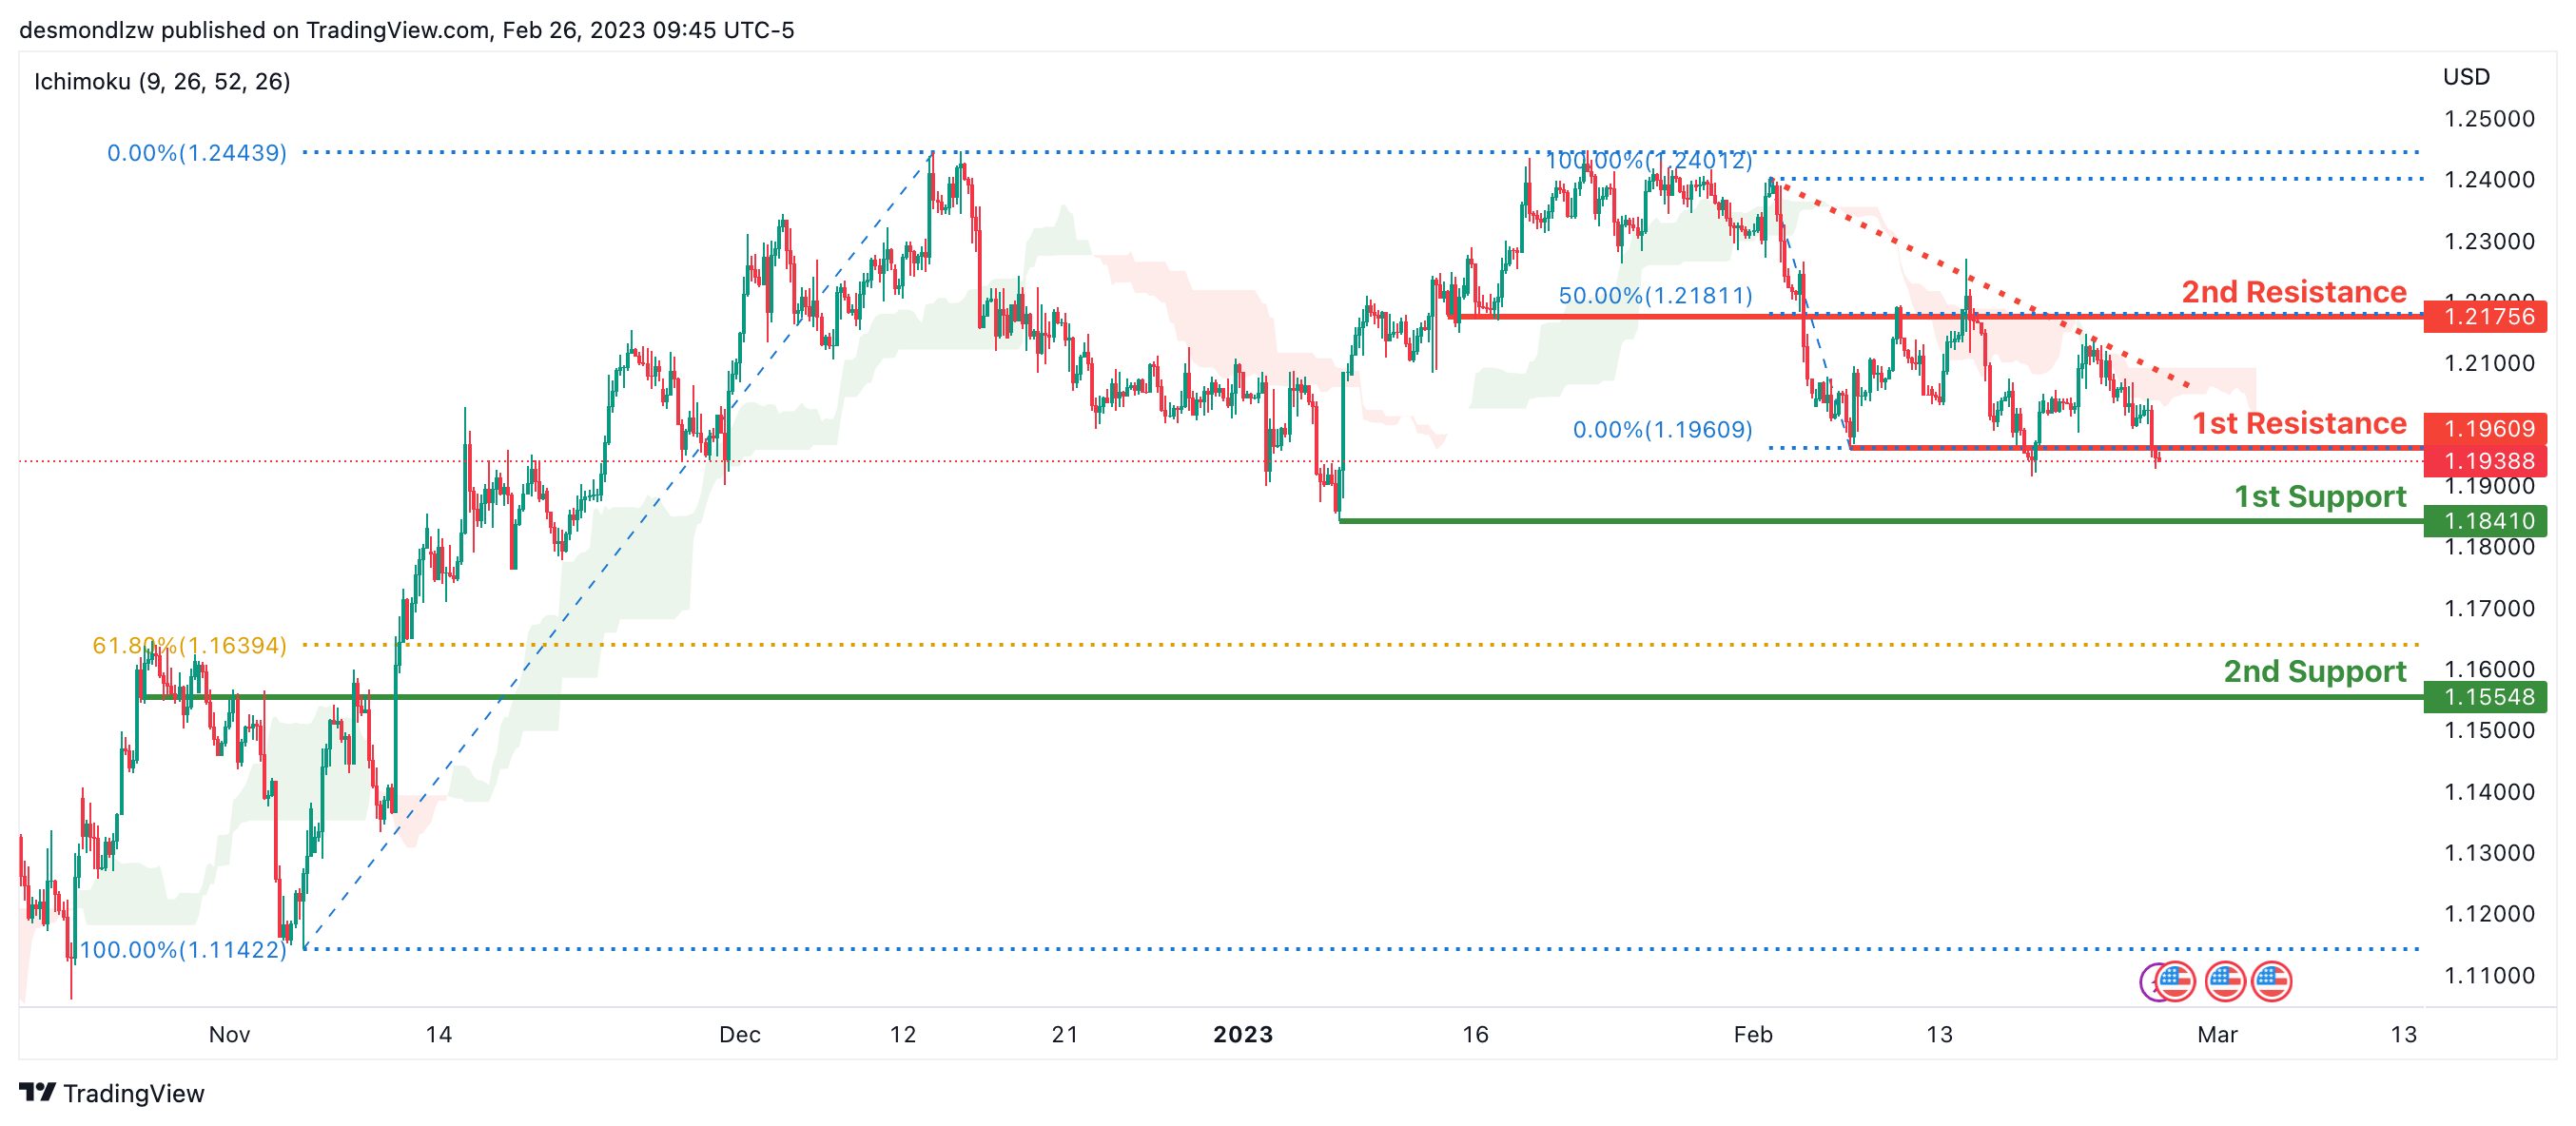
Looking at the H4 chart, my overall bias for GBPUSD is bearish due to the current price crossing below the Ichimoku cloud, indicating a bearish market. To add confluence to this bias, price is also along a descending trendline.If this bearish momentum continues, expect the price to head towards the 1st support at 1.18410, where the previous swing low is.
In an alternate scenario, price could head back up to retest the 1st resistance line at 1.19609 where the overlap resistance is.
Areas of consideration:
- H4 1st resistance at 1.19609
- H4 1st support at 1.18410
USD/CHF:
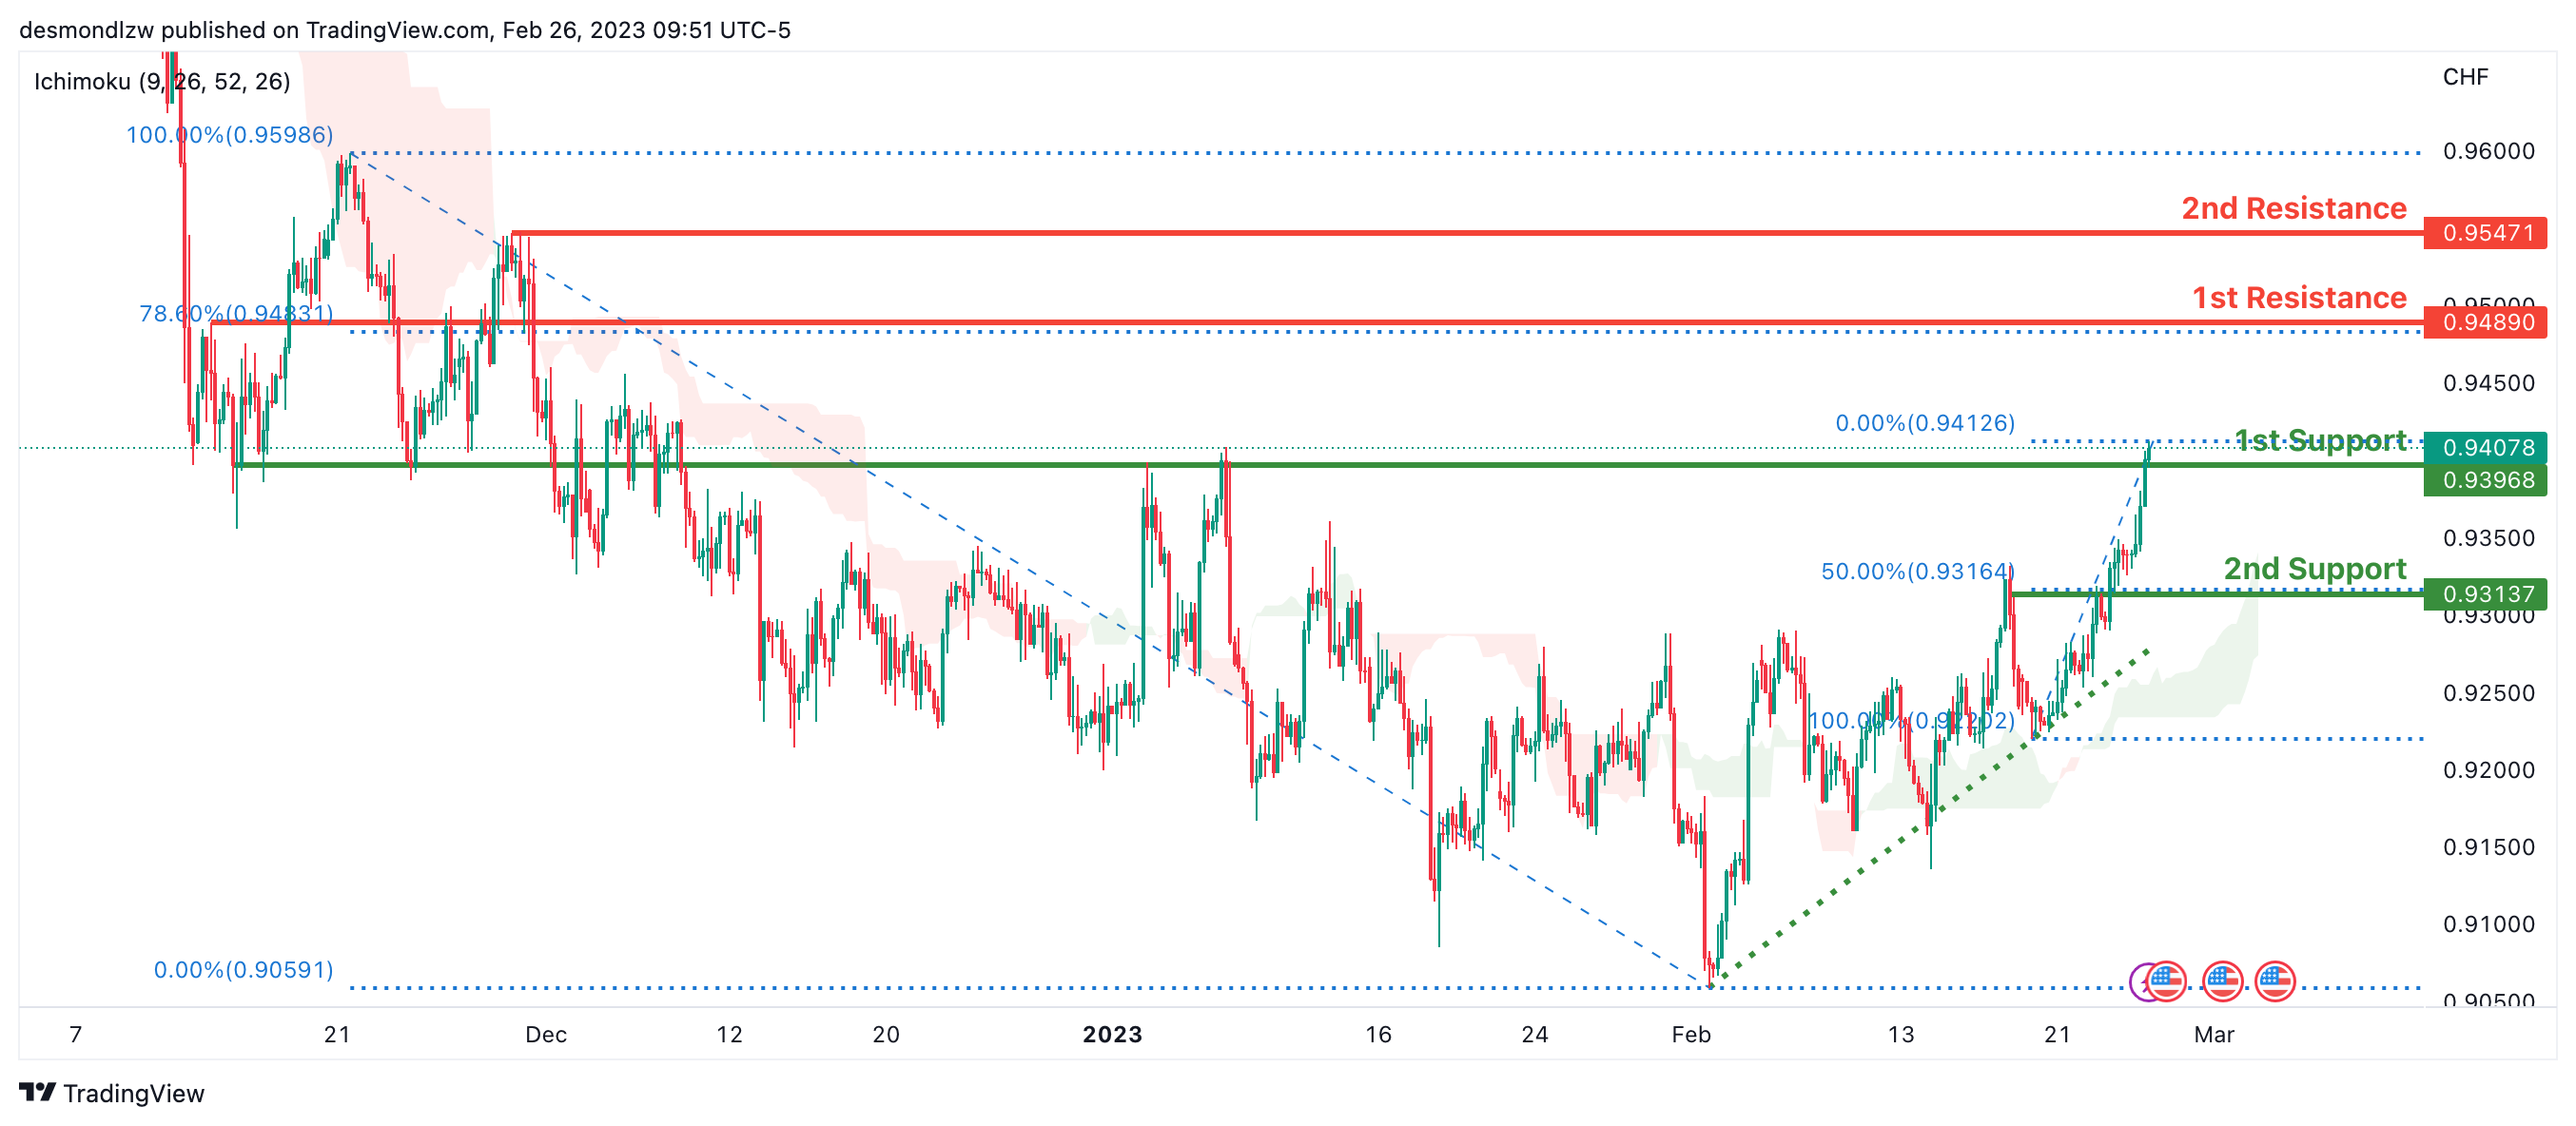
Looking at the H4 chart, my overall bias for USDCHF is bullish due to the current price being above the Ichimoku cloud, indicating a bullish market. To add confluence to this bias, price is also along an ascending trendline.If the current bullish trend continues, expect the price to possibly continue heading towards the 1st resistance at 0.94890 where the overlap resistance intersects with the 78.6% Fibonacci line.In an alternative scenario, price could possibly head back down to retest the 1st support at 0.93968, where the overlap support is
Areas of consideration
- H4 1st support at 0.93968
- H4 1st resistance at 0.94890
XAU/USD (GOLD):
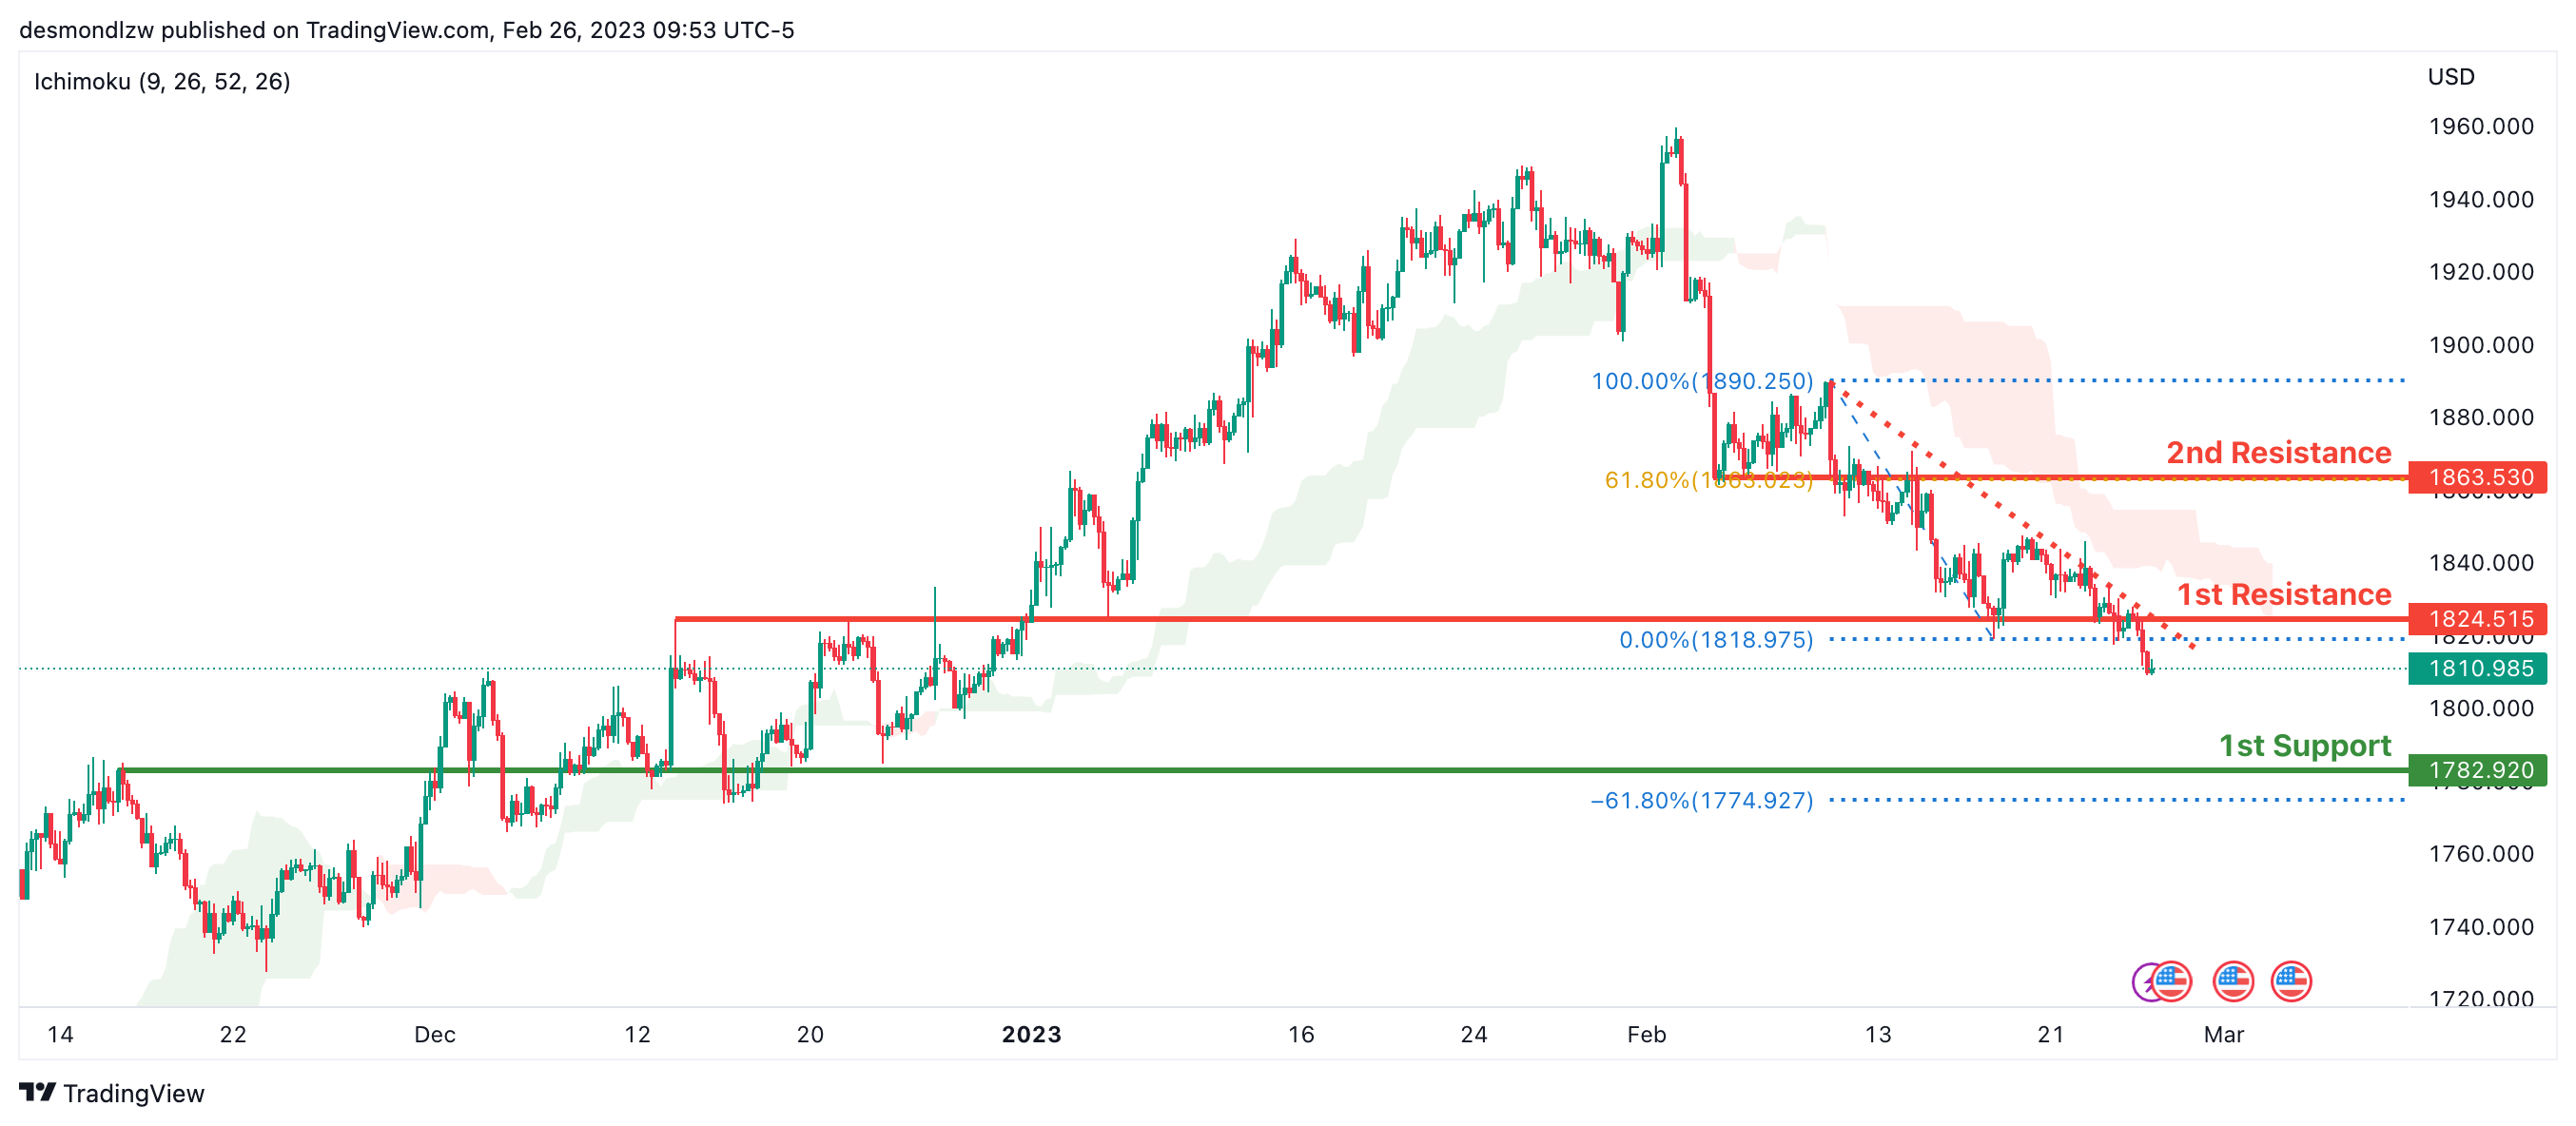
Looking at the H4 chart, my overall bias for XAUUSD is bearish due to the current price being below the Ichimoku cloud, indicating a bearish market. To add confluence to this bias, price is also along a descending trendline.If this bearish momentum continues, expect the price to possibly continue heading towards the 1st support at 1782.920 where the overlap support intersects with the -61.8% Fibonacci expansion line.
In an alternative scenario, price could possibly head back up to retest the 1st resistance at 1824.515 where the overlap support is
Areas of consideration:
- H4 time frame, 1st resistance at 1824.515
- H4 time frame, 1st support at 1782.920
AUD/USD:
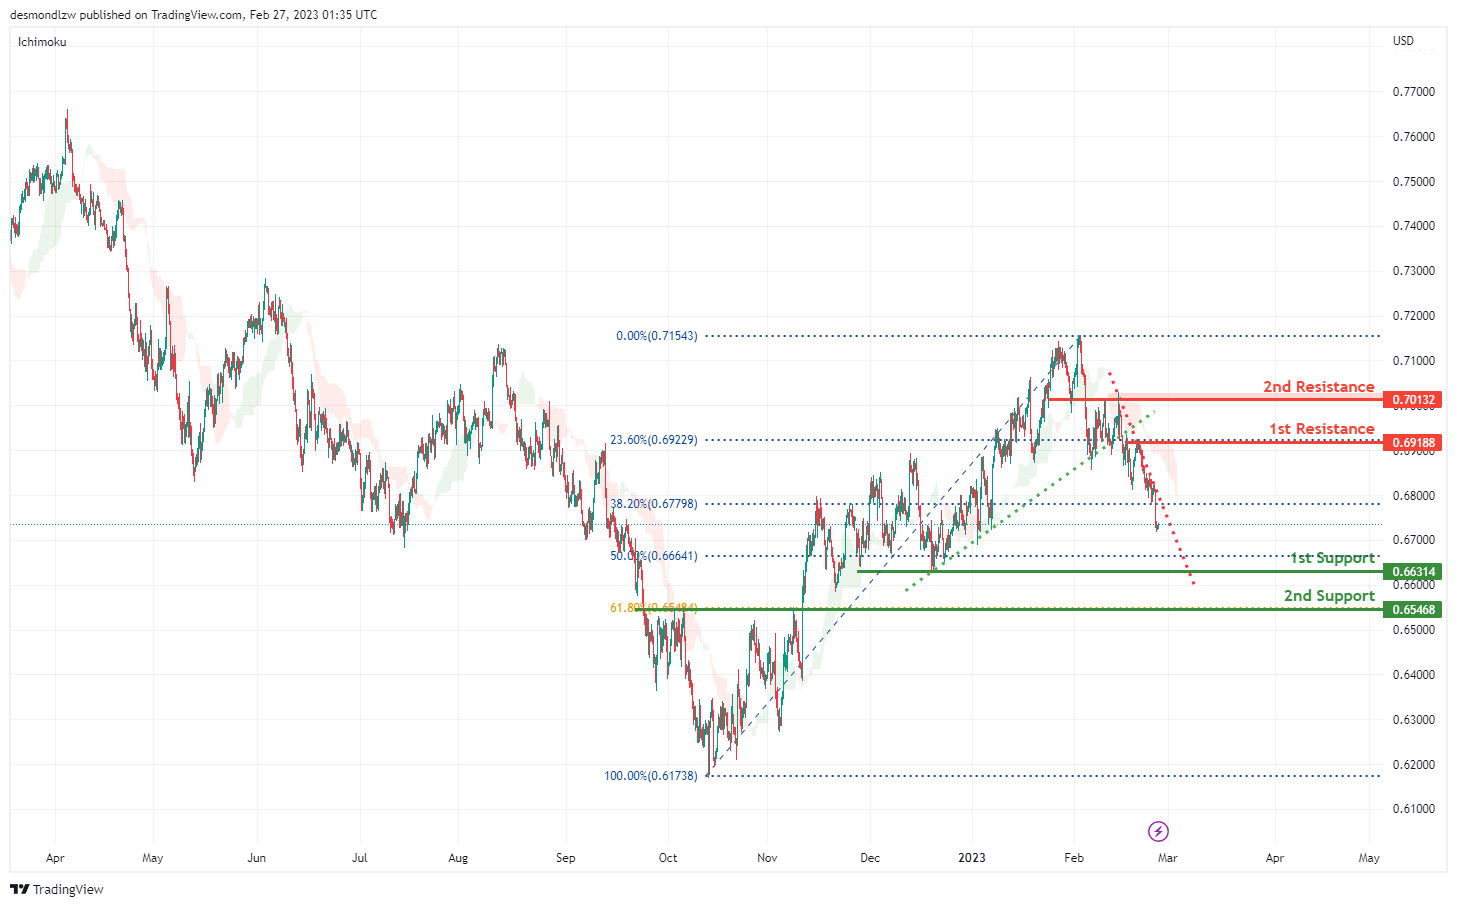
Looking at the H4 chart, my overall bias for AUDUSD is bearish due to the current price being below the Ichimoku cloud, and the price has broken the ascending trend line,a downward trend line has been created, indicating a bearish market.
The price could possibly go down towards the 1st support level at 0.67849 which is the recent overlap swing low. There is 2nd support at 0.65468 where the 61.8 % Fibonacci line is.
In an alternate scenario, The price could possibly go up towards the 1st resistance level at 0.66314 which is the recent overlap swing high, There is 2nd resistance at 0.70132 which is in line with the 23.6% Fibonacci retracement.
Areas of consideration
- H4. 2nd resistance at 0.70132
- H4. 1st resistance at 0.69188
- H4, 1st support at 0.67849
- H4, 2nd support at 0.65468
NZD/USD:
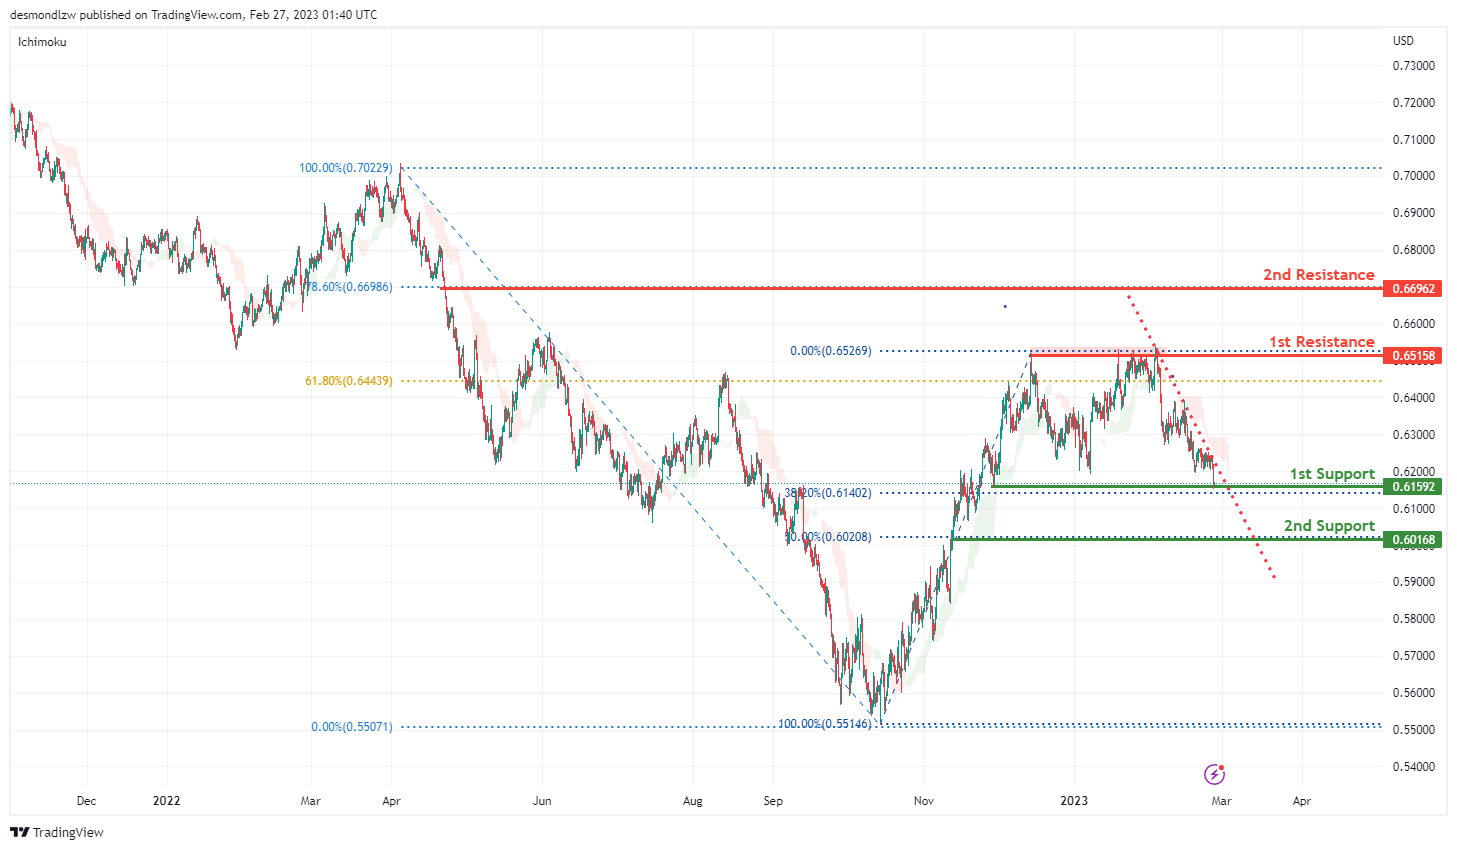
Looking at the H4 chart, my overall bias for NZDUSD is bearish, as the current price is below the Ichimoku Cloud. A descending trend line has been created, indicating a bearish market. Expecting the price to go down towards the 1st support at 0.61592 where the overlap swing low and 38.2% Fibonacci line are. The 2nd support is at 0.60168 where the 50% Fibonacci line is.
In an alternate scenario, price could possibly go up towards the 1st resistance level at 0.65158 which is the recent overlap swing high. There is a 2nd resistance at 0.66962 where the 78.6% Fibonacci line is.
Areas of consideration:
- H4 time frame, 2nd resistance at 0.66962
- H4 time frame, 1st resistance at 0.65158
- H4 time frame, 1st support at 0.61592
- H4 time frame, 2nd support at 0.60168
USD/CAD:
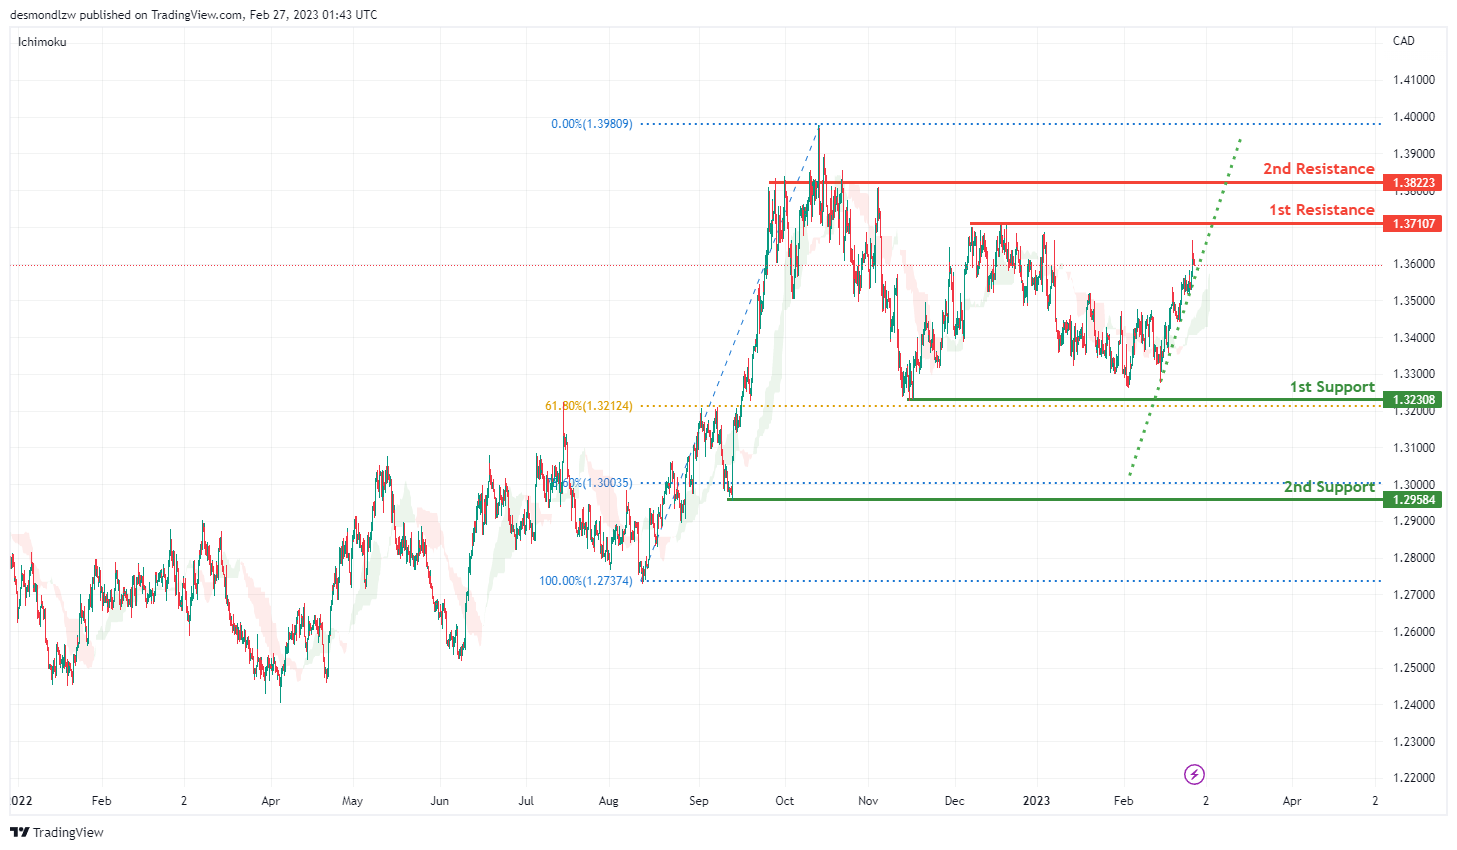
Looking at the H4 chart, my overall bias for USDCAD is bullish , as the current price is above the Ichimoku cloud. An ascending trend line has been created, indicating a bullish market. Expecting the current price to possibly break the 1st resistance at 1.37107 which is the overlap of the recent swing high, before it heads to the 2nd resistance at 1.38223 which is the previous swing high.
In an alternative scenario, the price could possibly drop to the 1st support at 1.32308 which is the previous swing low and also in line with the 61.8% Fibonacci retracement. The 2nd support is at 1.29584 where the 78.6% Fibonacci line is .
Areas of consideration:
- H4 time frame, 2nd resistance at 1.38223
- H4 time frame, 1st resistance at 1.37107
- H4 time frame, 1st support at 1.32308
- H4 time frame, 2nd support at 1.29584
OIL:
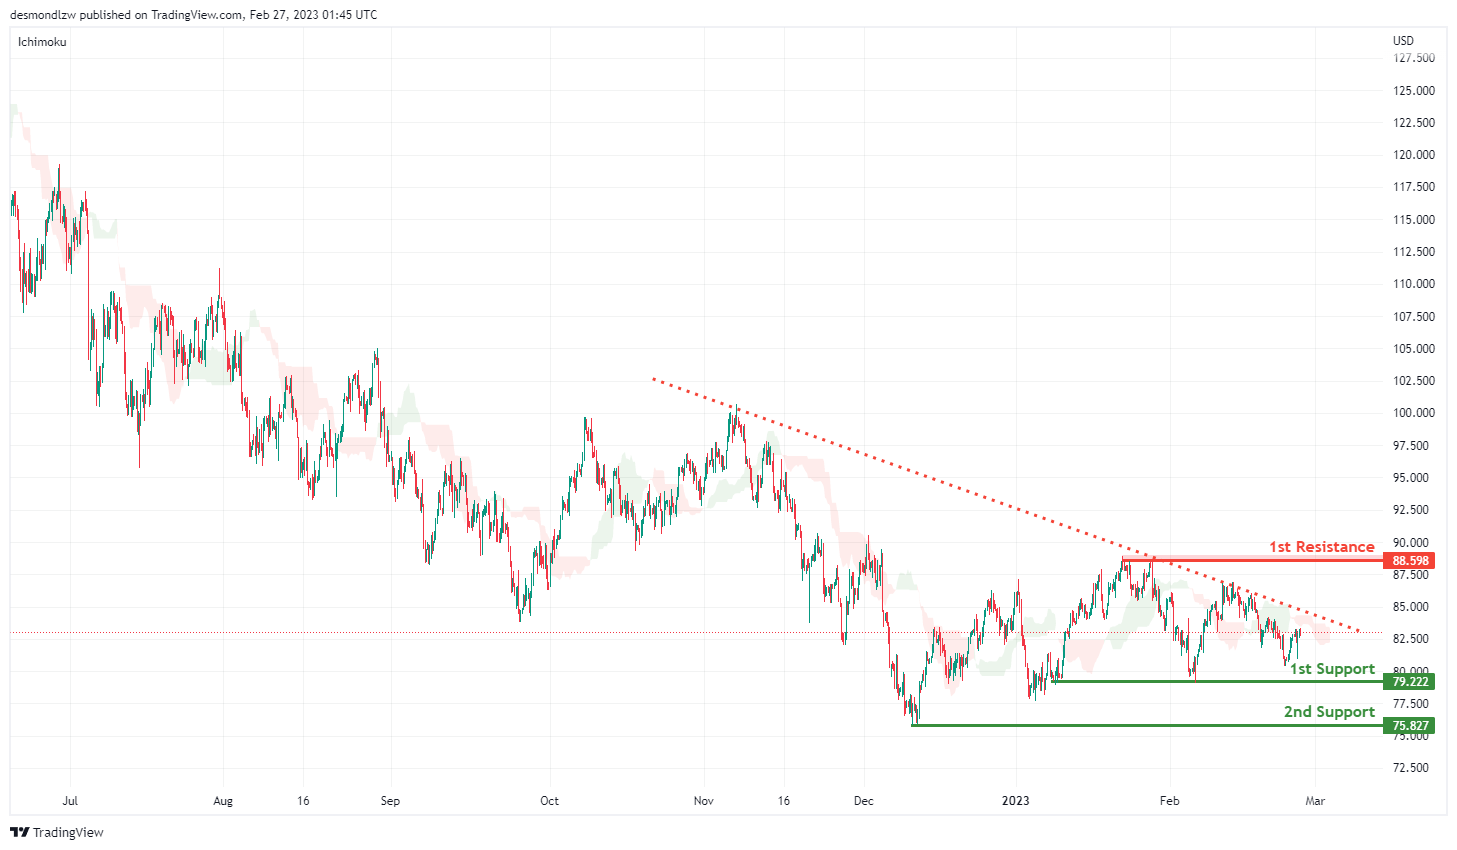
Looking at the H4 chart, my overall bias for BOC is bearish as the current price is below the Ichimoku cloud, and there is a descending trend line. Expecting the price to head down towards the 1st support level at 79.222 which is the recent overlap swing low, before the price drops to the 2nd support at 75.827.
In an alternate scenario, the price could possibly head up towards the 1st resistance level at 88.598 which is the recent swing high.
Areas of consideration:
- H4 time frame, 1st resistance at 88.598
- H4 time frame,1st support at 79.587
- H4 time frame, 2nd support at 75.827
Dow Jones Industrial Average:
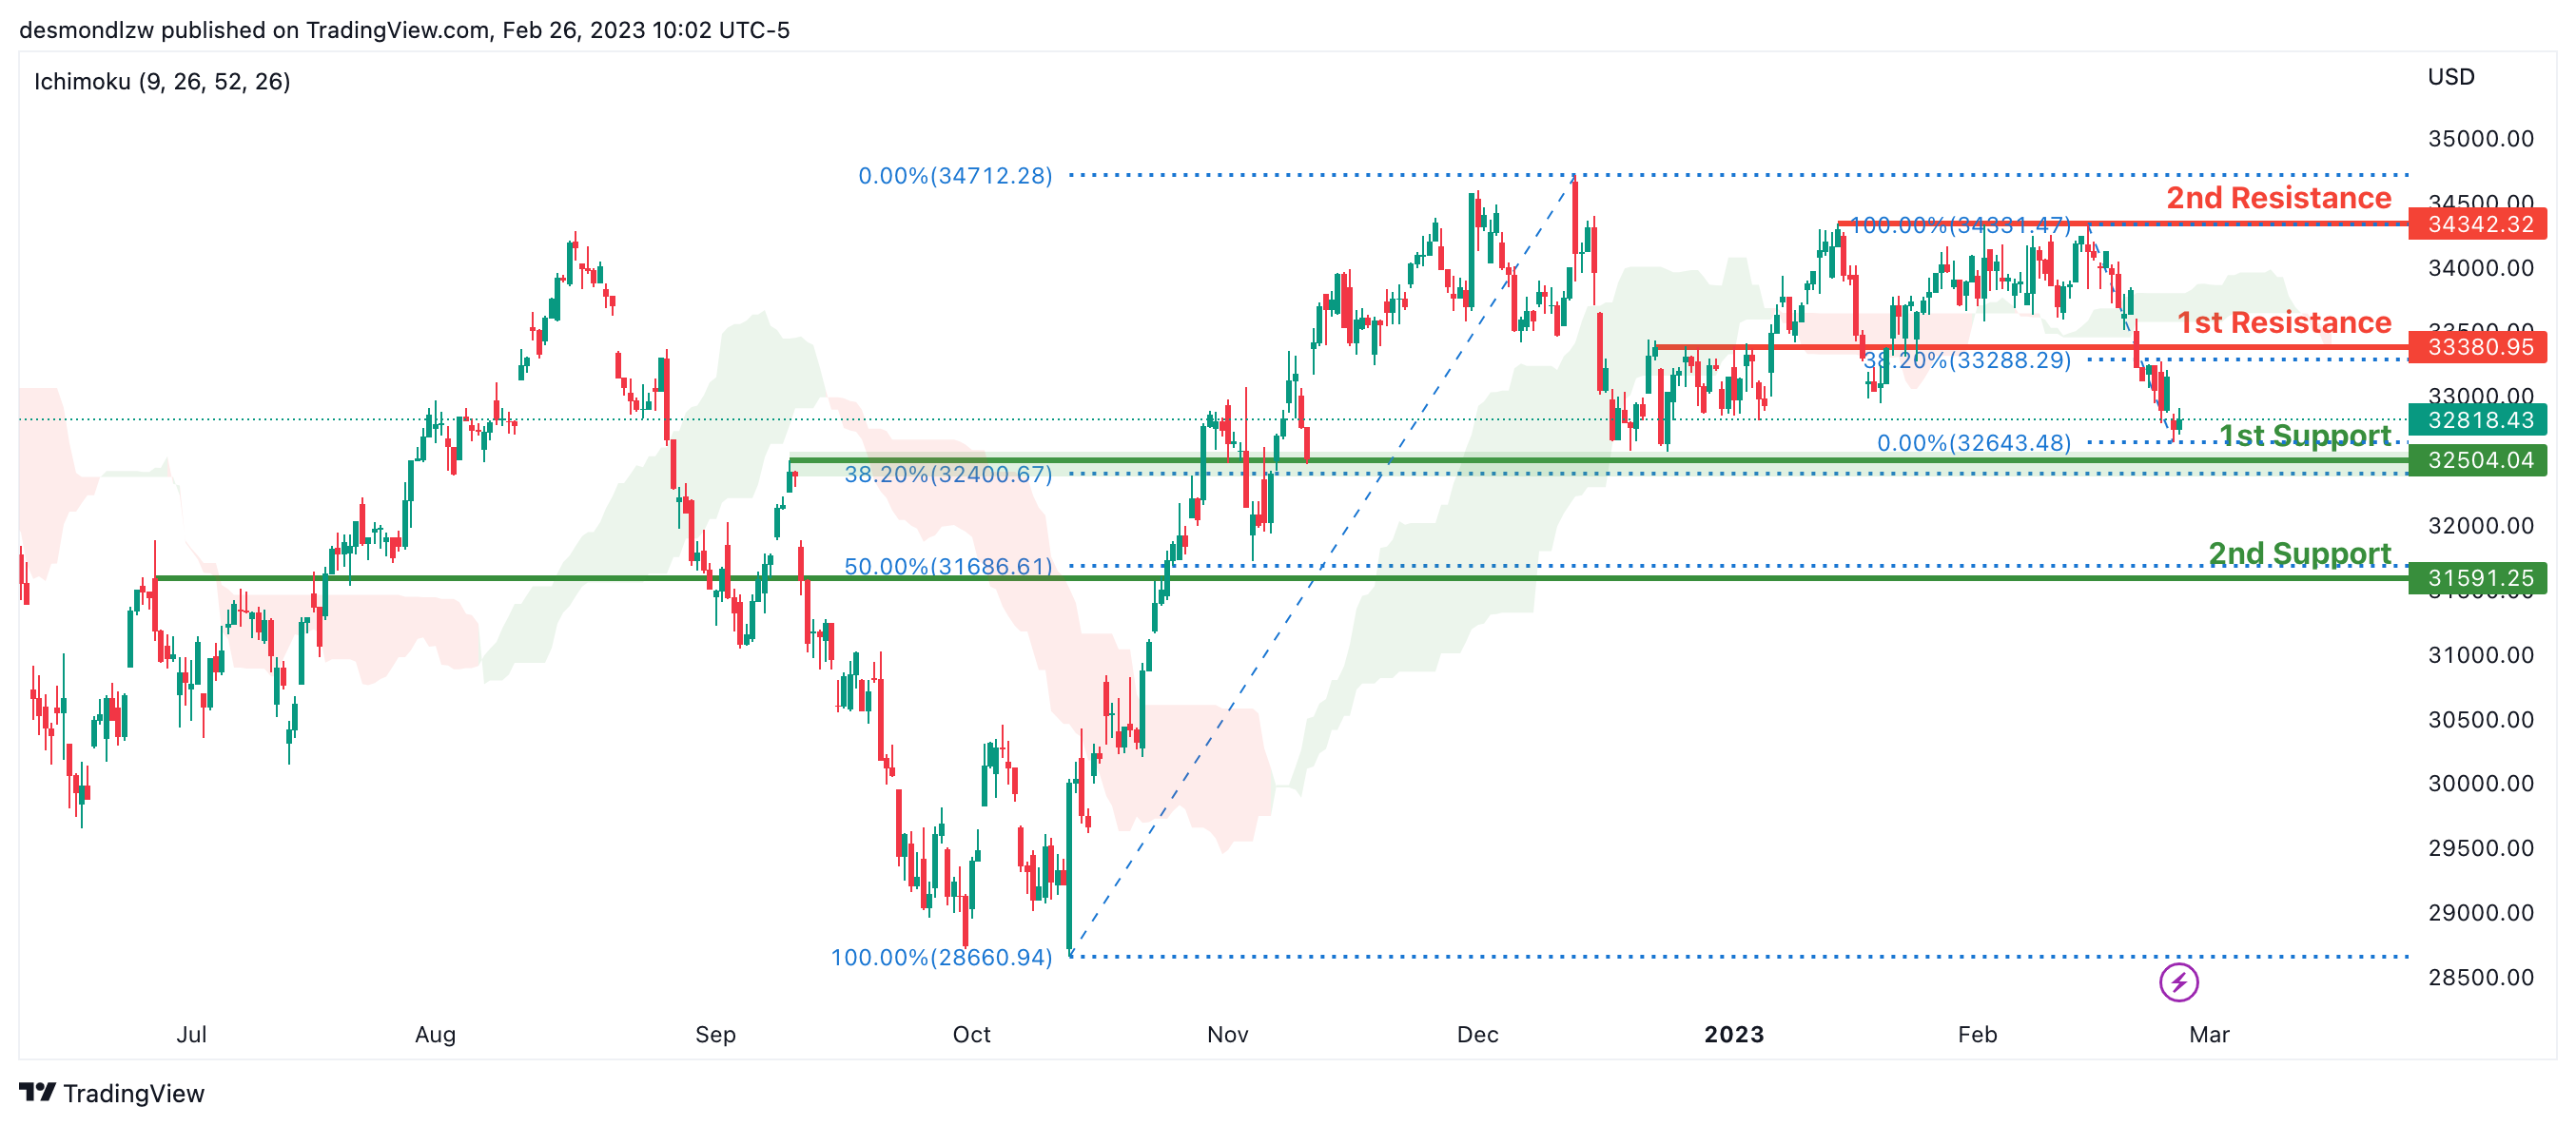
On the H4 chart, the overall bias for DJI is bearish. To add confluence to this, the price is crossing below the Ichimoku cloud which indicates a bearish market.If this bearish momentum continues, expect the price to possibly continue heading towards the 1st support at 32504.04, where the 38.2% Fibonacci line and overlap support is.In an alternative scenario, price could possibly head back up towards the 1st resistance at 33380.95, where the 23.6% Fibonacci line is.
Areas of consideration:
- H4 time frame, 1st support at 32504.04
- H4 time frame, 1st Resistance at 33380.95
DAX:
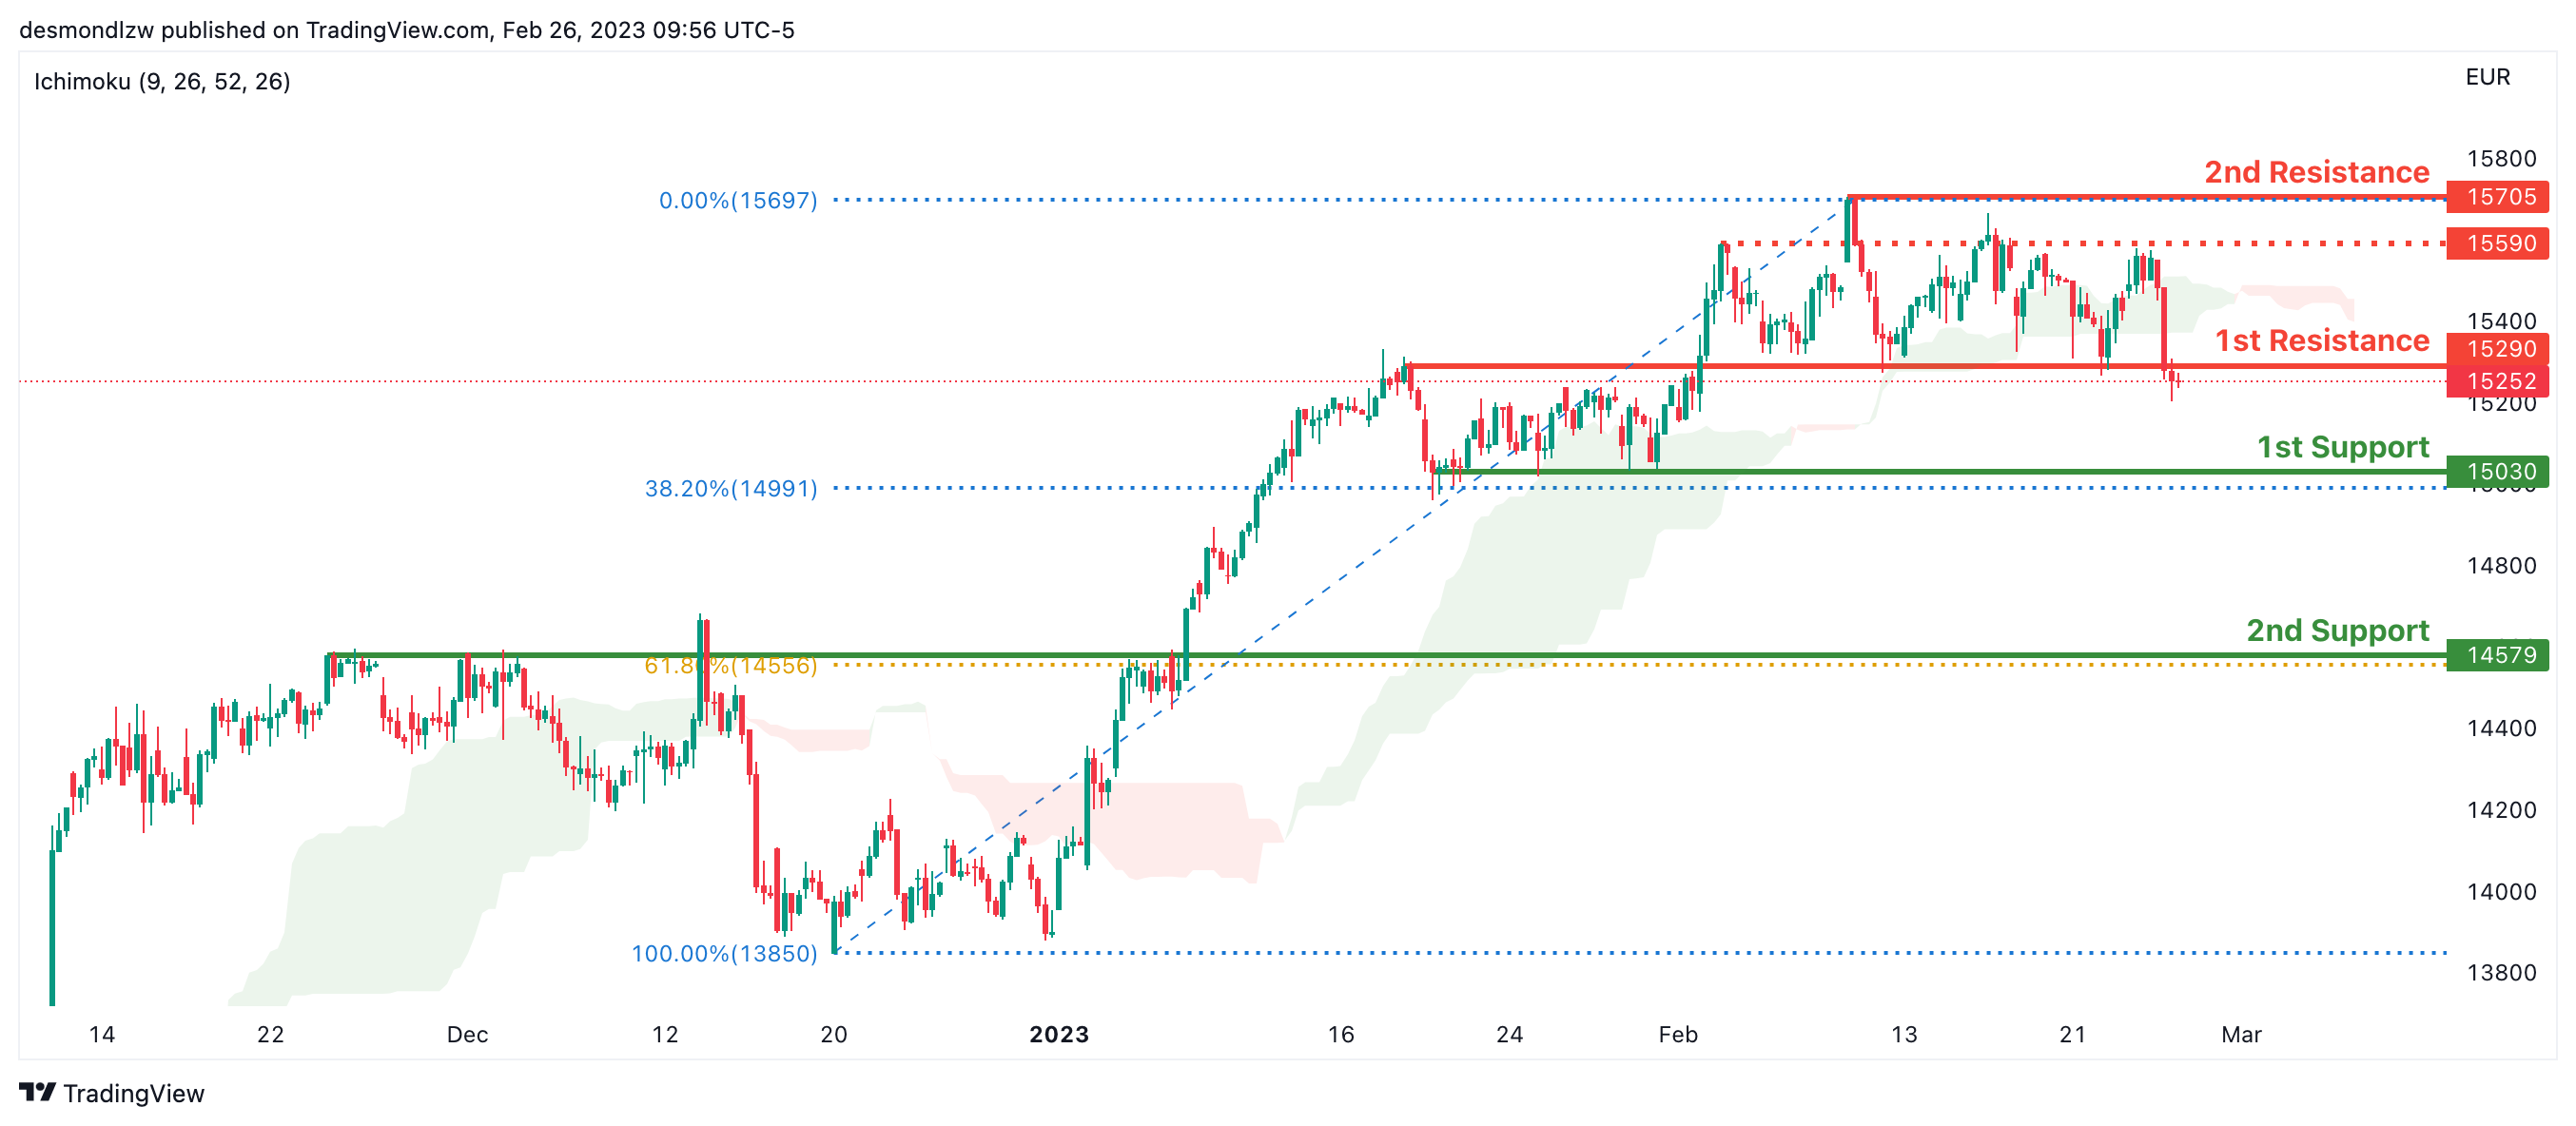
Looking at the H4 chart, my overall bias for DAX is bullish. However price has crossed below the Ichimoku cloud which indicates a possible shift to bearish market structure.If this bearish momentum continues, expect the price to possibly head towards the 1st support line at 15030, where the overlap support intersects with the 38.2% Fibonacci line.In an alternative scenario, price could possibly head up to retest the 1st resistance at 15290 which is the overlap resistance.
Areas of consideration:
- H4 time frame, 1st resistance is at 15290
- H4 time frame, 1st support is at 15030
ETHUSD:
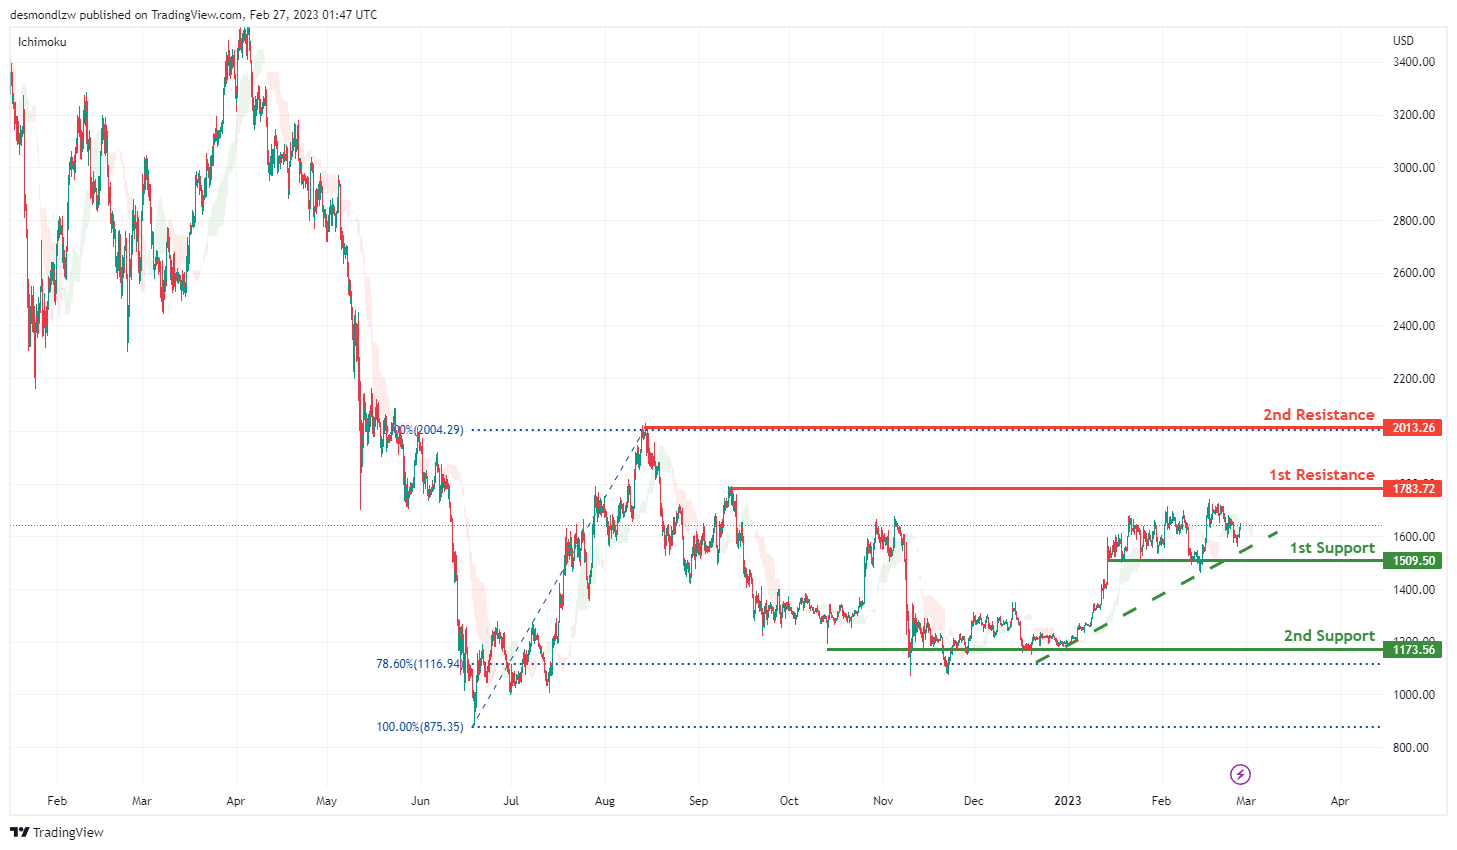
Looking at the H4 chart, my overall bias for ETHUSD is bullish, as there is a strong ascending trend line. The price may head back to retest the 1st support that intersects with the ascending trend line, before it goes up and break the 1st resistance line at 1783.72 before breaking the 2nd resistance line at 2013.26 which is the previous swing high.
In an alternate scenario, the price may retrace back to the 1st support line at 1509.50 which is the recent overlap support before it heads towards the 2nd support at 1173.56 which is in line with 78.6% Fibonacci retracement.
Areas of consideration:
- H4 time frame, 2nd resistance of 2013.26
- H4 time frame, 1st resistance of 1783.72
- H4 time frame, 1st support at 1509.50
- H4 time frame, 2nd support at 1173.56
BTCUSD:
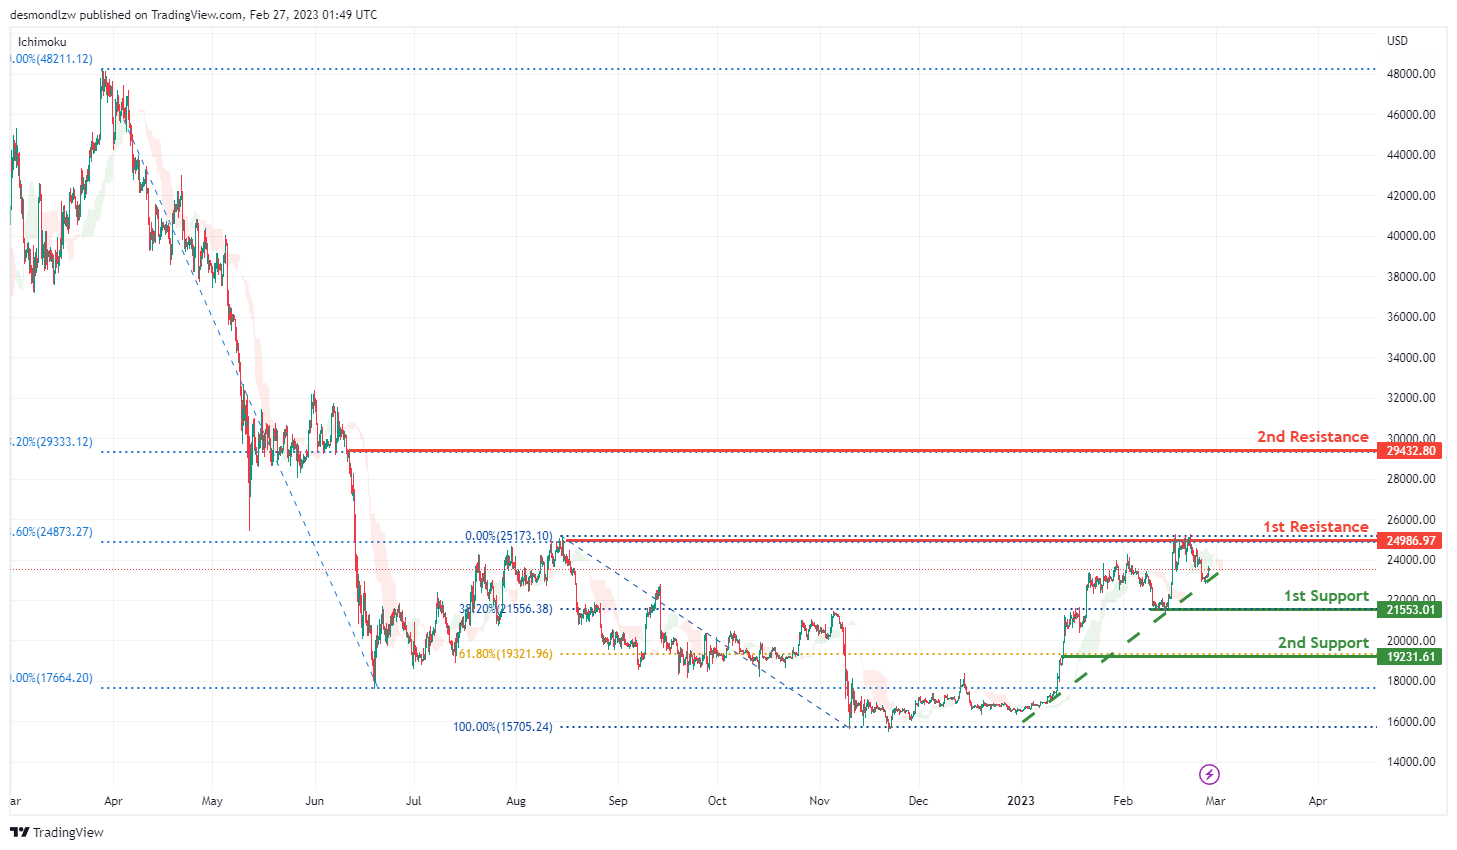
Looking at the H4 chart, my overall bias for BTCUSD is bullish. As there is an ascending trend line, expect the price may head back to retest an the ascending trend line, before it goes up and break the 1st resistance at 24986.97 which is the overlap recent swing high, before it head up to the 2nd resistance 29432.80 where the 38.2% Fibonacci retracement is.
In an alternate scenario, The price may go down towards the 1st support line at 21553.01 which is in line with 38.2% Fibonacci retracement, before heading down towards the 2nd support at 19231.61 which is in line with 61.8% Fibonacci retracement.
Areas of consideration:
- H4 time frame, 2nd resistance 29432.80
- H4 time frame, 1st resistance 24986.97
- H4 time frame, 1st support at 21553.01
- H4 time frame, 2nd support at 19231.61
S&P 500:
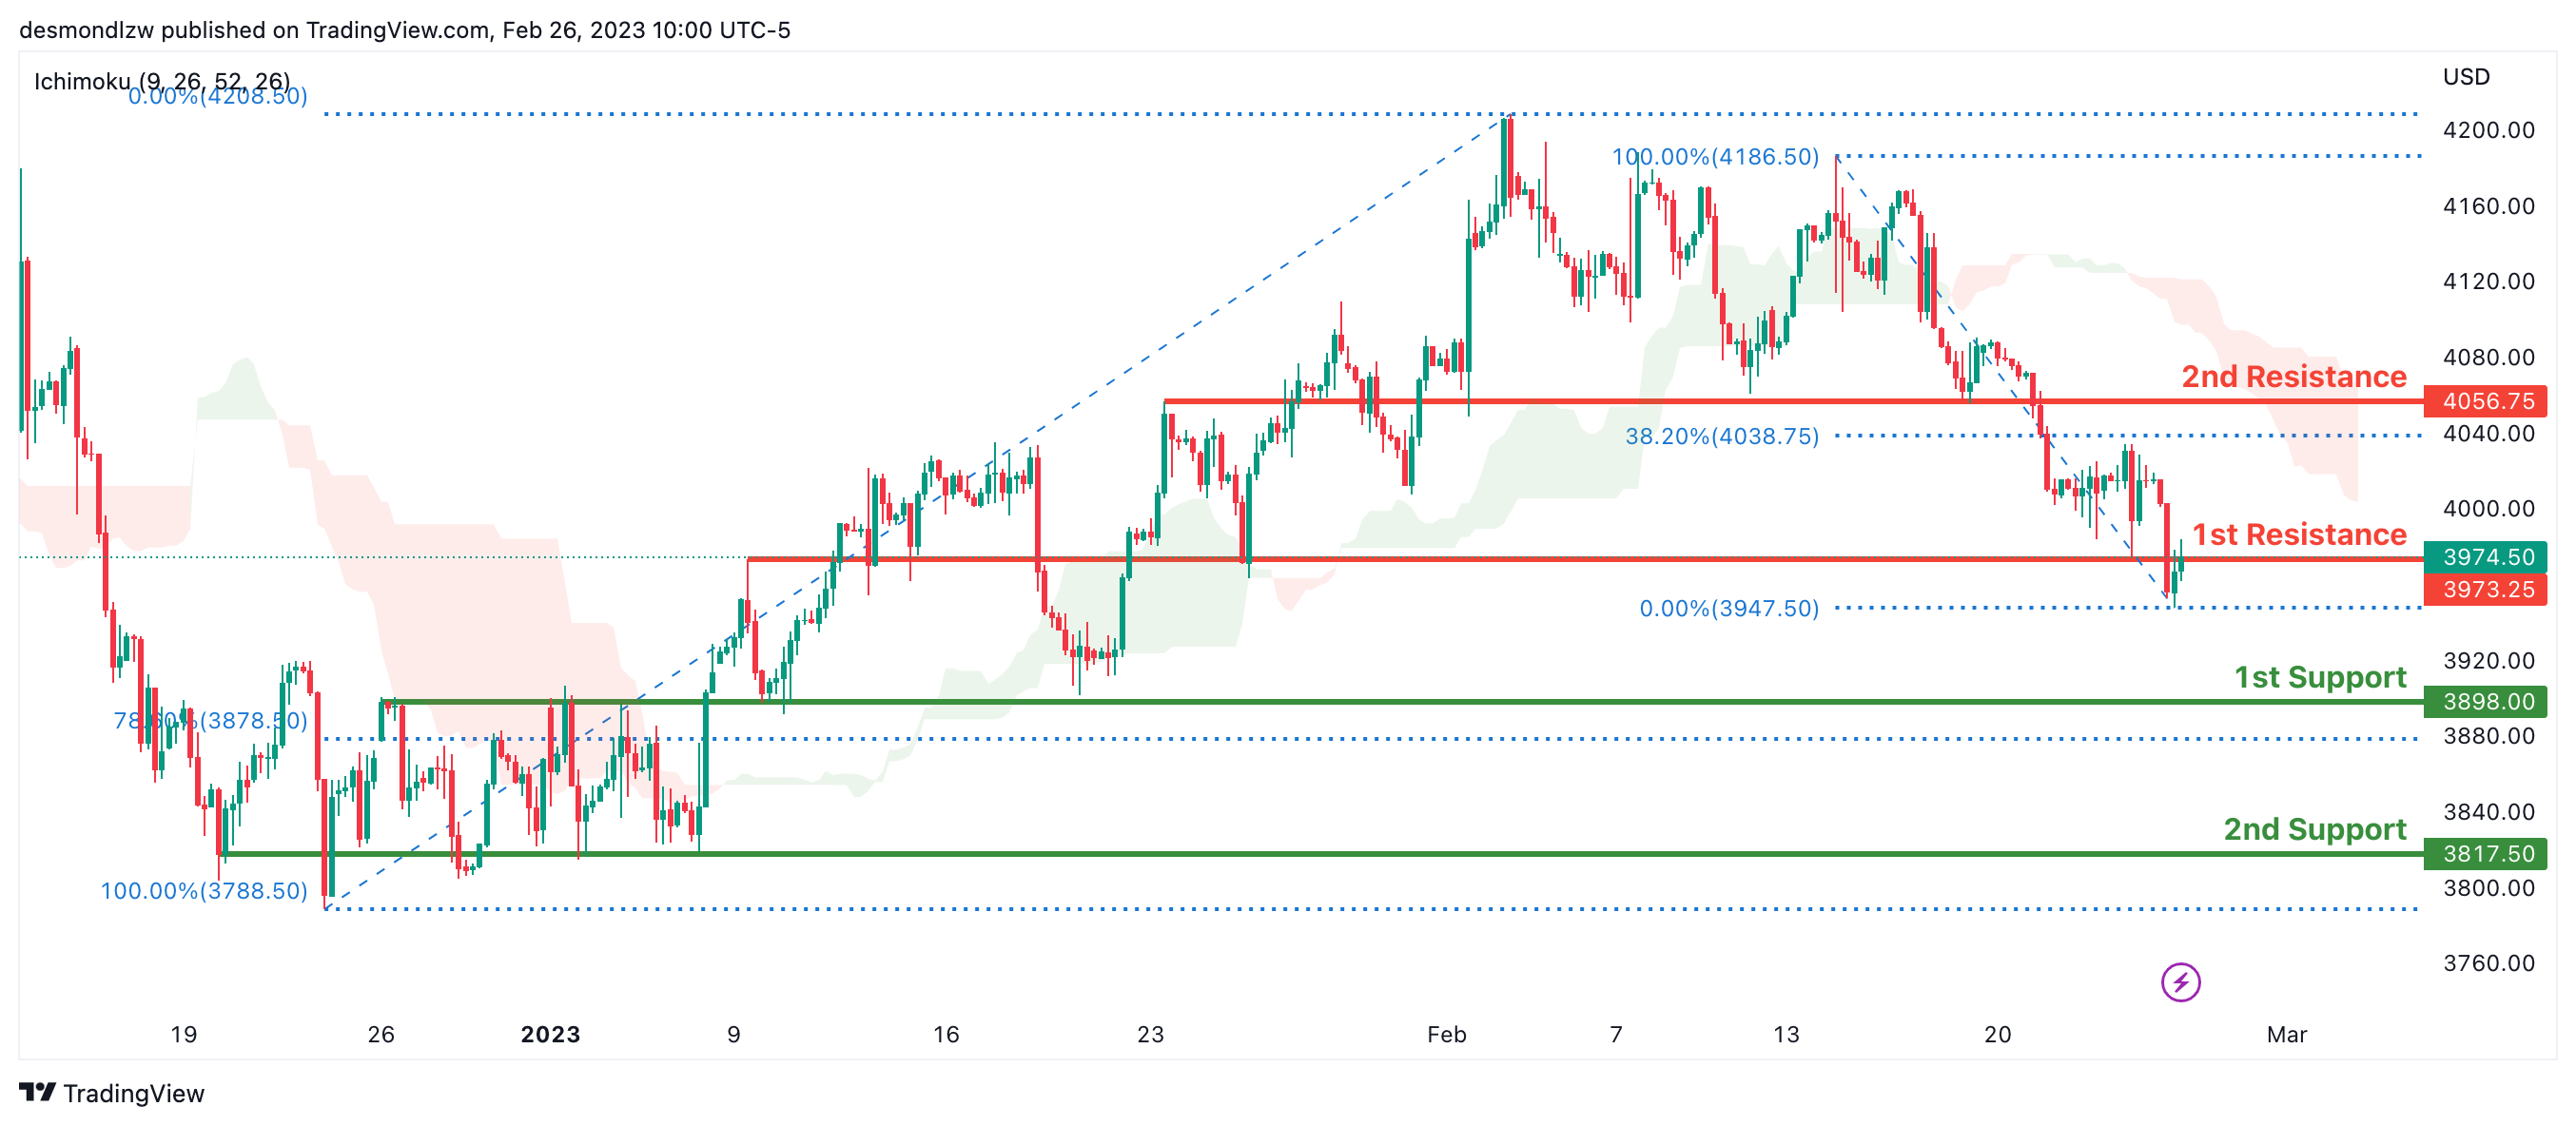
Looking at the H4 chart, my overall bias for S&P500 is bearish due to the current price being below the Ichimoku cloud, indicating a bearish market.If this bearish momentum continues, expect the price to continue heading towards the 1st support at 3898.00 where the overlap support intersects with the 78.6% Fibonacci line.
In an alternative scenario, price could possibly head back up to retest the 1st resistance at 3973.25 which is the overlap resistance.
Areas of consideration:
- H4 time frame, 1st support at 3898.00
- H4 time frame, 1st resistance at 3973.25
NZ retail sales volume dropped -0.6% qoq in Q4, value up 1.7% qoq
New Zealand retail sales volume dropped -0.6% qoq in Q4, below expectation of 0.2% qoq rise. Retail sales value rose 1.7% qoq.
By industry, the largest movements in sales volume were: electrical and electronic goods retailing (down -9.7%), motor vehicle and parts retailing (up 2.3%), food and beverage services (up 2.4%), fuel retailing (up 2.6%), furniture, floor coverings, houseware, and textile goods (down -5.2%).