Sample Category Title
ECB Visco: If we need to be more restrictive, we’ll be more restrictive
ECB Governing Council member Ignazio Visco told Bloomberg TV on Saturday, "I don't think that we can indicate now what the terminal rate will be, not even if it'll be 3.5%, 3.25% or 3.75%, because really it is data-dependent.
"Our objective is to go back to an inflation rate of 2% in the medium term. If we need to be more restrictive, we'll be more restrictive," he said.
Visco said "determined" steps are needed in Q2. "We have to be sure that core inflation isn't remaining at this high level... This may induce wage increases beyond what is compatible with a medium-term 2% inflation rate, which is our target. So that is why we are observing this with a lot of care — but I'm not worried."
EUR/USD Slides Further As Dollar Gains Steadily
Key Highlights
- EUR/USD extended its decline below the 1.0600 support.
- A key bearish trend line is forming with resistance near 1.0580 on the 4-hours chart.
- GBP/USD could dive if it breaks the 1.1920 support.
- Gold price is at risk of a move below the $1,800 support.
EUR/USD Technical Analysis
The Euro started another decline after it failed to recover above 1.0800 against the US Dollar. EUR/USD extended its decline below the 1.0700 support zone.
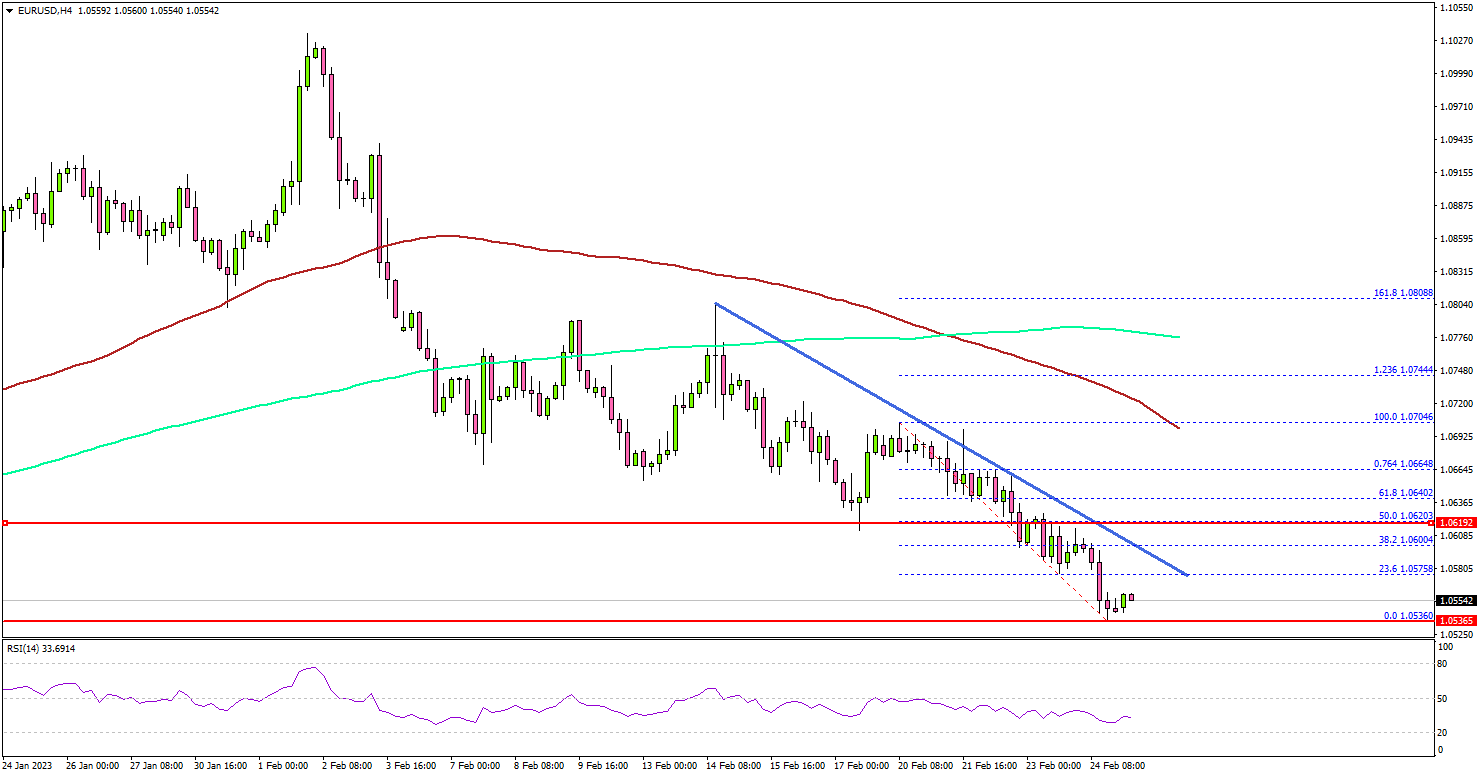
Looking at the 4-hours chart, the pair settled below the 1.0650 support level, the 100 simple moving average (red, 4-hours), and the 200 simple moving average (green, 4-hours).
The decline gained pace below the 1.0620 and 1.0600 support levels. A low is formed near 1.0536 and the pair is now consolidating losses. On the upside, an immediate resistance is near the 1.0575 level.
There is also a key bearish trend line forming with resistance near 1.0580 on the same chart. The next major resistance is near the 1.0620 level. A clear move above the 1.0620 resistance might start a steady increase.
The next target could be near the 1.0700 level and the 100 simple moving average (red, 4-hours), where the bears might appear. Any more gains could open the doors for a move towards the 1.0800 level.
On the downside, an immediate support is near the 1.0540 level. The next major support is near the 1.0500 level, below which there is a risk of a move towards the 1.0450. Any more losses could open the doors for a drop towards 1.0380.
Looking at GBP/USD, the pair slowly declined below 1.2050 and there is a risk of more losses in the coming days.
Economic Releases
- Euro Zone Industrial Confidence for Feb 2023 – Forecast 2, versus 1.3 previous
- Euro Zone Economic Sentiment Indicator for Feb 2023 – Forecast 101, versus 99.9 previous.
- US Durable Goods Orders for Jan 2023 – Forecast -4% versus +5.6% previous.
NZ First Impressions: Retail Trade December Quarter 2022
Nominal spending levels are continuing to rise. However, increases in prices mean we’re getting less for each dollar we spend.
- Q4 real retail sales (volumes): -0.6% (Prev: +0.6%)
- Westpac f/c: -1.7%, Market +0.2%
- Q4 nominal sales level: +1.7% (Prev: +3.4%)
Detail
Households are splashing out more cash, but we’re getting less bang for our buck.
Nominal spending levels rose by 1.7% over the December quarter.
However, with prices rising rapidly, the actual amount of goods we’ve been purchasing has been going backwards. In fact, the volume of goods sold fell 0.6% in the December quarter.
And this isn’t just a one-off drop. The actual amount of goods we’re purchasing has been edging downwards for a year now, even as rapid price rises have pushed nominal spending levels higher.
Looking into the details of the December quarter retail spending report, we are seeing a rotation in spending appetites. We’re now spending less on durable items like electronics and recreational goods, with spending in these categories down 9% on this time last year. However, our spending on recreational activities, like dining out and accommodation, has been climbing rapidly. That’s a reversal of the trends we saw following the start of the pandemic, and we expect that pattern to continue going forward.
We’re also seen a large increase in spending on necessities like groceries (up 6.6% over the past year). However, that’s at the same time as grocery prices have risen by more than 10%.
Implications
Today’s report highlighted two big trends for the RBNZ. First, while spending levels have continued to rise, that’s mainly due to price increases, rather than households actually purchasing more items.
Second, even in the face of price rises, spending appetites have remained resilient. In fact, discretionary spending on items other than groceries has continued to rise despite the increases in prices and interest rates.
The RBNZ last week signalled that further interest rates increases are needed to dampen domestic demand and the current rampant price inflation. However, we think the end of the tightening cycle is coming into sight and are picking the cash rate will peak in May.
As we’ve highlighted before, monetary policy does work. But it takes time for interest rate increases to affect activity, especially given the extent of mortgage rate fixing in the New Zealand economy. Over the coming year, more than half of all fixed rate mortgages will come up for repricing, and many borrowers will face interest rate rises of 3% or more. Combined with the squeeze on spending power from higher prices, that will be a large drag on households’ disposable income and spending.
In terms of the upcoming December quarter GDP result (due for release on 16 March), today’s retail volumes result was above our forecasts. However, we’ll firm up our pick for GDP growth as other partial indicators are released over the next couple of weeks.
Australian Q4 Business Indicators Survey: Inventories, Sales, and Company Profits; First Impressions
Inventory levels decline, following a sharp run-up, confirming a large subtraction from Q4 growth. Sales reportedly stalled, pointing to sluggish conditions. Whereas profits rose strongly.
Inventories declined in the December quarter, contracting by 0.2%.
The Q4 fall in inventories was not as sharp as we anticipated, Westpac f/c -1.0% and market median flat (range, -1.0% to +1.4%).
However, incorporating revisions to Q3, the result confirms a large subtraction from Q4, an impact of -0.8ppts (-0.76ppts to decimal reports), broadly as we anticipated, a forecast -0.9ppts.
Recall that in Q3, inventories rose sharply.
We took the view that the Q3 rise was inflated by one-offs, namely: a jump in mining (transport links to ports disrupted) and a rise in retail, on an apparent bring forward to avoid supply chain disruptions.
In the event, both of those dynamics reversed, as we foreshadowed. Albeit a rise in wholesale inventories in Q4 cushioned the decline in overall inventories.
Sales stalled in the December quarter the Business Indicators (BI) survey reports, edging down by -0.1%.
While the BI sales measure provides only a broad guide to conditions (domestic demand and output) quarter to quarter (the fit is much better on annual basis), such a weak result shouldn’t be ignored.
Outside of lockdowns, that is the softest sales outcome since the second half of 2019.
As we foreshadowed in our GDP preview, on our figuring domestic demand potentially grew by only 0.3% in the December quarter – the weakest result outside of lockdowns since March 2019. We suspect that half of the economy (that is, excluding the consumer) may have been flat over the final months of 2022.
Company profits
The survey headline profit number (an accounting measure) posted a sizeable rise, up by 10.6%.
That was much stronger than expected, Westpac forecast +1.0%, market median +1.8% (range -2% to +6%).
As we highlighted previously, in the BI survey fluctuations in the value of inventories (due to price movements) is booked as a profit / loss – while the national accounts look through this.
Recall that in Q3, the BI survey reported an exaggerated fall in profits, down by -12.4% (revised to -11.3%), while the national accounts estimate declined by -4.7%.
For Q4, on an adjusted basis, company profits ex finance rose by around 6%. That is stronger than the -1% we anticipated on this basis.
A word of caution, the extent of unknowns on the Income side of the accounts is considerably greater than that for the Expenditure side – hence we are a little wary of taking our cue from this upside on profits.
Forex and Cryptocurrency Forecast
EUR/USD: FOMC Protocol Strengthens the Dollar
Macroeconomic statistics in both the US and the Eurozone look mixed. In both regions, inflation is slowing down (which is good), but GDP growth is also decreasing (which is bad for the economy). According to the US Department of Commerce, the pace of consumer spending growth in the country for Q4 was +1.4% after +2.3% in Q3 (forecasted at +2.1%). The US GDP growth rate on an annual basis, according to preliminary estimates, will be lower than expected, +2.7% (forecast and previous value +2.9%). However, despite this, labour market statistics look positive enough. The number of initial claims for unemployment benefits, forecasted at 200K, actually decreased from 195K to 192K. According to final data from Eurostat, inflation in the Eurozone slowed down to +8.6% YoY in January (+9.2% a month earlier). Things are becoming more difficult in Germany, the main locomotive of the European economy. According to January data, the annual inflation rate was +9.2% compared to +9.6% in December, but at the same time, the country's GDP also went down, with a decline of -0.4% (forecast and previous value -0.2%). The very fresh February CPI data did not please either, showing an increase from +8.1% to +8.7%.
Against this backdrop, market sentiment remains in favour of the US dollar. This is primarily due to the Federal Open Market Committee's (FOMC) meeting minutes, which were published on Wednesday, February 22 by the US Federal Reserve. The minutes did not bring any surprises. However, market participants saw once again that the regulator is not going to stop its fight against inflation.
United Overseas Bank (UOB) summarized the main conclusions from the minutes as follows: 1) Despite progress in the fight against inflation, it remains significantly above the target level of 2%. 2) All Committee members agreed that achieving inflation targets will require more interest rate hikes and keeping it at a high level until the Fed is confident that inflation is sustainably going down. 3) Although the FOMC voted in February to raise the rate by 25 basis points (bps), several participants wanted it to be increased by 50 bps. 4) The Fed is still more concerned about inflation than slowing economic growth.
US Treasury Secretary Janet Yellen confirmed these conclusions. She stated at the G20 finance ministers and central bank governors meeting on Friday, February 24 that "inflation is coming down, measured on a 12-month basis, but core inflation is still above 2%". According to Janet Yellen, a "soft landing" for the economy without a recession is possible thanks to the strong labour market and strong US balances.
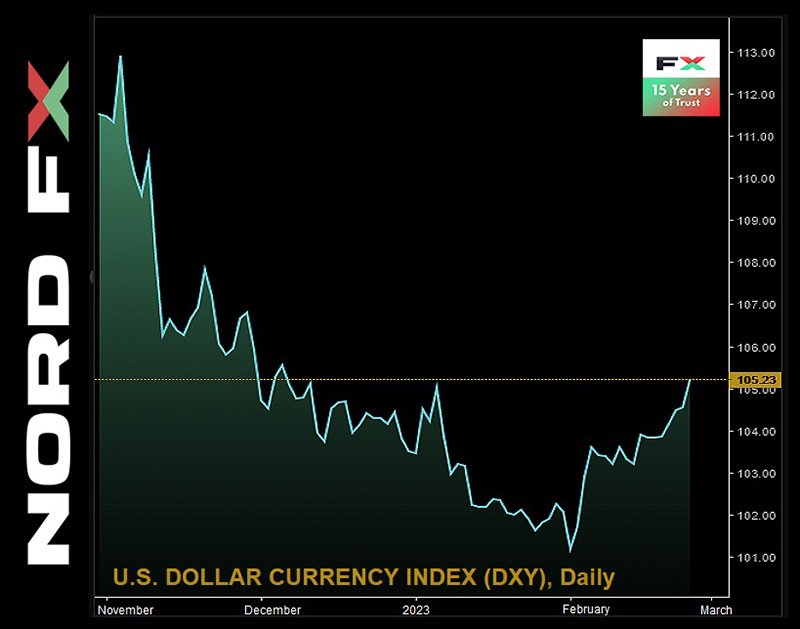
All of the above has led to the US dollar index, DXY, continuing its rise, reaching a local high of 105.26 points, while EUR/USD ended the workweek at the level of 1.0546 (week low at 1.0535).
Most likely, the main factor determining the dynamics of the dollar until the next FOMC meeting on March 21-22 will be speculations on how far the regulator is willing to go in its "crusade" against inflation. According to UOB's forecast, the rate may be raised by 25 bps in March and May, ultimately reaching 5.25%, and remain at this level until the end of the year. According to some other estimates, the peak federal funds rate by July could be 5.38%.
According to specialists at ING, the largest banking group in the Netherlands, February and March are seasonally strong months for the dollar, and the rate of 4.50% for overnight deposits may still slightly support the dollar. However, according to their colleagues at Commerzbank, it will become increasingly difficult for the US currency to strengthen against the euro. Much has already been priced in, and there are no strong new drivers in sight. Especially since the ECB is not standing still in tightening its monetary policy. The final data on consumer prices in the Eurozone, which were revised upwards to 5.3% in the core index, published on February 23, will be the next stimulus for such QT.
At the time of writing this review (evening of February 24), 40% of analysts expect further strengthening of the dollar (half as many as a week ago), 50% expect a correction of EUR/USD to the north, and the remaining 10% have taken a neutral position.
All 100% of D1 oscillators are painted red, although a quarter of them are signalling the pair is oversold. Among trend indicators, 75% recommend selling and 25% buying. The nearest support for the pair is located in the zone of 1.5000-1.0525, then come levels and zones of 1.0440 and 1.0370-1.0400, 1.0300, 1.0220-1.0255. Bulls will encounter resistance in the region of 1.0560-1.0575, 1.0600-1.0620, 1.0680-1.0710, 1.0745-1.0760, 1.0800, 1.0865.
Events of the upcoming week include the publication of data on orders for capital goods and durable goods in the US on Monday, February 27. Wednesday, the first day of March, will bring a large volume of macro statistics from Germany. This includes the Harmonized Consumer Prices Index (CPI), the Purchasing Managers' Index (PMI) in the manufacturing sector, as well as the change in the number of unemployed in the country. In addition, the value of the PMI in the US manufacturing sector will be announced on this day. We are expecting the February CPI for the Eurozone, the ECB's statement on monetary policy, and data on unemployment in the US on Thursday, March 2. And there will be another portion of American statistics, including the Purchasing Managers' Index (PMI) in the service sector, at the very end of the workweek.
GBP/USD: Business Activity Grows, but the Pound Falls
The British pound is struggling to resist the advance of the dollar. Despite regular counterattacks, it is retreating step by step. Starting the week at 1.2040, GBP/USD reached a local peak at 1.2147, but then went down and ended the five-day period at 1.1942.
It is worth noting that the UK economy managed to avoid a recession at the end of 2022, and the data on business activity in the United Kingdom, published on Tuesday, February 21, is quite optimistic. The Composite PMI Index, with a forecast of 49.0, should grow from 48.5 to 53.0 points over the month. However, these are only preliminary data, with the final ones becoming available on March 1 and 3. At the same time, the confidence of British consumers is lower than during the financial crisis, the COVID-19 pandemic, and the recessions of the 1980s and 1990s.
Although inflation in the country is decreasing, it remains in double digits and is five times higher than the Bank of England's target rate. (CPI fell to +10.1% in January, with a forecast of +10.3%, and +10.5% in December). Inflation is being kept high in part due to the labour market, and there is currently no reason to believe that wage growth in the UK is slowing down.
The market expects that the Bank of England, like the Federal Reserve, will raise the key interest rate twice by 25 basis points in March and April, bringing it to a peak of 4.5%. However, many in the BoE leadership are very concerned that a significant increase in rates could overly slow down the economy. Therefore, the regulator's monetary policy, which is already ambiguous, could be adjusted at any time.
As for the median forecast of experts, 45% of them vote for further weakening of the pound, 25% expect GBP/USD to rise, and 30% prefer to refrain from making predictions. Among the trend indicators on D1, the balance of power is 85% to 15% in favour of the red. Among the oscillators, the red has a 100% advantage, 15% of which are in the oversold zone. The support levels and zones for the pair are 1.1900-1.1915, 1.1840, 1.1800, 1.1720, and 1.1600. If the pair moves north, it will face resistance at levels 1.1960, 1.1990-1.2025, 1.2075-1.2085, 1.2145, 1.2185-1.2210, 1.2270, 1.2335, 1.2390-1.2400, 1.2430-1.2450, 1.2510, 1.2575-1.2610, 1.2700, 1.2750, and 1.2940.
As for the economy of the United Kingdom, in addition to the final data on business activity (PMI) in the UK, which will be released on March 1 and 3, we can note the speech of the Governor of the Bank of England, Andrew Bailey, scheduled for Wednesday, March 1.
USD/JPY: Hopes for QT Are Weakening, but Still Remain
"It seems that the appointment of academic Kadsuo Wada as the new head of the Bank of Japan (BoJ) has not benefited the Japanese currency," we wrote in our previous review. And now, looking at the USD/JPY chart, we can only confirm this statement. In addition to the strengthening dollar, another blow to the yen was dealt by Kadsuo Wada himself. His speech on Friday, February 24, helped the pair to rise from the level of 134.04 to a height of 136.41. The comments of the future head of the central bank, who spoke in the lower house of the Japanese Parliament, in general corresponded to the current BoJ policy, and only exacerbated the disappointment of those who hoped for significant changes in the regulator's monetary policy. Investors could not discern in these comments a clear "hawkish" signal that would boost the resumption of speculative demand for the yen, which was already weakening against the backdrop of the rise of the DXY and the increase in the yield of 10-year treasuries. It should be reminded that there is a direct correlation between USD/JPY and U.S. Treasury bills. If the yield of securities rises, then the dollar rises against the Japanese yen.
We already wrote a week ago that some experts expect a serious strengthening of the Japanese currency in the future. For example, economists at Danske Bank predict that the USD/JPY rate will fall and reach the level of 125.00 in three months. BNP Paribas Research strategists hold a similar position. According to their forecasts, in the event of a tightening of monetary policy, positive yields in Japan may stimulate the repatriation of funds by local investors, resulting in USD/JPY falling to 121.00 by the end of 2023. But all of these are still quite shaky assumptions, although 75% of analysts share them. As for the near-term prospects, currently only 35% of experts expect a southward movement of the pair, while an equal number look in the opposite direction, and the remaining 20% remain neutral. Among the oscillators on the D1 chart, 100% indicate a northward movement (15% of which are in the overbought zone). Among the trend indicators, 75% point to the north and 25% to the south. The nearest support level is located in the 135.90 zone, followed by levels and zones of 134.90-135.15, 134.40, 134.00, 133.60, 132.80-133.20, 131.85-132.00, 131.25, 130.50, 129.70-130.00. Resistance levels and zones are at 136.70, 136.00, 137.50, 139.00-139.35, 140.60, 143.75.
No important macroeconomic statistics regarding the state of the Japanese economy are expected next week. However, Kadsuo Wada will give another speech on Monday, February 27, but it is unlikely to contain anything new and revolutionary.
CRYPTOCURRENCIES: Bitcoin Is Under Pressure, but It Doesn't Give Up. Not yet
Regarding the past week, we can say this: bitcoin is under pressure, but it is holding up. Among the main pressure factors, we can name the financial report of the Coinbase exchange for Q4 2022 and the strengthening of the dollar. Coinbase's revenue plummeted by 75% in the last quarter of last year, which was unusually difficult for the cryptocurrency market. The reason for such a collapse is clear: customer outflows due to a series of scandals and bankruptcies of major and not-so-major industry players. As a result, Coinbase's losses amounted to $2.46 per share. (For comparison, the profit per share of this crypto giant was $3.32 a year ago). It is unknown whether Coinbase will explode like FTX. But in any case, investors should not forget about the risks associated with this market.
As for the second pressure factor, it's all about the Federal Reserve System (FRS) of the United States, as always. Increased market expectations regarding the interest rate have strengthened the quoted currency in BTC/USD and, accordingly, weakened its base part. And it should be noted that bitcoin has shown itself to be a stronger asset in this situation than stock indices, with which it usually correlates. Thus, the S&P500 returned to mid-January values, and the Dow Jones even fell to December values, while the flagship cryptocurrency has grown by 40% since January 1, 2023.
Debate over the future of digital assets continues. Vice Chairman of legendary holding company Berkshire Hathaway and Warren Buffet's right-hand man, Charlie Munger, still calls on US authorities to completely ban cryptocurrencies. The 99-year-old billionaire called anyone who disagrees with him "idiots" and added, "I'm not proud of my country for allowing this filth. It's just ridiculous that anyone buys this [digital assets]. It's no good. It's crazy. It only does harm." Kevin O'Leary, investor, journalist, and host of the popular show Shark Tank recalled this as well. He said that "American financial regulators are tired" of watching waves of bankruptcies in the cryptocurrency industry. "These guys in Washington are very angry. The FTX collapse woke up the bear. It woke up in a rage. Senators are really tired of having to gather every six months when another major cryptocurrency firm collapses. They're tired of the industry being unregulated and anyone being able to issue their absolutely useless tokens," said the Canadian entrepreneur. His conclusion was much softer than Charles Munger's choking calls. O'Leary called on all industry participants to cooperate with the SEC and other government agencies and said that regulated companies would attract significantly more investment than their unregulated competitors.
Bitcoin quotes are mainly supported by small and medium investors at the moment. According to the analytics company Glassnode, the number of wallets with a volume of at least 1 BTC is constantly reaching new highs. Their number has increased by 20% over the past year, approaching 982,000. As for addresses with a balance of 1000 BTC or more, it has fallen from its peak in February 2021 (about 2,500) to levels in August 2019. And now (as of 20.02.2023) there are only 2,024 such whales. However, the number of addresses with a balance of 10,000 BTC or more (worth $240 million at current prices) has consistently remained near peak levels, corresponding to November 2022 and October 2018 values. Currently, there are 115 such "mega-whale" wallets.
According to co-founder of the Gemini crypto exchange Cameron Winklevoss, Asian investors may push bitcoin prices up. Winklevoss believes that the next phase of price growth will occur in the East, and the US will have to adapt to the new conditions. According to Chainalysis, the Asia-Pacific region already ranks third in the world in terms of cryptocurrency investment volume.
Several experts believe that it is crucial for the market for bitcoin to maintain levels above the intermediate resistance at $24,500. This will allow the coin to rise to $25,000 first and then to the $29,000-30,000 range. According to analysts at Matrix, the rise to $29,000 is possible by the summer, and BTC could reach $45,000 by the end of this year. However, they note that this will happen only if the pace of consumer inflation in the US continues to slow. Matrix analysts also point out that the cryptocurrency's price has already risen above $25,000 several times in recent days, despite negative news about tightening cryptocurrency regulations in the US and Europe, which they see as a positive sign.
Speaking of their forecast, Matrix also refers to the "January effect": a price success in the first month often determines the movement of the main cryptocurrency price for the entire year. In addition, experts note that historically, 12-15 months before the next halving, bitcoin's price tests its minimums. This time, such a period fell on December 2022 - March 2023.
Well-known analyst Plan B also suggests a possible rally, estimating that bitcoin may test the $42,000 level in March. As of the time of writing (Friday evening, February 24), BTC/USD is trading around $23,100. The total market capitalization of the crypto market is $1.059 trillion ($1.106 trillion a week ago). The Crypto Fear & Greed Index fell from 61 to 53 points over the week and returned from the Greed zone to the Neutral zone.
Dollar Jumped on Fed Bets, Next Few Weeks Crucial
Dollar rose broadly last week and ended as the strongest one, as markets added bets on a higher Fed terminal rate after re-acceleration in inflation data. Sterling ended as second after strong services data, which also supported Euro, while Canadian was the third after higher than expected inflation reading. Aussie was the worst performer on deteriorating risk sentiment, followed by Yen and Swiss Franc on rising benchmark yields.
So far, the pull back in stock indexes was not disastrous. Rebound in the Dollar index could still be a corrective move. But first few weeks in March would be crucial. Technically, the next moves should decide the overall tone for the rest of the first half, for stocks, yields, and forex.
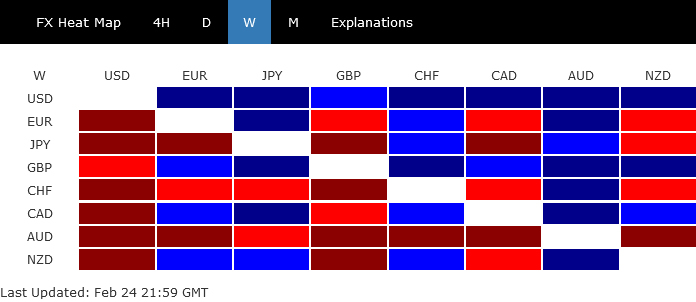
Strong data dashed Fed's disinflation hope
January data from the US released last week showed both headline and core PCE inflation reaccelerated, dashing hope of continuation of the disinflation process. While there were talks that Fed could revert to 50bps rate hike at next meeting, they're not much translated to market pricing yet. There are still a lot of important data between now and March 22, including ISMs next week, NFP the week after, and then CPI and retail sales two weeks from now. Traders might find it still a bit early to bet on Fed pushing the panic button.
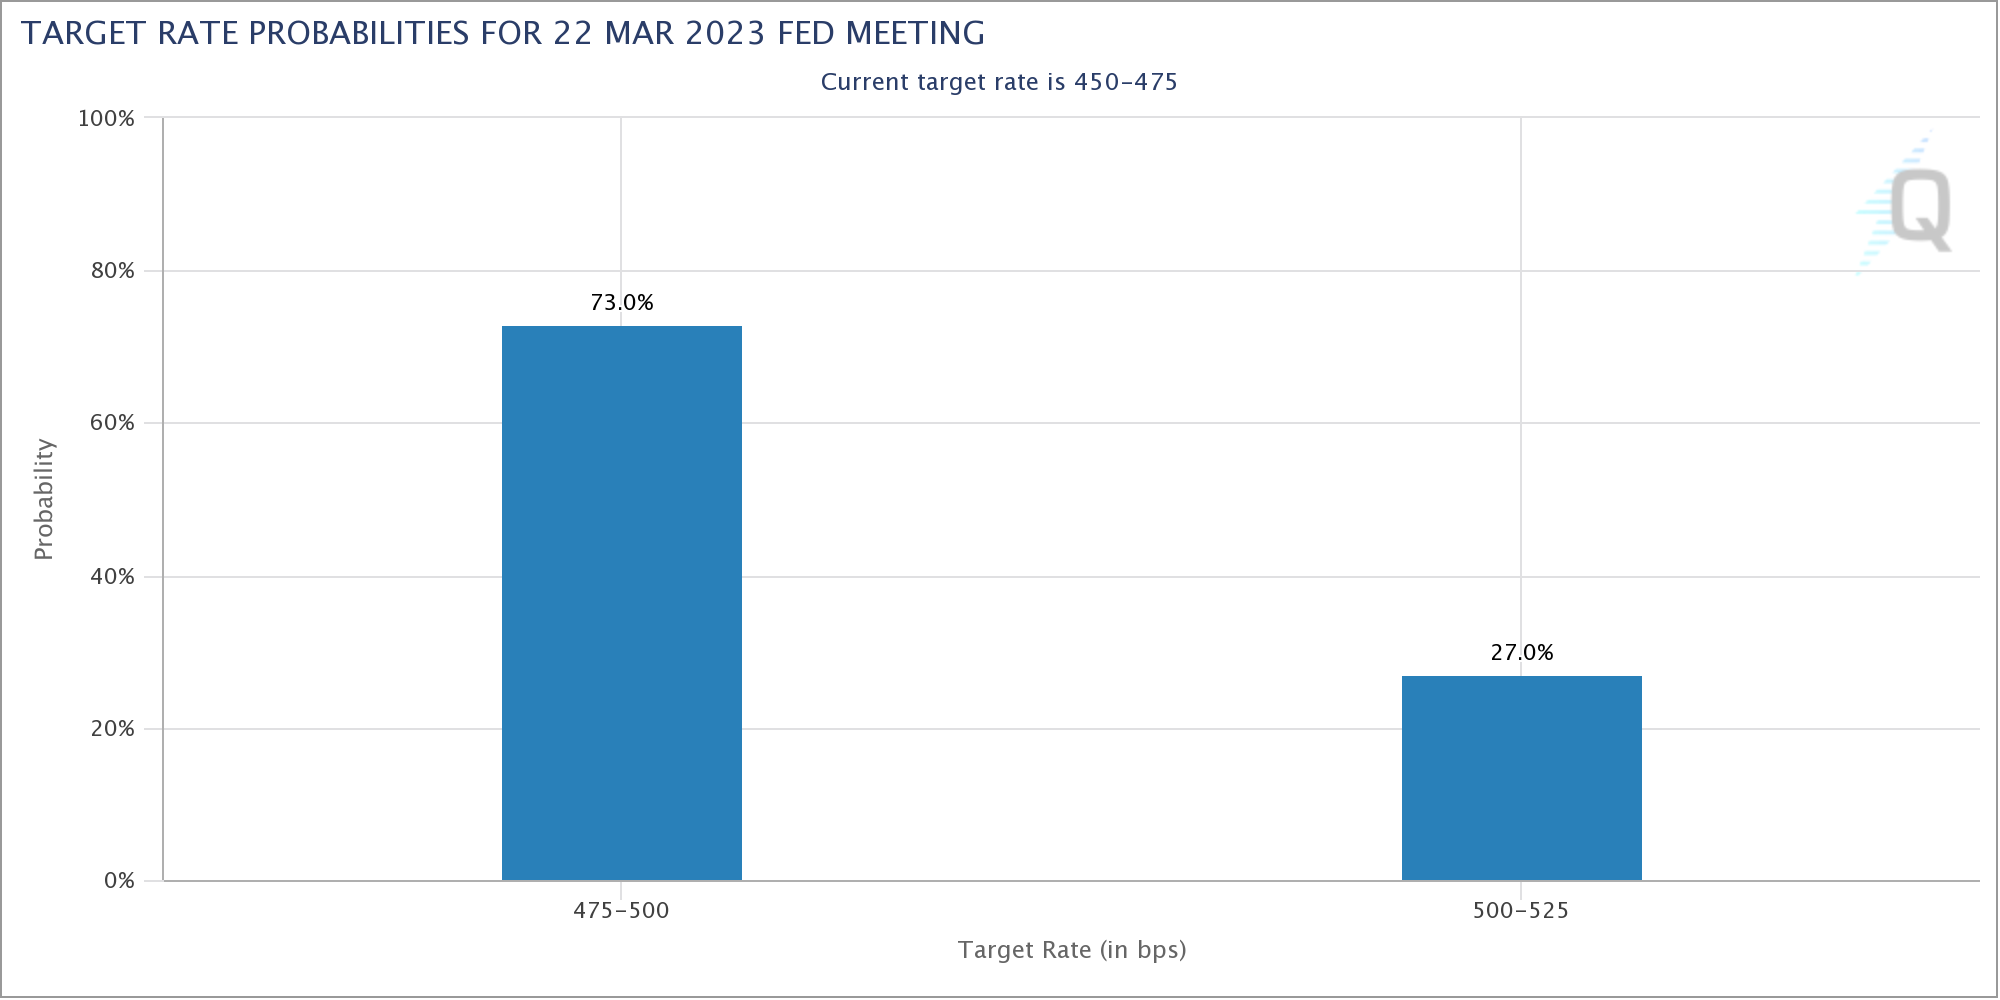
As indicated by Fed fund futures, there is still 73% chance of another 25bps hike in March to 4.75-5.00%, just 27% chance of a 50bps hike. What's more important is that markets are pricing in nearly 40% chance of one more hike in July to 5.50-5.75%, i.e. a higher terminal rate, comparing to just 20% a week ago and 0% a month ago. Pricing for July should be watched together with March in the coming weeks.
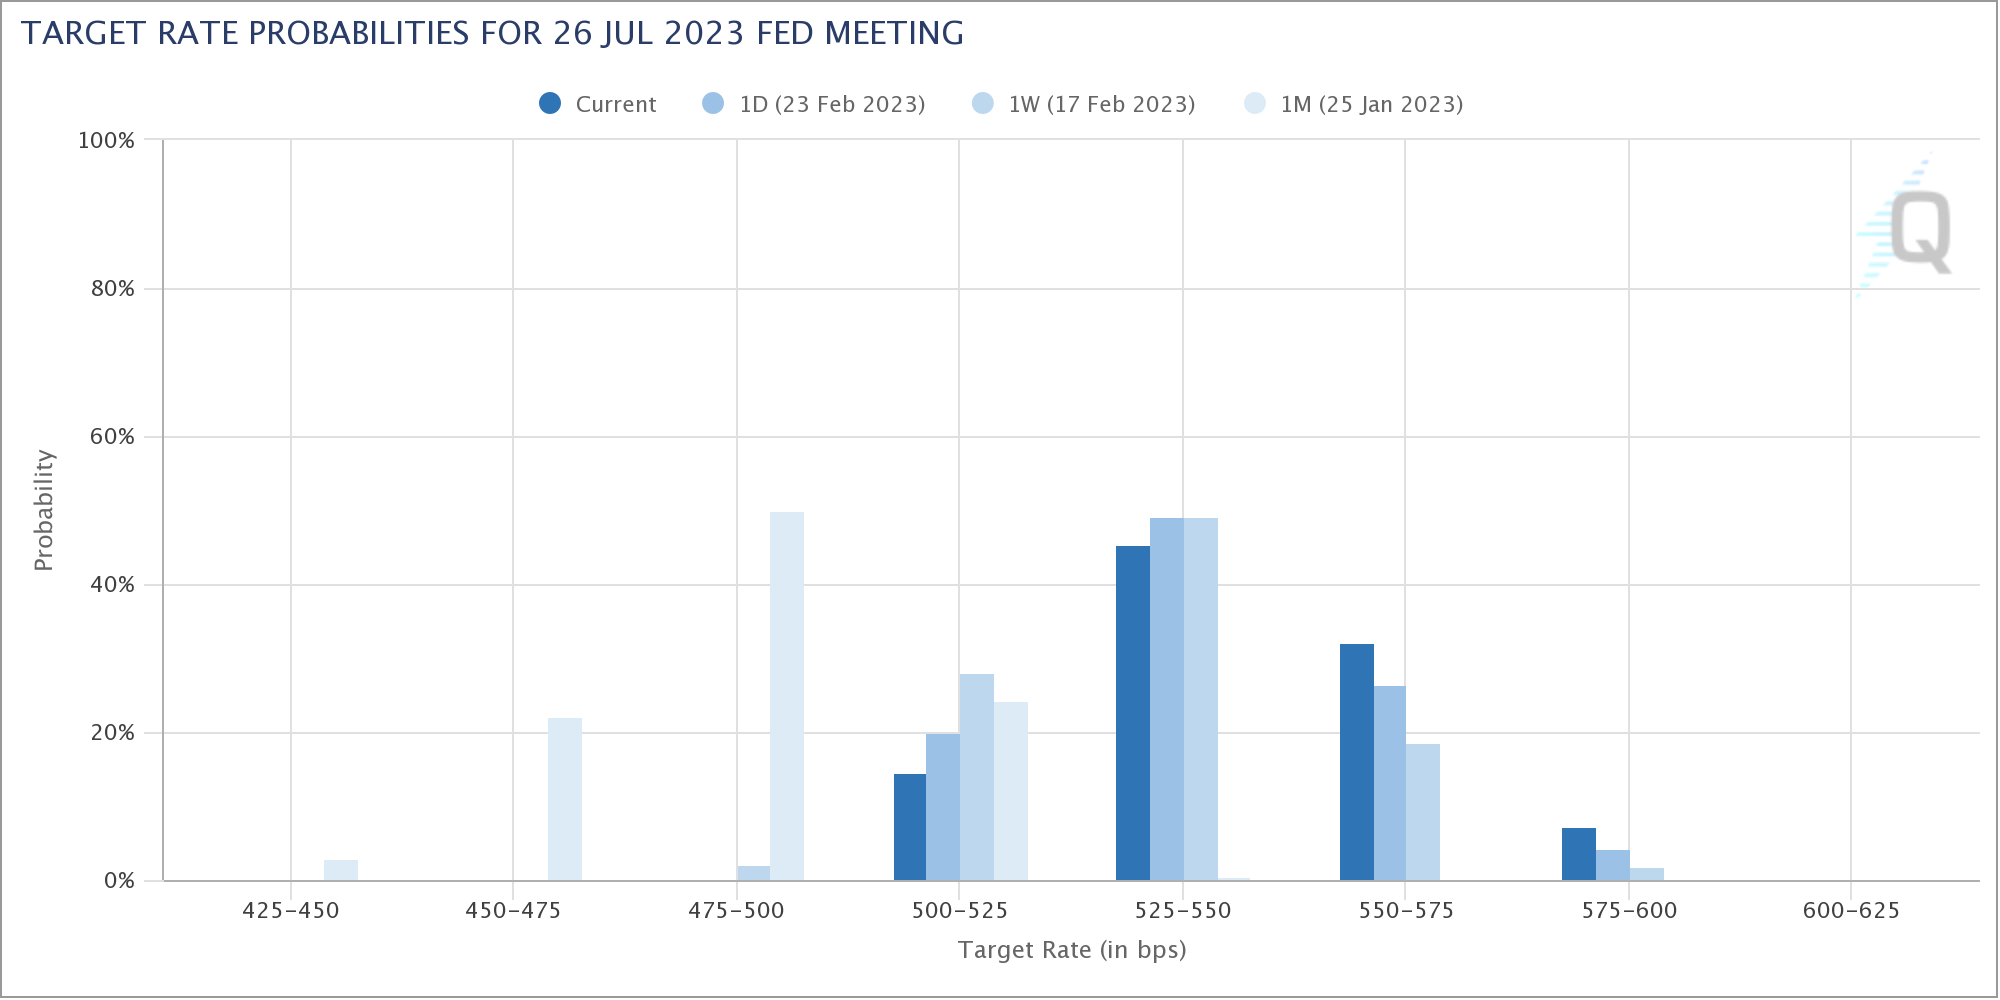
Meanwhile, economic data from some other countries were also supportive to more tightening. PMI data from Eurozone and the UK indicated that service sectors picked up much momentum in February, and are leading the economies out of recession risk.
As for ECB, a 50bps hike in March is a done deal and terminal rate would be reached in summer. Questions are whether rate will peak at the beginning or the end of summer, and what will happen in between. For now, an expectation of 3.75% peak of the main refinancing rate, i.e. one more 25bps hike after March, looks like an under-estimate. Meanwhile, BoE's tightening should continue in March, probably with a slower pace of 25bps to 4.25%. May's decision for BoE is uncertain.
While inflation in Canada slowed, the readings were stronger than expected. One month of data will certainly not pull BoC out of the pause. Also, February job data will only be released after March 8 BoC meeting. Yet, there is no guarantee that the next move after the pause, no matter how long, is a cut. Indeed, markets are pricing in the chance of one more hike this year, before a another pause and then a cut by the end of next year.
US stocks closed lower, but not disastrous (...yet?)
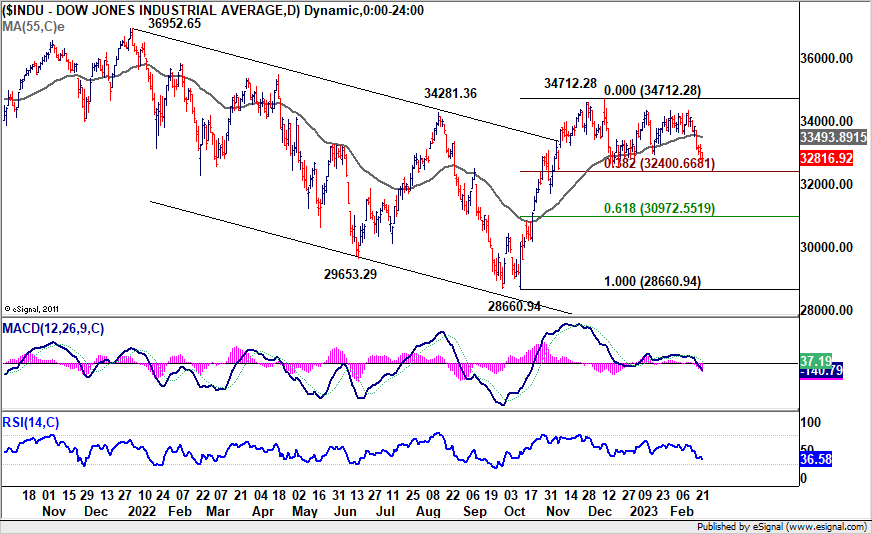
US stocks closed deeply lower last week but overall development was not disastrous yet. DOW is still holding in range for now and the price actions from 34712.28 could still be just a sideway consolidation pattern. As long as 38.2% retracement of 28600.94 to 34712.28 at 32400.66 holds, rise from 28660.94 should resume sooner rather than later. However, firm break of 32400.66 will at least bring deeper fall to 61.8% retracement at 30972.55, with risk of resuming whole down trend from 36952.65 high.
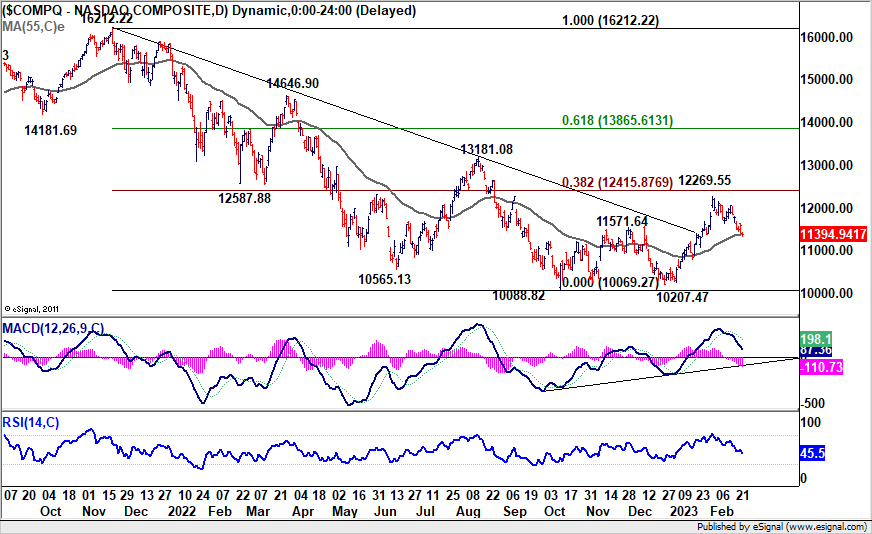
NASDAQ is currently trying to draw support from 55 day EMA (now at 11374.29). Rebound from current level will maintain near term bullishness, for at least one more take on 38.2% retracement of 16212.22 to 10207.47 at 12415.87. However, sustained break of 55 day EMA will raise the chance of resuming larger down trend from 16212.22.
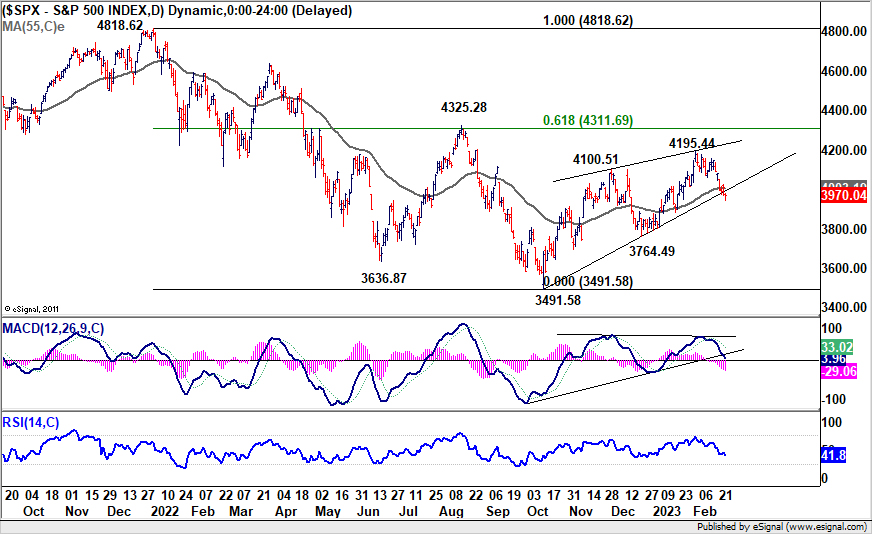
Development in S&P 500 is relatively more bearish, with break of 55 day EMA (now at 4003.19) and trendline support. Deeper decline towards 3764.49 will raise the chance that rebound from 3491.58 has completed with three waves up to 4195.44. Further break there could also set the stage for resuming the down trend from 4818.62 high. Let's see if SPX's dip was an overreaction (relative to DOW and NASDAQ), or an early warning.
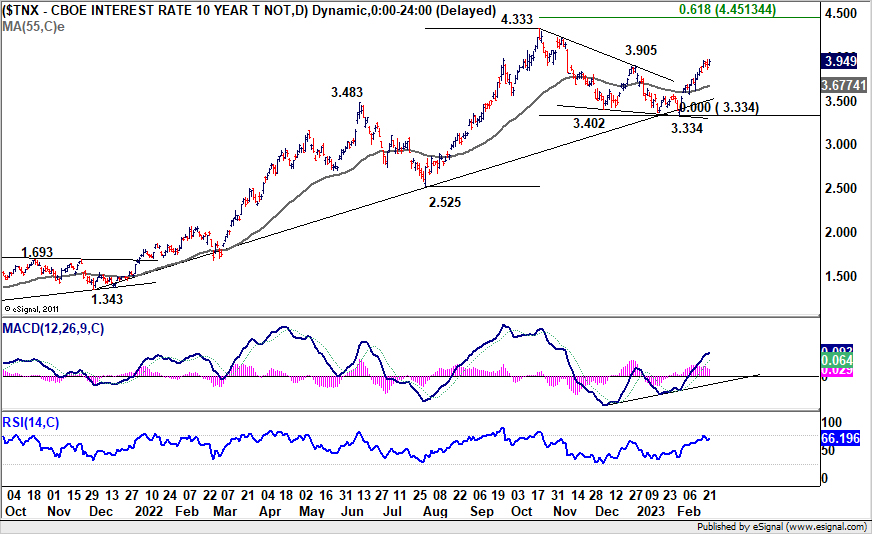
10-year yield heading back to 4.333 high
US 10-year yield finally broke through 3.905 near term resistance last week. The development affirmed that whole correction from 4.333 has completed with three waves down to 3.373. Further rise is now expected as long as 55 day EMA (now at 3.677) holds. Retest of 4.333 high would be seen next. A break there is not envisaged for now, but even in that case, strong resistance should be seen from 61.8% projection of 2.525 to 4.333 from 3.334 at 4.451 to limit upside.
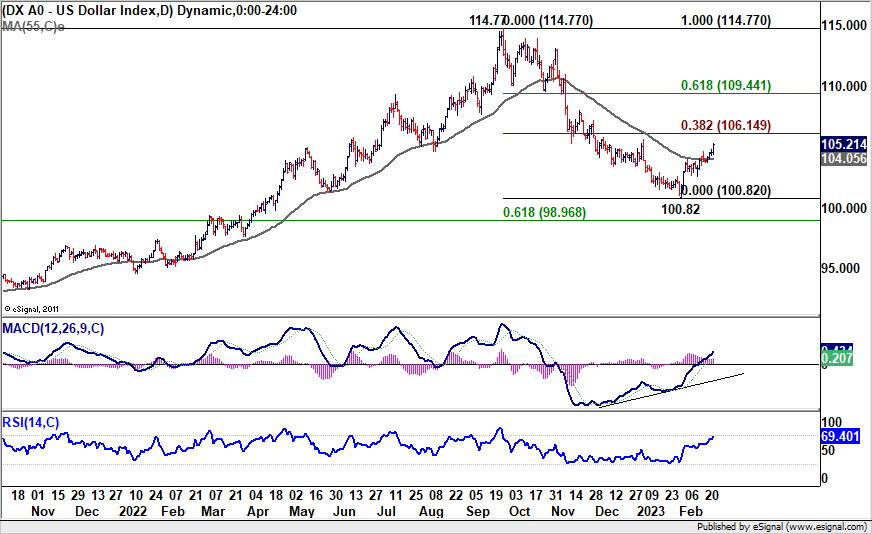
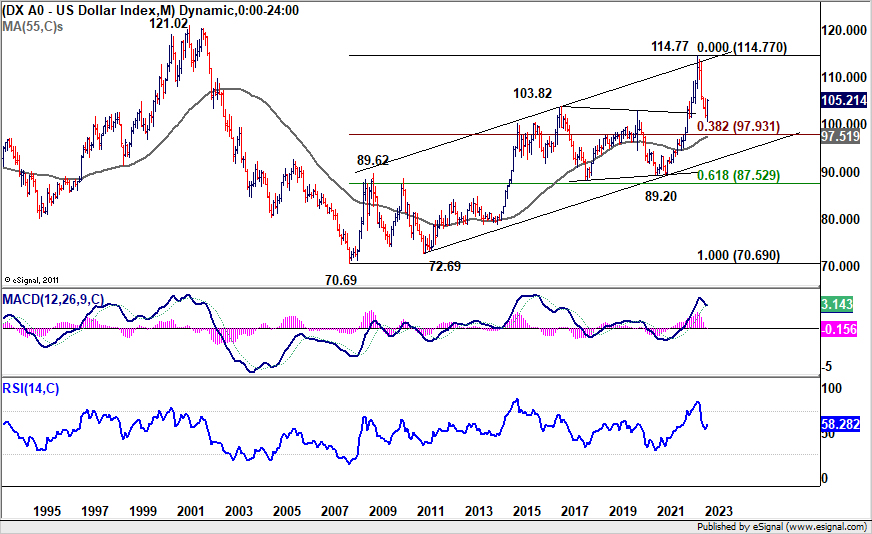
Dollar index extended rebound, still seen as a corrective rise
Dollar index's rebound from 100.82 continued last week as expected, but slight acceleration is a surprise. For now, such rise is still seen as a corrective move only. Strong resistance could be seen from 38.2% retracement of 114.77 to 100.82 at 106.14 to limit upside. Firm break of 55 day EMA (now at 104.05) will bring retest of 100.82 low.
However, decisive break of 106.14 will raise the chance of trend reversal, and bring stronger rally back to 61.8% retracement at 109.44 at least. If happens, that would most likely mean a turn in overall risk sentiment, with the bearish scenario in US stocks as mentioned above playing out. Also, that might be accompanied by strong break of 4.451 projection level in 10-year yield.
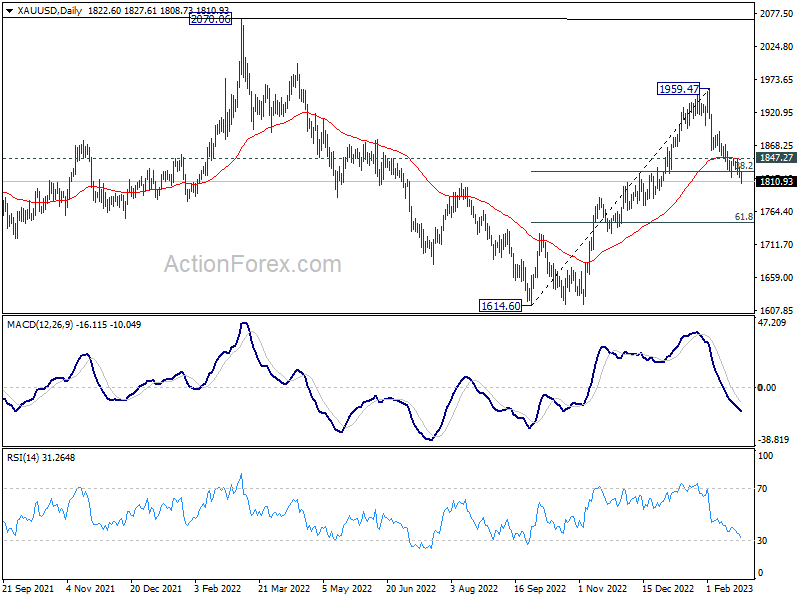
Gold extended decline, a hint on more Dollar upside?
Gold's development would be used as a gauge on Dollar as usual. Decline from 1959.47 extended last week and the rejection by 55 day EMA is a sign of bearishness. Sustained trading below 38.2% retracement of 1614.50 to 1959.47 at 1827.72 will raise the chance of near term reversal and bring deeper fall to 61.8% retracement at 1746.34 and possibly below. Such bearish development could be accompanied by break firm break of 106.14 fibonacci support in Dollar Index mentioned above.
On the other hand, rebound from current level, followed by break of 1847.27 resistance, will revive near term bullishness and bring stronger rebound back towards 1959.47 high. That could be accompanied by Dollar Index's rejection by 106.14.
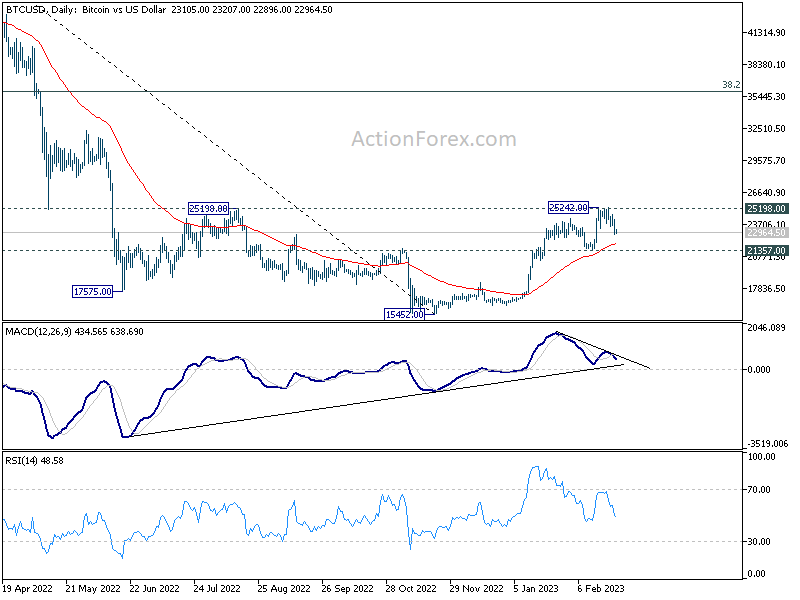
Bitcoin still struggling to break through 25198 resistance
Development in Bitcoin will also be used as a gauge to overall risk sentiment. For now, Bitcoin has yet to overcome 25198 resistance firmly. It had indeed retreated from there. But downside is support well above 21357 support so far. Thus, near term bullishness is maintained for breaking through 25198/242 soon.
However, firm break of 21357 would indicate the rebound from 15452 has completed and risk deeper fall back to retest this low. That, if happens, could be accompanied by deeper selloff in NASDAQ back towards 10088.82 low.
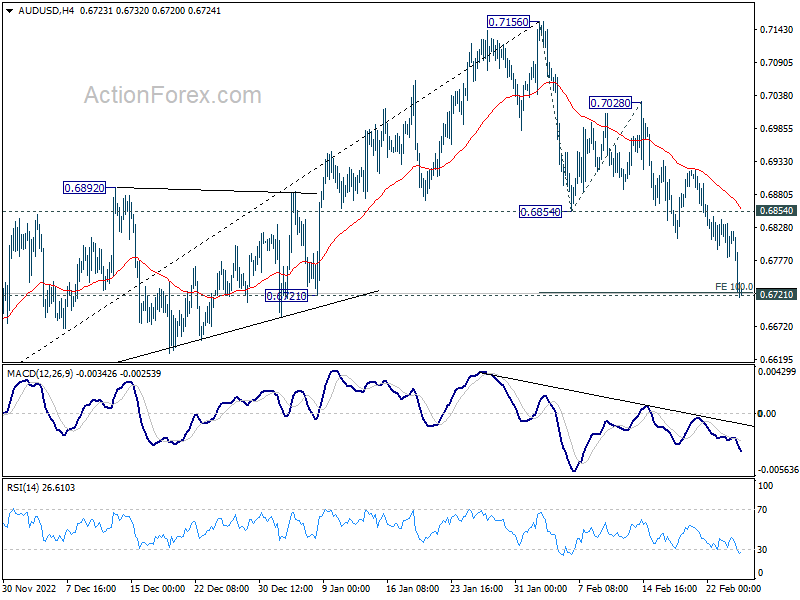
AUD/USD Weekly Report
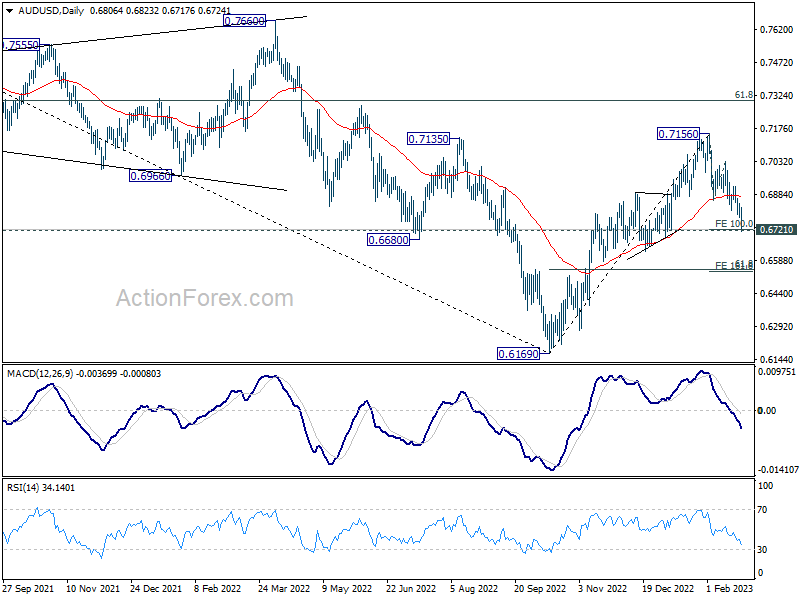
AUD/USD's decline from 0.7156 continued last week and accelerated to as low as 1.6716. There is no sign of bottoming yet. Immediate focus is on 0.6721 support this week. Decisive break there will carry larger bearish implication. Next target is 161.8% projection of of 0.6854 to 0.7028 from 0.6854 at 0.6539. On the upside, break of 0.6854 support turned resistance will argue that the pull back has completed, and turn bias back to the upside.
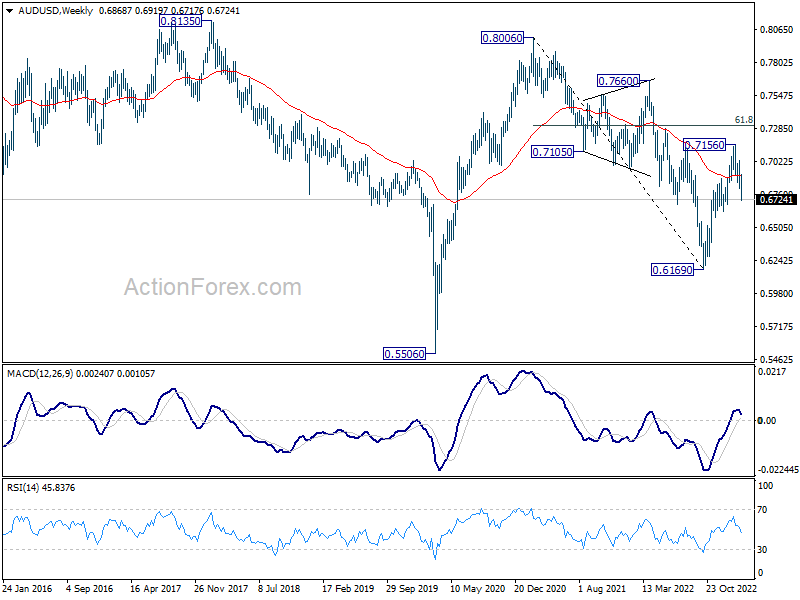
In the bigger picture, focus is now on 0.6721 structural support. Sustained break there will argue that whole rise from 0.6169 (2022 low) has completed at 0.7156, after rejection by 55 month EMA (now at 0.7179). Deeper decline would then be see back to 61.8% retracement of 0.6169 to 0.7156 at 0.6546, even as a corrective fall. Nevertheless, strong rebound from current level will retain medium term bullishness for another rise through 0.7156 later.
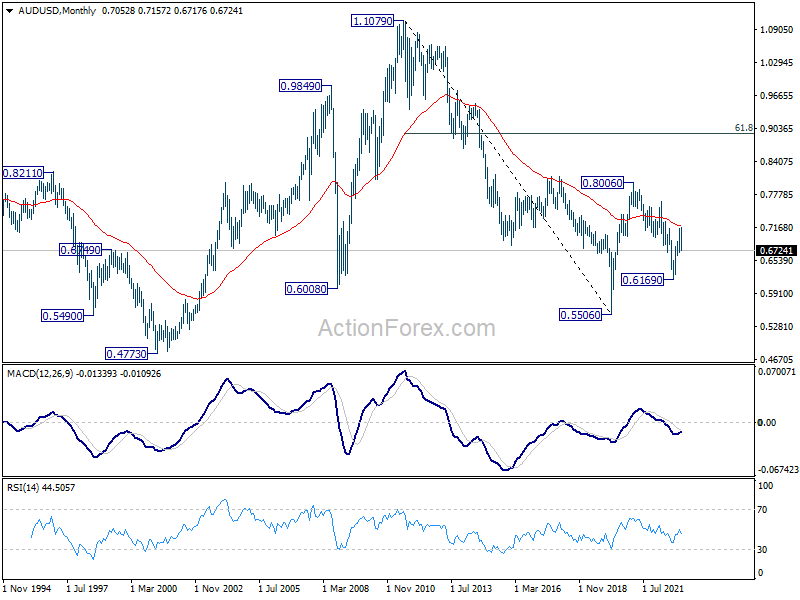
In the long term picture, initial rejection by 55 month EMA (now at 0.7179) retains long term bearishness. That is, down trend from 1.1079 (2011 high) could still resume through 0.5506 (2020 low) on resumption.
EUR/USD Weekly Outlook
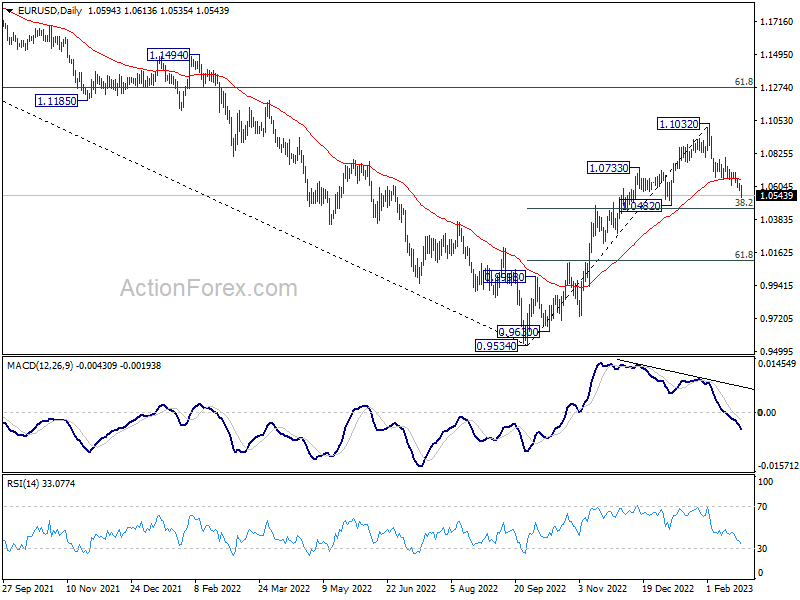
EUR/USD's decline from 1.1032 continued last week and hit as low as 1.0535. Initial bias stays on the downside this week for 38.2% retracement of 0.9534 to 1.1032 at 1.0463. Strong support could be seen around there to bring rebound, at least on first attempt. Break of 1.0668 support turned resistance will turn bias back to the upside for 1.0803 resistance and above. However, sustained break of 1.0463 will carry larger bearish implications.
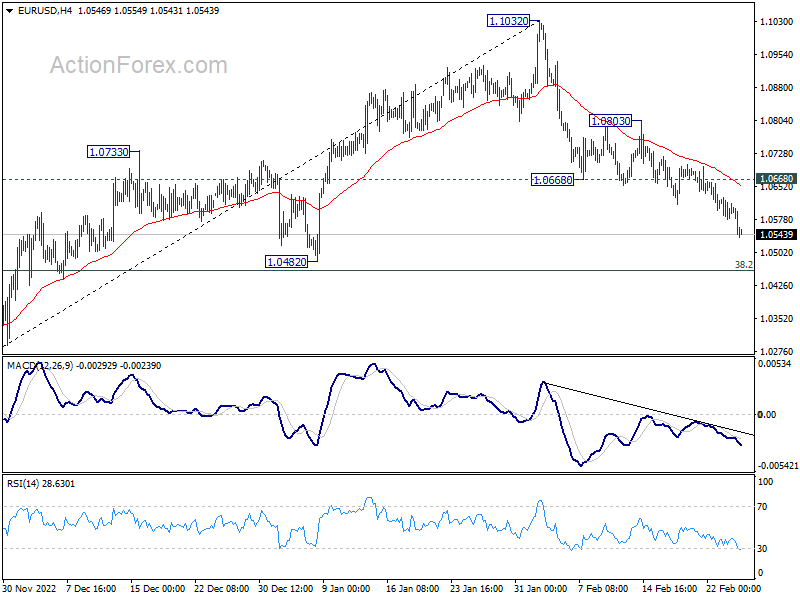
In the bigger picture, as long as 1.0482 support holds, rise from 0.9534 (2022 low) should continue to 61.8% retracement of 1.2348 (2021 high) to 0.9534 at 1.1273. However, sustained break of 1.0482 will bring deeper fall to 61.8% retracement of 0.9534 to 1.1032 at 1.0106, even as a corrective pull back.
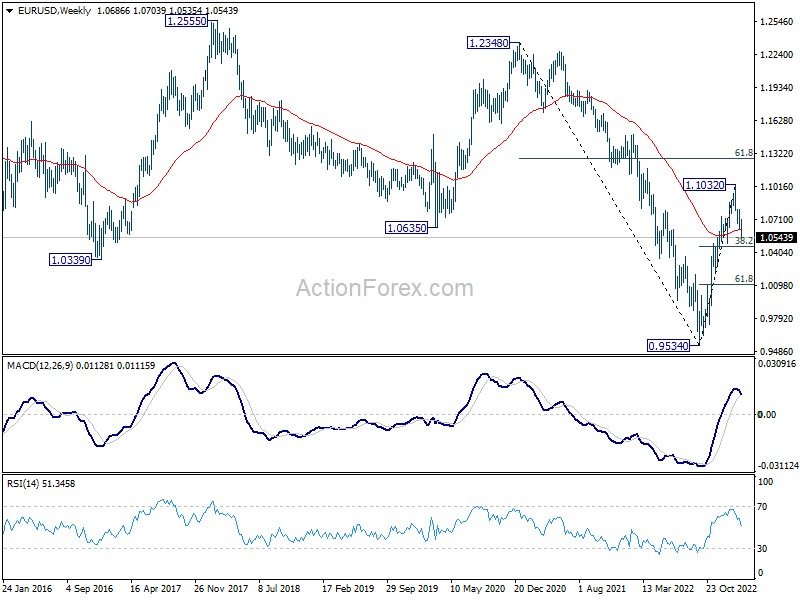
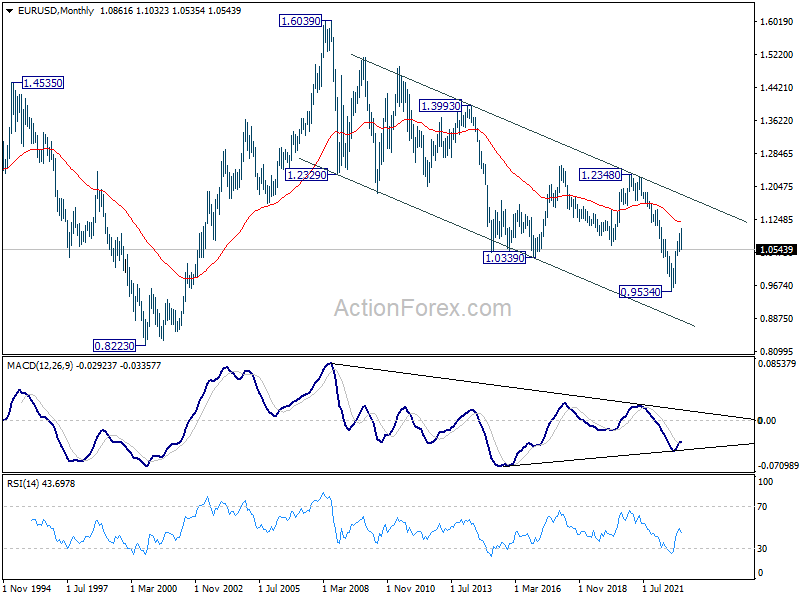
In the long term picture, while it's too early to call for long term trend reversal at this point, the strong break of 1.0635 support turned resistance (2020 low) should at least turn outlook neutral. Focus will turn to 55 month EMA (now at 1.1208). Rejection by this EMA will revive long term bearishness.
USD/JPY Weekly Outlook
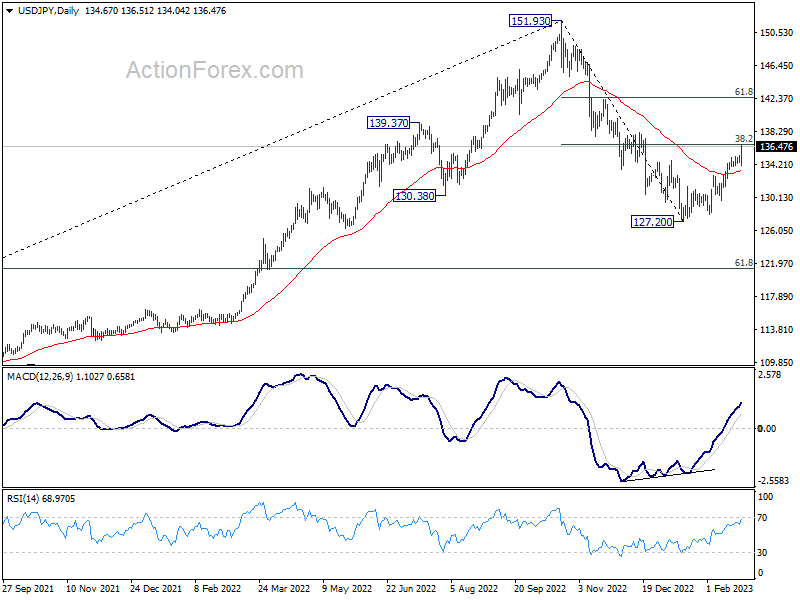
USD/JPY's rally from 127.20 accelerated to as high as 136.51. Initial bias remains on the upside this week with focus on 38.2% retracement of 151.93 to 127.20 at 136.64. Rejection by this fibonacci level, followed by break of 134.04 support, will argue that such rebound from 127.20 has completed, and turn bias back to the downside for 55 day EMA (now at 133.45) and below. However, sustained trading above 136.64 will indicate that fall from 151.93 has completed, and bring further rally to 61.8% retracement at 142.48.
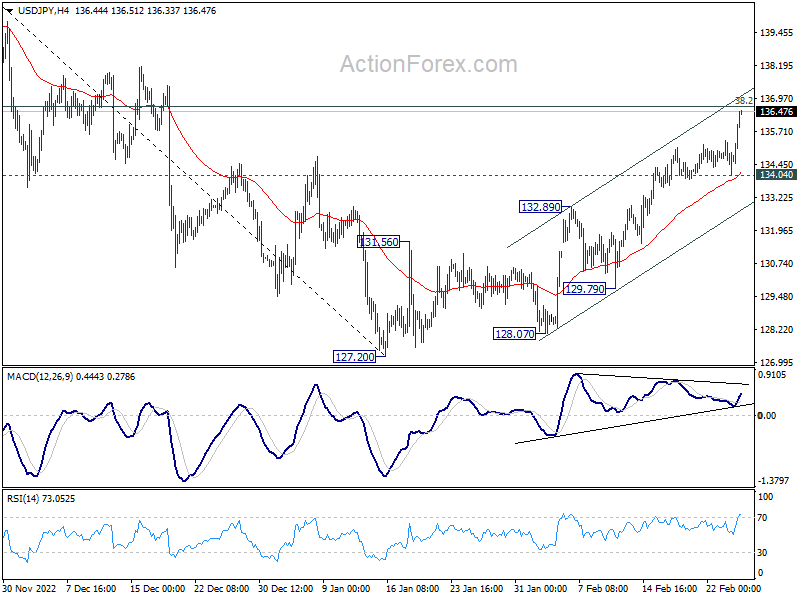
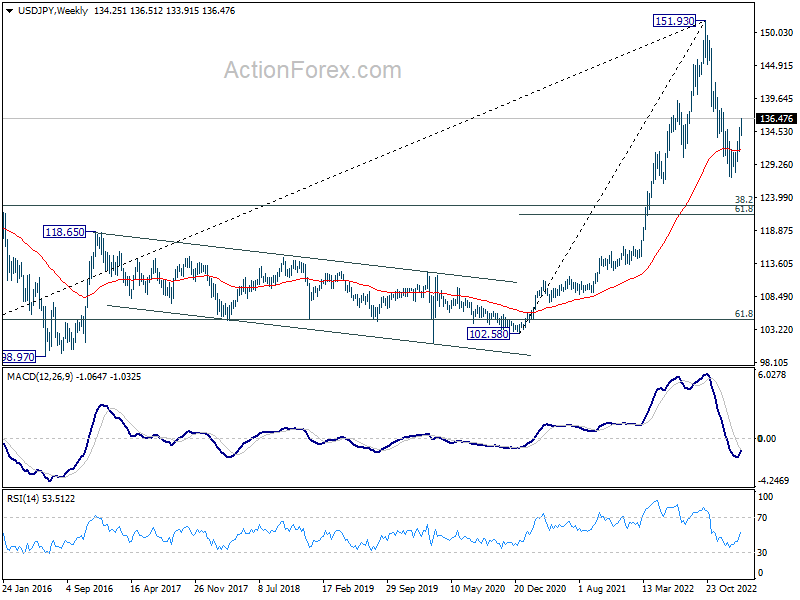
In the bigger picture, focus is now on 38.2% retracement of 151.93 to 127.20 at 136.64. Sustained break there will indicate that price actions from 151.93 medium term are merely a corrective pattern. Such development will maintain long term bullishness. Rejection by 136.64 will, on the downside, extend the fall from 151.93 to 61.8% retracement of 102.58 to 151.93 at 121.43 at a later stage.
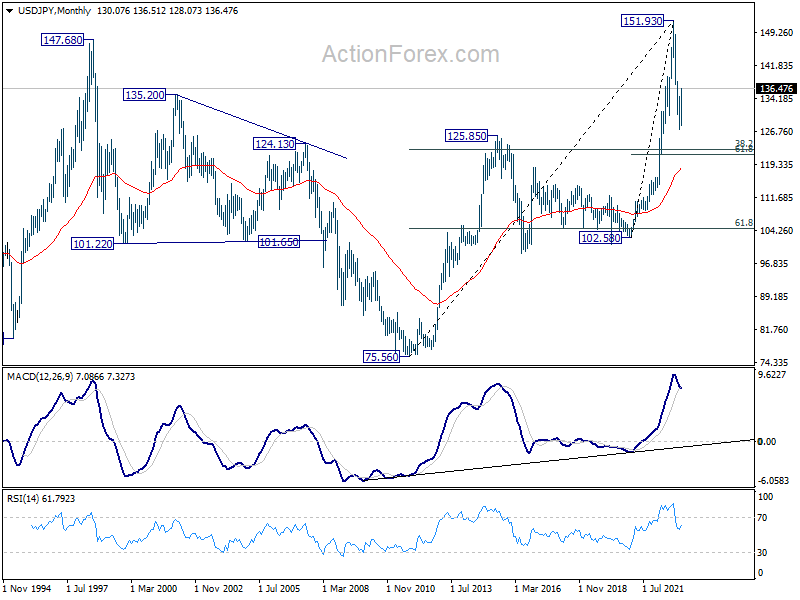
In the long term picture, 151.93 looks increasingly likely a major top. But it's too early to call for long term bearish reversal at this point. Rebound from around 38.2% retracement of 75.56 to 151.93 at 122.75 will keep the case open for price action from 151.93 to be just a corrective pattern.
GBP/USD Weekly Outlook
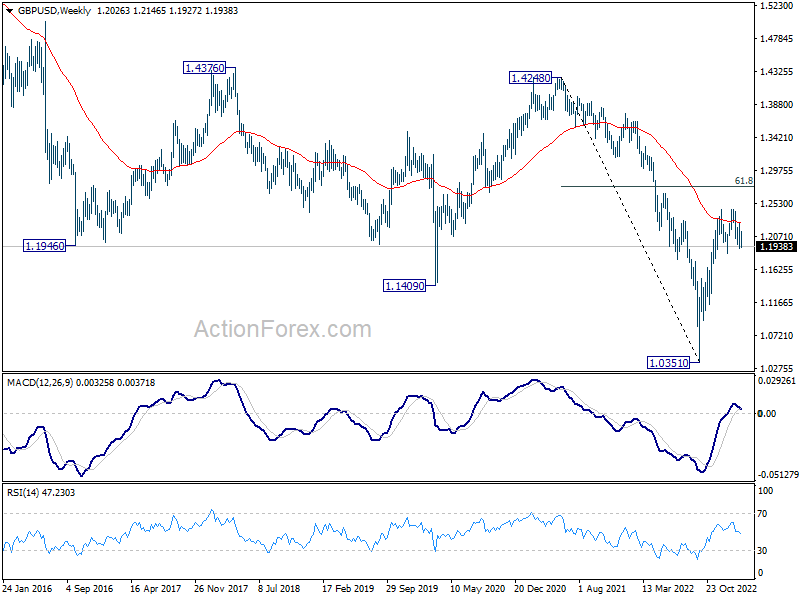
GBP/USD reversed after rebounding to 1.2146 last week and stayed below falling 55 day EMA. Near term outlook remains bearish with initial focus on 1.1914 support this week. Firm break there will resume the decline from 1.2446 for 1.1840 support and possibly below. On the upside, break of 1.2146 resistance will turn bias back to the upside for further rebound to 1.2269 and above.
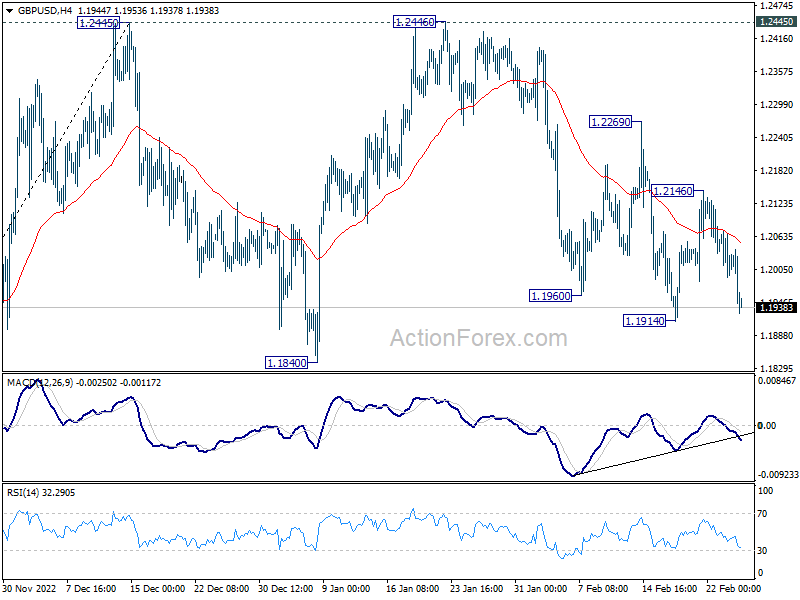
In the bigger picture,as long as 1.1840 support holds, rise from 1.0351 medium term bottom (2022 low) should still continue to 61.8% retracement of 1.4248 (2021 high) to 1.0351 at 1.2759. However, decisive break of 1.1840 will complete a double top pattern (1.2445, 1.2446) after rejection by 55 week EMA (now at 1.2251). Deeper decline should be seen back to 38.2% retracement of 1.0351 to 1.2445 at 1.1645.
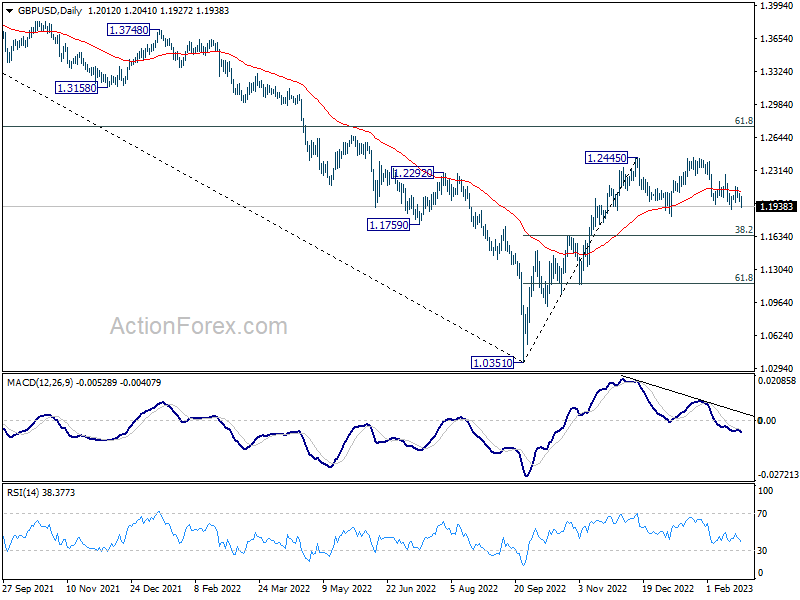
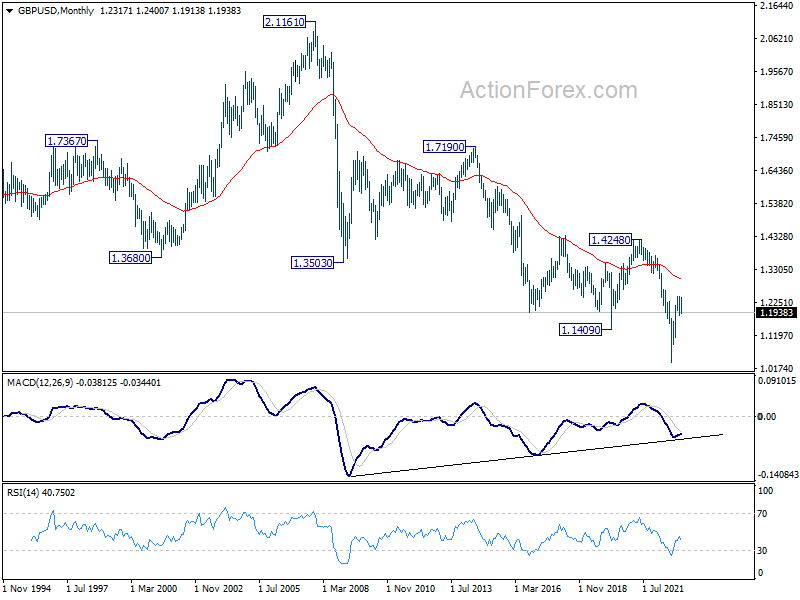
In the longer term picture, as long as 1.4248 resistance holds (2021 high), long term outlook will remain neutral at best. Down trend from 2.1161 (2007) could still resume for another low through 1.0351 at a later stage.