
Sample Category Title
GBP/USD Mid-Day Outlook
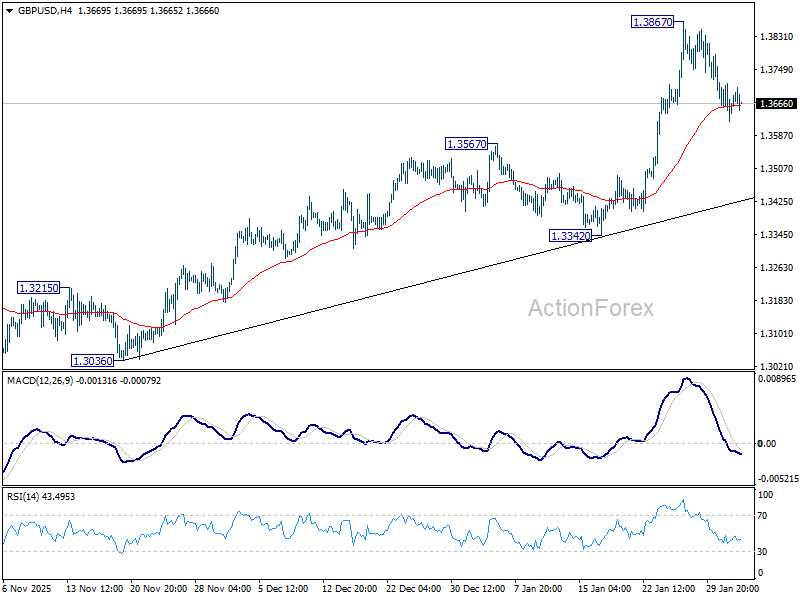
Daily Pivots: (S1) 1.3622; (P) 1.3668; (R1) 1.3714; More...
GBP/USD's pullback from 1.3867 short term top is in progress. Intraday bias stays mildly on the downside to 55 D EMA (now at 1.3471). On the upside, firm break of 1.3867 will resume larger up trend towards 1.4284 key resistance.
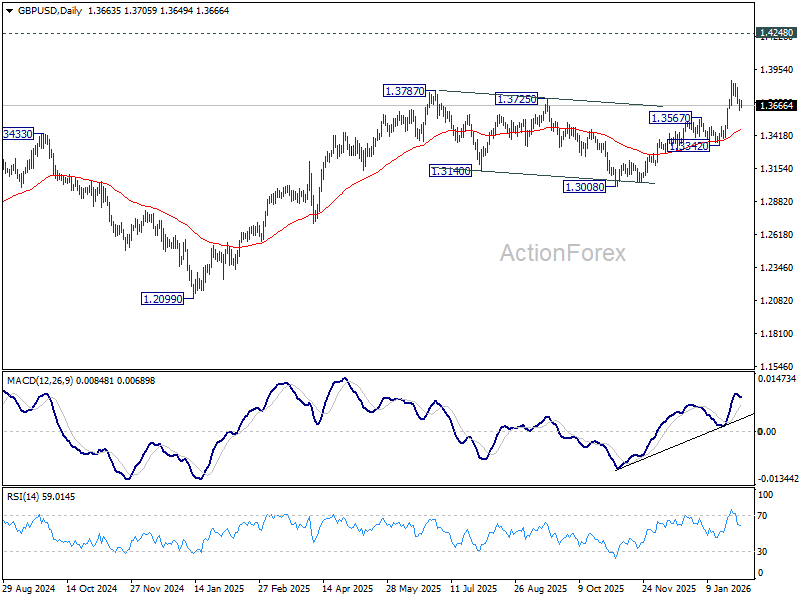
In the bigger picture, rise from 1.0351 (2022 low) is resuming by breaking through 1.3787 high. Further rally should be seen to 1.4284 key resistance (2021 high). Decisive break there will add to the case of long term bullish trend reversal. For now, outlook will stay bullish as long as 1.3008 support holds, even in case of deep pullback.
EUR/USD Mid-Day Outlook
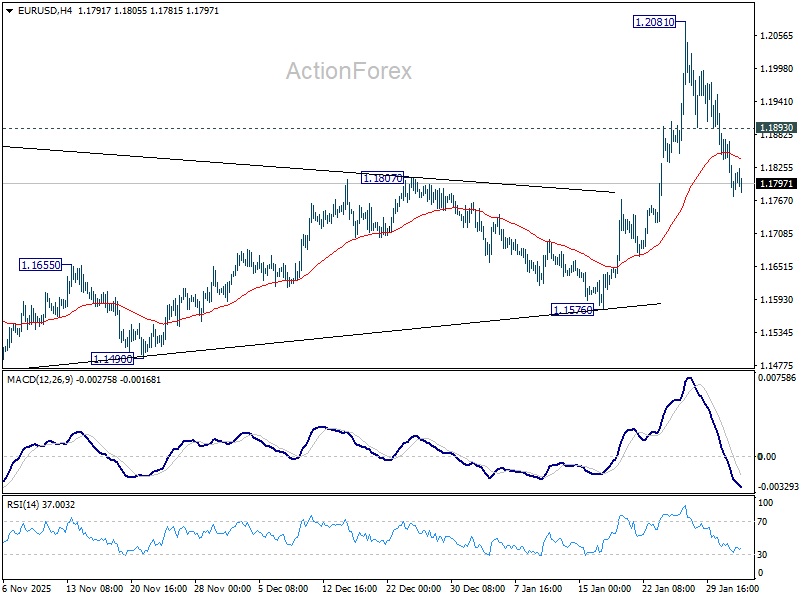
Daily Pivots: (S1) 1.1752; (P) 1.1814; (R1) 1.1851; More….
EUR/USD's fall from 1.2081 short term top is still in progress. Intraday bias remains mildly on the downside for 55 D EMA (now at 1.1721). Firm break there will raise the chance of reversal on rejection by 1.2 psychological level, and target 1.1576 support. On the upside, above 1.1893 minor resistance will turn bias neutral. Decisive break above 1.2 will carry larger bullish implications.
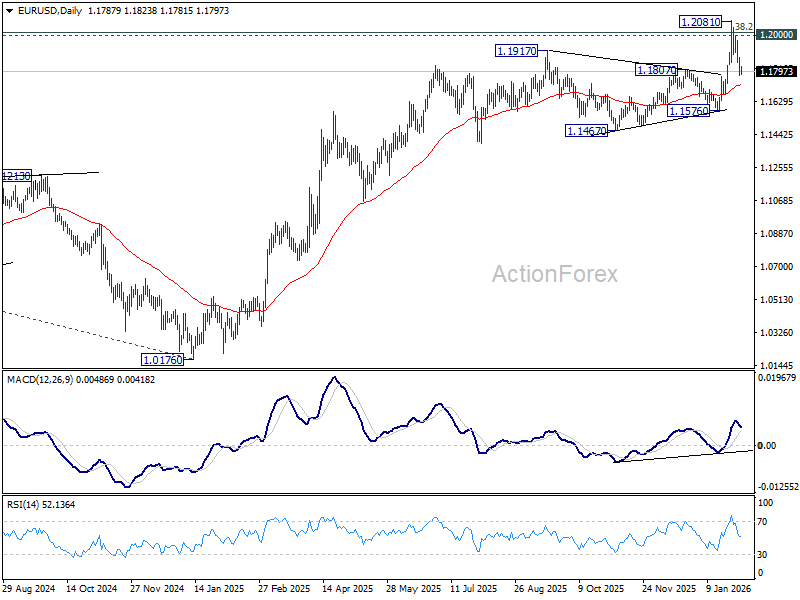
In the bigger picture, as long as 55 W EMA (now at 1.1458) holds, up trend from 0.9534 (2022 low) is still in favor to continue. Decisive break of 1.2 key psychological level will add to the case of long term bullish trend reversal. Next medium term target will be 138.2% projection of 0.9534 to 1.1274 from 1.0176 at 1.2581. However, sustained trading below 55 W EMA will argue that rise from 0.9534 has completed as a three wave corrective bounce, and keep long term outlook bearish.
FX Drifts as US Data Quiet and NFP Release Delayed
Forex markets are trading relatively steady as the US session gets underway, with no strong directional conviction emerging. Early risk-on momentum from Asia has faded, leaving major pairs consolidating rather than extending moves.
The initial lift in sentiment came from Asia following the announcement of a US–India trade deal, which helped support higher-beta currencies. Australian and New Zealand Dollars benefited most, while traditional defensive currencies such as Yen and, to a lesser extent, Dollar lagged. Aussie also drew support from the hawkish RBA rate hike, as new forecasts suggest at least one more rate hike is likely later this year.
That lack of conviction is unlikely to change today, given the empty US economic calendar. In the absence of fresh data, price action is expected to remain driven by positioning rather than fundamentals. Ironically, the most anticipated US data release of the week will not arrive on time. The January 2026 non-farm payrolls report has been delayed again due to the the temporary US government shutdown.
Although data collection has already been completed, the shutdown has forced a delay in publication. The report, originally due on Friday, will be released once federal funding is restored, leaving a gap in near-term labor market signals.
Politically, progress is being made toward resolving the shutdown. The Senate passed multiple funding bills last week, including a short-term measure for the Department of Homeland Security, but final approval still rests with the House. The House Rules Committee met today to prepare a floor vote, with Republican leadership aiming for a final passage vote tomorrow.
In FX performance terms for the week so far, Aussie sits at the top of the leaderboard, followed by Kiwi and Sterling. Yen is the clear underperformer, trailed by Swiss Franc and the Euro. Dollar and Loonie remain positioned in the middle of the pack.
In Europe, at the time of writing, FTSE is down -0.73%. DAX is up 0.22%. CAC is down -0.20%. UK 10-year yield is up 0.015 at 4.524. Germany 10-year yield is up 0.029 at 2.899. Earlier in Asia, Nikkei rose 3.92%. Hong Kong HSI rose 0.22%. China Shanghai SSE rose 1.29%. Singapore Strait Times rose 1.06%. Japan 10-year JGB yield rose 0.023 to 2.260.
Fed's Miran sees scope for over 100bp of Fed easing this year
Fed Stephen Miran, a well-known policy dove, said he is looking for “a little bit more than a point” of interest rate cuts over the course of the year, arguing that current monetary policy remains too restrictive for the economy. Speaking in an interview with Fox Business today, Miran said the balance of risks now favors easing rather than prolonged restraint.
Miran acknowledged that inflation remains above the Fed’s 2% target, but stressed that underlying price pressures appear far more benign than headline readings suggest. In his view, solid growth combined with easing regulatory burdens has improved the economy’s supply-side dynamics, giving policymakers room to cut rates without reigniting inflation.
While Miran’s formal term as a temporary governor ended at the close of January, he continues to serve until a successor is confirmed.
Fed's Barkin says economic “fog” lifting, inflation miss still demands caution
Richmond Fed President Tom Barkin said the economic environment is becoming clearer as the US moves into 2026, after what he described as an overwhelming pace of change last year. Speaking today, Barkin likened 2025 to “driving in a dense fog,” citing geopolitical tensions, rapid advances in artificial intelligence, and sweeping government policy shifts spanning tariffs, immigration, taxes, deregulation, and fiscal spending.
Barkin argued that the fog now appears to be lifting, revealing an economy that remains “remarkably resilient.” He pointed to meaningful additional support from government policy, including tax refunds, reduced withholding, lower gasoline prices, and the cumulative impact of the Fed’s rate cuts over the past year and a half. Deregulatory efforts should also bolster growth, while slower net migration reduces the pace of job growth needed to keep unemployment stable. At the same time, renewed bipartisan focus on affordability could add disinflationary pressure in coming months.
Despite the more constructive outlook, Barkin stressed that inflation remains above target and has done so since 2021. He said it would be easy to attribute the overshoot to one-off factors such as tariffs or shelter-cost measurement lags, but warned against complacency. “I take this sustained miss seriously,” he said, arguing that today’s inflation outcomes, regardless of their cause, "significantly influence tomorrow’s inflation."
RBA delivers expected hike, forecast path points to another move
The RBA raised the cash rate by 25bps to 3.85% as widely expected, with the decision taken unanimously. While the accompanying statement avoided any explicit commitment to further tightening, the updated forecasts carried a more hawkish undertone.
Notably, the new projections are built on an assumption that the policy rate rises further to around 4.2% by the end of this year. That implicitly points to at least one additional hike being needed in the Bank’s view to contain resurging inflationary pressures.
In its statement, the RBA acknowledged that a broad range of recent data confirms inflationary pressures “picked up materially” in the second half of 2025. While part of the acceleration is judged to be temporary, the Bank highlighted that private demand is growing faster than expected, capacity pressures are higher than previously assessed, and labour market conditions remain slightly tight. Against that backdrop, the Board concluded that inflation is “likely to remain above target for some time,” justifying today’s move.
The message suggests policy is shifting from fine-tuning toward a more deliberate effort to re-anchor inflation expectations. The revised forecasts reinforce that view. CPI is now projected to peak at 4.2% in June 2026, up sharply from the previous 3.7% estimate, before easing to 3.6% by December 2026 and only gradually returning to 2.7% by end-2027. Trimmed mean inflation was also revised higher across the horizon, with the peak lifted to 3.7% in mid-2026.
Growth and labour market assumptions remain resilient. Average GDP growth for 2026 was revised up to 2.1% (from 1.9%), while the unemployment rate was nudged lower to 4.3% (down from 4.4%) next year, before edging higher to 4.5% in 2027. That profile suggests the RBA sees room to keep policy restrictive without inflicting material damage on employment, keeping the door open for further tightening if inflation fails to cool as projected.
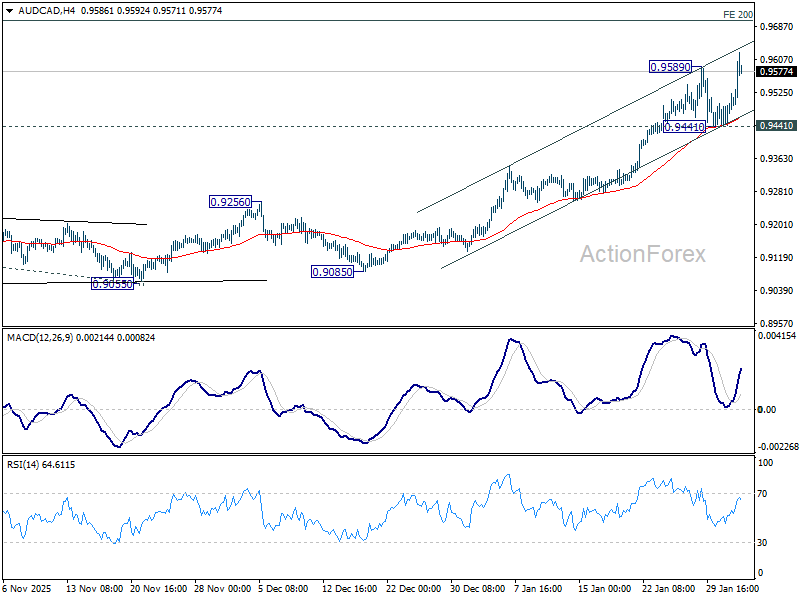
AUD/CAD Breaks Higher, 0.97 Next
Aussie rallied sharply after the hawkish rate hike from the RBA , but gains cooled as Governor Michele Bullock delivered a measured press conference. The price action reflected a strong initial policy reaction followed by a pause as guidance resisted a straight-line tightening narrative. Even so, Aussie remains the strongest performer on the day. The moderation in momentum should be read as consolidation rather than reversal, with Bullock deliberately avoiding language that would lock the Bank into a clear tightening sequence.
Bullock stressed that the RBA is “not ruling anything in or out” and will remain data dependent. Despite the Bank’s own forecasts implying another hike later this year, she resisted giving a straight answer on whether policy is now in a tightening cycle, saying, “I don’t know if it is in a cycle.”
She emphasized the Board’s cautious approach, noting that policymakers have delivered one rate rise and will now assess how financial conditions respond. Early signs of tightening through the exchange rate are already evident, but the RBA wants to observe impacts on credit and housing before drawing conclusions. Crucially, Bullock preserved optionality. While she stopped short of predicting further hikes, she also made clear that additional tightening remains possible if inflation stays too high, keeping the policy bias conditionally hawkish rather than pre-committed.
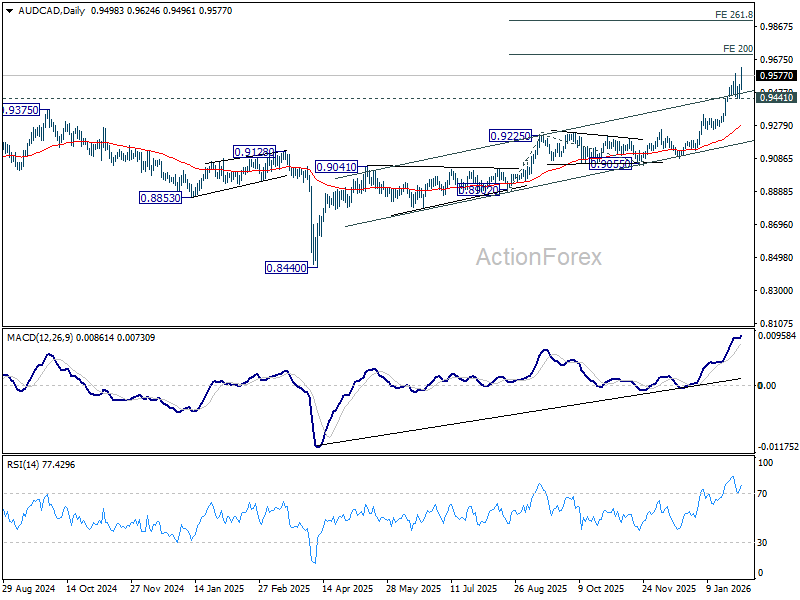
Across the crosses, the Aussie’s strength is more pronounced. AUD/CAD broke above the 0.9589 temporary top to resume its uptrend, supported by a rising 55 4H EMA. With prior break of the medium-term rising channel ceiling signaling upside acceleration, the outlook stays firmly bullish. Next target is 200% projection of 0.8902 to 0.9225 from 0.9055 at 0.9701. Decisive break there will target 261.8% projection at 0.9901.
EUR/USD Mid-Day Outlook
Daily Pivots: (S1) 1.1752; (P) 1.1814; (R1) 1.1851; More….
EUR/USD's fall from 1.2081 short term top is still in progress. Intraday bias remains mildly on the downside for 55 D EMA (now at 1.1721). Firm break there will raise the chance of reversal on rejection by 1.2 psychological level, and target 1.1576 support. On the upside, above 1.1893 minor resistance will turn bias neutral. Decisive break above 1.2 will carry larger bullish implications.
In the bigger picture, as long as 55 W EMA (now at 1.1458) holds, up trend from 0.9534 (2022 low) is still in favor to continue. Decisive break of 1.2 key psychological level will add to the case of long term bullish trend reversal. Next medium term target will be 138.2% projection of 0.9534 to 1.1274 from 1.0176 at 1.2581. However, sustained trading below 55 W EMA will argue that rise from 0.9534 has completed as a three wave corrective bounce, and keep long term outlook bearish.
Fed’s Barkin says economic “fog” lifting, inflation miss still demands caution
Richmond Fed President Tom Barkin said the economic environment is becoming clearer as the US moves into 2026, after what he described as an overwhelming pace of change last year. Speaking today, Barkin likened 2025 to “driving in a dense fog,” citing geopolitical tensions, rapid advances in artificial intelligence, and sweeping government policy shifts spanning tariffs, immigration, taxes, deregulation, and fiscal spending.
Barkin argued that the fog now appears to be lifting, revealing an economy that remains “remarkably resilient.” He pointed to meaningful additional support from government policy, including tax refunds, reduced withholding, lower gasoline prices, and the cumulative impact of the Fed’s rate cuts over the past year and a half. Deregulatory efforts should also bolster growth, while slower net migration reduces the pace of job growth needed to keep unemployment stable. At the same time, renewed bipartisan focus on affordability could add disinflationary pressure in coming months.
Despite the more constructive outlook, Barkin stressed that inflation remains above target and has done so since 2021. He said it would be easy to attribute the overshoot to one-off factors such as tariffs or shelter-cost measurement lags, but warned against complacency. “I take this sustained miss seriously,” he said, arguing that today’s inflation outcomes, regardless of their cause, "significantly influence tomorrow’s inflation."
Fed’s Miran sees scope for over 100bp of Fed easing this year
Fed Stephen Miran, a well-known policy dove, said he is looking for “a little bit more than a point” of interest rate cuts over the course of the year, arguing that current monetary policy remains too restrictive for the economy. Speaking in an interview with Fox Business today, Miran said the balance of risks now favors easing rather than prolonged restraint.
Miran acknowledged that inflation remains above the Fed’s 2% target, but stressed that underlying price pressures appear far more benign than headline readings suggest. In his view, solid growth combined with easing regulatory burdens has improved the economy’s supply-side dynamics, giving policymakers room to cut rates without reigniting inflation.
While Miran’s formal term as a temporary governor ended at the close of January, he continues to serve until a successor is confirmed.
AUD/CAD Breaks Higher, 0.97 Next
Aussie rallied sharply after the hawkish rate hike from the RBA , but gains cooled as Governor Michele Bullock delivered a measured press conference. The price action reflected a strong initial policy reaction followed by a pause as guidance resisted a straight-line tightening narrative. Even so, Aussie remains the strongest performer on the day. The moderation in momentum should be read as consolidation rather than reversal, with Bullock deliberately avoiding language that would lock the Bank into a clear tightening sequence.
Bullock stressed that the RBA is “not ruling anything in or out” and will remain data dependent. Despite the Bank’s own forecasts implying another hike later this year, she resisted giving a straight answer on whether policy is now in a tightening cycle, saying, “I don’t know if it is in a cycle.”
She emphasized the Board’s cautious approach, noting that policymakers have delivered one rate rise and will now assess how financial conditions respond. Early signs of tightening through the exchange rate are already evident, but the RBA wants to observe impacts on credit and housing before drawing conclusions. Crucially, Bullock preserved optionality. While she stopped short of predicting further hikes, she also made clear that additional tightening remains possible if inflation stays too high, keeping the policy bias conditionally hawkish rather than pre-committed.
Across the crosses, the Aussie’s strength is more pronounced. AUD/CAD broke above the 0.9589 temporary top to resume its uptrend, supported by a rising 55 4H EMA. With prior break of the medium-term rising channel ceiling signaling upside acceleration, the outlook stays firmly bullish. Next target is 200% projection of 0.8902 to 0.9225 from 0.9055 at 0.9701. Decisive break there will target 261.8% projection at 0.9901.
Very Limited Rebound in Crypto
Market Overview
The crypto market capitalisation grew by 1.7% in 24 hours to $2.65 trillion. Once again, the positive sentiment in global financial markets came to the rescue of crypto. BNB is leading the rebound, benefiting from the support of the founder of Binance and Doge, which was mentioned again by Musk. At the same time, local resistance has formed in the market at $2.65-2.68 trillion, where the rebound has been losing momentum since the beginning of the month.
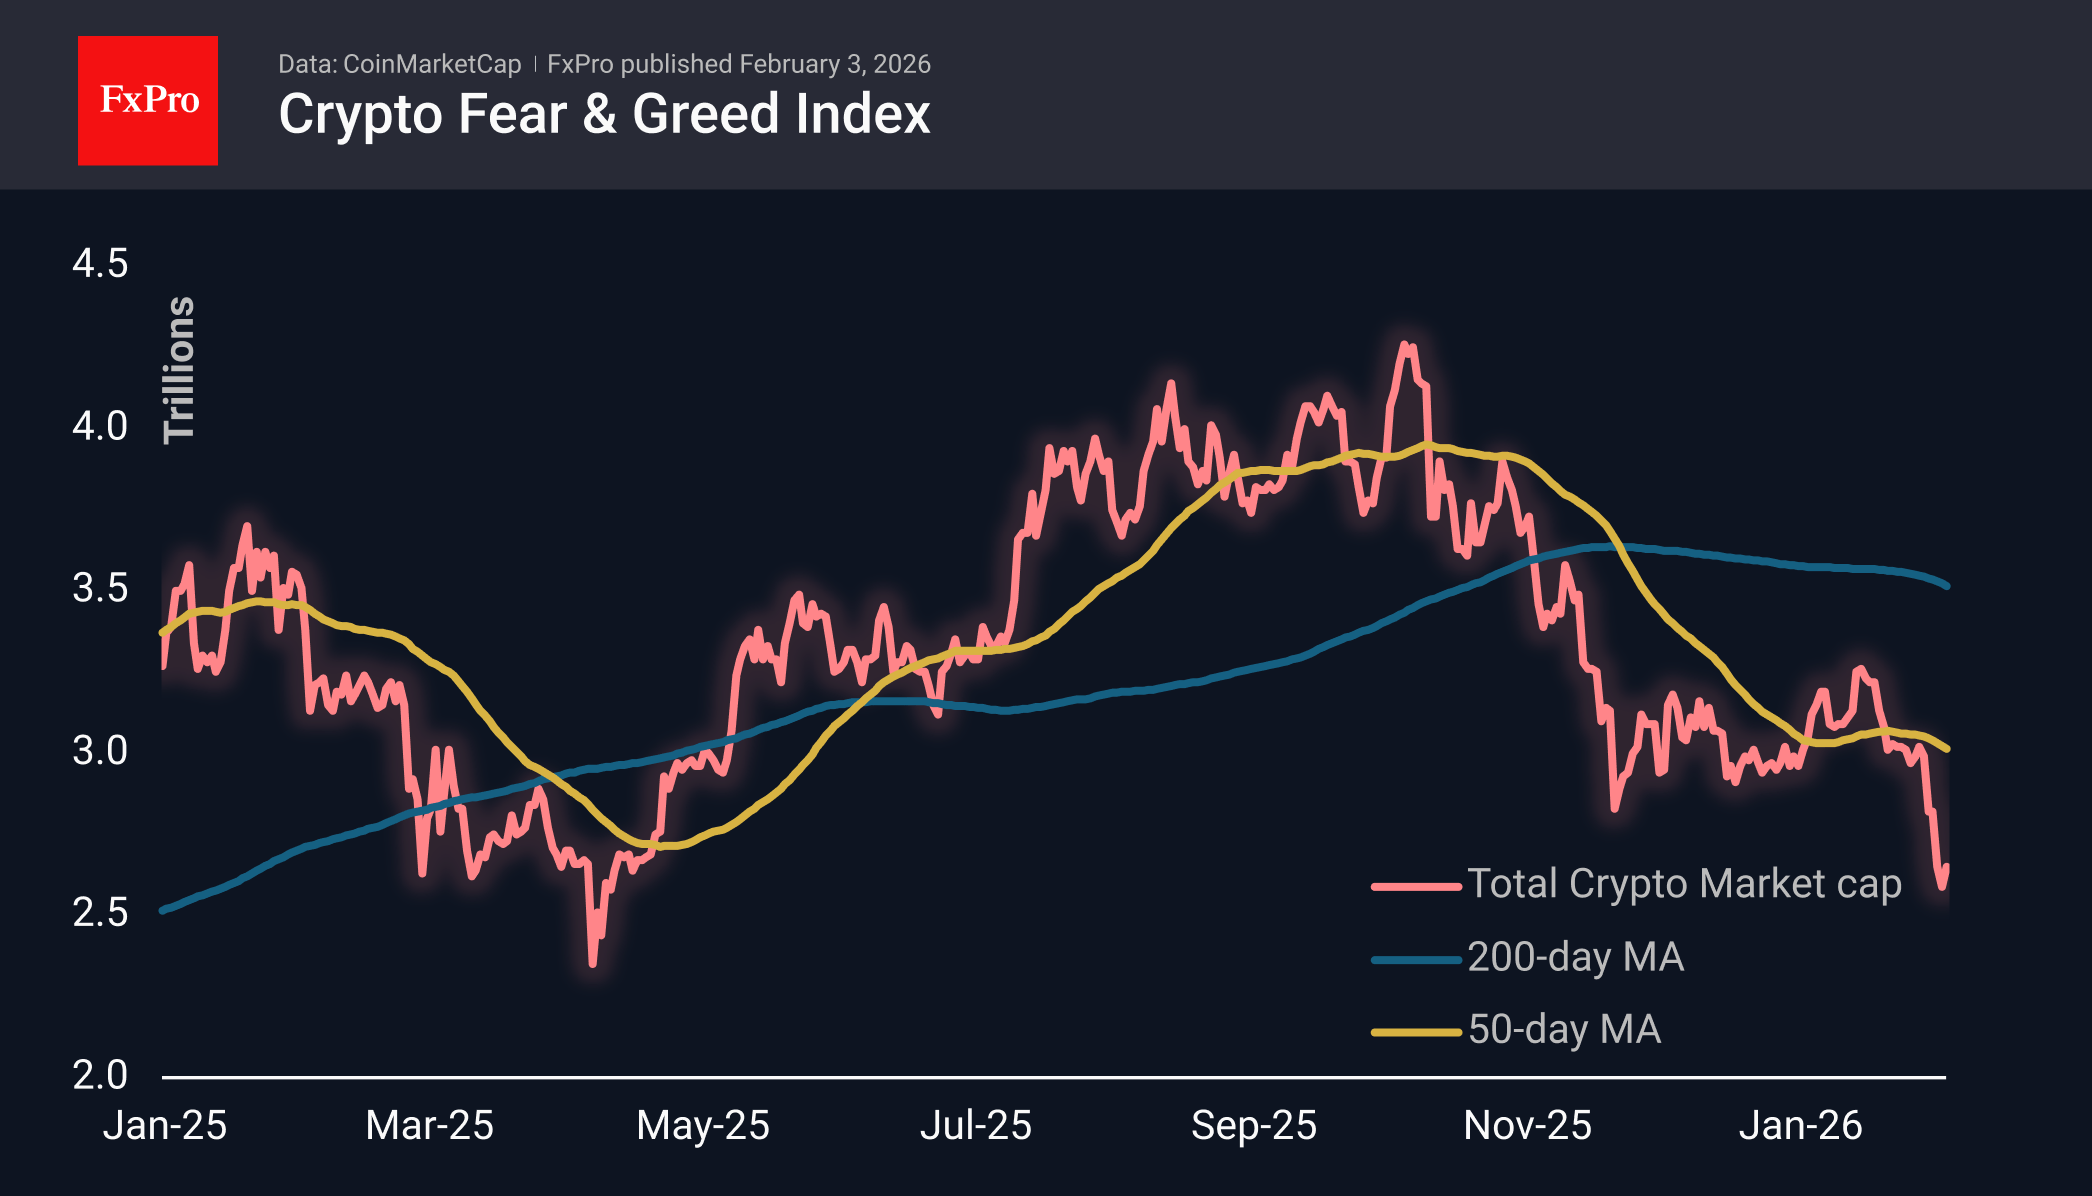
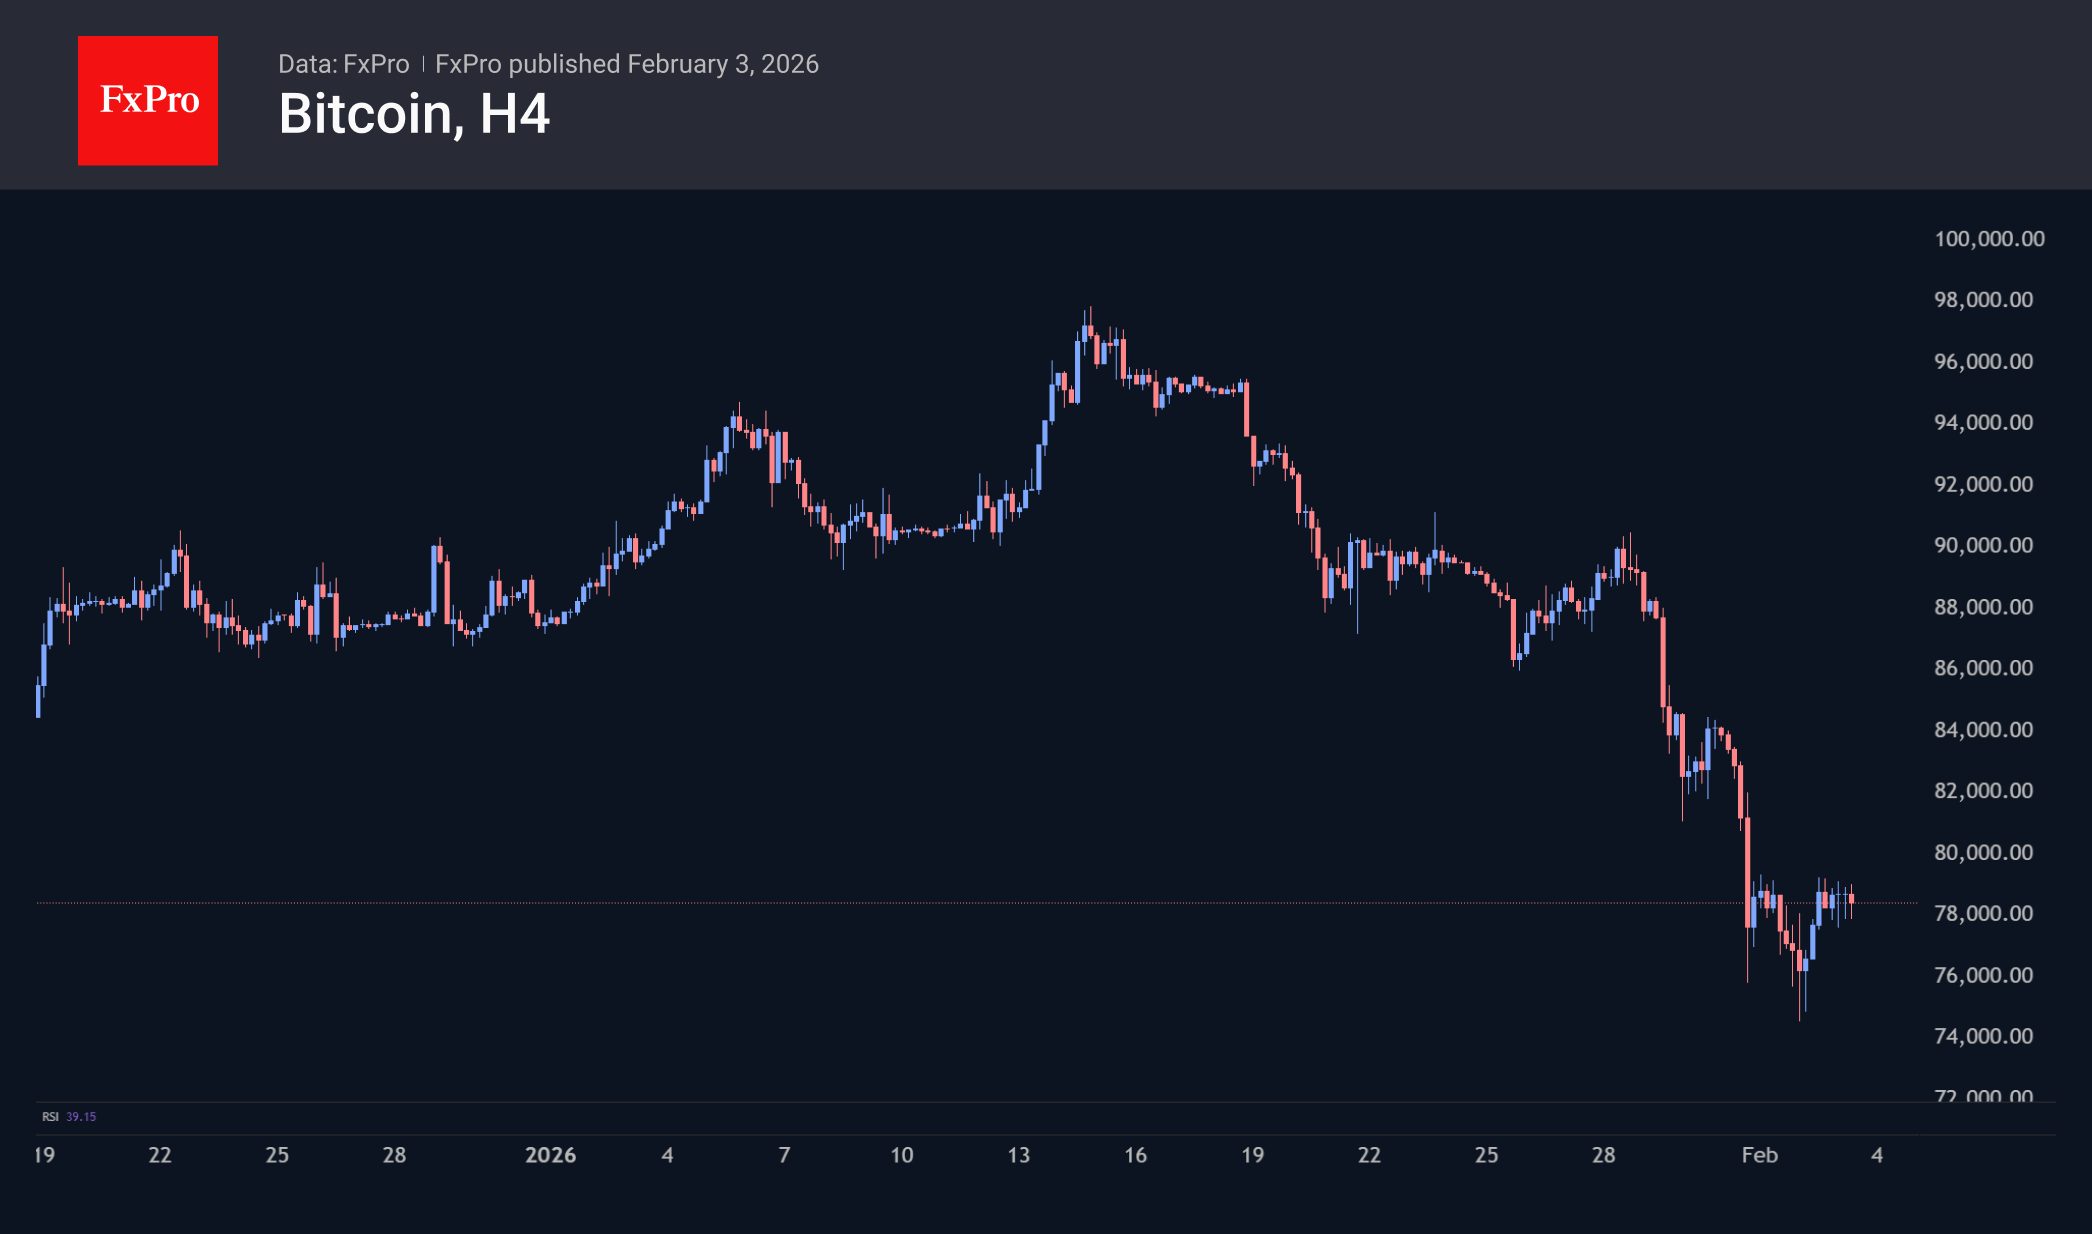
Bitcoin is trading above $78K, about 5% higher than Monday’s lows, but hitting resistance from 1 February. This limited rebound is causing bearish sentiment about the immediate prospects for Bitcoin and the whole crypto market.
News Background
According to CoinShares, global investment in crypto funds fell by $1.696 billion last week, following an outflow of $1.732 billion the week before. Investments in Bitcoin fell by $1.321 billion, in Ethereum by $308 million, in XRP by $44 million, in Solana by $32 million, and in multi-asset funds by $14 million.
The options market indicates that investors are beginning to form positions in anticipation of a local bottom. Long-term Bitcoin investors have moved into unrealised losses, which allows the market to transition into an ‘extremely bearish’ phase, according to CryptoQuant. The market has also been negatively affected by a persistent lack of liquidity for several months.
Bernstein expects the crypto market decline to end when Bitcoin reaches the highs of the previous cycle in the $60,000 range. The subsequent reversal will lay the foundation for the ‘most significant cycle’ for BTC.
Meanwhile, Bloomberg Intelligence strategist Mike McGlone reiterated his forecast for the current year, according to which Bitcoin could fall to $10,000. In his opinion, the current year may resemble the crisis years of 2008 and 2000-2001.
Corporate Ethereum holders suffered a major loss after the asset’s value fell. According to BitMineTracker, the ‘paper’ losses of BitMine, the largest holder of the second-largest cryptocurrency, amounted to $6.95 billion. Investor Ross Gerber called this ETH purchase potentially ‘the worst deal in history.’
Hong Kong-based Trend Research has already begun to reduce its positions, selling 33,589 ETH ($79 million) at a loss. Japanese financial holding company Nomura is also reducing its investments in cryptocurrencies. However, Strategy continues to buy, acquiring another 855 BTC ($75.3 million) over the past week at an average price of $87,974.
Gold Prices Recover After a Catastrophic Sell-Off
Yesterday, while analysing the silver price chart, we described a fundamental shift in supply and demand dynamics that likely became the key driver behind the sharp decline in prices.
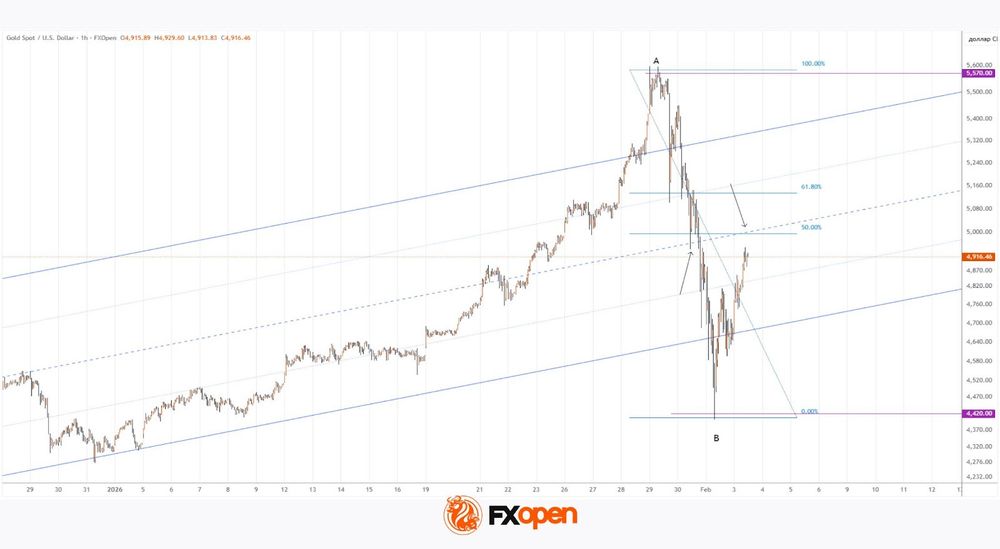
This same reasoning can likely be applied to the gold market, which experienced a synchronous and dramatic sell-off. From the A peak on 29 January near $5,570, the gold price (XAU/USD) collapsed to the B low on 2 February below $4,420 — a drop of around 20%:
→ “Smart money” locked in profits on long positions and switched to selling at market;
→ retail speculators were forced to close long positions at a loss, while the liquidation of previously leveraged trades accelerated the cascading decline.
On 26 January, when analysing gold price movements, we:
→ highlighted that the market was extremely overbought;
→ noted, however, that abandoning bullish expectations prematurely would be inappropriate without a major catalyst.
It now appears that the A→B collapse may have been precisely such an event.
Technical Analysis of the XAU/USD Chart
The previously identified channel was extended upwards by the abnormal surge in XAU/USD prices. Within this structure:
→ the A peak formed in overbought territory above the upper boundary of the channel;
→ the B low developed in oversold territory below its lower boundary;
→ during the sell-off on 30 January, the channel median briefly acted as support (as indicated by the arrow).
It is therefore reasonable to assume that the current rebound from extreme oversold conditions may encounter resistance formed by:
→ the median of the channel;
→ key Fibonacci retracement levels (50% and 61.8%).
Looking several weeks ahead, it is possible that XAU/USD may stabilise in the lower half of this channel. At the same time, the long-term outlook remains constructive: JPMorgan analysts have raised their year-end gold price forecast to $6,300 per ounce, while Deutsche Bank expects gold to reach $6,000 per ounce.
Start trading commodity CFDs with tight spreads (additional fees may apply). Open your trading account now or learn more about trading commodity CFDs with FXOpen.
This article represents the opinion of the Companies operating under the FXOpen brand only. It is not to be construed as an offer, solicitation, or recommendation with respect to products and services provided by the Companies operating under the FXOpen brand, nor is it to be considered financial advice.
Fall in EUR/USD Has Stopped: Markets Seek Stability Ahead of Employment Statistics
EUR/USD steadied at 1.1803 on Tuesday after a strong two-day fall. Support came from strong US macro data and the Fed's revised monetary policy expectations.
Statistics showed an unexpected expansion in US industrial activity, suggesting the economy and corporate profits remain resilient. Investor attention is shifting to Friday's report on the US labour market, but its publication may be delayed due to a partial government shutdown.
The dollar began rising on Friday after US President Donald Trump nominated Kevin Warsh to head the Fed, replacing Jerome Powell. The market perceives Warsh as a relatively more hawkish candidate. He allows for rate cuts, but at a less aggressive pace than other challengers.
Separately, Trump announced a trade deal with India that involves reciprocal tariff cuts in exchange for New Delhi halting Russian oil purchases.
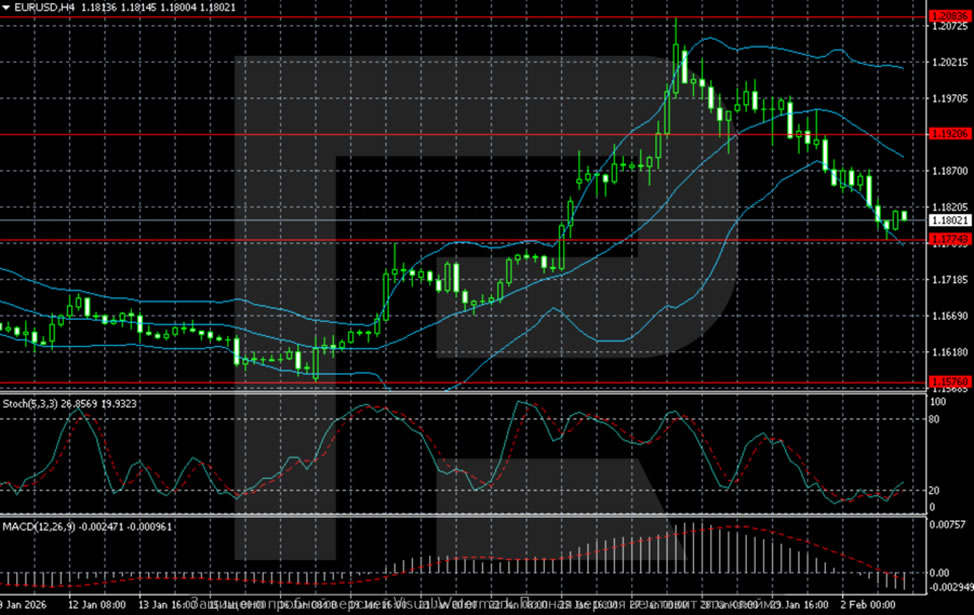
Technical Analysis
On the H4 chart, EUR/USD has entered a post-surge corrective phase after failing in the 1.2050-1.2100 area. The price rolled back to 1.1850-1.1870. It also holds above the previously broken 1.1830-1.1850 resistance, which remains a key support. Momentum weakens: Bollinger Bands stopped widening, MACD remains in positive territory, but the histogram shrinks. The correction is technical in nature; there are no signs of a trend reversal yet.
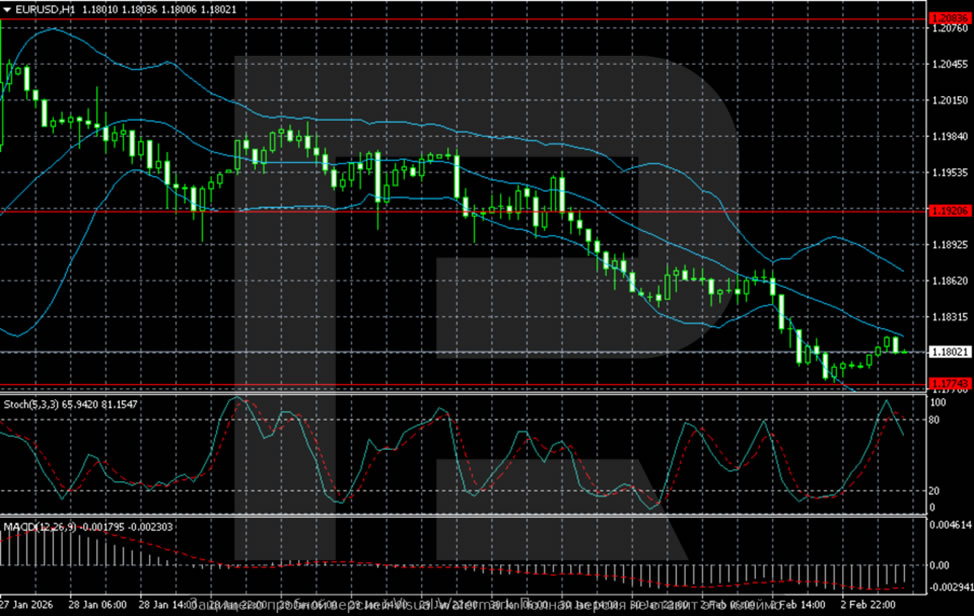
On H1, the correction forms a descending channel. The price stays below the Bollinger Bands' middle line, and the recovery remains sluggish. The Stochastic oscillator exited the oversold zone, allowing for a short-term rebound. However, as long as prices remain below the 1.1920-1.1950 zone, downward pressure persists. Holding the 1.1830 zone is critical to keeping the bullish scenario on higher timeframes.
Conclusion
In summary, the EUR/USD pair is undergoing a technical pause after a significant decline, finding temporary support near 1.1803. The stabilisation is largely driven by a recalibration of Fed expectations following a hawkish leadership nomination and robust US industrial data. While technical indicators suggest the current move is a correction within a larger uptrend, the immediate outlook remains cautious. The pair's near-term direction is highly contingent on holding the critical 1.1830 support. It will likely be dictated by the upcoming US labour market data, despite potential delays, which will serve as the next major catalyst for the dollar and the pair.
Disclaimer
Any forecasts contained herein are based on the author's particular opinion. This analysis may not be treated as trading advice. RoboForex bears no responsibility for trading results based on trading recommendations and reviews contained herein.
AUD/USD Rises Following RBA Decision
As the AUD/USD chart shows, the Australian dollar is holding above the psychological 0.700 level today after a bullish impulse triggered by the market’s reaction to the Reserve Bank of Australia’s (RBA) decision to raise the Cash Rate from 3.60% to 3.85%.
According to RBA Governor Michele Bullock, inflation (3.8%) remains too high, and the Bank “cannot allow it to get out of control again”. At the same time, the possibility of another rate hike in May has been left open.
The prospect of a tighter monetary policy stance should support the Australian dollar. However, the key question is whether AUD/USD can extend its advance and break above the important A peak from 29 January — the pair’s highest level since February 2023.
Technical Analysis of the AUD/USD Chart
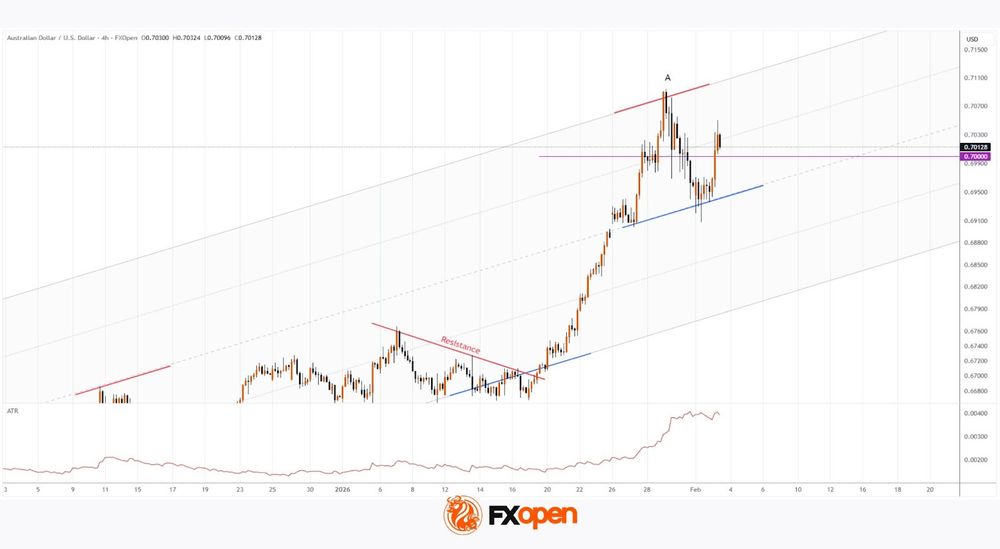
Volatile price action in January has formed a broad ascending channel originating in November 2025. Within this structure:
- → bullish momentum accelerated on 19 January following a break above local resistance (shown in red);
- → the A peak confirmed the upper boundary of the channel as resistance;
- → the median (shown in blue) continues to act as support for the rising market.
It is worth noting that the ATR indicator is at its highest level in around nine months. This may point to increased activity by “smart money”, while the aggressive bearish rejection from the upper boundary could hint at their intentions.
As a result, the current rise in AUD/USD appears to be an initial emotional response to the news. There is a risk that the momentum may fade as the price approaches the highs near the A peak, where “smart money” could resume selling.
Trade over 50 forex markets 24 hours a day with FXOpen. Take advantage of low commissions, deep liquidity, and spreads from 0.0 pips (additional fees may apply). Open your FXOpen account now or learn more about trading forex with FXOpen.
This article represents the opinion of the Companies operating under the FXOpen brand only. It is not to be construed as an offer, solicitation, or recommendation with respect to products and services provided by the Companies operating under the FXOpen brand, nor is it to be considered financial advice.