Sample Category Title
USD/JPY Mid-Day Outlook
Daily Pivots: (S1) 135.97; (P) 137.07; (R1) 138.90; More...
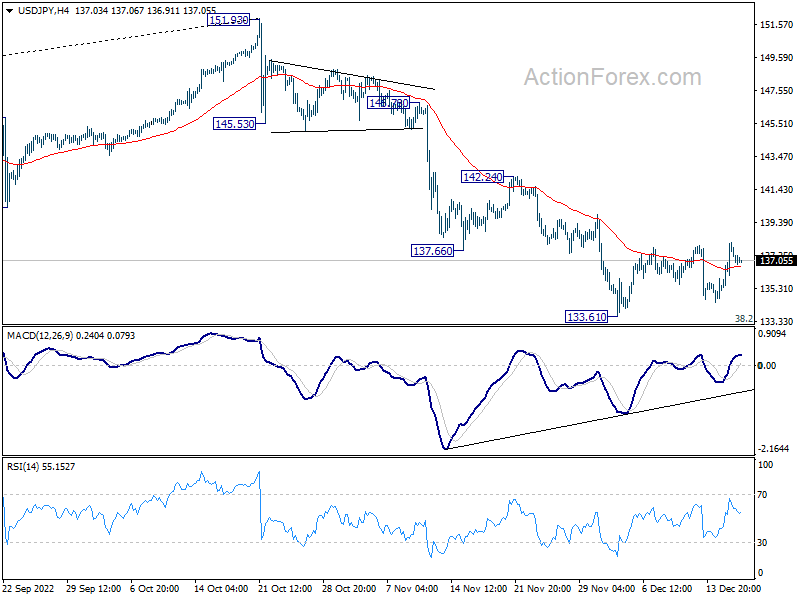
Intraday bias in USD/JPY remains mildly on the upside at this point. Rebound from 133.61 should extend higher to 142.24 resistance. On the downside, however, firm break of 133.61 support and 133.07 medium term fibonacci level will confirm resumption of whole fall from 151.93.
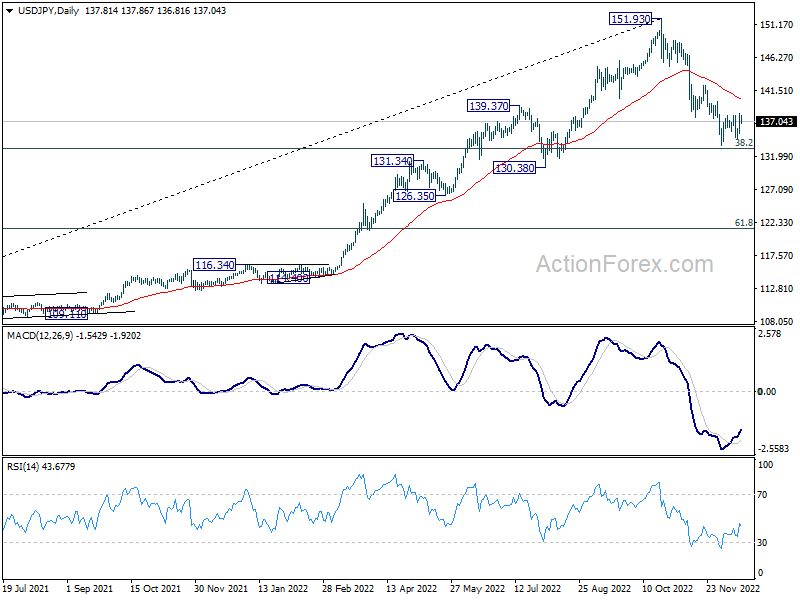
In the bigger picture, price actions from 151.93 medium term could be just a corrective pattern to up trend from 102.58 (2021 low). Strong support from 38.2% retracement of 102.58 to 151.93 at 133.07 and 55 week EMA (now at 131.71) will set the range for such corrective pattern. However, sustained break of 55 week EMA will pave the way to 61.8% retracement at 121.43.
GBP/USD Mid-Day Outlook
Daily Pivots: (S1) 1.2079; (P) 1.2256; (R1) 1.2355; More...
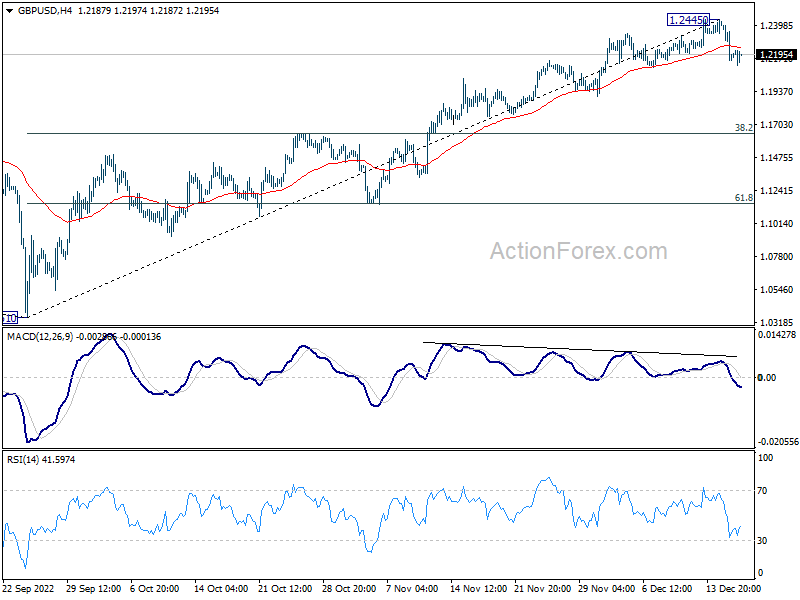
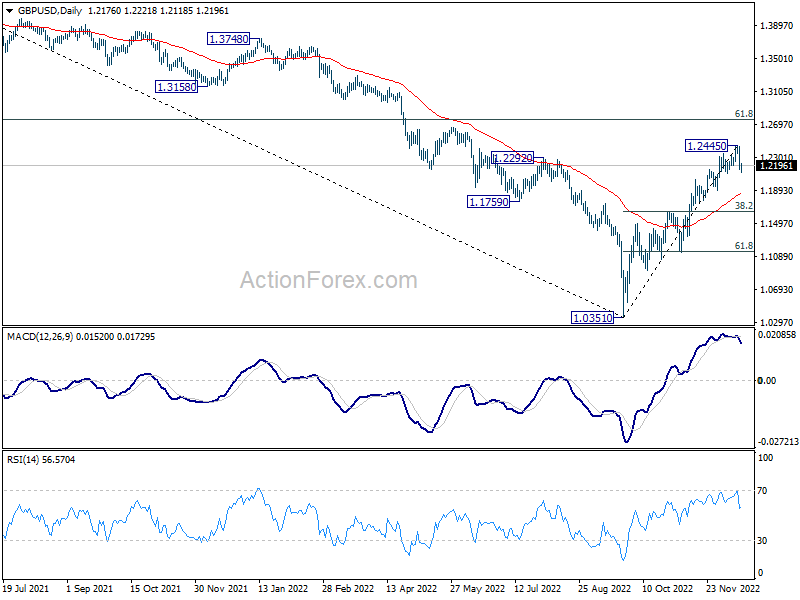
Intraday bias in GBP/USD remains on the downside for the moment. Fall from 1.2445 short term top should target 55 day EMA (now at 1.1865). Firm break there will target 38.2% retracement of 1.0351 to 1.2445 at 1.1645. For now, risk will stay on the downside as long as 1.2445 resistance holds, in case of recovery.
In the bigger picture, rise from 1.0351 medium term bottom is at least correcting whole down trend from 1.4248 (2021 high). Further rise is expected as long as 1.1644 resistance turned support holds. Next target is 61.8% retracement of 1.4248 to 1.0351 at 1.2759. Sustained break there will pave the way back to 1.4248. This will remain the favored case as long as 55 day EMA (now at 1.1860) holds.
Sterling Down after Weak Data, Euro and Swiss Franc Strong
Sterling is staying as one of the weakest for the week, after being sold off on weak economic data. The pressure is particularly apparent against Euro and Swiss Franc, which are the strongest ones for the week. While the financial markets are clearly in risk-off mode, Dollar is struggling to find renewed buying for now. Meanwhile, Aussie and Kiwi are still clearly pressured.
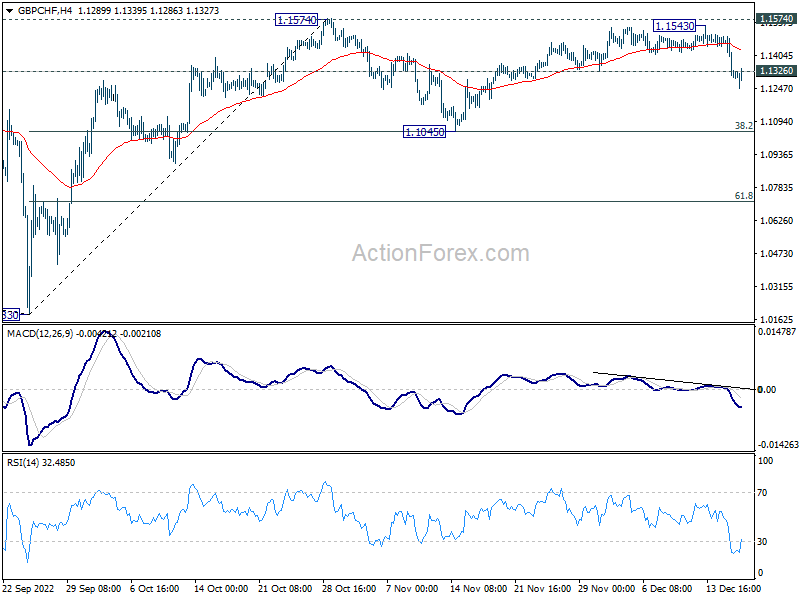
Technically, GBP/CHF's break of 1.1326 minor support indicates that corrective pattern from 1.1574 has started the third leg already. Deeper decline is now in favor for the near term. But downside should be contained by 1.1047 cluster support (38.2% retracement of 1.1083 to 1.1574 at 1.1043 to bring rebound. An upside breakout through 1.1574 is still expected at a later stage, together with EUR/CHF breaking through 0.9953.
In Europe, at the time of writing, FTSE is down -1.45%. DAX is down -0.71%. CAC is down -1.43%. Germany 10-year yield is up 0.0964 at 2.177. Earlier in Asia, Nikkei dropped -1.87%. Hong Kong HSI rose 0.42%. China Shanghai SSE dropped -0.02%. Singapore Strait Times dropped -1.01%. Japan 10-year JGB yield dropped -0.0020 to 0.256.
ECB Villeroy: The match is over in fighting inflation
ECB Governing Council member Francois Villeroy de Galhau told BFM Business radio that "the match is not over" in fighting inflation, adding that rate hikes remain the main tool.
Regarding the quantitative tightening on the APP by EUR 15B per month from March, he said, "we will re-examine it in June and we will probably increase the reduction starting in July,"
"The European economy is more resilient than we feared even a few weeks ago," he said. "There will be a strong slowdown in 2023. We will escape what certain people call a hard landing. We will have a rather significant rebound in 2024 and 2025."
ECB Rehn: More 50bps hike at least as far as I see in Feb and Mar
ECB Governing Council member Olli Rehn said, "we will stay the course as President (Christine) Lagarde yesterday indicated and this will likely mean 50 basis point rate hikes in the coming meetings, at least as far as I see in February, and March."
Another Governing Council member Robert Holzmann said the signal that more 50bps rate hikes are coming was "a toughly hawkish statement that for me is equivalent to the 75". He added that ECB could "go deep into restrictive territory if needed".
Bundesbank expects no severe economic slump in Germany
Bundesbank projects that the German economy will contract -0.5% in 2023, then grow by 1.7% in 2024 and 1.4% in 2025. President Joachim Nagel said, "Economic output is likely to shrink initially, but we expect a gradual recovery from the second half of 2023... Compared to the June projection, the rate of change of GDP for 2023 has been revised significantly downwards."
HICP inflation is projected to decline to 7.2% in 2023, then to 4.1% in 2024, and 2.8% in 2025. HICP excluding energy and food is expected to increase slightly to 4.3% in 2023, then gradually decline to 2.9% in 2024 and 2.6% in 2025.
Eurozone PMI composite rose to 48.8, consistent with -0.2% GDP contraction in Q4
Eurozone PMI Manufacturing rose from 47.1 to 47.8 in December. PMI Services rose from 48.5 to 49.1. PMI Composite rose from 47.8 to 48.8. Still, the downside extended into its sixth successive month, even though rate of decline moderated.
Chris Williamson, Chief Business Economist at S&P Global Market Intelligence said: "While the further fall in business activity in December signals a strong possibility of recession, the survey also hints that any downturn will be milder than thought likely a few months ago. The data for the fourth quarter are consistent with GDP contracting at a quarterly rate of just less than 0.2%, and forward-looking indicators are currently boding well for the rate of decline to ease further in the first quarter."
Eurozone CPI finalized at 10.1% yoy in Nov, core CPI at 5.0% yoy
Eurozone CPI was finalized at 10.1% yoy in November, down from October's 10.6% yoy. CPI core was finalized at 5.0%, unchanged from prior month's reading. The highest contribution came from energy (+3.82%), followed by food, alcohol & tobacco (+2.84%), services (+1.76%) and non-energy industrial goods (+1.63%).
EU CPI was finalized at 11.1% mom, down from October's 11.5% yoy. The lowest annual rates were registered in Spain (6.7%), France (7.1%) and Malta (7.2%). The highest annual rates were recorded in Hungary (23.1%), Latvia (21.7%), Estonia and Lithuania (both 21.4%). Compared with October, annual inflation fell in sixteen Member States, remained stable in three and rose in eight.
UK PMI manufacturing fell to 44.7, services recovery to 50.0
UK PMI Manufacturing dropped from 46.5 to 44.7 in December, a 31-month low. PMI Services rose from 48.8 to 50.0. PMI Composite rose from 48.2 to 49.0.
Chris Williamson, Chief Business Economist at S&P Global Market Intelligence said: "The December data add to the likelihood that the UK is in recession, with the PMI indicating a 0.3% GDP contraction in the fourth quarter after the 0.2% decline seen in the three months to September.
"For now, the downturn looks to be relatively mild, and the easing in the rate of decline in December is encouraging news, as is the further marked cooling of inflationary pressures. However, the fact that the downturn has moderated compared to the turmoil created in the immediate aftermath of the botched "mini budget", most notably in financial services, is no real cause for cheer. It is especially worrying to see business confidence and order book indicators remain so low by historical standards, with both of these key gauges signalling heightened degrees of economic stress.
"Hence it's no surprise to see that businesses are battening down the hatches, most notably by reducing headcounts, in a sign that the downturn not only has further to run but could yet accelerate again, especially given December's further hike to interest rates."
UK retail sales volumes down -0.4% mom in Nov, values up 0.5% mom
In November, UK retail sales volumes declined -0.4% mom, much worse than expectation of 0.3% mom rise. Ex-fuel sales dropped -0.3% mom, worse than expectation of 0.3% mom. Fuel sales volumes declined -1.7% mom.
In value term, retail sales rose 0.5% mom while ex-fuel sales rose 0.1% mom.
Japan PMI manufacturing fell to 48.8, but services improved to 51.7
Japan PMI Manufacturing fell slightly from 49.0 to 48.8 in December, above expectation of 48.0. That's the worst contractionary reading since October 2020. PMI Services, however, improved from 50.3 to 51.7. PMI Composite also rose back from 48.9 to 50.0.
Laura Denman, Economist at S&P Global Market Intelligence, said:
"The Japanese private sector economy saw a stabilisation in business activity in the final month of the year, with flash data indicating that the divergence between the manufacturing and services sectors has grown further. As has been the case since the launching of the National Travel Discount Programme in October, service providers have reportedly continued to profit from a boost in tourism volumes. Notably, firms have seemingly gained some pricing power as a result of improving demand within the sector and raised their selling prices at the sharpest rate since October 2019.
"Conversely, manufacturing firms continued to struggle in the face of subdued demand conditions and severe inflationary pressures with the latest flash PMI reading the lowest since October 2020. December data saw production and order books at Japanese manufacturers contract further, but at paces that were slower than in November. At the same time, though historically sharp, inflationary pressures cooled with the rate of input price inflation at the lowest level since September 2021."
NZ BusinessNZ manufacturing dropped to 47.4, negative dynamic at play
New Zealand BusinessNZ Performance of Manufacturing Index dropped from 49.3 to 47.4 in November. That is the first time the PMI has shown consecutive months of contraction since the first nationwide lockdown in 2020.
Looking at some details, production fell slightly from 49.9 to 49.6. Employment fell from 48.7 to 46.7. New orders dropped further from 44.4 to 41.8. Finished stocks rose from 55.0 to 56.1. Deliveries dropped from 55.4 to 50.7.
BNZ Senior Economist, Craig Ebert stated "it's been quite the sag in the PMI, compared to just three months ago when everything appeared positive. Of course, the PMI can dive down to the 40-zone when things get recessionary. And November's result wasn't that awful. That said, it also had componentry showing a negative dynamic at play".
Australia PMI composite dropped to 47.3, first signs of desired soft landing
Australia PMI Manufacturing dropped from 51.3 to 50.4 in December, a 31-month low. PMI Services dropped from 47.6 to 46.9, an 11-month low. PMI Composite dropped from 48.0 to 47.3, also an 11-month low.
Warren Hogan, Chief Economic Advisor at Judo Bank said:
"The December results are one of the most up to date readings on the Australian economy and show that higher interest rates are starting to have the desired impact on activity. The Flash PMI readings for December are still well above levels that would normally be associated with recession. What we are seeing could be the first signs of a desired soft landing for the Australian economy in 2023...
"The slowing in this leading indicator of Australian economic activity will be welcomed by the RBA. Tighter monetary policy is having the desired effect, that is, a gradual slowing in domestic demand that should eventually filter through to lower inflation...
"This important leading indicator of Australian economic activity raises the prospect of an extended pause in the rate hiking cycle. As the rate hikes of 2022 continue to work through the economy over the first half of 2023, the RBA appears to have some scope to sit back and watch for a while."
GBP/USD Mid-Day Outlook
Daily Pivots: (S1) 1.2079; (P) 1.2256; (R1) 1.2355; More...
Intraday bias in GBP/USD remains on the downside for the moment. Fall from 1.2445 short term top should target 55 day EMA (now at 1.1865). Firm break there will target 38.2% retracement of 1.0351 to 1.2445 at 1.1645. For now, risk will stay on the downside as long as 1.2445 resistance holds, in case of recovery.
In the bigger picture, rise from 1.0351 medium term bottom is at least correcting whole down trend from 1.4248 (2021 high). Further rise is expected as long as 1.1644 resistance turned support holds. Next target is 61.8% retracement of 1.4248 to 1.0351 at 1.2759. Sustained break there will pave the way back to 1.4248. This will remain the favored case as long as 55 day EMA (now at 1.1860) holds.
Economic Indicators Update
| GMT | Ccy | Events | Actual | Forecast | Previous | Revised |
|---|---|---|---|---|---|---|
| 21:30 | NZD | Business NZ PMI Nov | 47.4 | 49.3 | ||
| 22:00 | AUD | Manufacturing PMI Dec P | 50.4 | 51.3 | ||
| 22:00 | AUD | Services PMI Dec P | 46.9 | 47.6 | ||
| 00:01 | GBP | GfK Consumer Confidence Dec | -42 | -43 | -44 | |
| 00:30 | JPY | Manufacturing PMI Dec P | 48.8 | 48 | 49 | |
| 07:00 | GBP | Retail Sales M/M Nov | -0.40% | 0.30% | 0.60% | 0.90% |
| 07:00 | GBP | Retail Sales Y/Y Nov | -5.90% | -5.60% | -6.10% | -5.90% |
| 07:00 | GBP | Retail Sales ex-Fuel M/M Nov | -0.30% | 0.30% | 0.30% | 0.70% |
| 07:00 | GBP | Retail Sales ex-Fuel Y/Y Nov | -5.90% | -5.80% | -6.70% | -6.40% |
| 08:15 | EUR | France Manufacturing PMI Dec P | 48.9 | 48.1 | 48.3 | |
| 08:15 | EUR | France Services PMI Dec P | 48.1 | 49.1 | 49.3 | |
| 08:30 | EUR | Germany Manufacturing PMI Dec P | 47.4 | 46.7 | 46.2 | |
| 08:30 | EUR | Germany Services PMI Dec P | 49 | 46.4 | 46.1 | |
| 09:00 | EUR | Eurozone Manufacturing PMI Dec P | 47.8 | 46.8 | 47.1 | |
| 09:00 | EUR | Eurozone Services PMI Dec P | 49.1 | 48.5 | 48.5 | |
| 09:30 | GBP | Manufacturing PMI Dec P | 44.7 | 46.5 | 46.5 | |
| 09:30 | GBP | Services PMI Dec P | 50 | 48.5 | 48.8 | |
| 10:00 | EUR | Eurozone Trade Balance (EUR) Oct | -28.3B | -32.5B | -37.7B | -36.4B |
| 10:00 | EUR | CPI Y/Y Nov F | 10.10% | 10.00% | 10.00% | |
| 10:00 | EUR | CPI Core Y/Y Nov F | 5.00% | 5.00% | 5.00% | |
| 13:30 | CAD | Wholesale Sales M/M Oct | 2.10% | 1.40% | 0.10% | |
| 14:45 | USD | Manufacturing PMI Dec P | 47.7 | 47.7 | ||
| 14:45 | USD | Services PMI Dec P | 46.5 | 46.2 |
USDCHF Leading the Path in USDX
An interesting pair to look at to identify the path of the USDX after 9.28.22 peak is the USDCHF. We all know and seen the USDX rallying within wave ((3)) during the last 1 and a half years. The cycle now is getting mature and expected pullback was inevitable.
At Elliott Wave Forecast, as an analyst and a professional trader you need to look at different clues in the market that may help you determine a cycle or a sequence. This will allow you to figure out a possible path so you can be able to execute reasonably your trading plan ahead. The market always reacts within the transactions being made between buyers and sellers. For a market to exist you need to have both sides.
If you ever seen an exchange you know that you can see how much money is available at a specific price. Either for buying or selling an asset. This however is not available within the retail trading industry within the Forex markets. Our system is able to combine Elliott Wave theory with the addition of market correlation and distribution. And looking at the sequences among other things to determine the most probable and accurate path. Let’s have a look at the USDX 11.26.22 4 hour weekend update.
USDX 11.26.22 4 Hour weekend update
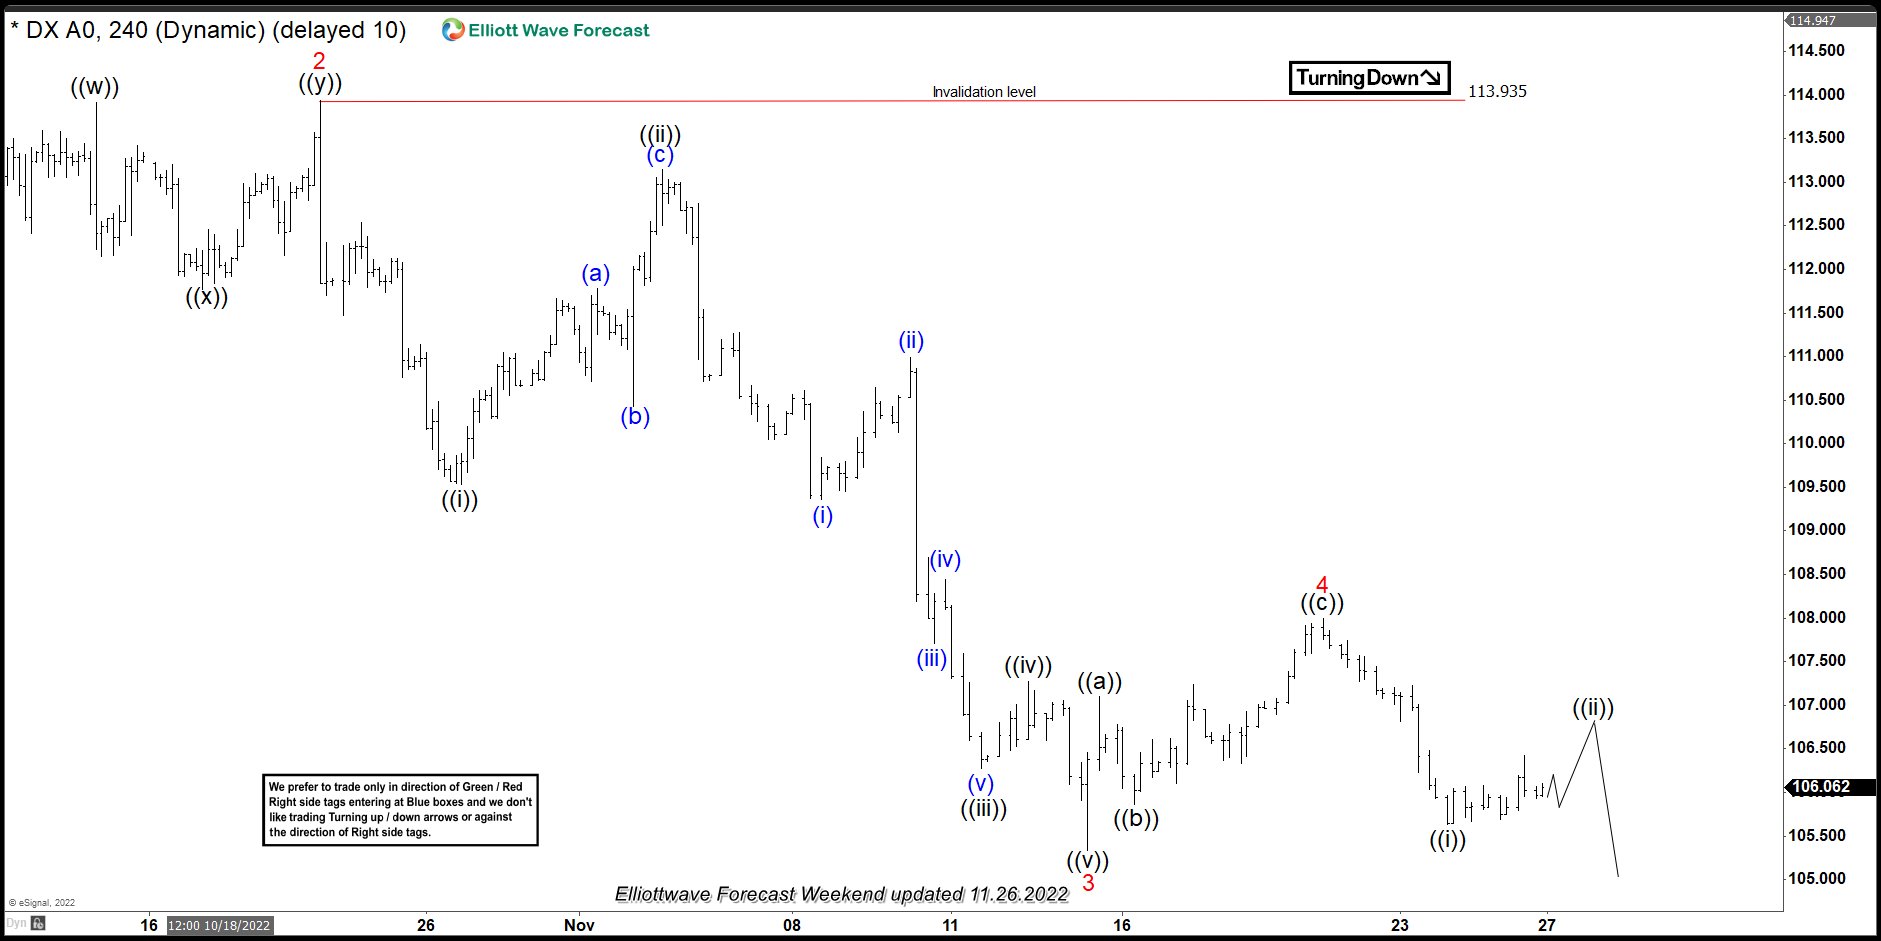
We can see that wave 2 red in the USDX was at 10.21.22 and from there made 5 waves lower into wave 3 before bouncing in wave 4 and then lower in wave 5 takes place. Now let’s have a look at what the USDCHF has done.
USDCHF 11.27.22 4 Hour weekend update
The USDCHF as we can see ended its cycle at 10.21.22 the same date that the USDX ended wave 2 red. From that point on the 2 instruments are correlated within the same cycle and path. Before ending the cycle and soon to start the bounce. Now let’s have a look at the latest charts from both instruments.
USDX 12.14.22 1 hour Asian update
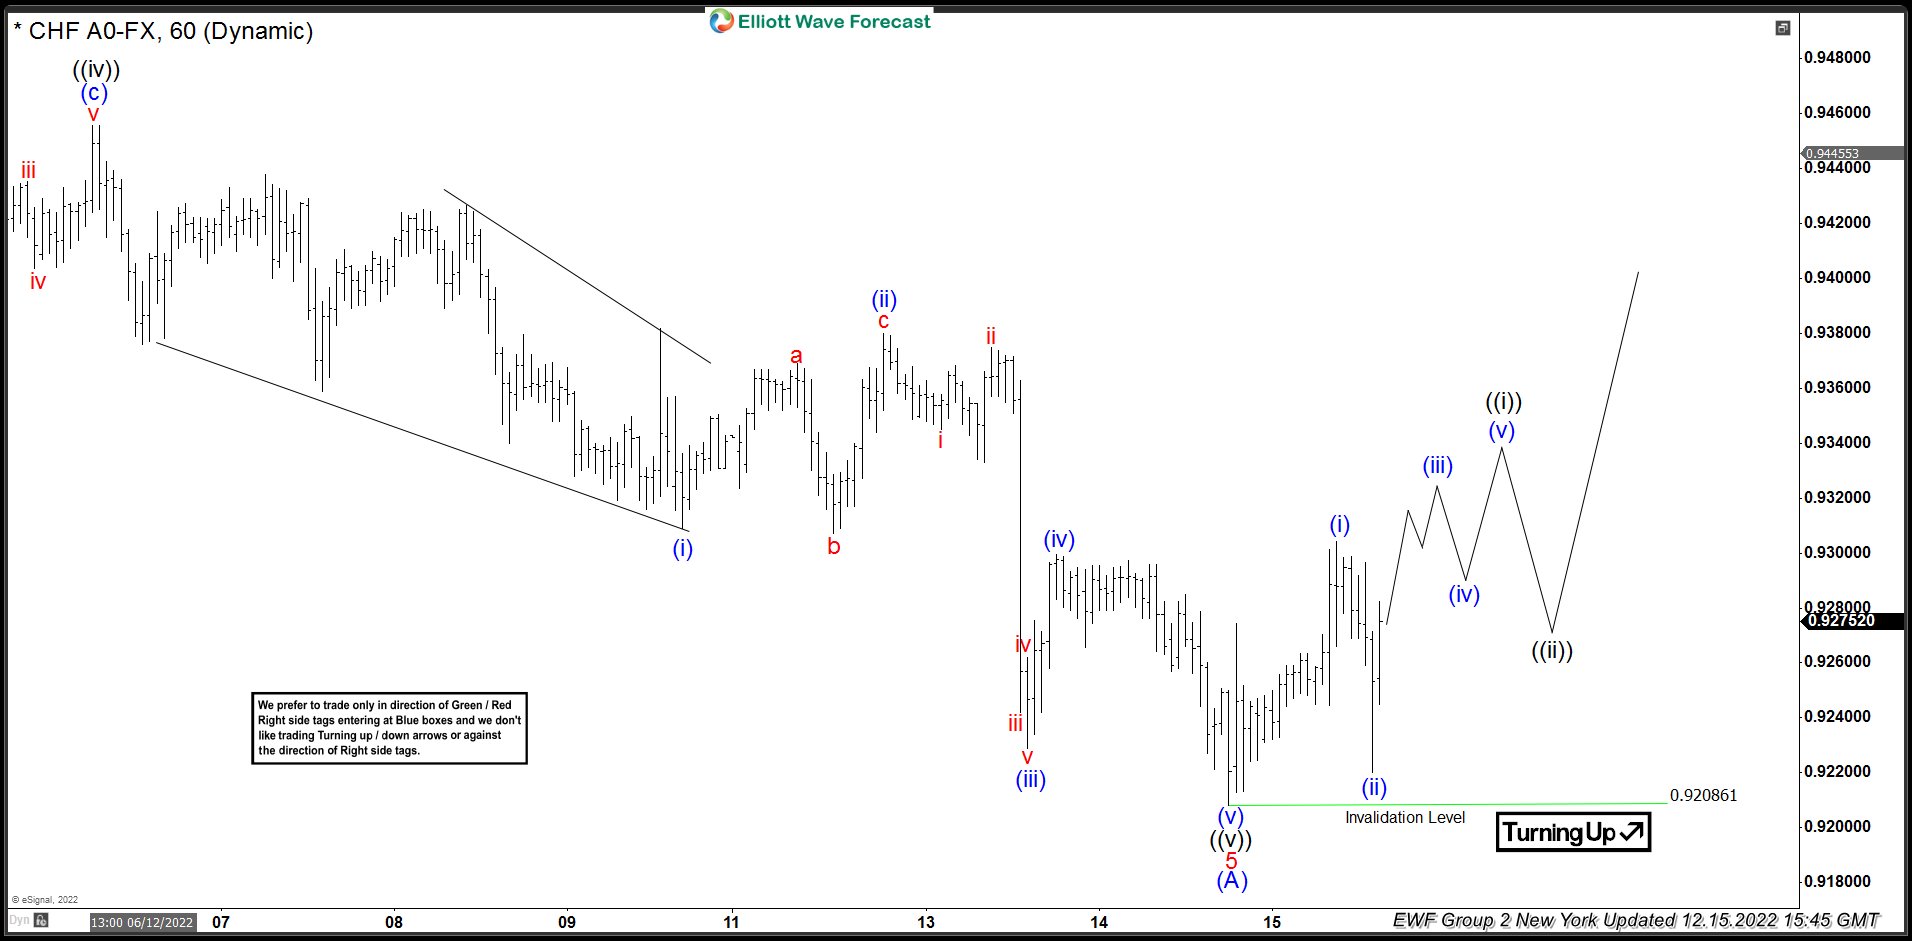
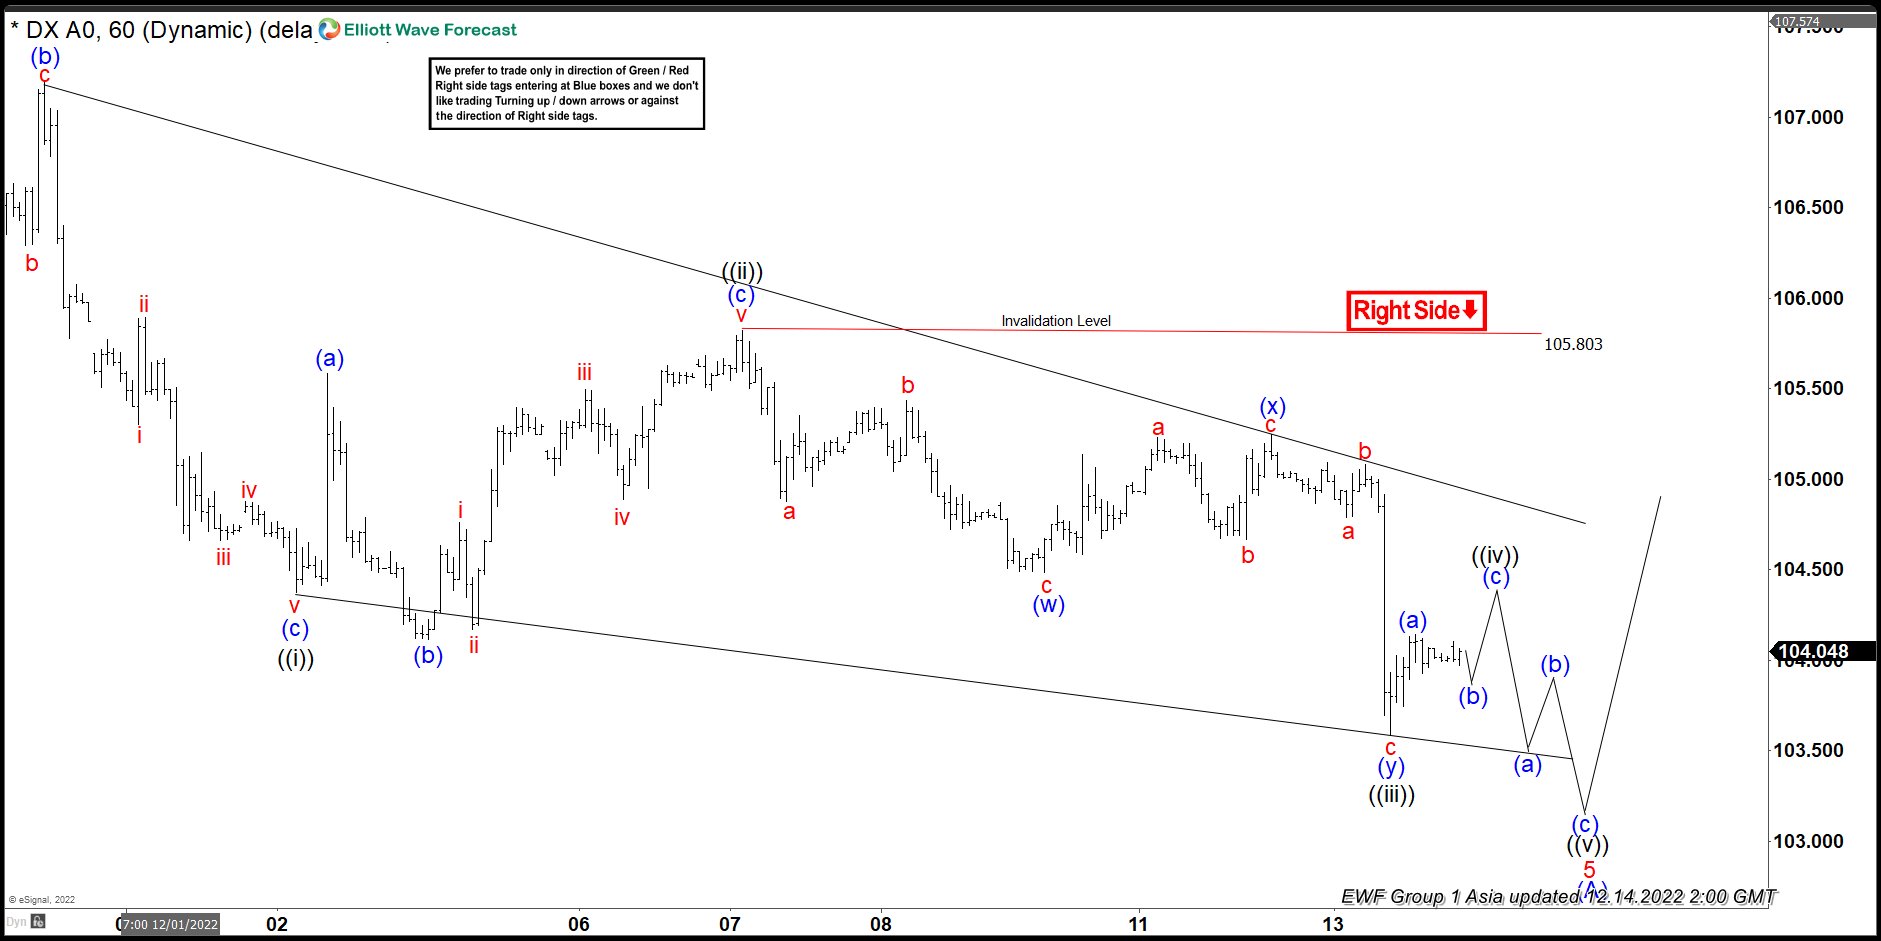
As we can see both instruments shared a similar path. This is because within a cycle we usually have some instruments that we can relate to. It gives us clues as to how and when a cycle might be ending. Most times we find instruments that we can relate that have identical swing counts and structure. We use multiple indicators to be able to accurately forecast the market. Alongside our distribution system, sequence and correlations amongst others.
Eurozone CPI finalized at 10.1% yoy in Nov, core CPI at 5.0% yoy
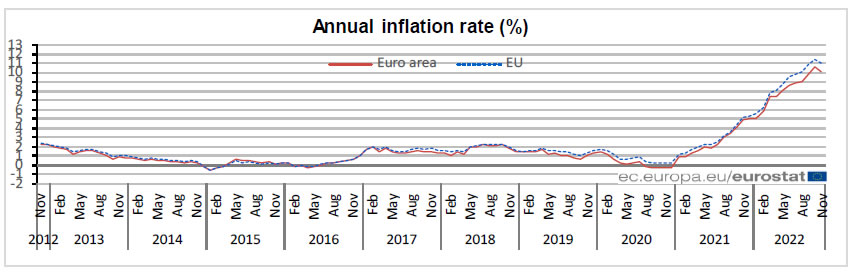
Eurozone CPI was finalized at 10.1% yoy in November, down from October's 10.6% yoy. CPI core was finalized at 5.0%, unchanged from prior month's reading. The highest contribution came from energy (+3.82%), followed by food, alcohol & tobacco (+2.84%), services (+1.76%) and non-energy industrial goods (+1.63%).
EU CPI was finalized at 11.1% mom, down from October's 11.5% yoy. The lowest annual rates were registered in Spain (6.7%), France (7.1%) and Malta (7.2%). The highest annual rates were recorded in Hungary (23.1%), Latvia (21.7%), Estonia and Lithuania (both 21.4%). Compared with October, annual inflation fell in sixteen Member States, remained stable in three and rose in eight.
ECB Rehn: More 50bps hike at least as far as I see in Feb and Mar
ECB Governing Council member Olli Rehn said, "we will stay the course as President (Christine) Lagarde yesterday indicated and this will likely mean 50 basis point rate hikes in the coming meetings, at least as far as I see in February, and March."
Another Governing Council member Robert Holzmann said the signal that more 50bps rate hikes are coming was "a toughly hawkish statement that for me is equivalent to the 75". He added that ECB could "go deep into restrictive territory if needed".
ECB Villeroy: The match is over in fighting inflation
ECB Governing Council member Francois Villeroy de Galhau told BFM Business radio that "the match is not over" in fighting inflation, adding that rate hikes remain the main tool.
Regarding the quantitative tightening on the APP by EUR 15B per month from March, he said, "we will re-examine it in June and we will probably increase the reduction starting in July,"
"The European economy is more resilient than we feared even a few weeks ago," he said. "There will be a strong slowdown in 2023. We will escape what certain people call a hard landing. We will have a rather significant rebound in 2024 and 2025."
USDCAD Stuck in Range, Supported by 50-day SMA
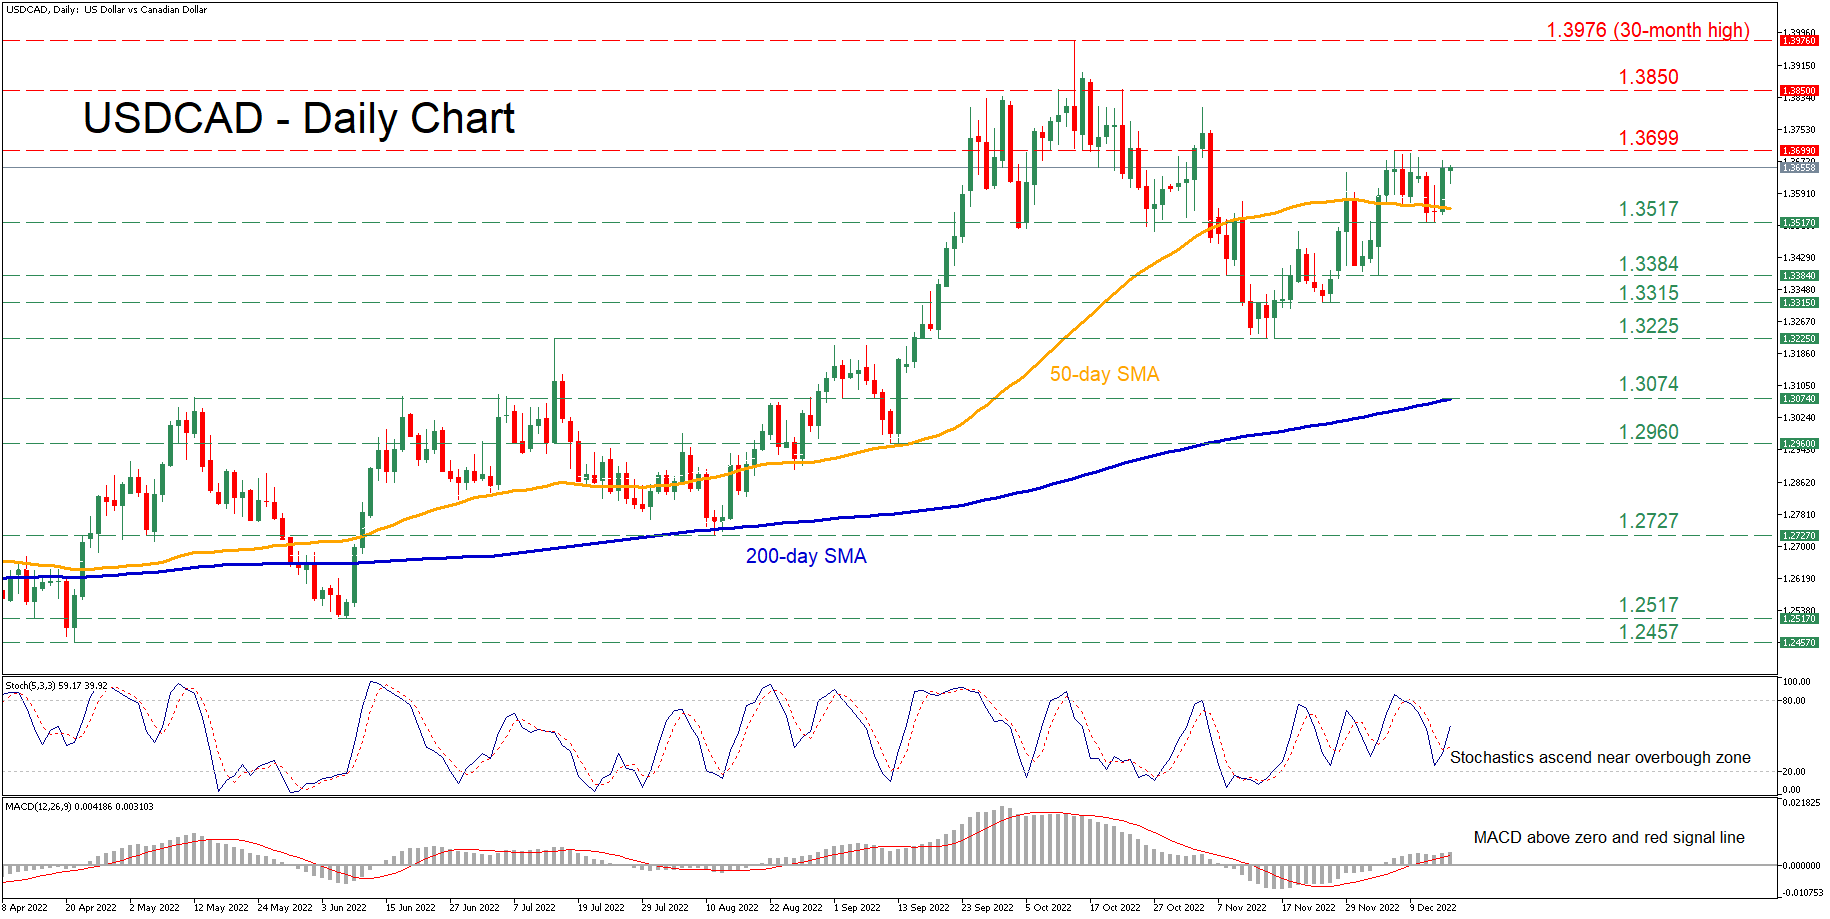
USDCAD has been in an uptrend since March, storming to a fresh 30-month high of 1.3976 before experiencing a downside correction. Even though the pair erased part of its recent pullback, it has been rangebound in the last few daily sessions, with the 50-day simple moving average (SMA) capping its downside.
The momentum indicators currently suggest that bullish forces are intensifying. Specifically, the stochastic oscillator is ascending after posting a bullish cross, while the MACD histogram is strengthening above both zero and its red signal line.
Should bullish forces persist, the price could edge higher to test the recent resistance region of 1.3699. Piercing through this zone, the spotlight could then turn to the 1.3850 barrier registered in October. An upside violation might then set the stage for the 30-month high of 1.3976.
Alternatively, if bearish forces regain control and push the price below the 50-day SMA, immediate support could be met at the recent low of 1.3517. Sliding beneath that floor, the bears could aim for 1.3384 before the 1.3315 hurdle appears on the radar. Failing to halt there, further declines may cease at the November low of 1.3225.
Overall, USDCAD is lacking a clear direction in the short-term picture after its rebound failed to strengthen. Therefore, a break above or below its recent range could be followed by a significant move towards the same direction.
GBP/USD: The Cable Dips Further on Renewed Risk Aversion
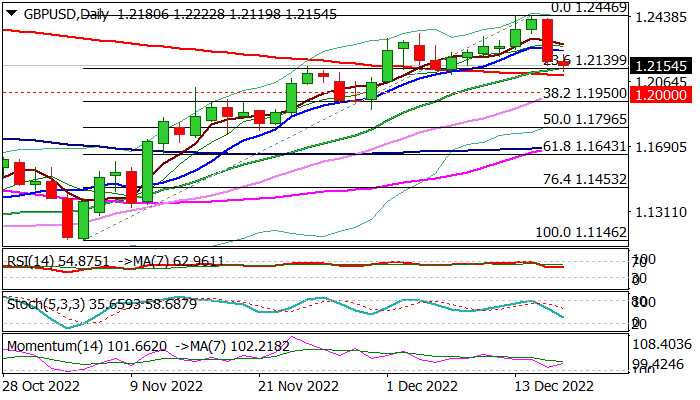
Cable remains in red on Friday and extends lower after nearly 2% drop on Thursday, pressured by renewed risk aversion after major central banks showed unexpectedly hawkish stance and prompted investors into safety of dollar.
Weaker than expected UK retail sales in November added to weakened sentiment, which offset potential positive impact upbeat UK services PMI.
Technical studies on daily chart weakened, although indicators are still positively aligned, but formation of reversal pattern and overbought studies on weekly chart warn of deeper pullback.
Fresh bears cracked initial Fibo support at 1.2219 (23.6% of 1.1146/1.2446 upleg) and pressure pivotal 200 DMA (1.2098), where headwinds could be expected.
Break here would risk extension towards key supports at 1.2000/1.1950 (psychological / Fibo 38.2%) break of which would sideline larger bulls and open way for deeper correction of an uptrend from Sep 26 multi-decade low (1.0342).
Broken daily Tenkan-sen (1.2276) reverted to solid resistance which should cap and keep fresh bears in play.
Res: 1.2239; 1.2276; 1.2446; 1.2520.
Sup: 1.2098; 1.2000; 1.1950; 1.1900.
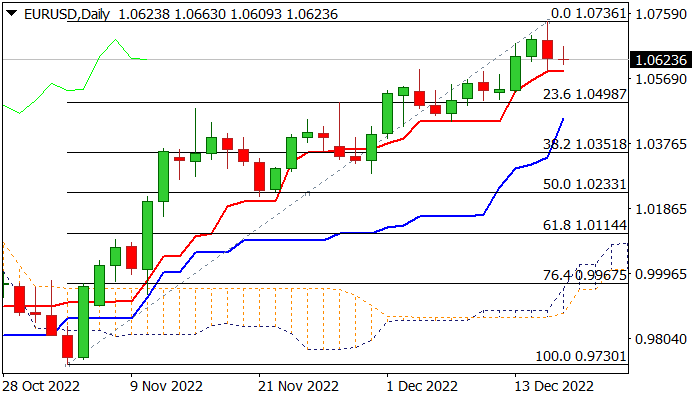
EUR/USD: Larger Bulls to Stay Intact above Daily Tenkan-Sen
The Euro remains at the back foot in European trading on Friday, after Thursday’s drop and formation of bearish engulfing which weighs on near-term action.
Larger bulls lost traction on approach to pivotal Fibo barrier at 1.0746 (61.8% of 1.1494/0.9535), but the pullback was so far shallow and contained by daily Tenkan-sen (1.0589).
Immediate bias is expected to remain with bulls while Tenkan line protects the downside and signal narrow consolidation before larger bulls resume.
The pair is on track for bullish weekly close that supports the notion, however caution is required as weekly indicators are overstretched and falling weekly cloud continues to pressure (cloud base lays at 1.0782).
Watch daily Tenkan-sen as break here would risk deeper pullback and put bulls on hold for potential test of pivotal 1.0350 support zone (Fibo 38.2% of 0.9730/1.0736 upleg, reinforced by 200DMA).
Res: 1.0663; 1.0746; 1.0782; 1.0936.
Sup: 1.0589; 1.0564; 1.0498; 1.0443.