

Sample Category Title
USD/CHF Daily Outlook
Daily Pivots: (S1) 0.9369; (P) 0.9403; (R1) 0.9443; More...
Range trading continues in USD/CHF and intraday bias stays neutral. Considering bullish convergence condition in 4 hour MACD, break of 0.9545 will indicate short term bottoming at 0.9325. Intraday bias will be back on the upside for 55 day EMA (now at 0.9642). On the downside, below 0.9325 will resume the near term decline and target 0.9287 fibonacci level.
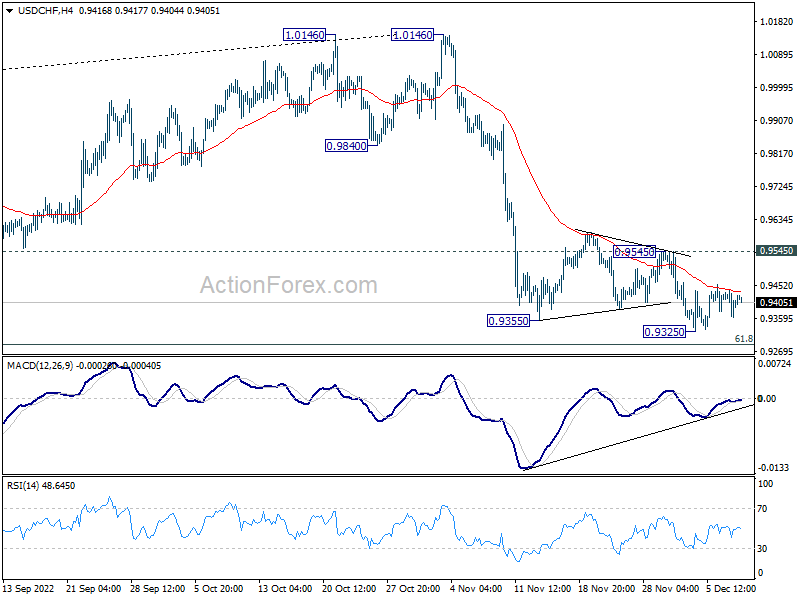
In the bigger picture, rise from 0.8756 (2021 low) has completed at 1.0146, well ahead of 1.0342 long term resistance (2016 high). Based on current downside momentum, fall from 1.0146 might be a medium term down trend itself. Break of 61.8% retracement of 0.8756 to 1.0146 at 0.9287 will pave the way to 0.8756. In any case, risk will stay on the downside as long as 55 day EMA (now at 0.9690) holds.
EUR/USD Daily Outlook
Daily Pivots: (S1) 1.0449; (P) 1.0500; (R1) 1.0556; More...
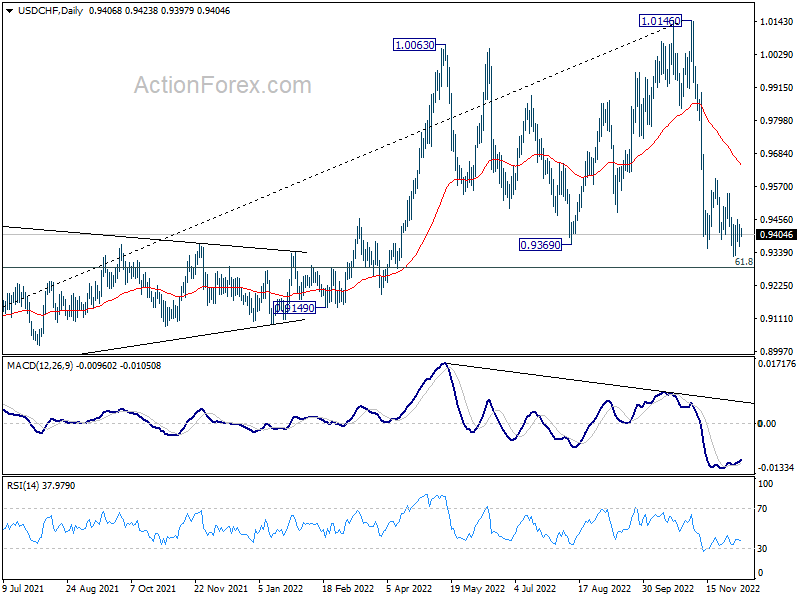
Range trading continues in EUR/USD and intraday bias remains neutral. Considering bearish divergence condition in 4 hour MACD, break of 1.0427 minor support will indicate short term topping at 1.0594, after rejection by 1.0609 fibonacci level. Intraday bias will be turned back to the downside for 1.0222 support and possibly below. Nevertheless, firm break of 1.0594 will resume larger rally from 0.9534.
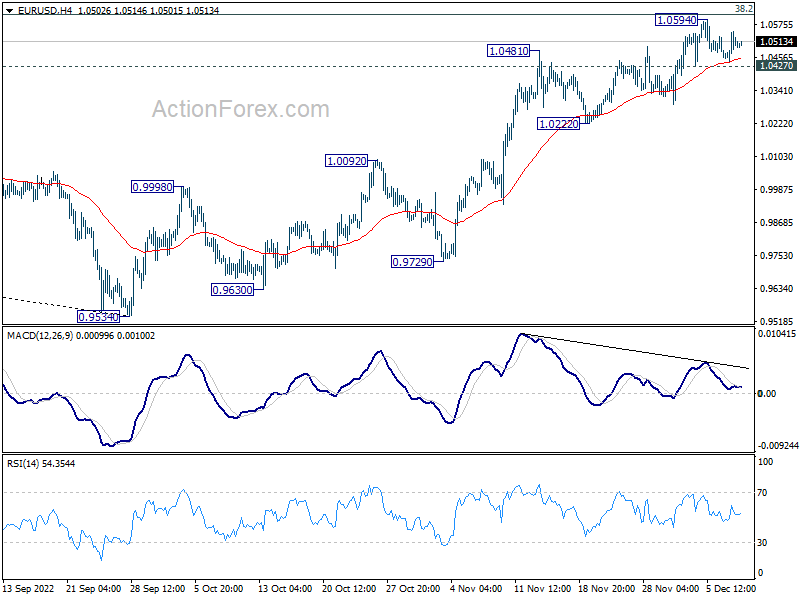
In the bigger picture, a medium term bottom was in place at 0.9534, on bullish convergence condition in daily MACD. Even as a corrective rise, rally from 0.9534 should target 38.2% retracement of 1.2348 (2021 high) to 0.9534 at 1.0609. Sustained trading above 55 week EMA (now at 1.0557) will raise the chance of trend reversal and target 61.8% retracement at 1.1273. However, rejection by 1.0609 will retain medium term bearishness for down trend resumption at a later stage.
GBP/USD Daily Outlook
Daily Pivots: (S1) 1.2133; (P) 1.2184; (R1) 1.2261; More...
GBP/USD is staying in consolidation from 1.2343 and intraday bias remains neutral for the moment. Further rise remains mildly in favor as long as 1.1898 support holds. On the upside, break of 1.2343 will resume the rally from 1.0351 and target 1.2759 medium term fibonacci level next. However, firm break of 1.1898 support will confirm short term topping and turn bias back to the downside.
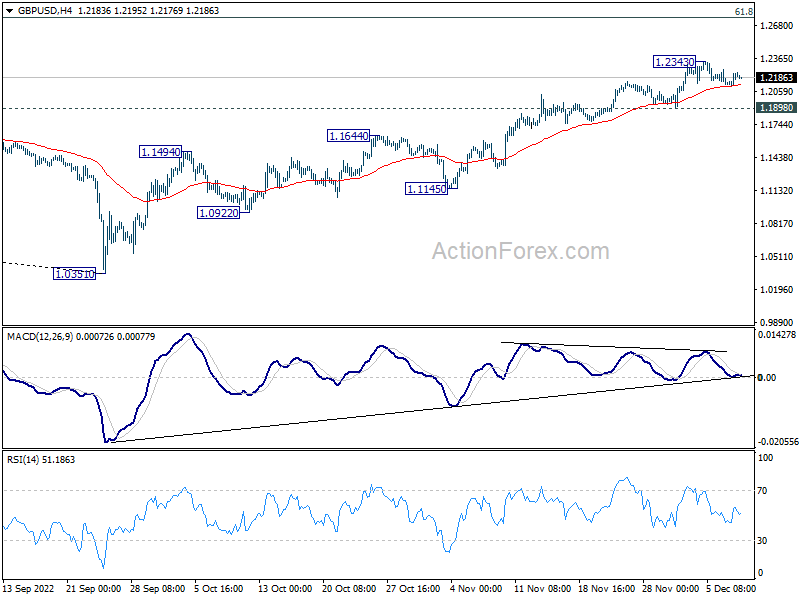
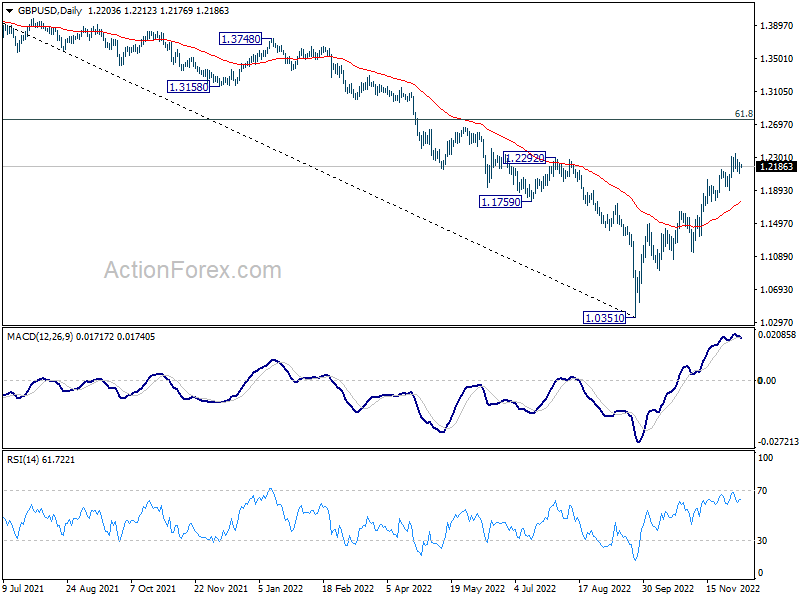
In the bigger picture, rise from 1.0351 medium term bottom is at least correcting whole down trend from 1.4248 (2021 high). Further rise is expected as long as 1.1644 resistance turned support holds. Next target is 61.8% retracement of 1.4248 to 1.0351 at 1.2759. Sustained break there will pave the way back to 1.4248.
Dollar Trading Sideway in Dull Markets
Trading in the currency markets continues to be rather subdued. Canadian Dollar remains the weakest together Yen. The dovish rate hike by BoC overnight didn't trigger more selloff, though. Yen is having little reaction to falling US and European benchmark yields. Dollar and Euro are the firmer ones but stay inside familiar range. Aussie and Kiwi are soft but, again, there is no follow through selling.
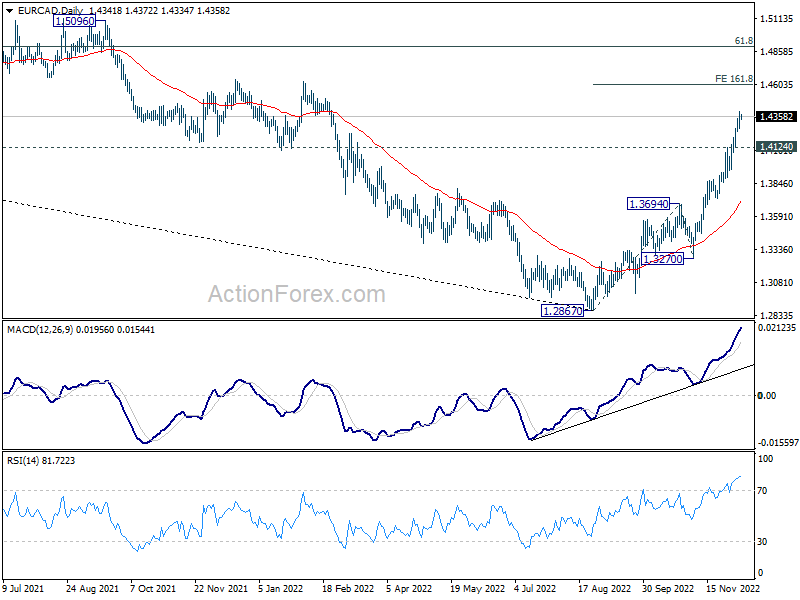
Technically, EUR/CAD's rally from 1.2867 is making progress, a rare exception in the dull market. As long as 1.4124 support holds, further rise should be seen to 161.8% projection of 1.2867 to 1.3694 from 1.3270 at 1.4608. However, break of 1.4124 support should indicate short term topping and bring consolidations first.
In Asia, at the time of writing, Nikkei is down -0.53%. Hong Kong HSI is up 2.68%. China Shanghai SSE is down -0.10%. Singapore Strait Times is up 0.39%. Japan 10-year JGB yield is down -0.0026 at 0.252. Overnight, DOW closed flat, S&P 500 dropped -0.19%. NASDAQ dropped -0.51%. 10-year yield dropped -0.105 to 3.408.
Australia trade surplus little change at AUD 12.22B in Oct
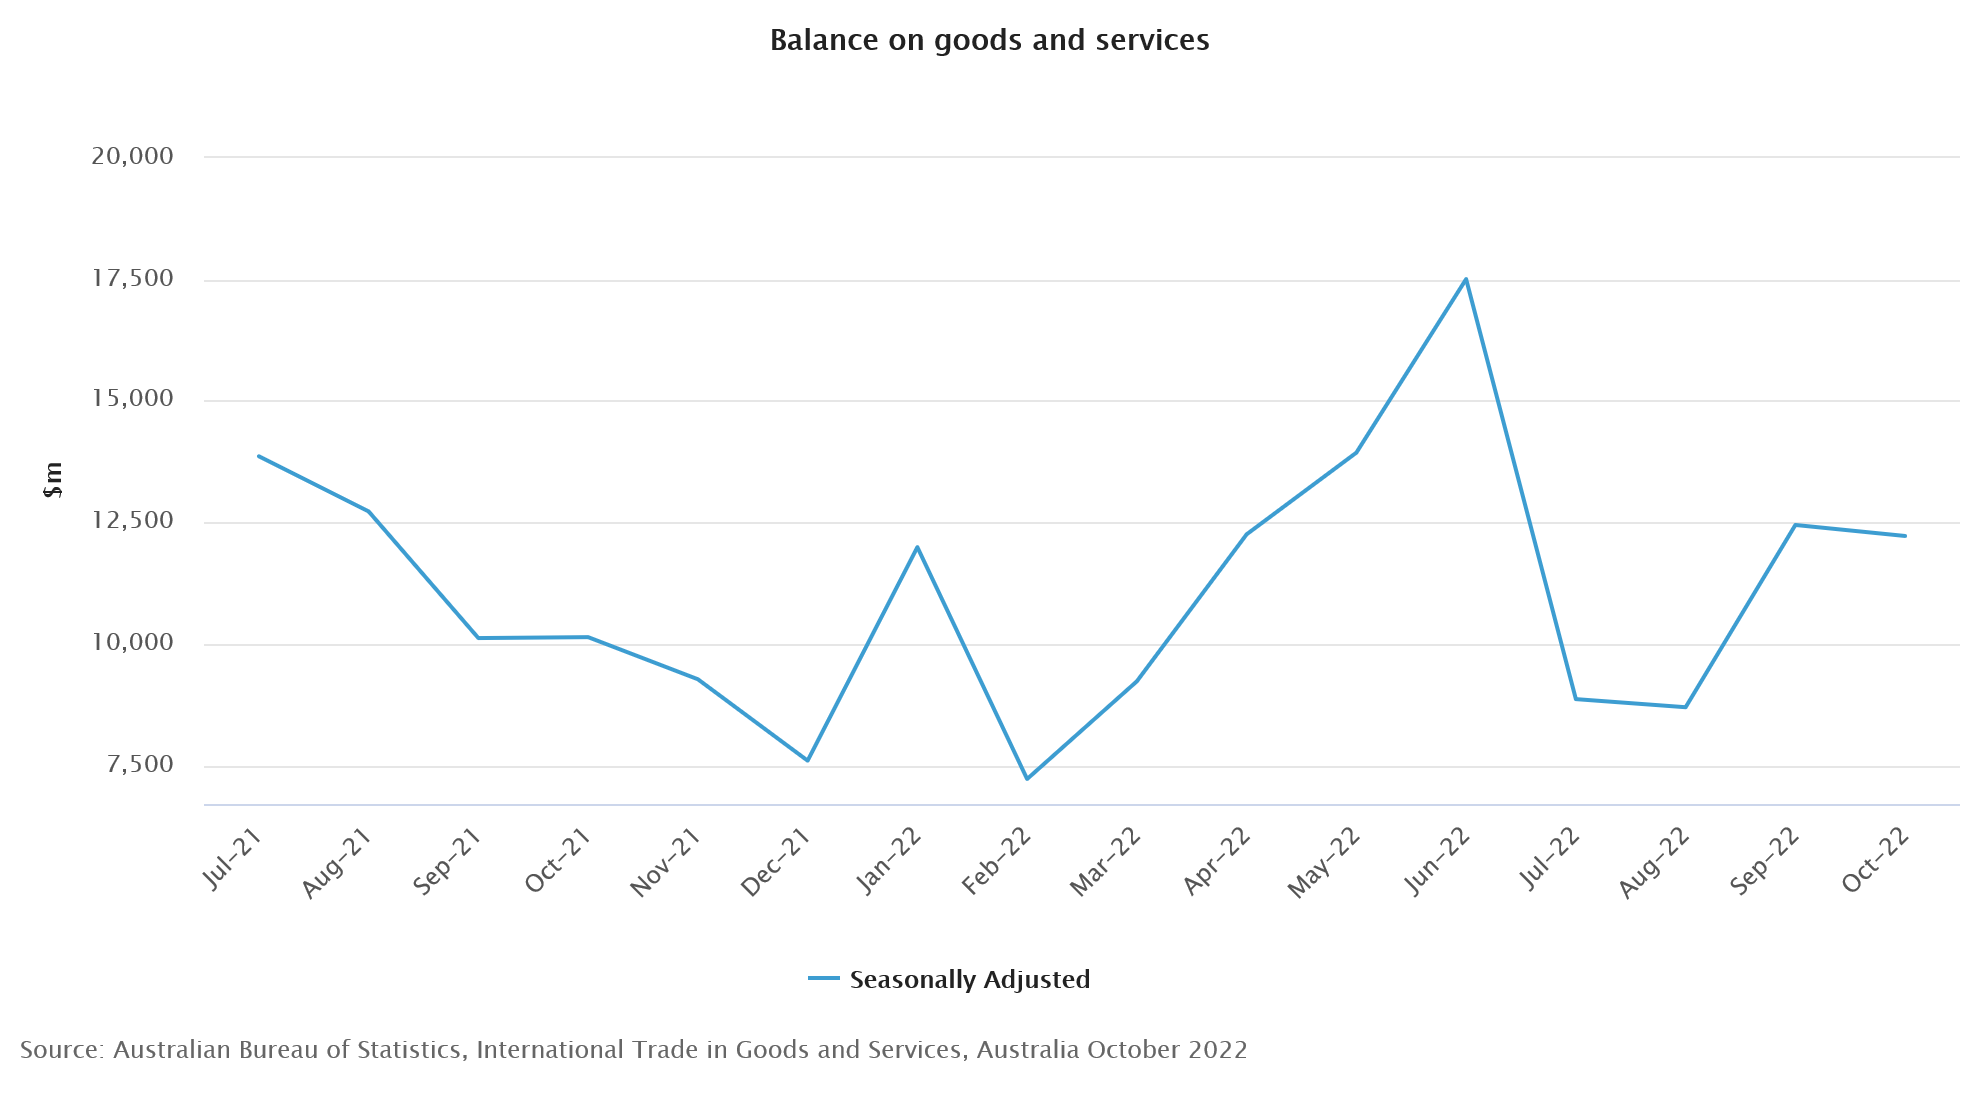
Australia exports of goods and services dropped -0.9% mom to AUD 60.01B in October. Imports dropped -0.7% mom to AUD 47.85B. Trade surplus narrowed slightly from AUD 12.44B to AUD 12.22B, slightly above expectation of AUD 12.10B.
Looking at some details, the decline in exports was driven mainly by AUD -0.6B fall in gold while imports decline was driven by AUD -0.5B fall in energy. Fuel exports, dominated by LNG, rose AUD 0.3B to AUD 11.2B, and hit a new record high. Rural goods exports rose AUD 0.1B to AUD 7.2B, also a record high.
Gold fails 1800 handle for now
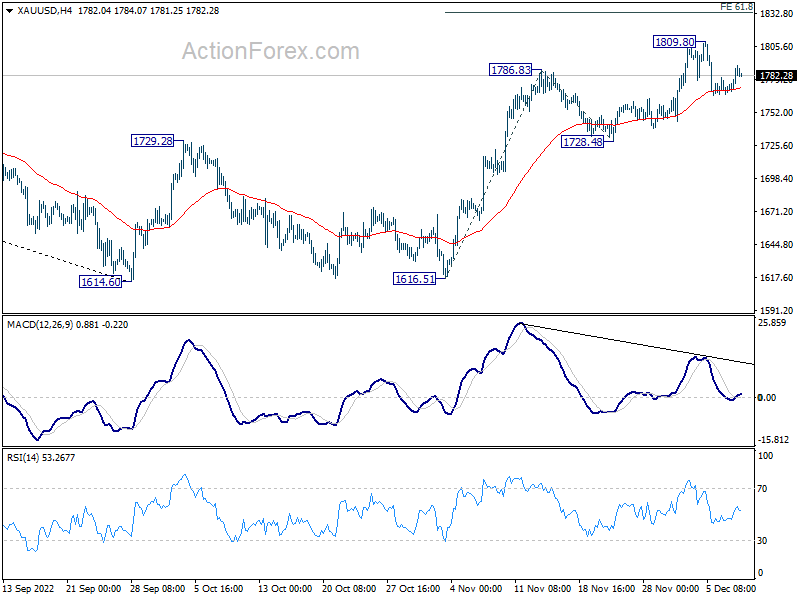
Gold's rally halted after hitting 1809.80 earlier in the week, but failed to sustain above 1800 handle and turned into consolidations. Dollar's recovery is capping Gold's strength. Traders in the currency markets are generally cautious ahead of next week's FOMC rate decision, and more importantly, the new dot plot.
Technically, Gold is feeling some support from 4 hour 55 EMA, which is a positive sign. Break of 1809.80 will resume the rise from 1616.51 to 61.8% projection of 1616.51 to 1786.83 from 1728.48 at 1833.73. However, sustained trading below 4 hour 55 EMA (now at 1772.44) will at least bring deeper fall back to 1728.48 support for a test.
Looking ahead
The economic calendar is rather light today with US jobless claims as the main feature.
GBP/USD Daily Outlook
Daily Pivots: (S1) 1.2133; (P) 1.2184; (R1) 1.2261; More...
GBP/USD is staying in consolidation from 1.2343 and intraday bias remains neutral for the moment. Further rise remains mildly in favor as long as 1.1898 support holds. On the upside, break of 1.2343 will resume the rally from 1.0351 and target 1.2759 medium term fibonacci level next. However, firm break of 1.1898 support will confirm short term topping and turn bias back to the downside.
In the bigger picture, rise from 1.0351 medium term bottom is at least correcting whole down trend from 1.4248 (2021 high). Further rise is expected as long as 1.1644 resistance turned support holds. Next target is 61.8% retracement of 1.4248 to 1.0351 at 1.2759. Sustained break there will pave the way back to 1.4248.
Economic Indicators Update
| GMT | Ccy | Events | Actual | Forecast | Previous | Revised |
|---|---|---|---|---|---|---|
| 23:50 | JPY | GDP Q/Q Q3 | -0.20% | -0.30% | -0.30% | |
| 23:50 | JPY | GDP Deflator Y/Y Q3 F | -0.30% | -0.50% | -0.50% | |
| 23:50 | JPY | Bank Lending Y/Y Nov F | 2.70% | 2.50% | 2.70% | 2.60% |
| 23:50 | JPY | Current Account (JPY) Oct | -0.61T | 0.35T | 0.67T | |
| 00:01 | GBP | RICS Housing Price Balance Nov | -25% | -2% | ||
| 00:30 | AUD | Trade Balance (AUD) Oct | 12.22B | 12.10B | 12.44B | |
| 05:00 | JPY | Eco Watchers Survey: Current Nov | 48.1 | 49.3 | 49.9 | |
| 13:30 | USD | Initial Jobless Claims (Dec 2) | 245K | 225K | ||
| 15:30 | USD | Natural Gas Storage | -38B | -81B |
Gold fails 1800 handle for now
Gold's rally halted after hitting 1809.80 earlier in the week, but failed to sustain above 1800 handle and turned into consolidations. Dollar's recovery is capping Gold's strength. Traders in the currency markets are generally cautious ahead of next week's FOMC rate decision, and more importantly, the new dot plot.
Technically, Gold is feeling some support from 4 hour 55 EMA, which is a positive sign. Break of 1809.80 will resume the rise from 1616.51 to 61.8% projection of 1616.51 to 1786.83 from 1728.48 at 1833.73. However, sustained trading below 4 hour 55 EMA (now at 1772.44) will at least bring deeper fall back to 1728.48 support for a test.
Australia trade surplus little change at AUD 12.22B in Oct
Australia exports of goods and services dropped -0.9% mom to AUD 60.01B in October. Imports dropped -0.7% mom to AUD 47.85B. Trade surplus narrowed slightly from AUD 12.44B to AUD 12.22B, slightly above expectation of AUD 12.10B.
Looking at some details, the decline in exports was driven mainly by AUD -0.6B fall in gold while imports decline was driven by AUD -0.5B fall in energy. Fuel exports, dominated by LNG, rose AUD 0.3B to AUD 11.2B, and hit a new record high. Rural goods exports rose AUD 0.1B to AUD 7.2B, also a record high.
Bitcoin Price At Risk of Fresh Decline, Here’s Why
Key Highlights
- Bitcoin price is struggling to clear the $17,400 resistance zone.
- It traded below a key bullish trend line with support at $16,950 on the 4-hours chart.
- The price could gain bearish momentum if it fails to stay above the $16,200 support.
- Crude oil price spiked below $75 before there was a minor upside correction.
Bitcoin Price Technical Analysis
Bitcoin price attempted a recovery wave above the $16,000 resistance zone. BTC/USD was able to climb above the $17,000 level, but the bears were active near the $17,400 zone.
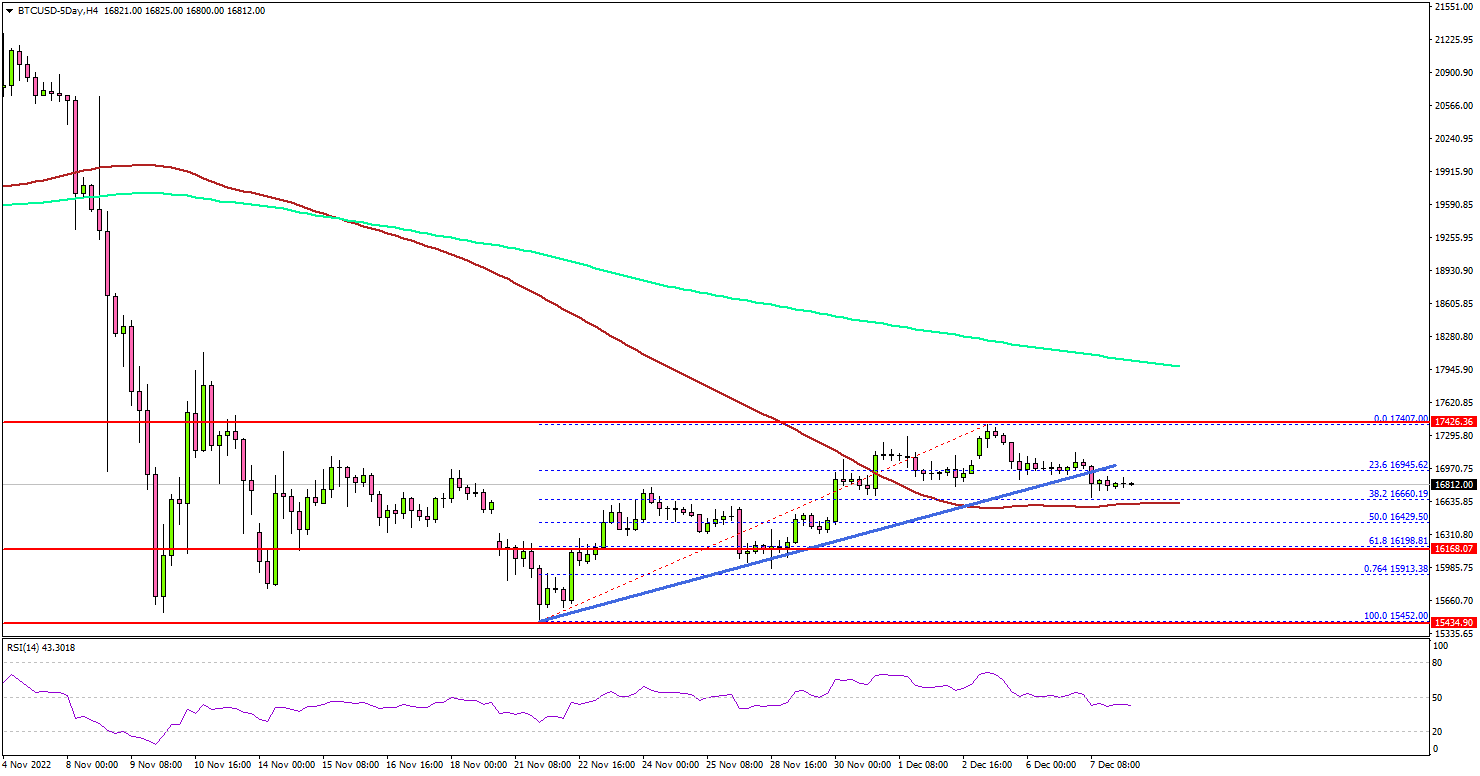
Looking at the 4-hours chart, the price traded as high as $17,407 level and remained below the 200 simple moving average (green, 4-hours). The price started a downside correction below the $17,200 and $17,000 levels.
There was a break below a key bullish trend line with support at $16,950 on the same chart. The price traded below the 23.6% Fib retracement level of the bullish wave from the $15,452 swing low to $17,407 high.
It is now consolidating above the $16,500 level and the 100 simple moving average (red, 4-hours). On the downside, an initial support sits near the $16,420 level.
The main breakdown support sits near the $16,200 zone. If there is a downside break and close below $16,200, bitcoin might start another major decline in the coming days.
An immediate resistance is near the $17,200 level. The next resistance sits near the $17,400 zone. A close above the $17,400 level may perhaps start another steady increase in the coming days.
In the stated case, the price could rise towards the $18,000 level or the 200 simple moving average (green, 4-hours). Any more gains could set the pace for a move towards the $19,000 level.
Economic Releases
- US Initial Jobless Claims - Forecast 230K, versus 225K previous.
Elliott Wave View: EURAUD Has Resumed Higher
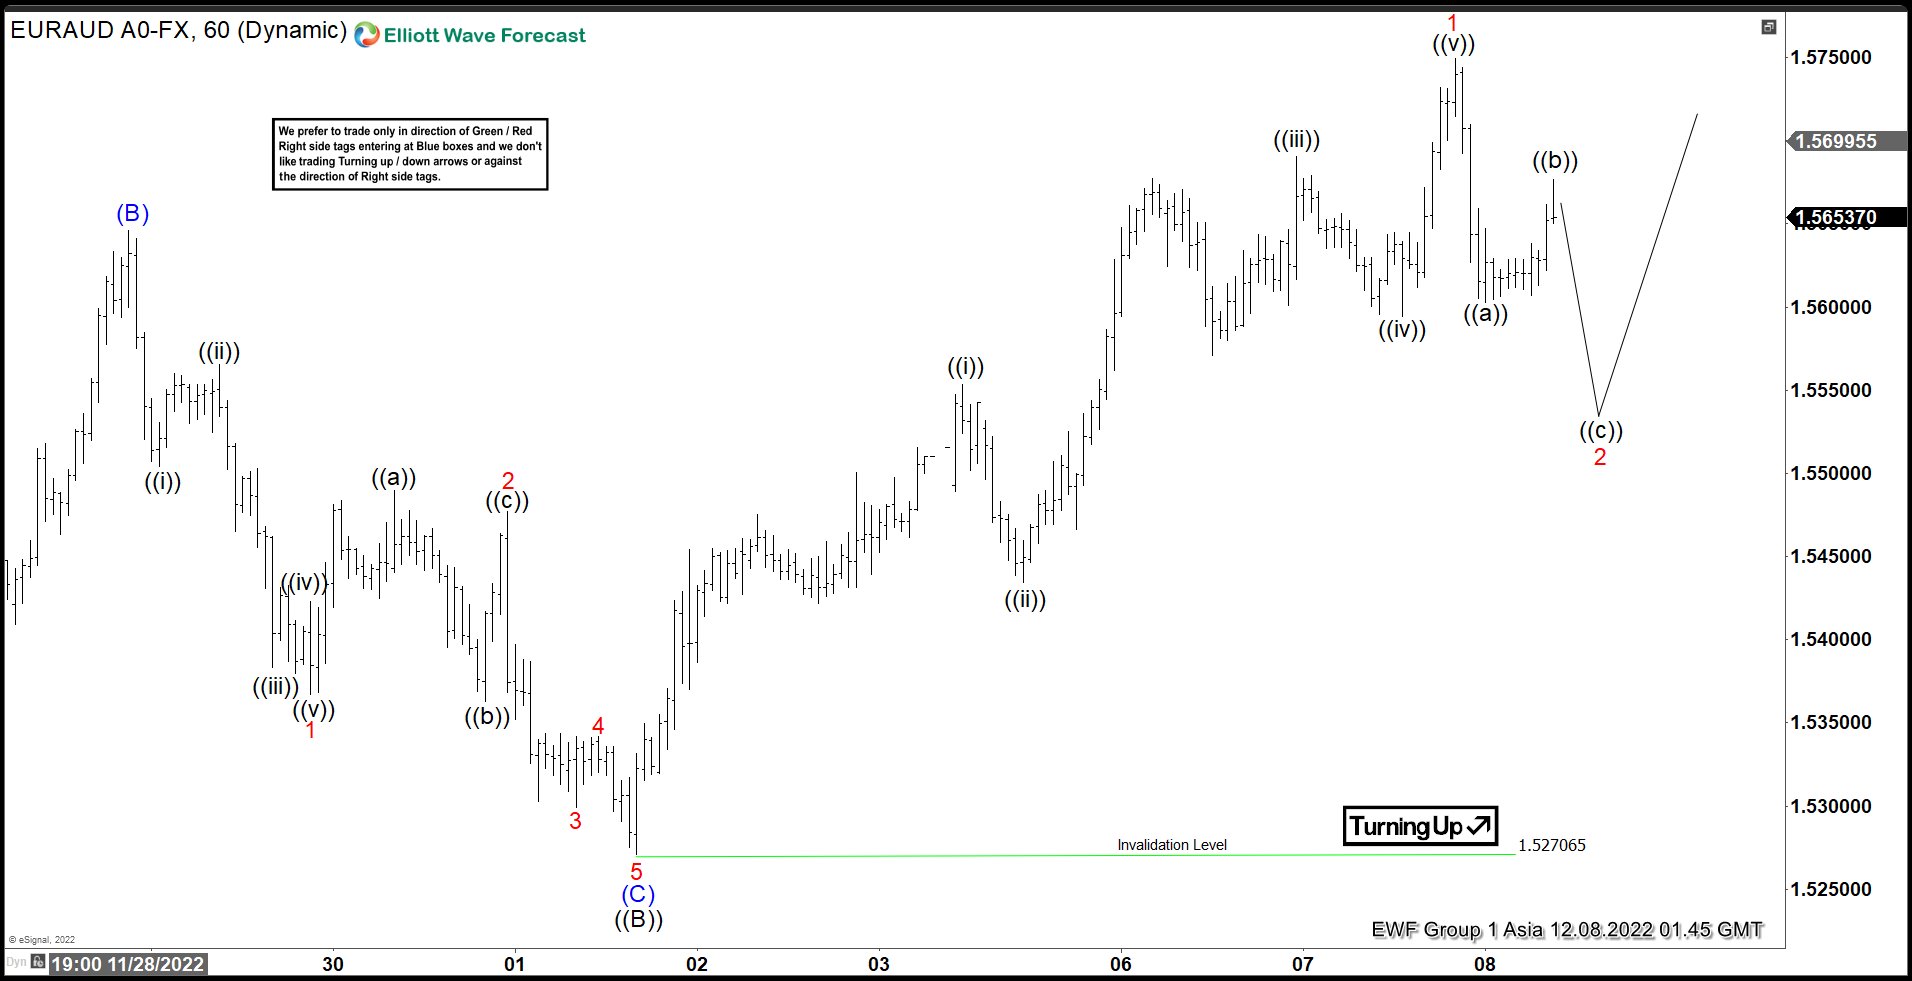
Short term Elliott Wave View in EURAUD suggests the cycle from 8.25.2022 low is unfolding as a zigzag Elliott Wave structure. Up from 8.25.2022 low, wave ((A)) ended at 1.5706 and wave ((B)) pullback ended at 1.5259. Internal subdivision of wave (B) unfolded as a running flat. Wave (A) ended at 1.5254 and wave (B) ended at 1.5645. Wave (C) lower ended at 1.527 with subdivision as a 5 waves impulse. Down from wave (B), wave 1 ended at 1.5367 and rally in wave 2 ended at 1.5476. Pair resumed lower in wave 3 towards 1.5299, wave 4 ended at 1.534, and wave 5 lower ended at 1.527. This completed wave (B) in higher degree.
Wave ((C)) higher is in progress and it has broken above ((A)) at 15706 confirming that the next leg higher has started. Up from 12.1.2022 low, wave ((i)) ended at 1.5553 and pullback in wave ((ii)) ended at 1.5434. Pair resumed higher in wave ((iii)) towards 1.569 and pullback in wave ((iv)) ended at 1.5594. Final leg higher wave ((v)) ended at 1.5749 which completed wave 1. Wave 2 pullback is in progress to correct cycle from 12.1.2022 low before the rally resumes. Near term, as far as pivot at 1.527 low stays intact, expect dips to find support in 3, 7, or 11 swing for further upside.
EURAUD 60 Minutes Elliott Wave Chart
https://www.youtube.com/watch?v=es_2I1X4GIk
BoC’s Hawkish(ish) 50 bp Hike Could Be Its Last
- BoC hikes by 50 bps to 4.25%, bringing cumulative tightening to 400 bps this year
- Slightly hawkish surprise: consensus was split between 25 and 50 bps
- Soft tightening bias opens the door to a January pause
The BoC lifted its overnight rate by 50 bps to 4.25%, a stronger increase than the 25 bps we expected. Consensus was almost evenly split between a 25 and 50 bp hike though market pricing was leaning toward the former, so yields have increased and the Canadian dollar is a touch stronger in the wake of the decision. The policy statement wasn’t as hawkish as the decision itself—in fact the BoC’s updated forward guidance features a softer tightening bias than we expected. Rather than suggesting the “the policy interest rate will need to rise further,” today’s guidance is that “Governing Council will be considering whether the policy interest rate needs to rise further.” That clearly opens the door to a pause as soon as the next meeting in January, and in our view frames that decision as between 0 and 25 bps.
There’s plenty of data in the next seven weeks that will influence that January decision—two CPI reports, another month’s GDP and jobs data, and the bank’s quarterly BOS and CSCE surveys. We think today’s larger-than-expected hike was due in part to strong labour market data since the October meeting. Indeed, the statement noted “Canada’s labour market remains tight, with unemployment near historic lows.” One jobs report isn’t likely to change that story, but a soft December LFS would help build the case for a pause. And since the labour market is generally a lagging indicator, another muted increase in monthly GDP could also help push the BoC to the sidelines. The bank reiterated its view that growth will essentially stall in the coming quarters.
Today’s statement made note of recent slowing in three-month measures of core inflation—a trend we’ve keyed in on, in addition to evidence suggesting inflationary pressure is becoming less broadly based. Two more months of CPI moving in that direction would likely be enough to keep the BoC on hold—we'd say those reports are likely to be the most influential for January's decision. But with ongoing emphasis on inflation expectations, relevant measures in the upcoming BOS and CSCE will also have to cooperate. Interestingly, the BoC made no mention of firming wage growth in recent Labour Force Surveys, perhaps because the separate payrolls survey calls that trend into question.
The BoC is also likely to be watching changes in financial conditions over the next seven weeks. 5-year GoC bond yields were down 75 bps in the month leading to today’s decision—an easing in financial conditions that may have caused some discomfort and motivated today’s 50 bp hike. A further decline in yields could prompt push-back from the BoC, either through another hike in January or emphasis that rates will have to remain high for an extended period. We expect a challenging consumer backdrop and ongoing pullback in housing will see Canada’s economy slip into recession in the first half of 2023. But with inflation remaining elevated, the BoC isn’t likely to react as quickly to that slowdown as it has in recent cycles.