Sample Category Title
NZD Dollar Bounces Back ahead of RBNZ Meet
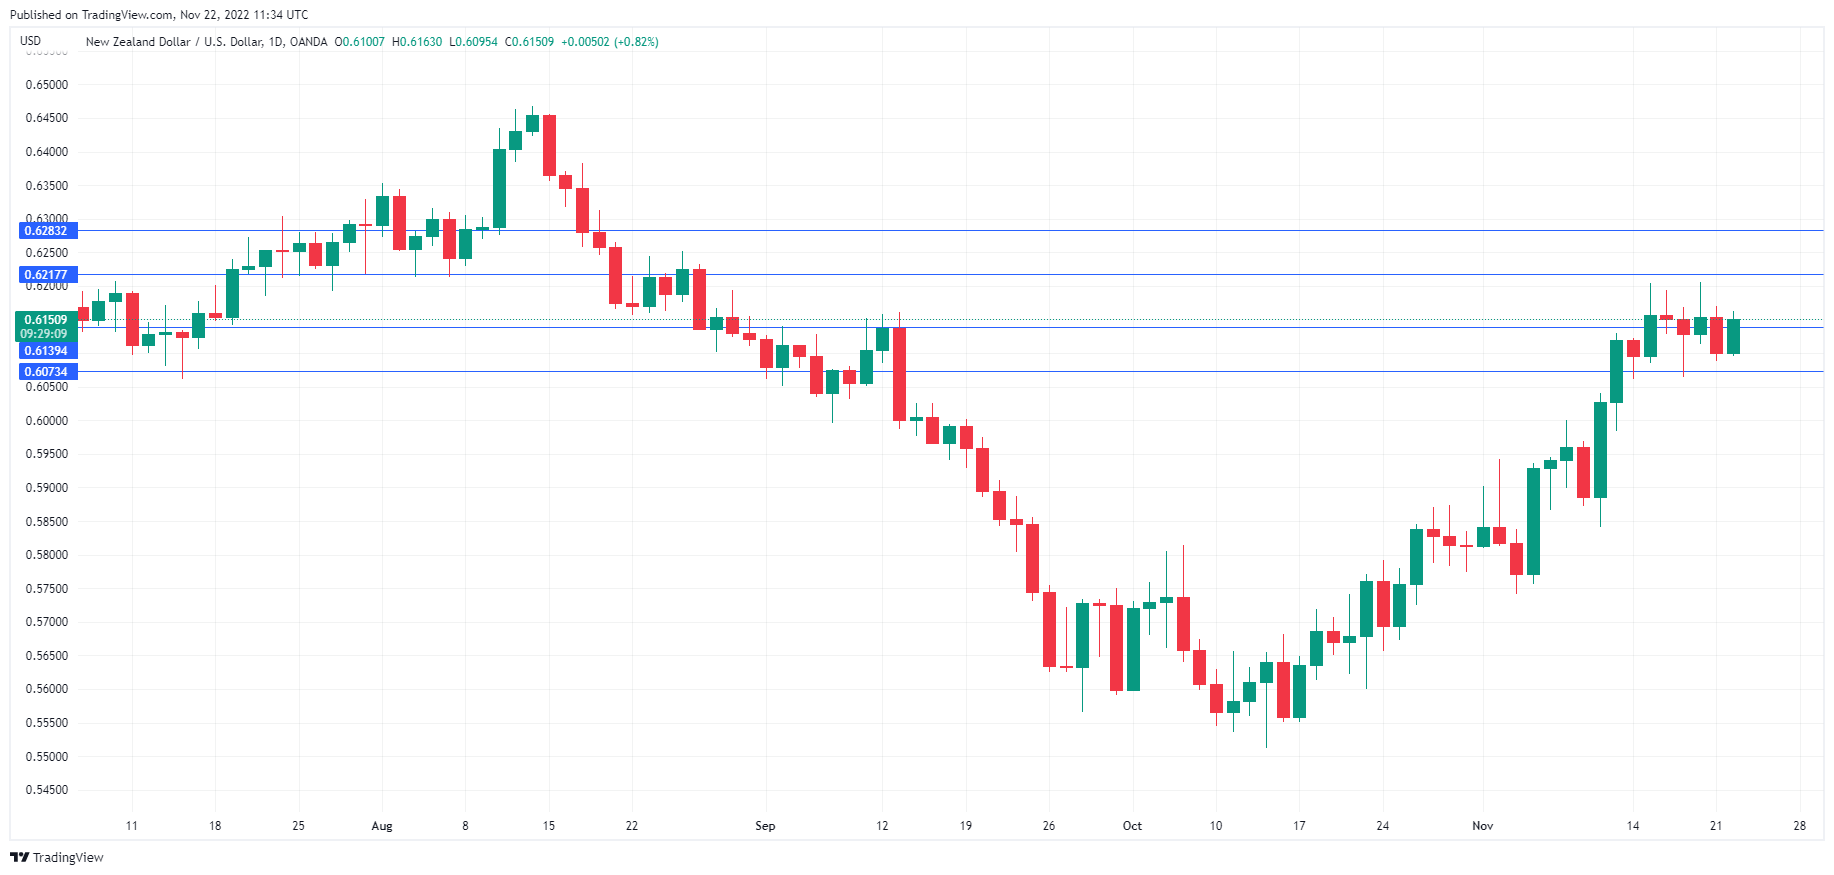
The New Zealand dollar has rebounded on Tuesday with strong gains. In the European session, NZD/USD is trading at 0.6151, up 0.83%.
Will RBNZ go all out?
The Reserve Bank of New Zealand has been tightening aggressively, delivering five straight 50-point hikes. The cash rate is currently at 3.5%, but this hasn’t achieved the goal of taming red-hot inflation. In the third quarter, CPI was almost unchanged, nudging lower to 7.2%, after a 7.3% gain in Q2. This was much higher than the RBNZ’s projection of 6.4%. With inflation expectations at 40-year highs, there is pressure on the bank to press the rate pedal to the floor.
The RBNZ will make its rate decision on Wednesday, with the markets expecting a 75-point hike, which would be the bank’s largest rate increase on record. Policy makers are confident that the economy can withstand a 75-point increase. The labour market remains tight, with unemployment at a near-record low of 3.3%, and the economy has recovered impressively from the Covid pandemic. There is clearly a risk that a jumbo rate hike will cause a harder landing than the RBNZ would like, but inflation remains priority number one. With the next rate decision not until late February, the RBNZ may want to make a loud splash at tomorrow’s meeting.
The recent US inflation report unleashed a wave of exuberance, sending equity markets higher and the US dollar on a nasty slide. Investors became more confident that Fed was close to a pivot in its aggressive policy and risk sentiment soared. The Fed has pushed back with Fed members delivering hawkish statements and projections, which has chilled risk appetite and stabilized the US dollar. Fed member Mary Daly weighed in on Monday, stating that inflation remained unacceptably high and projecting that the fed funds rate will peak at 4.75%-5.00%.
NZD/USD Technical
- There is resistance at 0.6072 and 0.6202
- 0.5955 and 0.5871 are providing support
Crypto Market Cap Halving?
Market picture
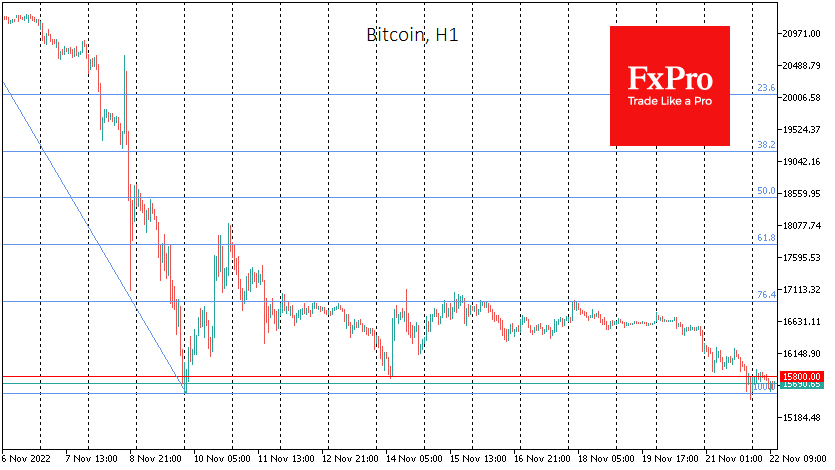
Bitcoin went below 15,500 at the end of the day on Monday, rewriting two-year lows, and slightly retreated from those extremes by the start of trading in Europe, trading around 15,700 (-2% in 24 hours). Ethereum is updating lows from July at the time of writing, falling to $1072 (+3.5% in 24 hours).
The crypto market capitalisation is down 1.75% overnight to $782bn, its lowest since January 2021. Although this indicator is very tentative and synthetic, we have seen a tug-of-war around $1 trillion for a long time. For a while, the market lingered near levels just above 830 – the high at the peak in January 2018. Now another belief that the previous peak of the last cycle would work as insurmountable support has been broken.
The crypto market capitalisation has gone sharply down, failing to develop an offensive above its 200-week average by early November. The 200-week (4-year) period is consistent with the notion of cycles in crypto, and the situation now looks like the exit of leveraged speculators who thought crypto had bottomed out in June-October.
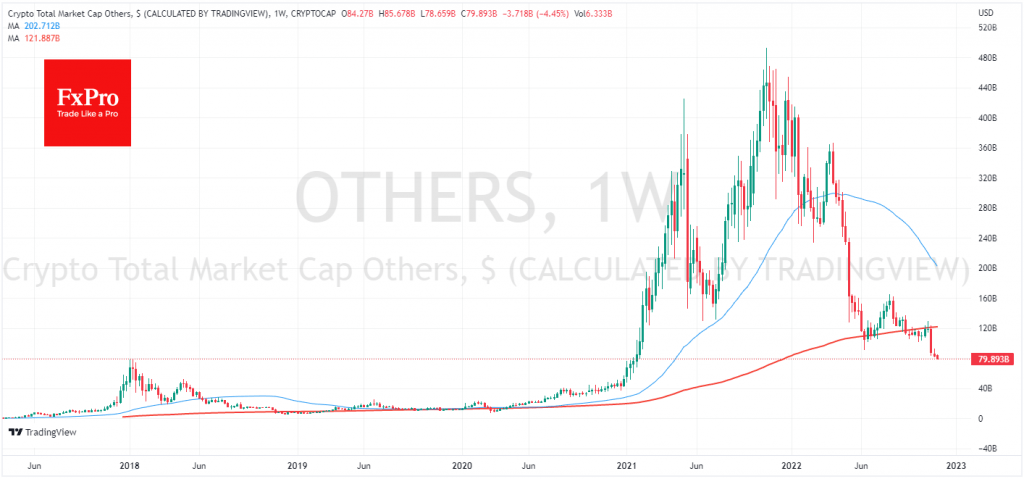
Although we believe that squeezing the weak hands out of the sector is almost complete, we are now seeing nothing more than speculators deleveraging, which is generally healing the market. Technical analysis suggests capitalisation could fall as much as 400-450bn, nullifying the rally, before returning to growth. However, this technical picture looks excessively pessimistic, and the stingiest speculators might not wait for that entry point, as is often the case in the markets.
News background
According to CoinShares, investments in cryptocurrencies rose by $44m last week against inflows of $42m the week before. Bitcoin investments rose by $14m, while Ethereum fell by $1m. Investments in funds that allow shorts on bitcoin increased by $18m, while shorts on ETH increased by a record $14m. Inflows to “short” products were 75% of the total, suggesting a deeply negative sentiment amid the FTX collapse, CoinShares noted.
According to IntoTheBlock, the share of unprofitable bitcoin addresses exceeded 51% (24.56 million addresses out of 47.85 million BTC holders). The last time a similar situation was observed was after the market crash in March 2020.
Rumours have emerged in the cryptocurrency community about possible problems at another major company. The failure of digital asset manager Grayscale Investments to disclose reserves and the suspension of crypto lending operations by OTC platform Genesis Trading have raised concerns about the entire Digital Currency Group (DCG) sustainability. According to experts, the collapse of Grayscale would be more severe than the collapse of Three Arrows Capital.
WTI Quickly Recovered Monday’s Heavy Losses But Downside Remains Vulnerable
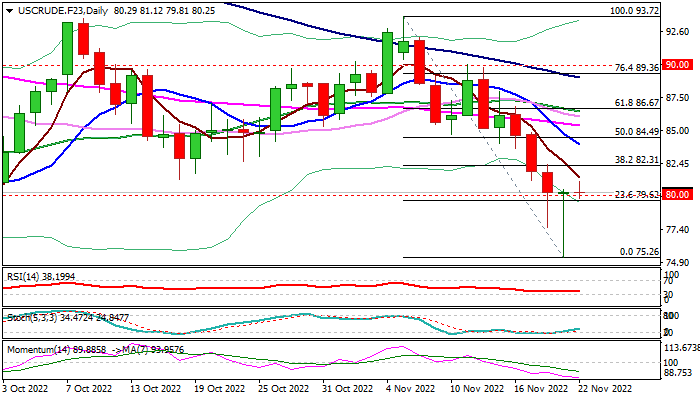
WTI oil was firmer in early Tuesday trading following a roller-coaster ride on Monday, when oil fell over 6% and recovered all losses on subsequent quick bounce.
The news that China is imposing fresh package of restrictions on new and strong wave of Covid infections in the capital Beijing and many provinces, soured the sentiment, though for a short period, as traders saw a good opportunity to enter fresh longs at the levels close to 2022 low, posted in early January.
Oil remains very sensitive to fundamentals, which continue to shake oil market almost on a daily basis and seen as a main driver nowadays.
Technical picture is also very interesting, as overall structure is bearish, defined by strong bearish momentum on daily chart and moving averages in full bearish setup.
On the other side, Monday’s strong rejection at key support at $76.25 (Sep 26 low) and also repeated failure to register daily close below psychological $80 support, generate initial positive signal, along with Monday’s long-tailed Doji candle that signaled a bear-trap and Tuesday’s advance, which hint formation of reversal signal on daily chart.
This points to mixed picture, with more evidence needed to confirm signals in both cases.
Bullish scenario requires stronger bounce and firm bullish close today, to complete Doji Morning Star reversal pattern on daily chart, though extension and close above pivotal Fibo resistance at $82.31 (38.2% of $93.72/$75.26) will be needed to confirm and add to fresh bullish bias.
However, this would still keep risk of limited correction of the bear-leg from $93.72 unless stronger acceleration through an array of moving averages and Fibo level at $86.67 (Fibo 61.8%) registers close above these levels.
More likely scenario in which fresh bulls would run out of steam and increase downside risk, is seen in current overall negative environment, boosted by disappointing news from China, which add to existing fears about further slowdown in a global demand as a number of Western economies are already in recession.
Res: 81.29; 82.31; 83.91; 84.49.
Sup: 80.00; 79.62; 77.57; 76.25.
Yen Steadies as Inflation Rises
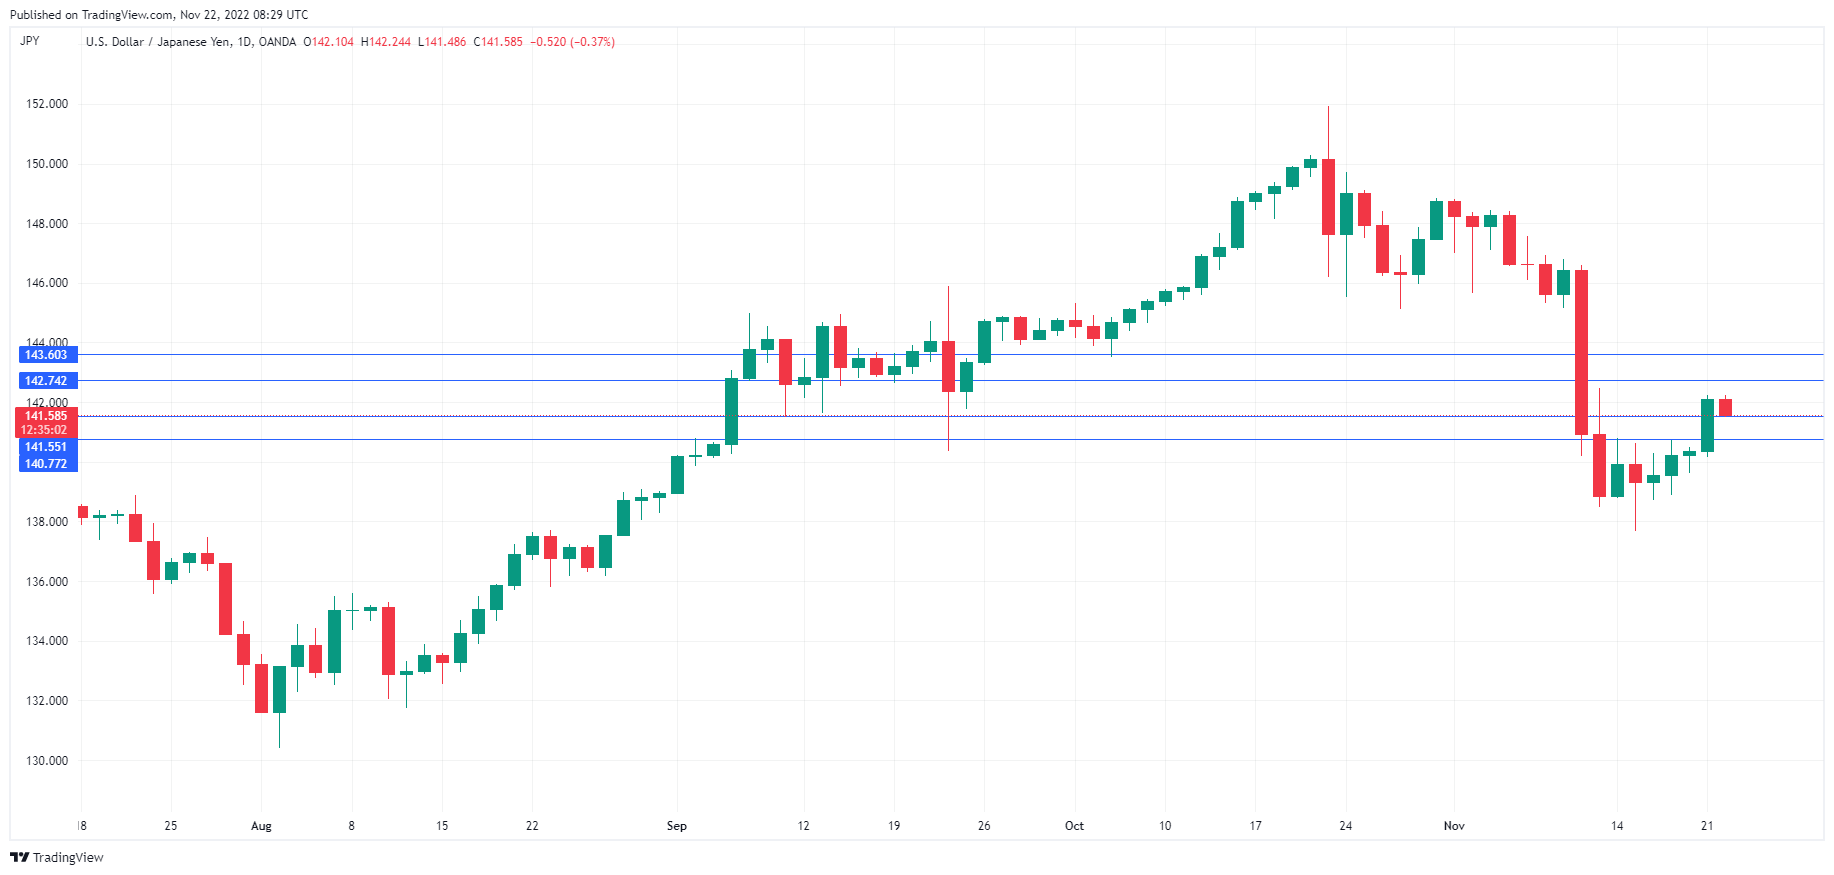
The Japanese yen has stabilized on Tuesday and is trading at 141.58, down 0.37%. USD/JPY rocketed higher on Monday, gaining 1.2%.
BoJ Core CPI jumps to 2.7%
With inflation continuing to gain traction in Japan, there shouldn’t have been much surprise that BoJ Core CPI accelerated in October for a ninth successive month. Still, the 2.7% gain was much stronger than the prior reading of 2.0% and the consensus of 2.2%. The reading comes on the heels of National Core CPI, which rose to 3.6%, up from 3.0%.
The Bank of Japan is unlikely to change its ultra-loose policy, even with inflation rising and a weak yen contributing to higher costs for households and businesses. The yen is well below the highs we saw in late October, when USD/JPY breached the 150 level and triggered a currency intervention. I am doubtful that such unilateral moves can have a lasting effect, but it is a tool that the government likes to resort to in order to dissuade speculators from pushing the yen lower.
What may lead to a change in BoJ policy is the changing of the guard at the central bank. Governor Kuroda is scheduled to step down in April, after a 10-year stint as head of the bank. There have been calls to re-examine the bank’s policy, which has been in place for years. Sayuri Shirai, a former BOJ board member and candidate for a deputy BOJ governor, does not favor sharp rate hikes but has urged the bank to review its stimulus policy, show some flexibility and simplify its communication with the markets. This kind of thinking will be a breath of fresh air at the BoJ, whose policy meetings are usually drab affairs that are ignored by the markets, as the BoJ simply reiterates its policy and expresses concern about the decline in the yen.
The most recent US inflation report was softer than expected, sending equity markets flying and the US dollar sliding lower. The Fed has responded with a steady stream of hawkish statements from Fed members, which has succeeded in dampening risk appetite and stabilizing the dollar. Fed member Mary Daly weighed in on Monday, stating that inflation remained unacceptably high and projecting that the fed funds rate will peak at 4.75%-5.00%
USD/JPY Technical
- USD/JPY is testing support at 141.55. Below, there is support at 140.77
- There is resistance at 142.74 and 143.60
RBA Lowe not ruling out return to 50bps hike, nor pausing
RBA Governor Philip Lowe reiterated in a speech that the Board expects to "interest rates further over the period ahead", and interest rate is "not on a pre-set path".
"We have not ruled out returning to 50 basis point increases if that is necessary," he said. "Nor have we ruled out keeping rates unchanged for a time as we assess the state of the economy and the outlook for inflation."
"As we take our decisions over coming meetings, we will be paying close attention to developments in the global economy, the evolution of household spending and wage and price setting behaviour."
"Developments in each of these three areas will affect the pace at which inflation returns to target and whether the economy can remain on an even keel over the next couple of years."
GBPUSD Within Tight Range after Advance Pauses Near 1.2000
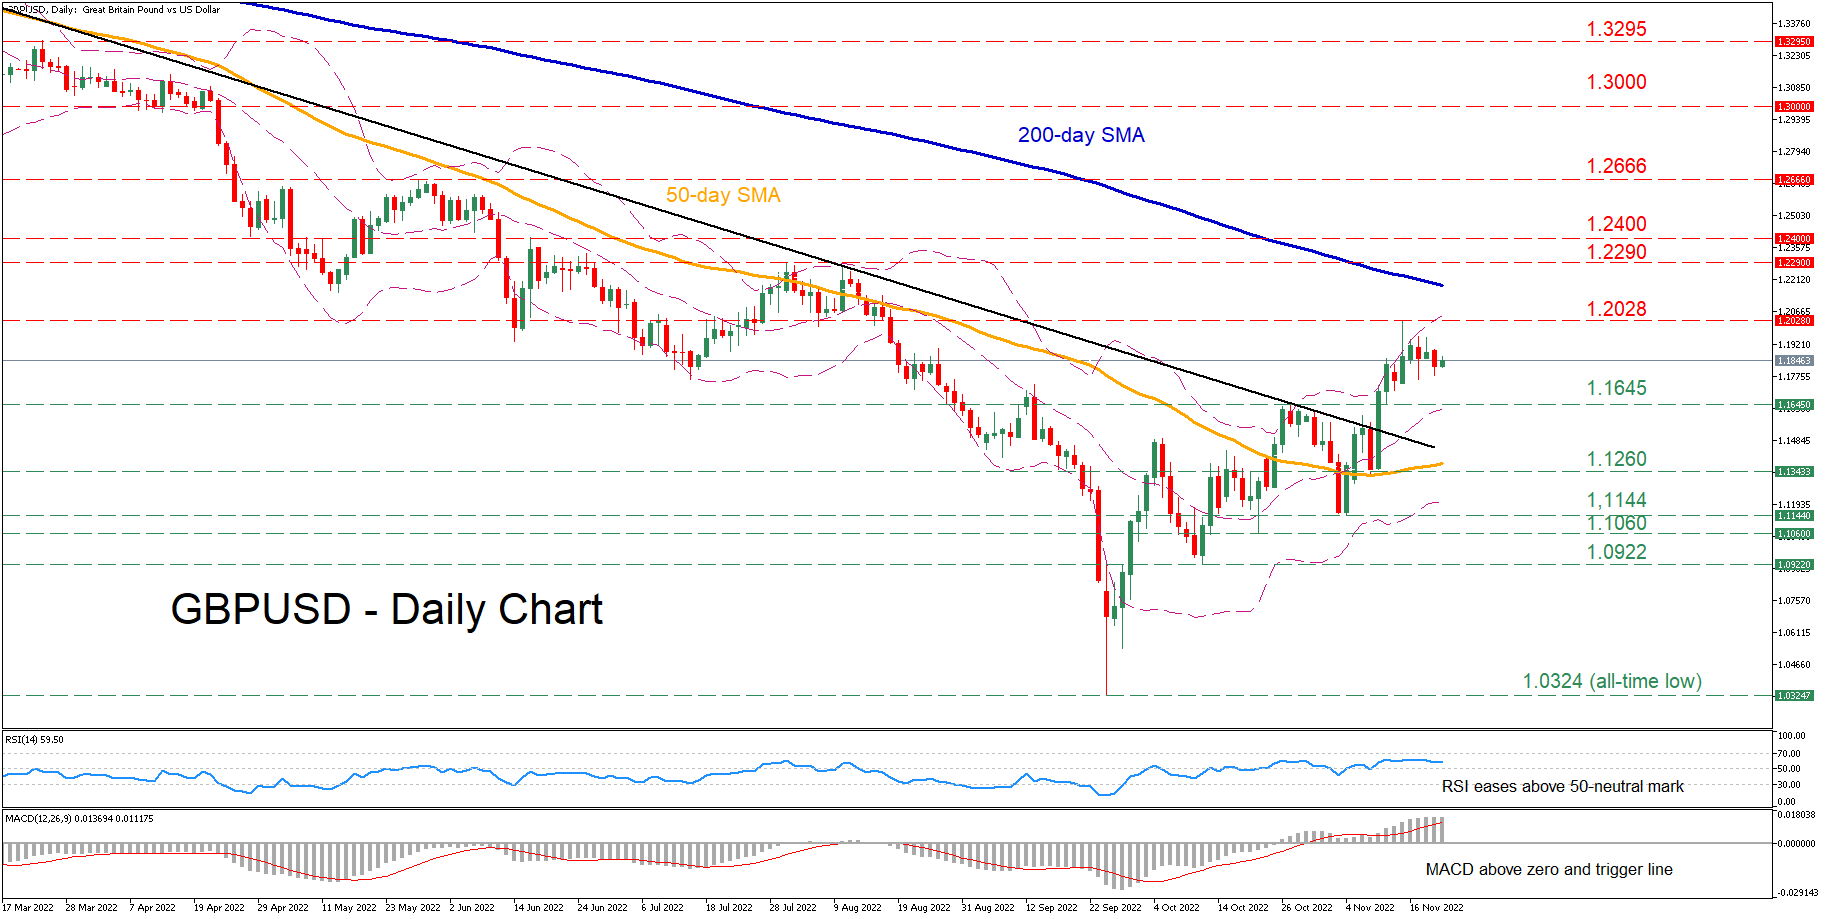
GBPUSD has been stuck in a prolonged downtrend since the beginning of the year, plummeting to an all-time low of 1.0324 in mid-September. Nevertheless, the pair has exhibited signs of recovery in the short term, which has currently come to a halt near the 1.200 region.
The short-term oscillators are currently indicating a cautiously bullish near-term tone. Specifically, the RSI is hovering above its 50-neutral mark, while the MACD histogram is flat above both zero and its red signal line.
To the upside, bullish actions could propel the price towards the recent resistance of 1.2028. Piercing through this region, the price could challenge the July peak of 1.2290. Even higher, the 1.2400 hurdle could curb any further advances before the May high of 1.2666 comes under examination.
Alternatively, should the positive momentum fade and the price reverses downwards, initial support could be met at 1.1645. Sliding beneath that floor, the bears might target 1.1260 before the spotlight turns to the November low of 1.1144. A violation of the latter could open the door for the October resistance of 1.1060.
Overall, GBPUSD appears to be losing steam after managing to break above its long-term restrictive trendline. Nevertheless, a break above the 1.2028 ceiling would most likely signal the continuation of the short-term uptrend.
EURJPY Meets the 20-day SMA But Needs Some Boost for More Increases
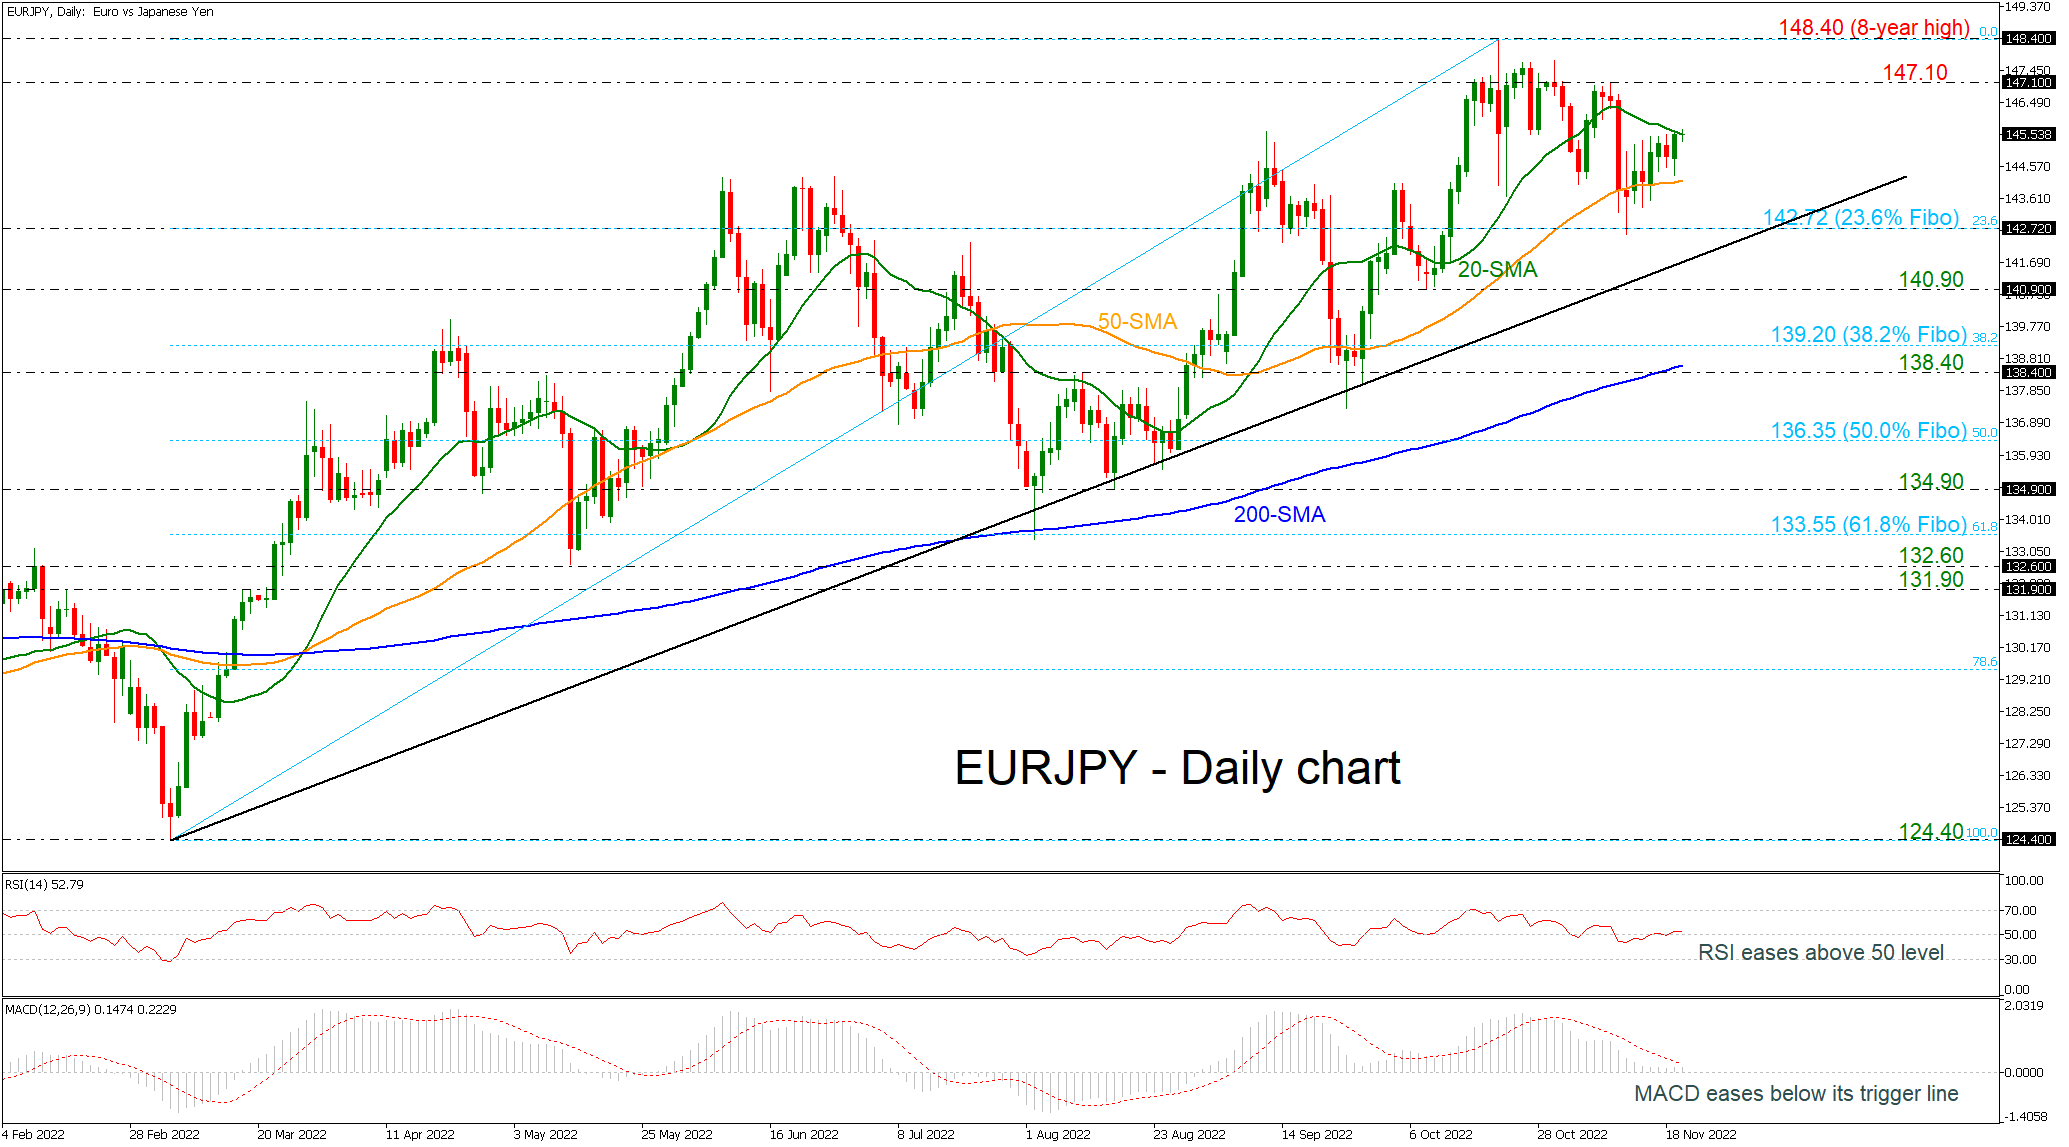
EURJPY is meeting the 20-day simple moving average (SMA) after several days of hovering within the short-term SMAs. In the broader outlook, the market is still moving above the long-term ascending trend line, endorsing the bullish picture.
However, the technical oscillators are showing some weakening bias. The flat move in the RSI and the slightly growing MACD are confirming the current neutral-to-bullish momentum in the price, though with the former nearing the neutral threshold of 50 and the MACD moving beneath its trigger line, the bears could be around the corner.
A decisive close above the 20-day SMA at 145.55 could reduce negative risks, producing another bullish extension towards the key 147.10 resistance. Beyond that, traders will target the eight-month high of 148.40, a break of which would re-activate March’s uptrend, shifting the near-term outlook from neutral to positive, though any steps higher could be limited if a new barrier pops up near the 150.00 psychological mark.
Otherwise, if sellers take the lead, the pair may pull back to test the nearby support of the 50-day SMA at 144.20 ahead of the 23.6% Fibonacci retracement level of the up leg from 124.40 to 148.80 at 142.72, which overlaps with the ascending trend line. A penetration of this line may attempt to add some footing around the 140.90 barrier, switching the long-term outlook to neutral. Falling lower, the 38.2% Fibonacci retracement at 139.20 and the 200-day SMA at 138.40 could block the negative wave.
In brief, EURJPY still needs some boost to strengthen its bullish trend in the long-term view as it is currently testing the crucial 20-day SMA.
Oil Prices Whipsawed With Swings of More Than 6%
Markets
The by far most eyepopping market move yesterday happened in oil. Prices whipsawed with swings of more than 6% on reports which were later denied that OPEC would consider a 500k production increase in December (see headline below). Other key markets were experiencing a mild risk-off session that spilled over from Asian/Chinese dealings. Stocks fell less than 0.5% in Europe and up to 1.1% in the US (Nasdaq). US Treasury yields rose 1-2 bps in the 2y-7y segment, underperforming the long end of the curve with supply (twin auction in the 2y, 5y) weighing. German yields fell up to 2 bps (10y, testing the 2%) but closed well above intraday lows. ECB’s Holzmann gave a small late-session push in the back. The Austrian governor said he’d back a 75 bps rate hike if things (on inflation) stay the same while only advocating a 50 bps move if CPI “shows a major reduction”. In an interview with the FT this morning, he elaborated further on his views, adding that a three-quarter bps move would show businesses and households the ECB is serious about taming surging price growth. His comments contrasted with those earlier from ECB chief economist Lane who sees a less strong case for such a big hike. The US dollar and to a lesser extend the Swiss franc enjoyed safe haven bids. The trade-weighted index rose from 106.97 to 107.99. USD/JPY rebounded from the low 140 area to 142.14. EUR/USD retreated from 1.0325 to 1.024. EUR/CHF eased to 0.9822, down from 0.986. Sterling held up well despite the risk climate. While still losing out against USD (GBP/USD 1.182), it held a small upper hand vs the euro (EUR/GBP closed at 0.866).
Asian trading is quiet this morning. Stocks mostly trade in the green with Japan outperforming peers. A moderately constructive risk context puts the greenback slightly in reverse vs G10 peers. China’s yuan stabilizes around USD/CNY 7.157. About half of the rally up to mid-November has been erased by now. That’s partially on a stronger US dollar. But fading hopes for a quick economic reopening as China enters the winter (sparking more Covid cases) weighs on the Chinese currency too. US cash yields drop between 5-7 bps at the front end.
There are again several Fed and ECB speeches due today. If anything, we expect members from the Fed to further side with a tightening slowdown to 50 bps, as did Mester and Daly yesterday. As Holzmann showed, the 50/75 bps debate within the ECB is much more alive. Other things to watch is the OECD’s updated economic outlook and the European Commission’s consumer confidence indicator (November). The Hungarian central bank holds a policy meeting. Markets today may nevertheless lack direction. Europe is counting down to tomorrow’s November PMIs while liquidity yesterday already started to ebb away in the US going into the Thanksgiving holidays.
News Headlines
The Wall Street Journal reported that OPEC is mulling a production increase at its December 4 meeting. Delegates told the WSJ that they could boost output by up to 500k barrels per day. The change of strategy (OPEC cut production by 2000k/day last month) would come one day ahead of the EU oil embargo against Russia and the G7’s aim to price cap Russian oil sales. This could strip (part of) Russian supply off the market. Oil prices slipped from $87/b to $82/b after the report, but completely reversed that move later on after Saudi Energy Minister Prince bin Salman said that it will stand by OPEC’s plan to cap oil output and that further cuts aren’t inconceivable.
EU Justice commissioner Reynders said that an agreement aimed at resolving the impasse over funding can be reached by end November if Hungary properly implements planned measures aimed at allaying the rule-of-law concerns of the EU. In other Hungarian news, the country’s central bank today is expected to keep its monthly base rate unchanged at 13%. The key rate remains the one day deposit facility which stands at 18%. The latter remains necessary as long as the forint is in the danger zone (> EUR/HUF 400). In this respect can unlocking EU funds relief some stress on the currency and in that way create some wiggle room for the MNB to make monetary policy slightly less restrictive.
EUR/CHF Daily Outlook
Daily Pivots: (S1) 0.9795; (P) 0.9827; (R1) 0.9855; More....
Intraday bias in EUR/CHF remains neutral for the moment. On the upside, firm break of 0.9953 resistance will resume larger rally from 0.9407 to 1.0072 fibonacci level. However, break of 0.9779 will likely resume the fall from 0.9953 through 0.9720.
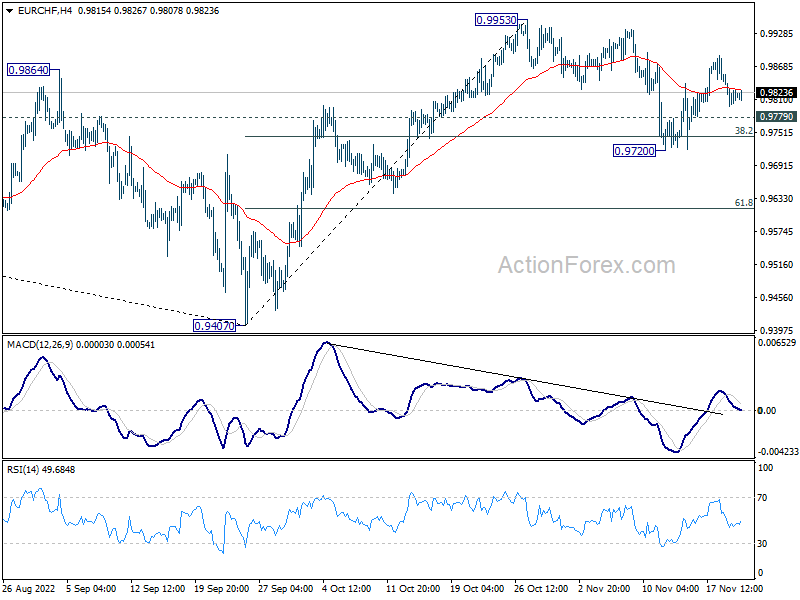
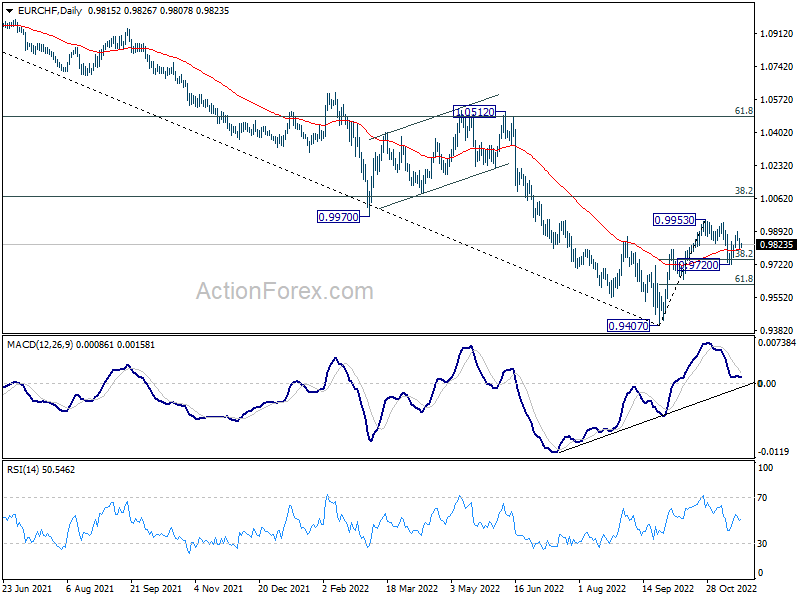
In the bigger picture, rejection by 0.9970 support turned resistance retains medium term bearishness. That is, while 0.9407 is a medium term bottom, price actions from there would develope into a corrective pattern rather than a reversal. Down trend resumption through 0.9407 is mildly favored at a later stage. This will remain the favored case now, as long 38.2% retracement of 1.1149 to 0.9407 at 1.0072 holds.
EUR/GBP Daily Outlook
Daily Pivots: (S1) 0.8648; (P) 0.8673; (R1) 0.8687; More...
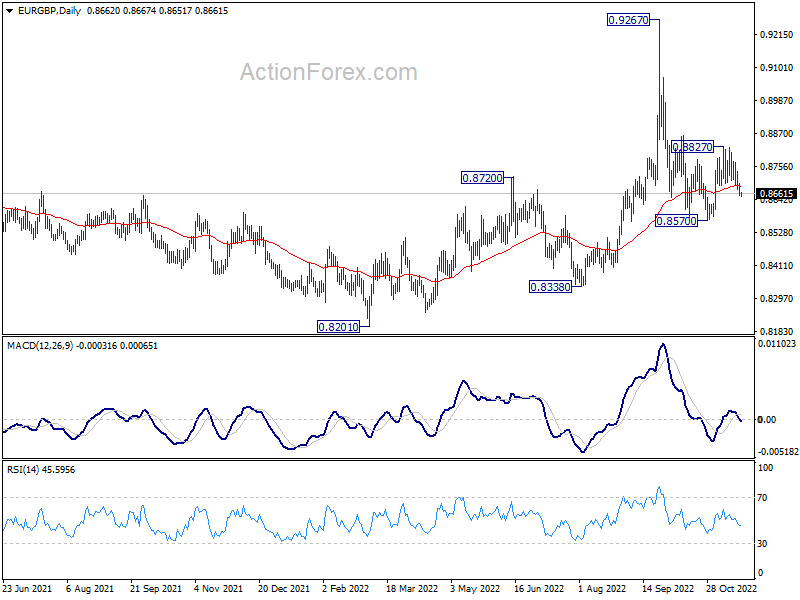
Intraday bias in EUR/GBP stays mildly on the downside at this point, for retesting 0.8570 support. Firm break there will resume whole decline from 0.9267. On the upside, above 0.8827 will resume the rebound from 0.8570 and flip bias back to the upside instead.
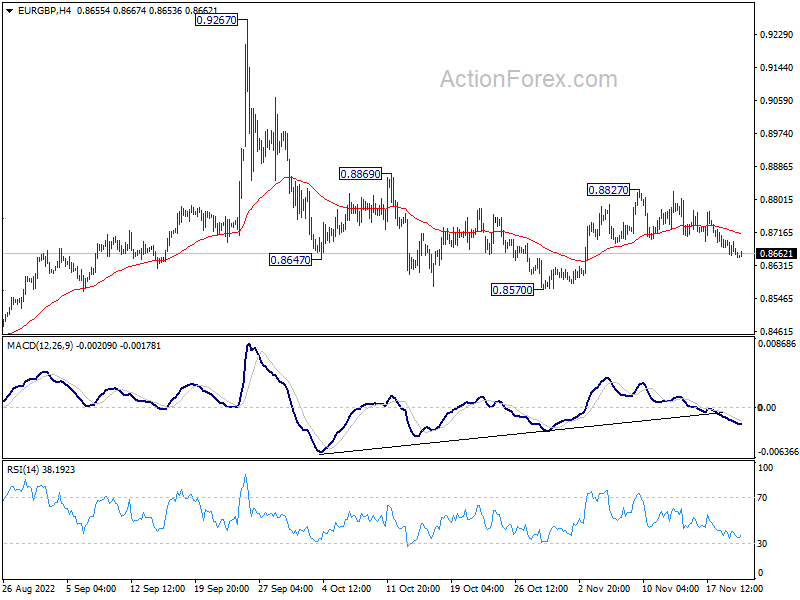
In the bigger picture, current development suggests that fall from 0.9267 is a down leg inside long term range pattern. Deeper fall could be seen towards 0.8201/8338 support zone. But strong support should be seen there to bring reversal. Nevertheless, firm break of 0.8869 resistance will turn favor to the case that such decline is merely a correction in the up trend from 0.8201. That is, further rally would be seen at a later stage through 0.9267.