

Sample Category Title
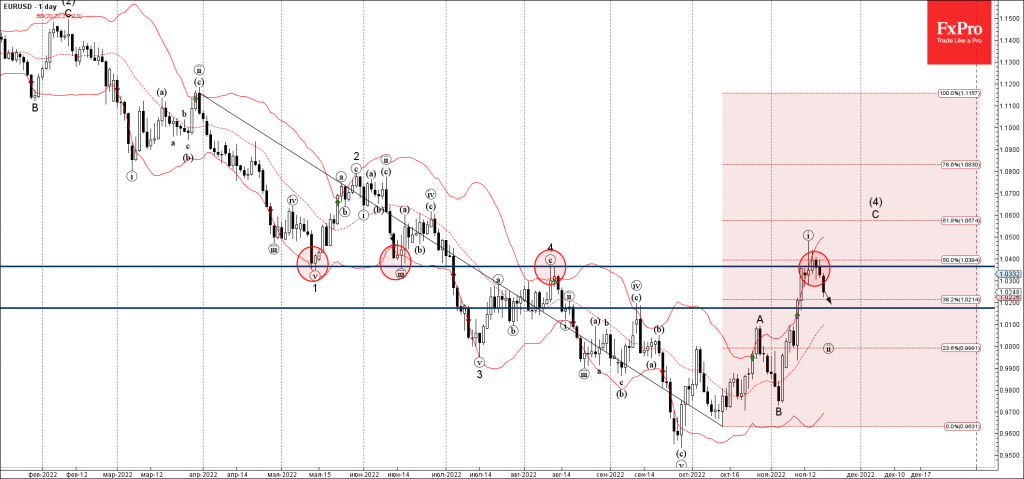
EURUSD Wave Analysis
- EURUSD under bearish pressure
- Likely to fall to support level 1.02
EURUSD under the strong bearish pressure after the pair reversed down from the pivotal resistance level 1.037 (former monthly low from May and June, and the monthly high from August) – standing near the upper weekly Bollinger Band.
The downward reversal from the resistance level 1.037 started wave (ii) of the active C-wave from the start of November.
EURUSD can be expected to fall further toward the next support level 1.02 (former monthly high from September).
AUDUSD Wave Analysis
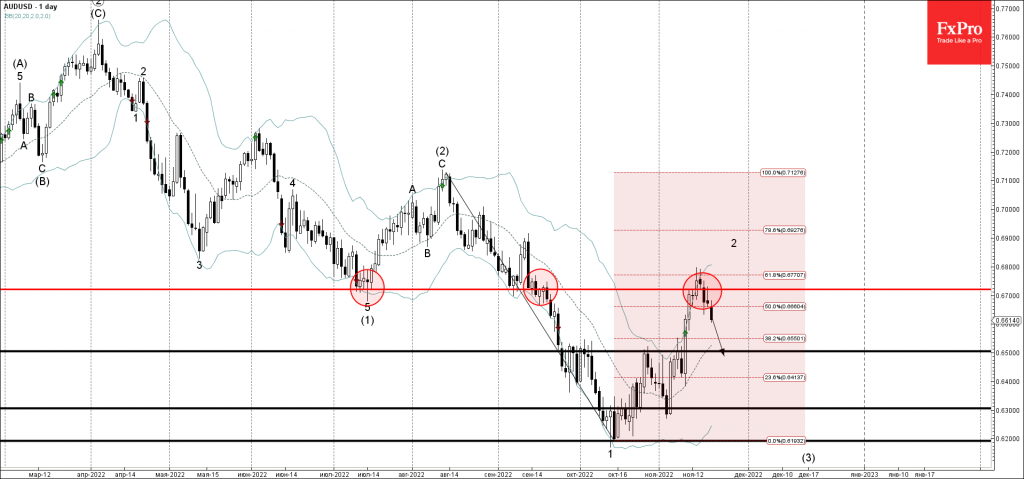
- AUDUSD reversed from resistance level 0.6725
- Likely to fall to support level 0.6500
AUDUSD recently reversed down from the key resistance level 0.6725 (former multi-month low from July), strengthened by the upper daily Bollinger Band and by the 61.8% Fibonacci correction of the downward impulse 1 from August.
The downward reversal from the resistance level 0.6725 stopped the previous short-term corrective wave 2 from October.
Given the strongly bullish USD sentiment seen today – AUDUSD can be expected to fall further toward the next support level 0.6500 (former resistance from October).
The Last Frontier for USD and Gold
Suddenly, the US Dollar Index fell 6.70% over the last two weeks, marking the biggest decrease in the currency since 2020. This movement greatly impacted stocks, other currencies, and gold. In this article, FBS experts focus on the XAUUSD pair as a main antagonist of the dollar. Economic analysis, valuable tips, and price forecasts are in this article.
What stands behind the dollar’s fallout?
The uptrend in the USD that lasted almost two years. It may now seem that the US currency is finally ready to reverse to the downside. The decrease started on November 4, when the US Office for National Statistics released the Non-farm employment change (NFP) data. The two previous releases pushed the USD up, that’s why it was surprising that high NFP pulled the USD down.
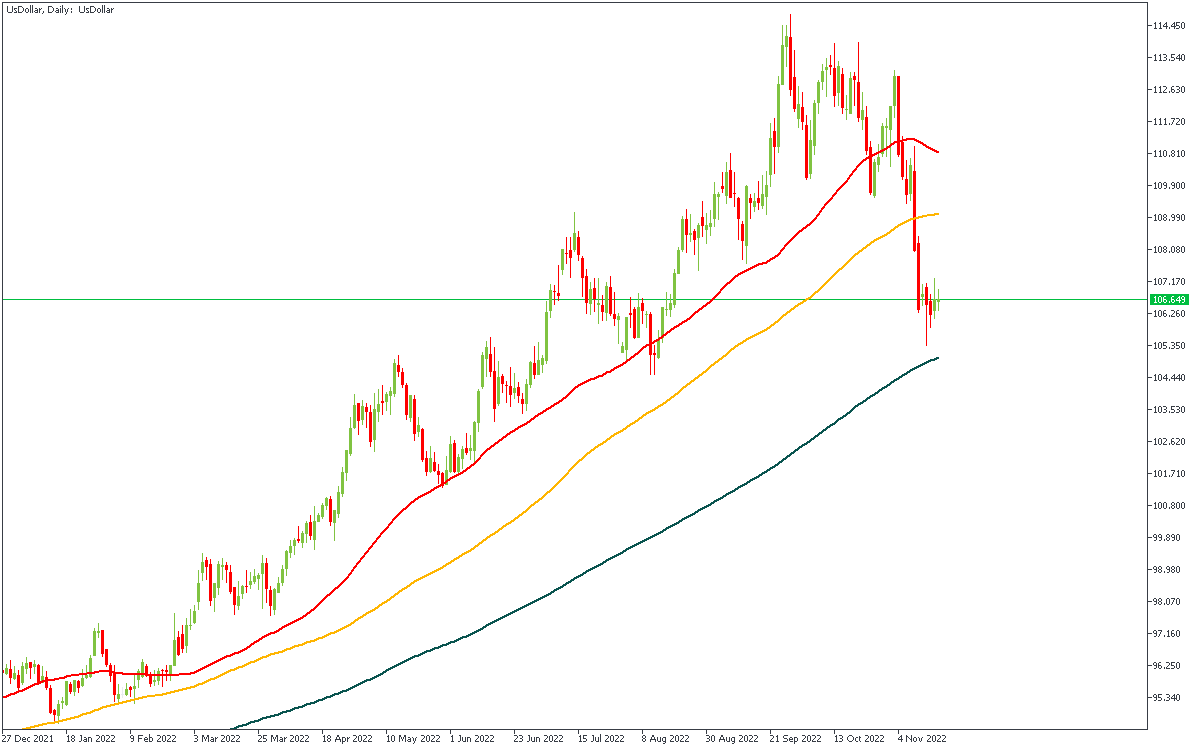
The US dollar strengthened after September’s and October’s NFP because the strong labor market signaled to the Fed that the American economy was still hotter than needed. Thus, it was evident that the Fed would increase the interest rate to decrease the speed of rising prices. In November, however, the sentiment started to change because NFP was still lower than in previous months, meaning that the labor market finally started to cool down.
The USD decrease sped up when the US monthly CPI data came out on November 10. A 0.4% rise vs. 0.6% forecast was taken as “the end of the recession,” sending risky assets to the moon and the USD below the 100-daily moving average. Finally, the US PPI, another measure of consumer inflation, turned out to be lower than expected (0.2% vs. 0.4% forecast).
All this created massive pressure on the US dollar index, pushing it to a three-month low and boosting EURUSD, stocks, and gold. Even so, why did gold skyrocket?
Gold and the USD interconnection
When Federal Reserve hikes rates, it makes money more expensive. To put it simply, higher interest rates increase deposit yields and loan interest. Thus, people and companies slow down spending and try to save more money for the future. The economy slows, and currency becomes more expensive, rising against other currencies. All that creates price pressure for gold, pushing it lower when the Fed fights inflation and insists on hawkish measures.
Here’s how it works:
- The inflation goes up, and the amount of the USD in circulation increases. Thus, the USD starts to decline.
- Fed applies monetary measures (interest rate increases and decrease of money supply)
- The USD starts growing, putting pressure on the XAUUSD (gold).
- The dollar weakens as the tightening process slows down, and gold soars.
The correlation between these two assets is better to see than to read about. Also, consider checking the FBS website for more analysis on gold and USD movements.
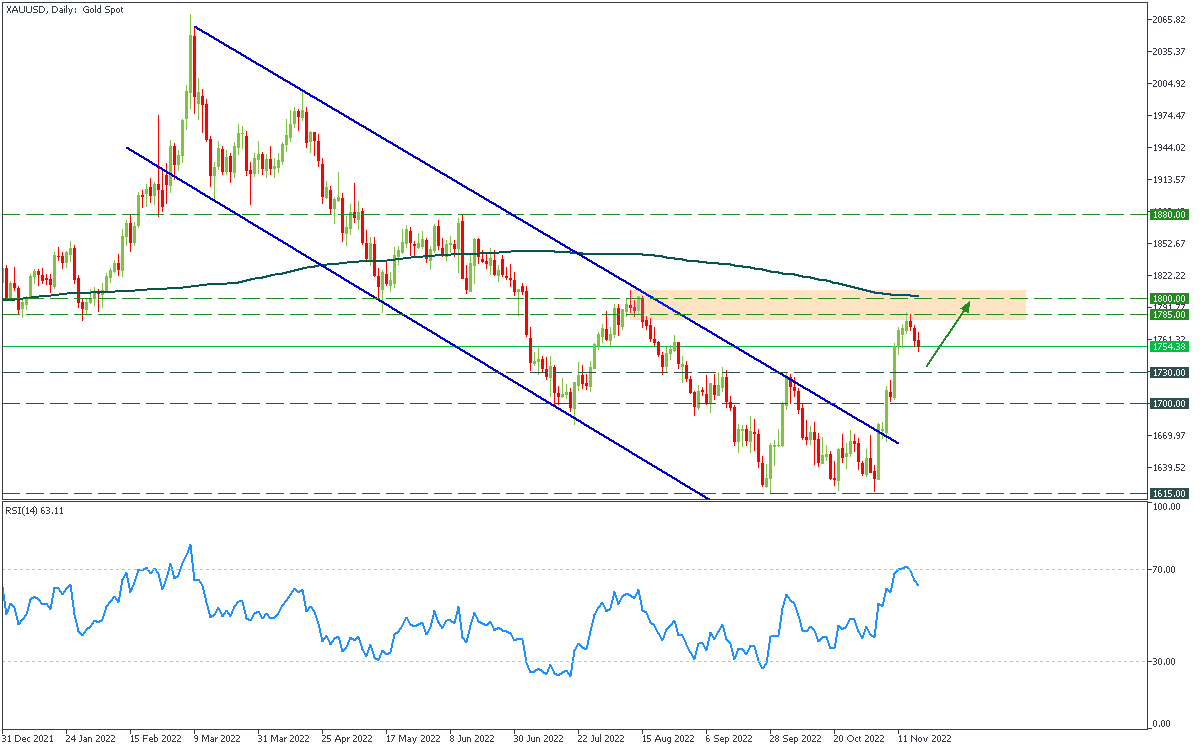
As for now, we have come to the most exciting part of the USD-gold price correlation, which is the change in the global trend.
Gold price forecast
Both the USD and XAUUSD approached the most important indicator of the trend – the 200-daily moving average. This level acts as a support for the dollar and as a resistance for gold. In both cases, the breakout of this level will signal a change in the long-term trend.
If the USD breaks the level of 105.00, gold will be extremely bullish. However, it’s important to notice that 200-period MA is a solid barrier. Assets usually take several attempts to break and form a price swing in the direction of the breakout. Therefore, we consider gold will correct from the area of $1785-1800 and reach the support of $1730, the last price high. After that, we need to look closely at actual economic data. More bearish news for the USD would add momentum to gold movements, and the metal may rise to $1880.
In summary, gold has more chances to grow than in the previous eight months. And with FBS, you can trade gold wherever you want, buying and selling the asset in seconds.
Sunset Market Commentary
Markets
Markets started the week with a Chinese inspired, admittedly modest, risk-off. The reaction of authorities to a new wave of Covid infections raised questions on an easing in the country’s zero-Covid policy. The change in sentiment on Chinese markets also illustrates that good news which, together with lower interest rates, supported the recent risk rally remains fragile and can turn from one day to another. Will Chinese production/demand recover as hoped for? Will a less harsh European winter prevent an sharp economic downturn? Will global growth succeed the hoped for soft landing despite tighter global monetary conditions? Answers to these and other questions remain highly uncertain and can change instantly. Whatever, risky assets see the glass half empty rather than half full today. Chinese equity indices lost up to 1.87% (Hang Seng) with modest spill-over effects on EMU (EuroStoxx -0.3%) and US markets (mixed to modestly lower, Nasdaq -0.4%). Uncertainty on global demand also weighs on cyclical commodities like copper (-1.0%+) or oil with Brent declining further to $84 p/b).
The ‘risk-off’ repositioning at least brought clarity on the fate of the dollar. The recent correction has gone far enough. The Fed might slow the pace of rate hikes in December, but remains a frontrunner in the anti-inflation campaign. After tentative signs of bottoming last week, the DXY jumped from an open sub 107 to currently trade near 107.75. EUR/USD’s failure to close last week above the 1.0350/68 area caused USD shorts against the euro to throw the towel. At 1.024, the pair again fell prey to the forces of gravity and is at risk of falling below an uptrend line in place since early this month. No safe haven allures for the yen, with USD/JPY decisively returning north of 140 (cur.141.5). In this respect, the Swiss franc performs better with EUR/CHF easing back to the 0.981 area. Sterling is holding up fairly well. EUR/GBP dropped below minor support near 0.869 to currently trade at 0.8675, but the short-term consolidation pattern in place since early October remains firm.
Interest rate markets initially didn’t show a clear directional trend, but yields finally turned south as US traders joined. US and German yields lose 3/5 bps. European swaps are ceding 5 (2-y)/8 (30-y) bps. ECB talk included an MNI-interview with ECB Lane who stroke a balanced tone. He acknowledged that there might still be additional follow-through from higher energy prices into retail prices. Supportive fiscal policy also has implications for inflation and wages are rising above normal. However, with respect to the pace of further rate hikes, Lane indicated that, even as further steps are necessary, the case for a next 75 bps step has become less strong after the tightening the central bank has already done earlier this year. He didn’t give clear hint on the peak cycle rate.
News Headlines
Swedish home prices plunged by 3% m/m in October, Sweden’s Valueguard housing index revealed today. The drop increases the peak-to-trough decline to 14%, bringing it already close to the Riksbank’s expected 18%. One of Europe’s hottest housing markets is now in the worst rout since the 1990s amid soaring inflation and mammoth rate hikes by the Riksbank to counter it. At its meeting in September, the central bank raised the policy rate by 100 bps to 1.75%. It is expected to deliver another 75 bps move later this week. Sweden’s housing market and indebted households have long been a concern for regulators and the Riksbank. The issue is increasingly acute with declining house prices combined with rising – and often variable – mortgage rates impacting consumer balance sheets and spending. It may prompt the Riksbank to shift to a lower tightening gear after Thursday. EUR/SEK tested the 11 big figure today but is currently trading just south of that level.
Czech National Bank deputy governor Mora said inflation may accelerate slightly again after having printed a sharp decline to 15.1% y/y – thanks to government energy subsidies. He does expect price growth to be near its peak and to slow dramatically next year. Mora added that he wanted to lift rates at the previous meeting by 75 bps to bring inflation back to 2% as quickly as possible, even if it comes with a recession. But he found no majority support. The CNB deputy governor does not expect interest rates will rise at his final two meetings in December and February. EUR/CZK depreciates marginally today from an intraday high around 24.40 to 24.34 currently.
Crude Oil Inclined Down
The crude oil market began the week with a crash. A Brent barrel is falling to 86.75 USD and looks very week.
Curiously, nothing has changed on the hews horizon.
On the one hand, the market is reacting negatively to the news about the coronavirus spreading in China. The country remains the main importer of crude oil. Any COVID-19 bound limitations might shorten the industrial demand for energy carriers. On the other hand, investors are caring for the comments of the US Federal Reserve System about further interest rate strategy.
Moreover, information has spread about a surplus of crude oil at European oil plants.
All this taken together is dragging the barrel price down.
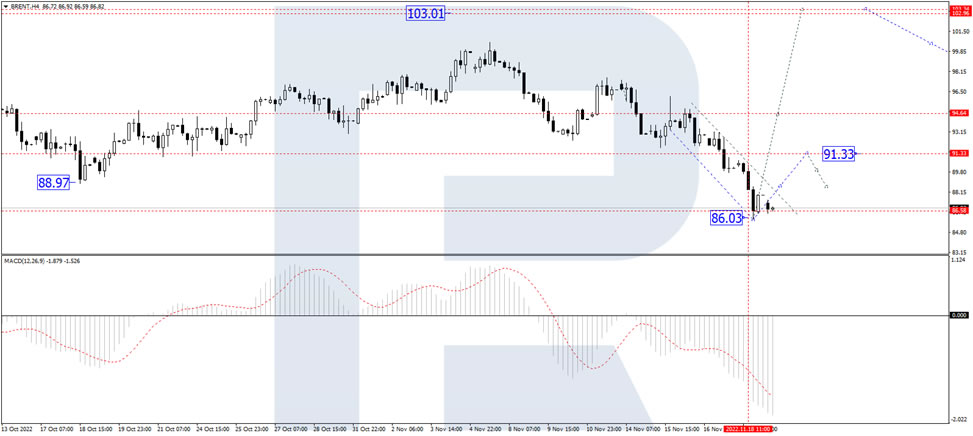
On H4, Brent corrected to 86.00 and started developing a consolidation range. At the moment, the quotes performed and corrected an impulse of growth. Practically, they have set the borders of the range. With an escape upwards, a new wave of growth to 94.75 may start. The goal is first. Technically, the scenario is confirmed by the MACD. Its signal line is at the lows, getting ready to start growing to zero.
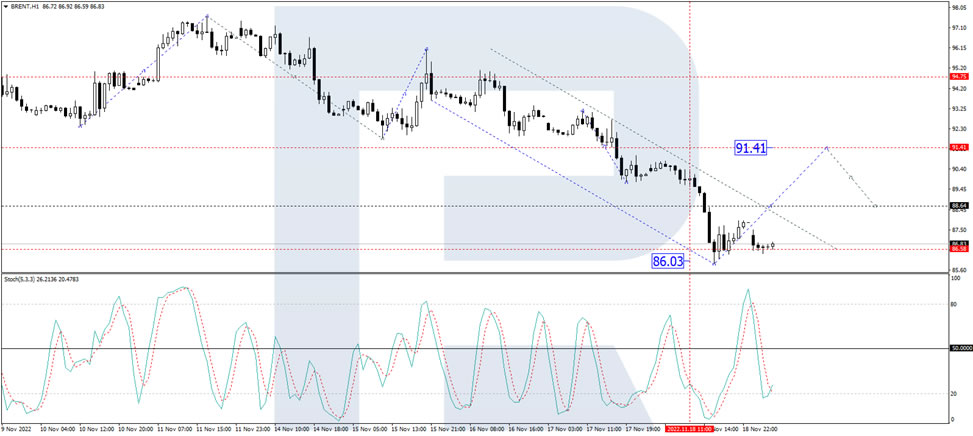
On H1, with a breakaway of 91.41, oil declined and extended the wave to 86.00. At the moment, the market completed an impulse of growth to 87.90 and a correction to 86.55. Another wave of growth is going to develop to 88.66. With a breakaway of this level upwards, a pathway to 91.41 should open. Technically, this scenario is confirmed by the Stochastic oscillator. Its signal line is under 50, aiming strictly upwards. Growth of the indicator to 80 is expected.
WTI oil to break through 76.6 support as Saudi Arabia considers production increase
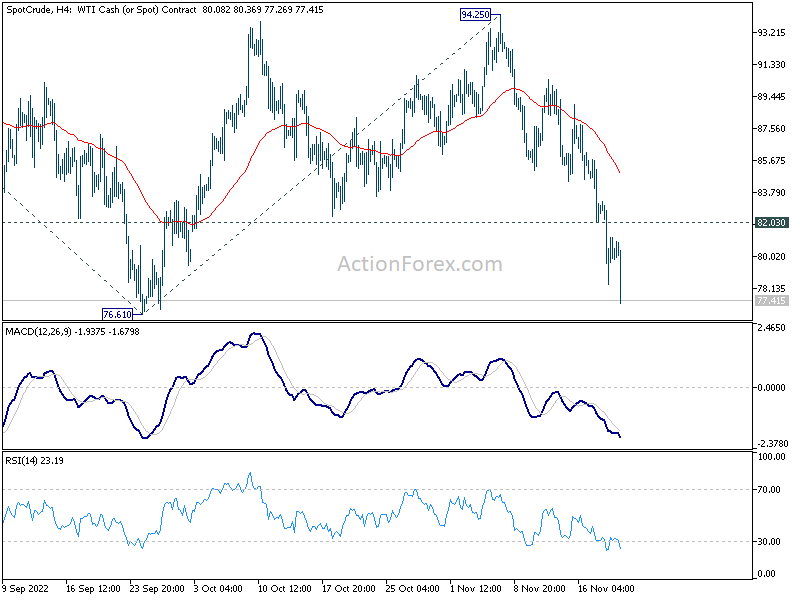
Oil prices tumble again today on news that Saudi Arabia is eyeing OPEC+ production increase, partially reversing the group's decision to cut supplies last month.
WSJ reports that OPEC is now in discussion of an increase of up to 500k barrels a day, for December 4 meeting. The move would come just a day before EU imposes an embargo on Russian oil, while G7 will launch a price cap.
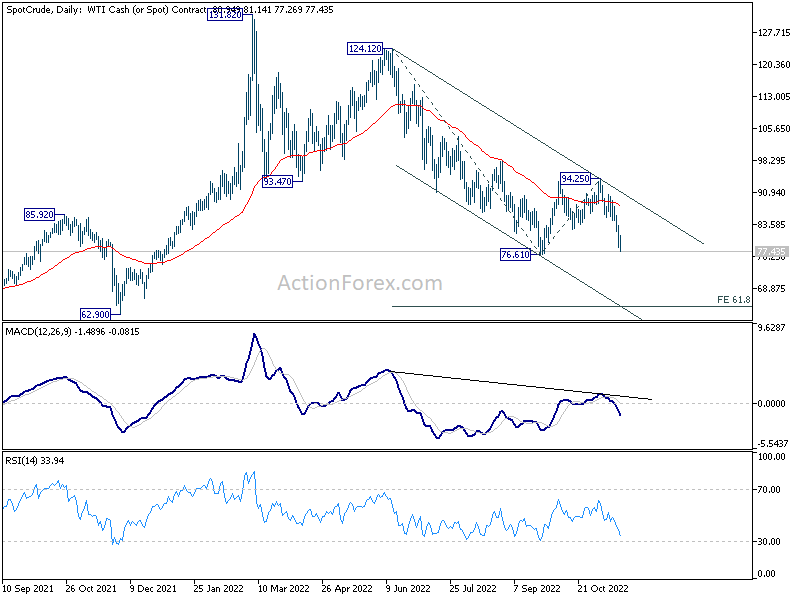
Technically, WTI is now on track to retest 76.61 low. Decisive break there will resume larger down trend. Next target will be 61.8% projection of 124.12 to 76.61 from 94.25 at 64.88. Meanwhile, break of 82.03 minor resistance will delay the bearish case and bring recovery first.
Will Fed Minutes Shed Light on Rates’ Coming Path?
Despite the latest efforts by several Fed officials to douse market speculation with regards to an imminent pivot, investors are still pricing in almost two quarter-point rate cuts by the end of 2023. With that in mind, they may dig into the minutes of the latest FOMC gathering for clues as to what policymakers discussed with regards to next year’s policy plans. The minutes will be released on Wednesday at 19:00 GMT, but beforehand, market participants may have the opportunity to adjust their positions based on the results of the preliminary Purchasing Managers’ Indices by S&P Global, due out at 14:45 GMT.
Market scales back hike bets after inflation slowdown
At the November gathering, Fed officials delivered their fourth consecutive 75bps rate hike, hinting that smaller rate increments may be on the cards for the months to come. That said, at the press conference, Fed Chair Jerome Powell said that it is very premature to be thinking about pausing, adding that the terminal level of interest rates may be higher than previously estimated. The outcome kept investors evenly split between 50 and 75 basis points with regards to the size of the December hike, but allowed them to lift their terminal rate to near 5.15%.
Nonetheless, the picture was altered again just after the US inflation data for October revealed a bigger than expected slowdown, almost fully convincing market participants that the size of the next rate increment will be 50bps. Currently, they are assigning an 80% probability for such a move, with the remaining 20% pointing to 75bps. They are also pricing in nearly two quarter-point rate cuts by the end of next year, despite several policymakers trying to push against bets of an imminent pivot.
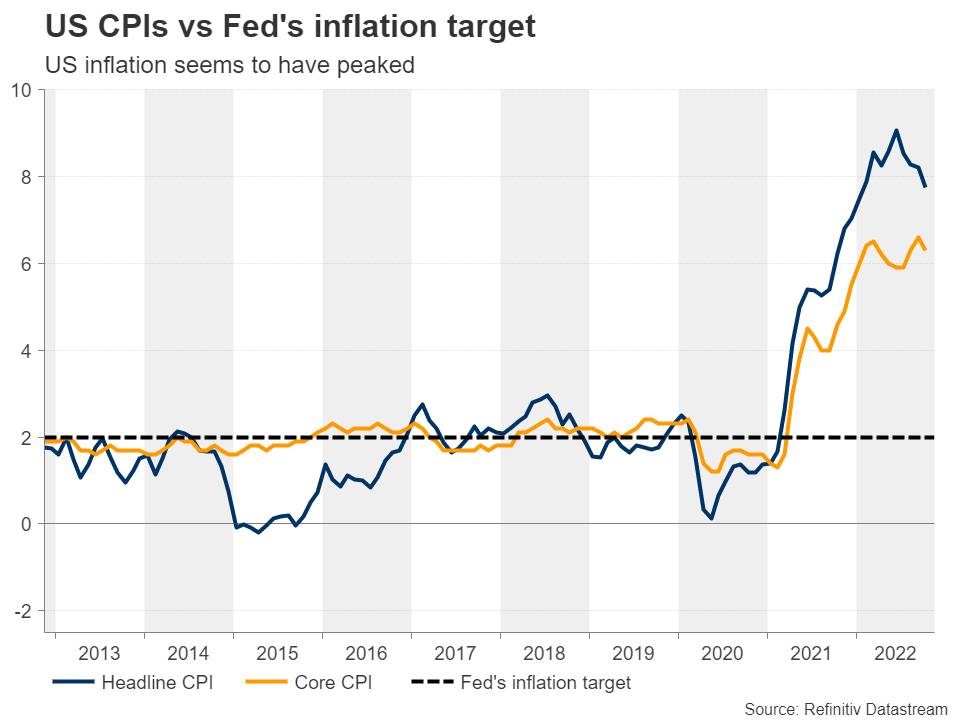
Looking for hints on future course of action
Therefore, although the minutes could be considered as outdated given that they will reflect officials’ opinions before the inflation data was out, investors may still be interested in any conversation with regards to interest rates’ future course. After the latest gathering, several policymakers have clearly suggested that when interest rates hit their terminal level, they will stay there for some time. However, any hints in the minutes pointing to even the thought of a cut towards the end of 2023 could enhance speculation on that front, as such discussion would have taken place prior to the CPI data, meaning that if some of them thought about it then, the discussion may be more intense at the upcoming meeting. Something like that could hurt the dollar and encourage some stock buying.
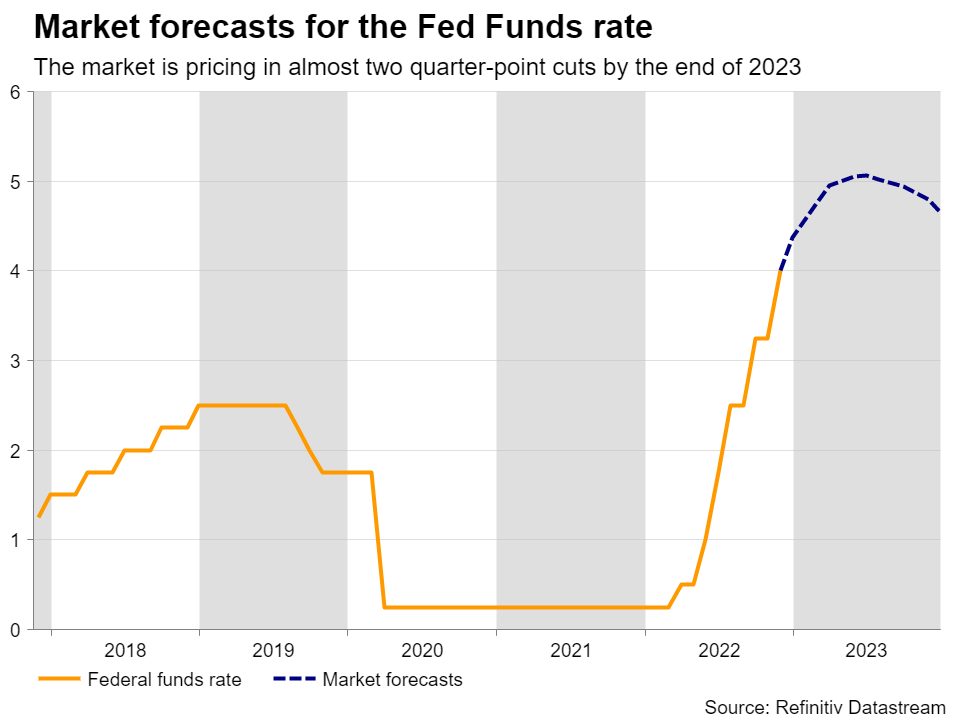
On the other hand, anything strengthening the narrative of a higher terminal rate and a prolonged pause before they start considering a cut could have the opposite effect, especially if investors keep in mind the latest rebound in the 1-year inflation expectations. Treasury yields could drift higher, adding some fuel to the dollar’s engines, while Wall Street may come under some selling interest a day ahead of Thanksgiving Day.
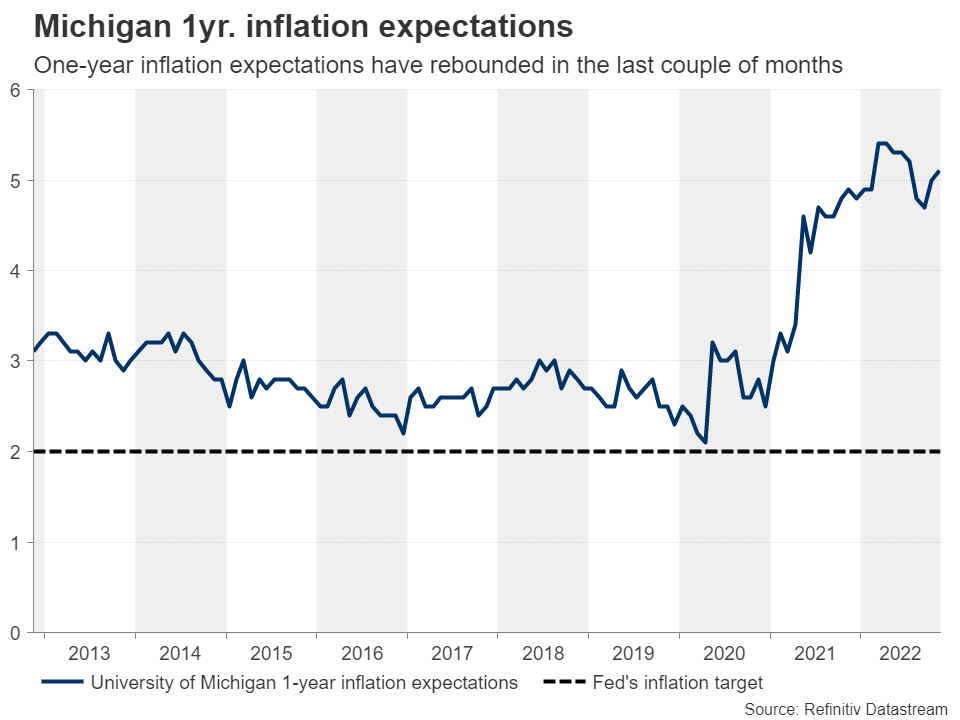
However, market participants may have the opportunity to act on more up-to-date information before the minutes are released, as due to the holiday-shortened week, Wednesday will end up being a data-dump day for the US. Among the releases are the initial jobless claims for last week, the preliminary University of Michigan consumer sentiment index for November, which will be accompanied with updated 1- and 5-year inflation expectations, the new home sales for October, which are expected to have slid again, and the flash S&P Global PMIs for November. The services index, already within contractionary territory, is expected to have ticked down, and the manufacturing print is forecast to have just crossed below the boom-or-bust zone of 50. Such numbers may add to worries about a recession and perhaps result in the liquidation of some more long dollar positions ahead of the minutes.
Dollar stays in corrective mood despite latest rebound
Euro/dollar has come under selling interest from near the 200-day exponential moving average following the latest attempts of some Fed officials to push against expectations of a pivot, but it remained above the 1.0200 zone, marked by the inside swing high of September 12, and well above the upside support line drawn from the low of September 28. This keeps the likelihood of a rebound well on the table.
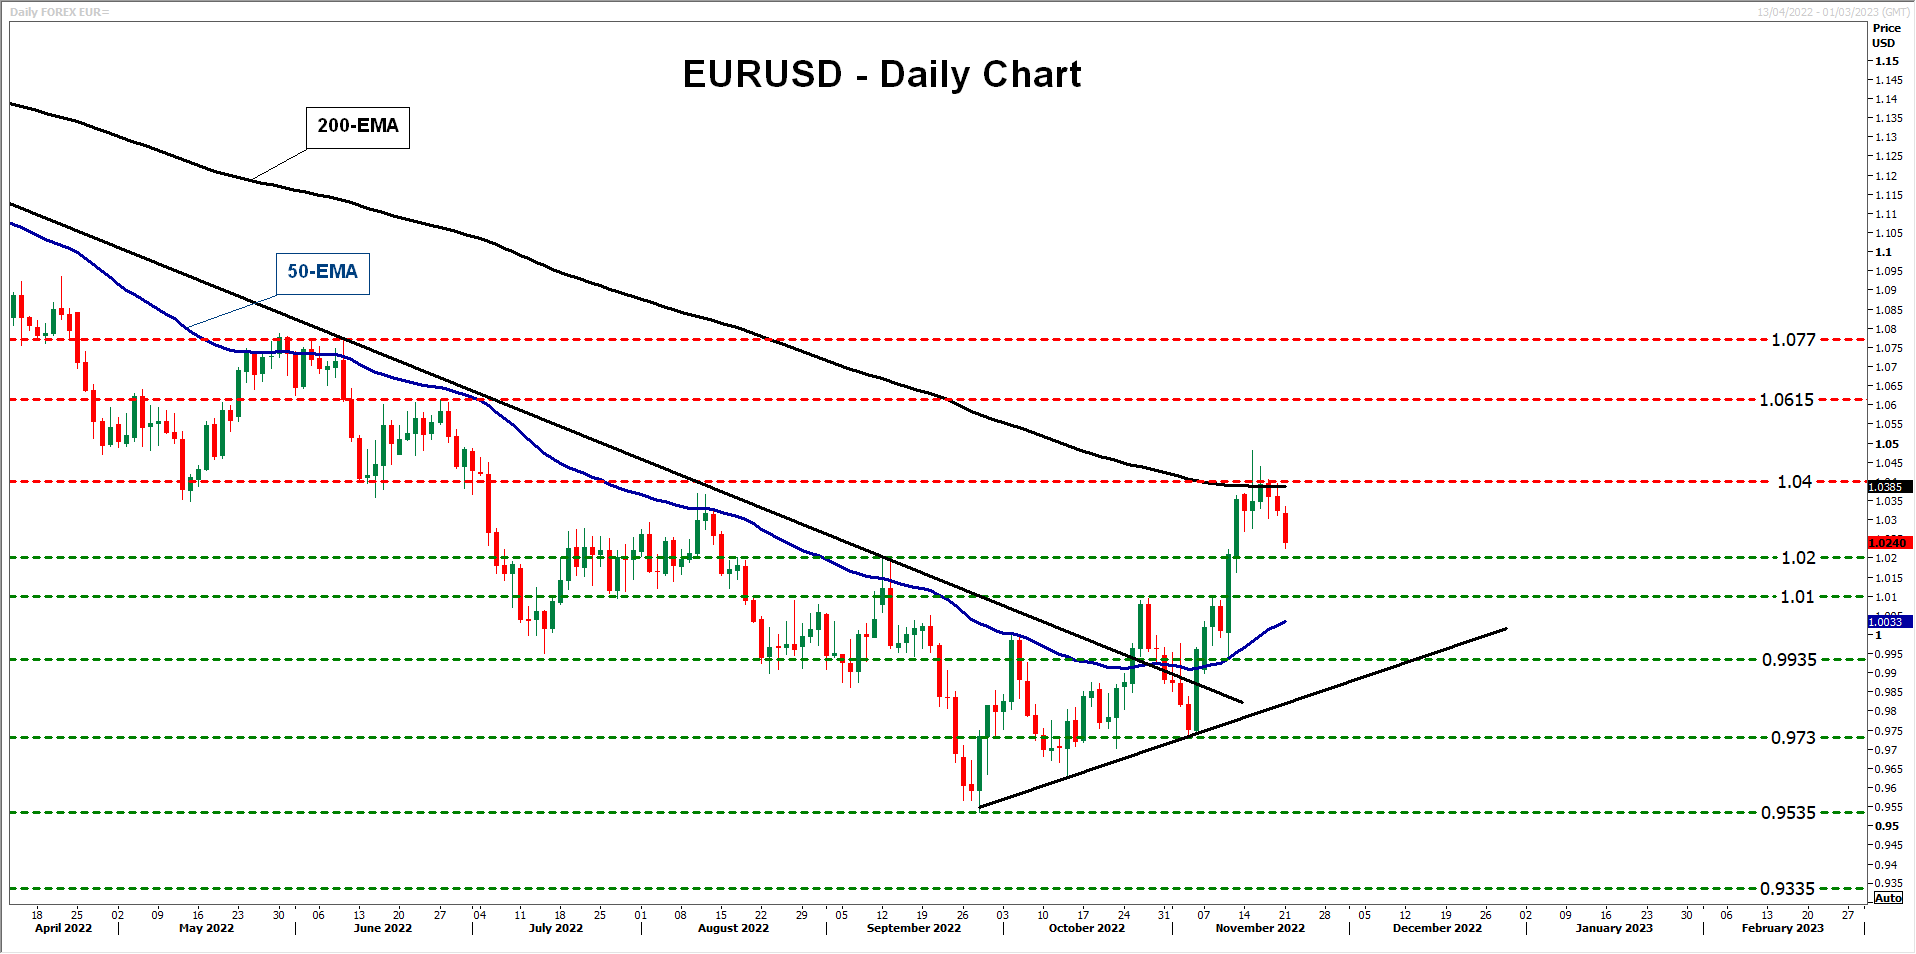
Even if the price drops below 1.0200, the bulls could take charge from near the 1.0100 zone and aim for another test near the 1.0400 area and the 200-day EMA. Should they manage to overcome that hurdle, they may extend their advance towards the 1.0615 territory, defined as resistance by the high of June 27.
On the downside, a break below 0.9730 may be the move that would signal the resumption of the prior downtrend. The bears may get encouraged to dive towards the low of September 28 at 0.9535, the break of which would take them into territories last seen in 2002. The next territory to consider as support may be at around 0.9335, marked by the low of June 6 of that year.
Aussie Extends Slide
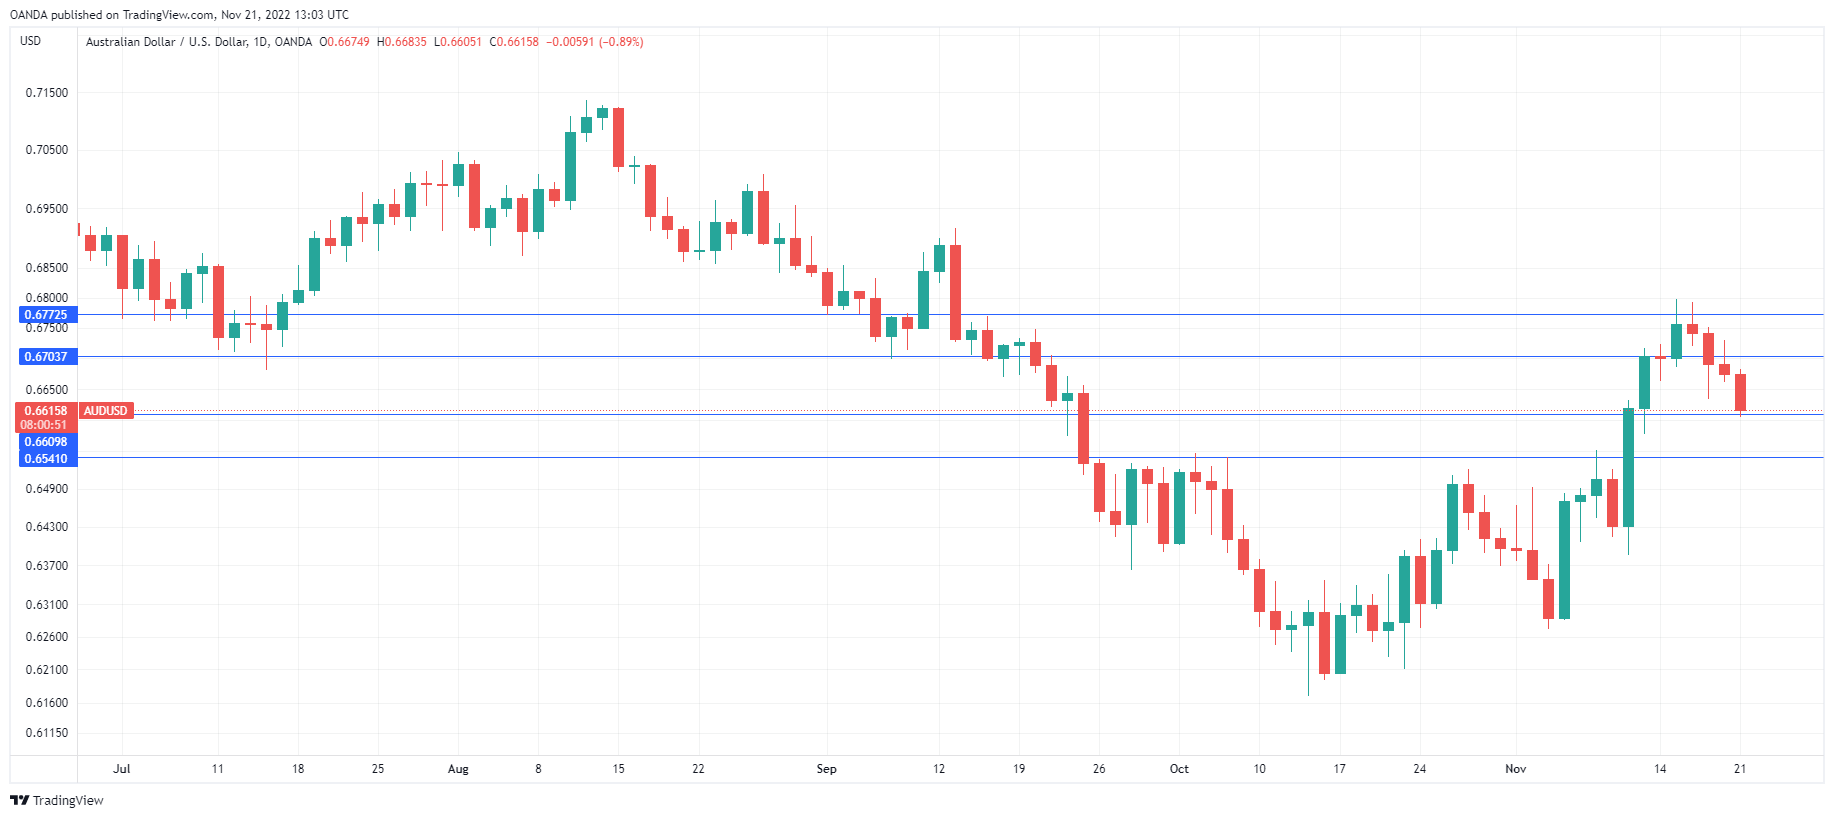
The Australian dollar has posted losses over three straight days and is sharply lower on Monday. In the North American session, AUD/USD is trading at 0.6610, down 0.96%.
RBA shifts gears
The Reserve Bank of Australia has changed course and eased up the pace of hikes, but with inflation still accelerating, is it too soon? After a string of 50-bp increases, the RBA has slowed down and delivered two straight hikes of 25 bp. The RBA was the first major central bank to make the shift, and the Federal Reserve is widely expected to ease to a 50-bp increase at the December meeting.
The thinking behind smaller rate hikes is it will cause less of a shock to the economy and ease the pain that households and businesses are going through as rates go up and up. At the same time, the RBA has circled inflation as public enemy number one, and it will have to keep hiking until it detects a peak in inflation. The RBA may be easing up on the pace of rates, but Governor Lowe is using the jawbone tactic to dampen any expectations that the central bank is winding up its tightening.
To this end, Lowe has warned that the bank would not hesitate to return to oversize rate hikes if needed. The RBA is keeping a close eye on wage growth, which jumped to a nine-year high in Q3, gaining 3.1%. The RBA is wary of the spectre of a wage-price spiral if wages continue to accelerate, which would greatly complicate its efforts to curb inflation.
The steady stream of hawkish statements from Fed members has chilled risk appetite and dashed hopes of a Fed U-turn on rate policy. The US dollar has bounced back after taking a beating following the inflation report earlier this month. The Fed has long insisted that one or two reports showing weaker inflation does not make a trend, although risk sentiment has nonetheless when inflation drops. If November’s inflation data is lower than anticipated, we can expect risk appetite to rise again, at the expense of the US dollar. The markets have priced in a 50-bp hike next month, although some Fed members have stated that a 75-bp move remains on the table.
AUD/USD Technical
- AUD/USD is testing support at 0.6609. Below, there is support at 0.6541
- There is resistance at 0.6704 and 0.6772
Sharp Drop on USD/CHF Can Be Positive for Gold
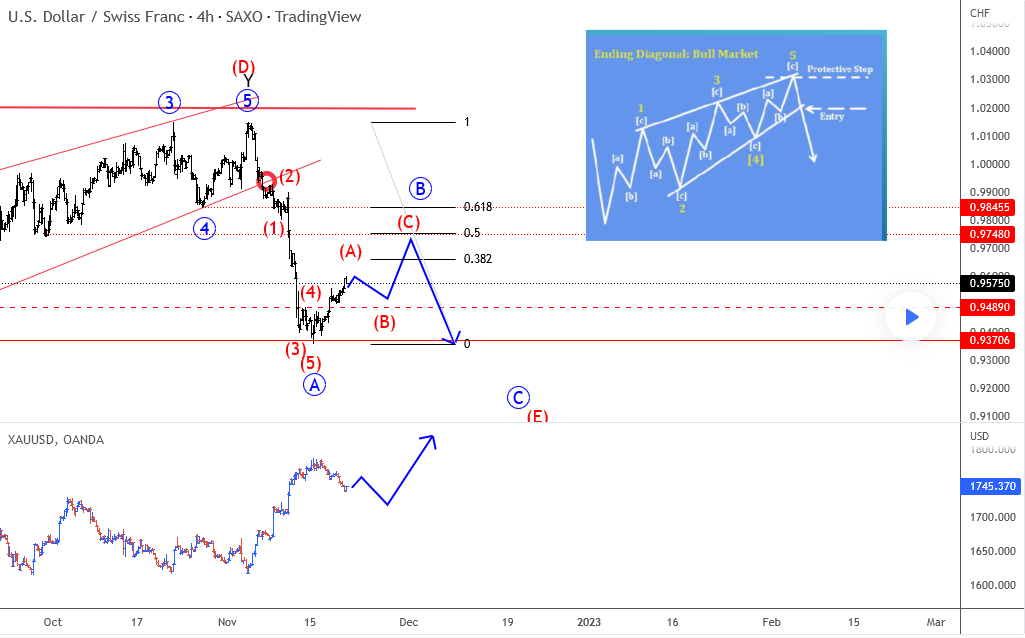
An ending diagonal is a special type of pattern that occurs at the end of the trend. Normally it causes a sharp reversal as it happened recently on USDCHF . The question is where we go from here? Well, we have five waves down on Swissy which means more downside is possible after a three waves up. And if that would be the case then Gold can rally further based on strong correlation between CHF and GOLD .
https://www.youtube.com/watch?v=Bego0F-qMjA