Sample Category Title
Bitcoin Tests the Strength of Support
Market picture
Bitcoin has lost 4% in the past 24 hours, once again testing the strength of the $16K area. Ethereum is down 7.8% overnight to $1120. Other leading altcoins in the top 10 were down 5.5% (BNB) to 10.6% (Dogecoin).
Total cryptocurrency market capitalisation, according to CoinMarketCap, sank to $795bn, losing 4.9% overnight and 5.6% for the week. The cryptocurrency fear and greed index is down to 21 points by Monday versus 24 just over a week ago.
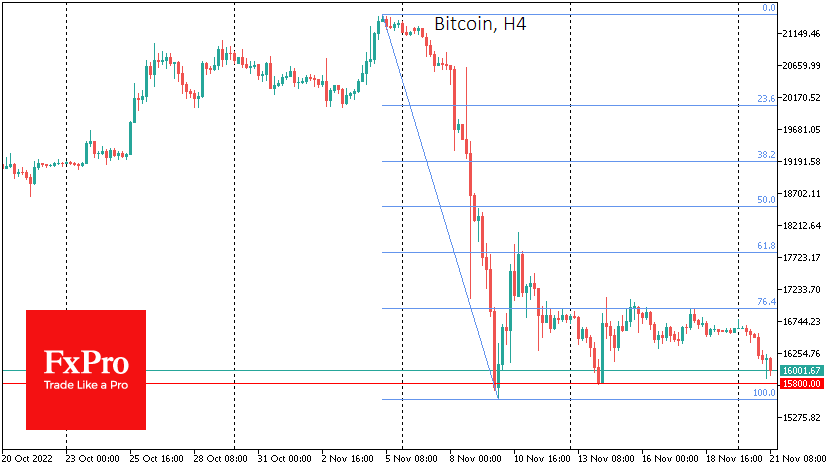
Bitcoin failed to develop a rebound last week, facing an intensified sell-off near $17K and about 23.6% of the move down from 5 to 10 November. Such a weak rebound indicates solid bearish pressure, forcing us to expect another move towards the lower boundary at $15.8K. A consolidation below that level could start a new downside wave with a potential target of $12K. However, this is a very distant target, while round levels of $15K and $14K could be the intermediate ones.
News background
Bitcoin’s mining difficulty continues to increase, rewriting an all-time high. The falling price has resulted in the first cryptocurrency being mined at a loss on average. The falling price and high interest rates make us expect miner activity to drop and a subsequent decrease in difficulty. However, there could likely be a brief struggle for market share amongst miners: with bankruptcies and takeovers. This will be interesting.
According to the Nansen report, the collapse of FTX was directly linked to Terra’s failure in May. The unrealised loss of the “average” long-term bitcoin investor reached 33%, according to Glassnode’s calculations.
The impact of the FTX collapse will still be evident for the foreseeable future, according to a statement to investors from venture capital firm Multicoin Capital. Many players will cease to exist, putting pressure on the liquidity of the crypto market.
Some major crypto exchanges have suspended accepting deposits and withdrawals in Stablecoins, which are hosted on the Solana blockchain. The decision was made due to Solana’s association with the collapsed FTX exchange, which used the blockchain’s power.
The Australian unit of consultancy firm KPMG has said that meta-universes have the real potential to change many areas of life. In doing so, large companies will contribute to the technology’s adoption.
EURUSD Retraces Lower as 200-day SMA Rejects Advance
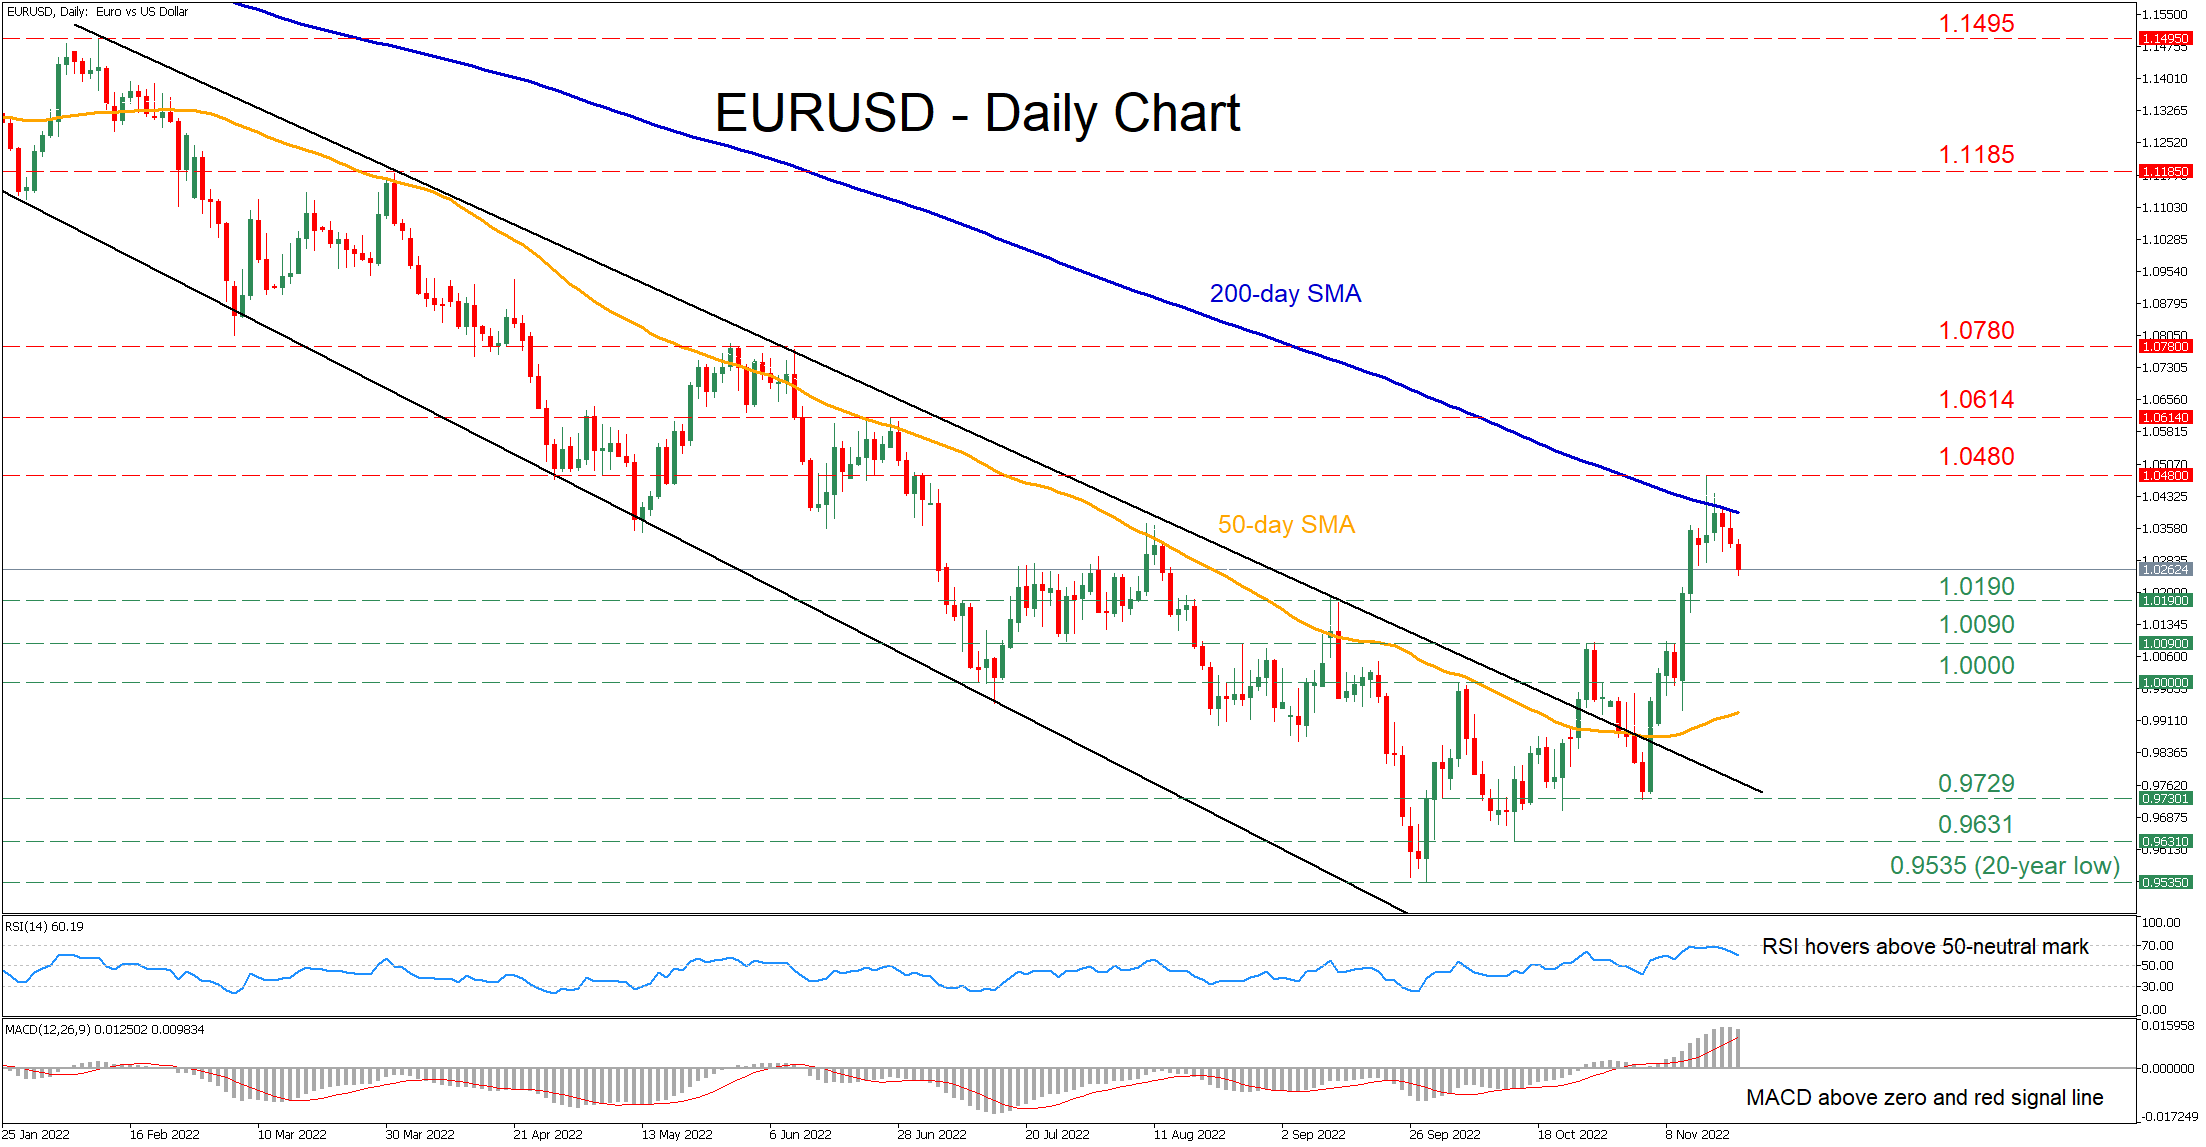
EURUSD has been attempting a rebound in the short term after escaping its descending channel to the upside. However, in the past few daily sessions, the advance has paused as the price has been constantly held down by the 200-day simple moving average (SMA).
The short-term oscillators currently suggest that bullish forces are waning but remain in control. Specifically, the RSI is pointing downwards above its 50-neutral mark, while the MACD histogram is softening above both zero and its red signal line.
Should selling pressures intensify further, the September high of 1.0190 could act as the first line of defence. Sliding beneath that floor, the spotlight could turn to 1.0090 before the crucial parity region comes under examination. Failing to halt there, the price may then test the November low of 0.9729.
To the upside, if bullish forces re-emerge and push the price above the 200-day SMA, initial resistance might be encountered at the recent high of 1.048. Conquering this barricade, the bulls could then aim at the June resistance of 1.0614. Even higher, the 1.0780 hurdle could prove a tough one for the price to overcome.
Overall, EURUSD appears to be experiencing a minor pullback after the 200-day SMA capped its upside. Therefore, breaking above the latter could signal the resumption of the pair’s short-term uptrend.
EURUSD: Bull-Trap and Risk Aversion Boost Fresh Bears
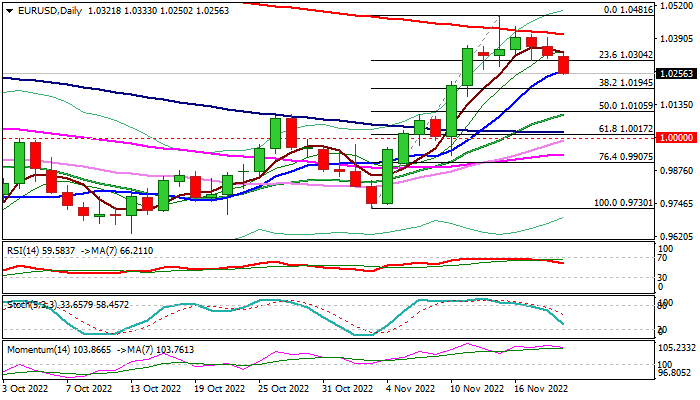
The Euro holds in red for the third straight day, deflated by fresh risk aversion, with early Monday’s acceleration lower, pushing the price to the lowest since Nov 11.
bears broke initial Fibo support at 1.0304 (23.6% of 0.9730/1.0481) and cracked ascending 10DMA (1.0266), generating further bearish signals.
Reversal pattern is forming on weekly chart, though more evidence is still needed for confirmation, with near-term action being weighed by a bull-trap on daily chart, following repeated rejections above falling 200DMA.
Sustained break of 10DMA would further weaken near-term structure, but extension below pivotal Fibo support at 1.0194 (Fibo 38.2%) is needed to accelerate reversal and expose key supports at 1.0023/1.0000 zone (100DMA / Fibo 61.8% / parity).
Fading bullish momentum on daily chart, add to negative signals, with near-term action expected to remain biased lower while holding below falling 200DMA (1.0407).
Res: 1.0304; 1.0336; 1.0407; 1.0481.
Sup: 1.0194; 1.0163; 1.0090; 1.0023.
RBNZ Might Need to Slam the Brakes in November as Economy Heats Up
The Reserve Bank of New Zealand will hold its last policy meeting of the year on Wednesday (01:00 GMT) and another rate hike is on the cards. After five consecutive 50-basis-point rate increases, policymakers will be pondering an even larger move in December, as, far from the economy cooling, inflationary pressures are at risk of boiling over. With the US dollar under strain from speculation about the Federal Reserve pivoting in the opposite direction, the New Zealand dollar could enjoy a substantial boost should there be a hawkish surprise.
Too hot
Throughout this global tightening cycle, the RBNZ has been at the forefront of the race to raise borrowing costs. However, whilst some sectors of the economy, such as housing, have started to feel the weight of the multiple rate hikes, things are heating up on other fronts.
The labour market in particular has yet to respond to the official cash rate being at the highest in more than seven years. The unemployment rate – at 3.3% – is the lowest in decades thanks to ongoing labour shortages that have pushed up wage growth to the highest on record. Additionally, after a poor second quarter, consumer spending has picked up again in recent months.
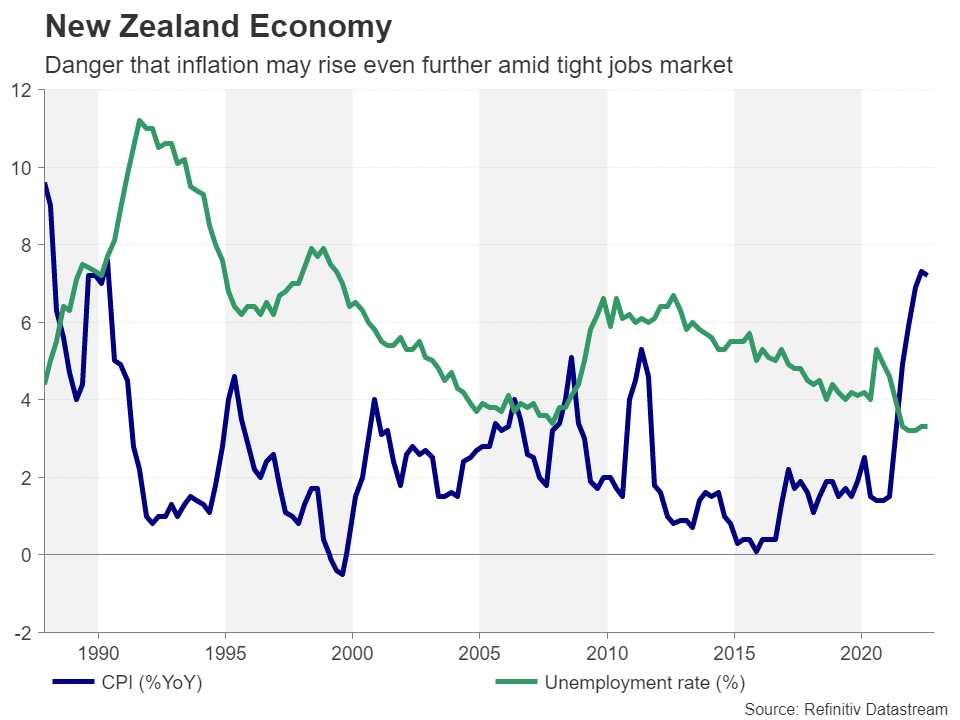
More importantly, inflation in the third quarter was considerably hotter than expected, with the annual rate of CPI easing only marginally to 7.2% - well above the RBNZ’s target band of 1-3%. But the worries about simmering inflationary pressures don’t stop there. Inflation expectations according to the RBNZ’s own survey have started to creep up again, likely raising alarm bells within the Monetary Policy Committee.
Time to join the triple hike club?
All this has led investors to price in higher odds of a 75-bps increase in November versus a 50-bps one, assigning a probability of about 60%. Looking at the RBNZ’s last set of economic projections from August, a 75-bps increment seems unlikely as the cash rate was seen peaking slightly above 4%. Raising by 75 bps would immediately take rates above this terminal level to 4.25%. It would also involve quite a significant revision to overall forecasts in the updated quarterly Monetary Policy Statement due to be published the same day.
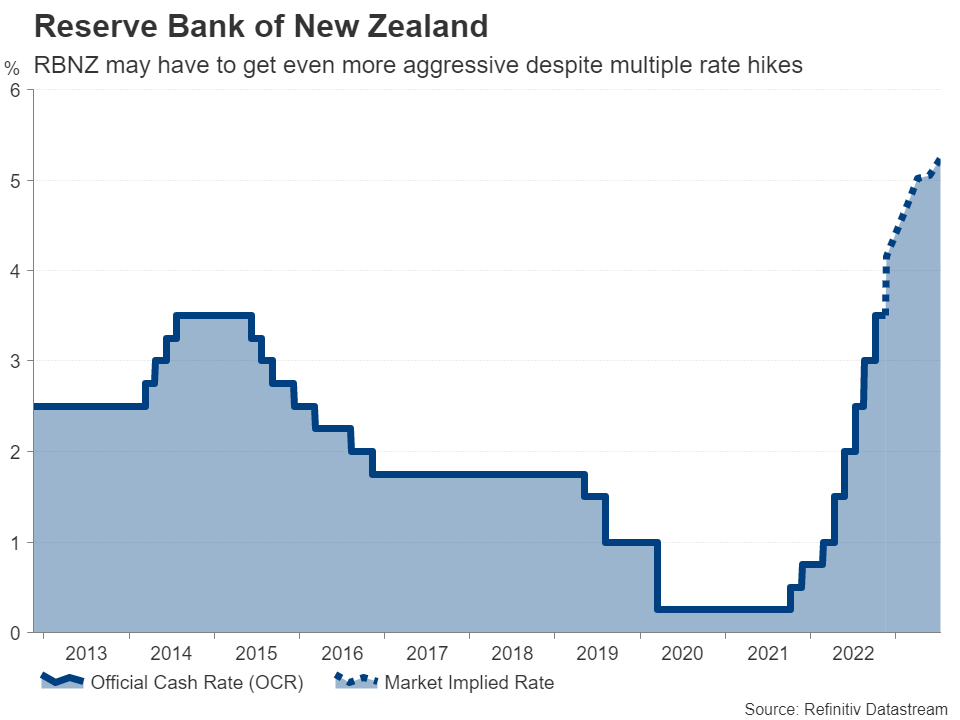
The RBNZ might not be comfortable taking such a big leap in one go, especially as it wasn’t that long ago when Governor Adrian Orr was describing the tightening cycle as “very mature” to signal that there aren’t many rate hikes left to go. Having said that, the October meeting minutes did reveal that the decision was between 50 and 75 bps. Furthermore, the next meeting after this isn’t until February 2023, so policymakers might not want to risk playing it safe when the data picture has altered so dramatically.
A hawkish boost for the kiwi
Either way, the projection of the terminal rate looks set to be revised higher, and even if there is only a ‘smaller’ hike of 50 bps, it would almost certainly be accompanied by a hawkish statement. Hence, there is scope for the New Zealand dollar to extend its recent gains, which for now, appear to have stalled just below the $0.6200 level.
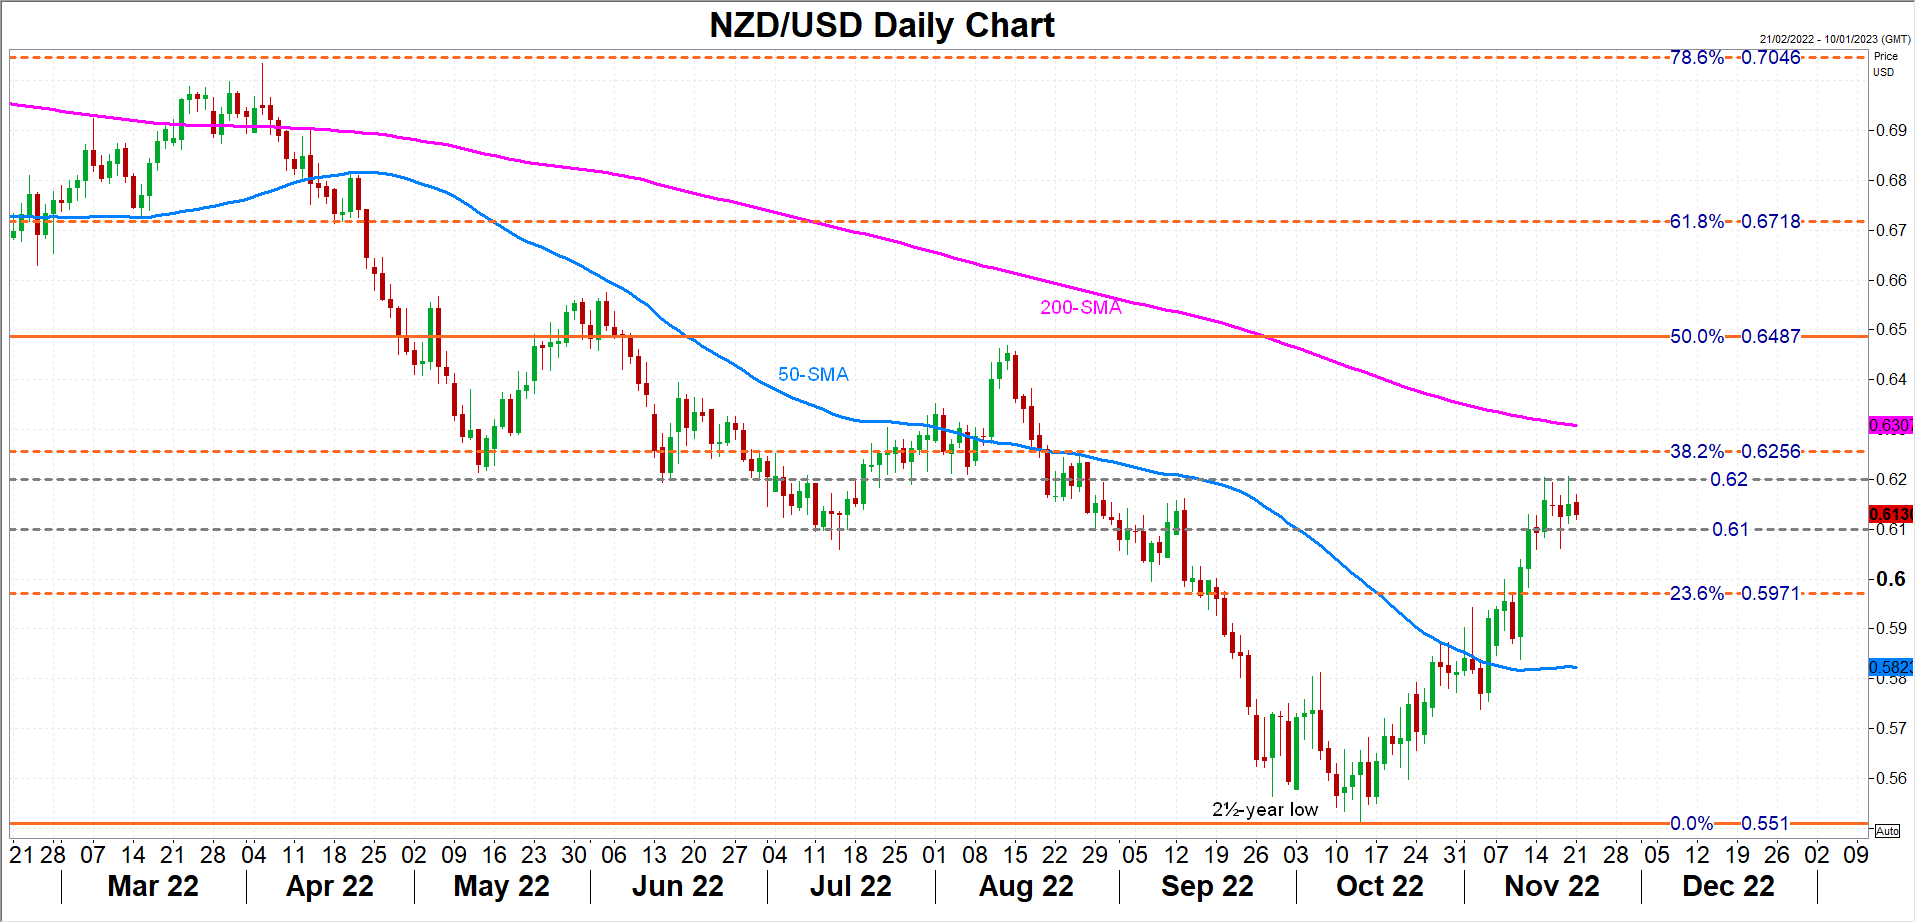
Given that a 75-bps increase isn’t fully priced in, the kiwi could overtake the 38.2% Fibonacci retracement of the 2021-2022 downtrend to meet its 200-day moving average (MA) slightly above $0.6300 in the event of such an announcement. But further gains, specifically towards the August highs and the 50% Fibonacci of $0.6487, would depend on how high the Bank sees the adjusted terminal rate to be.
However, this is also what could trigger a selloff. Should the RBNZ predict the cash rate peaking below the market implied terminal rate of around 5%, the kiwi could be knocked all the way down to the 50-day MA at $0.5823.
It’s worth keeping in mind, though, that now that the US dollar appears to have potentially topped out, the upside swings could well be greater than the downside ones.
Dollar Index: Dollar Regains Traction on Fresh Safe-haven Buying
The dollar index extends acceleration from last Friday and hits one-week high in early Monday, lifted by renewed risk aversion.
Traders move into safety on fresh rise in new Covid cases in China, which prompted tighter restrictions, with capital Beijing most populous districts being hit the most.
China’s zero-Covid tolerance policy drives the volatility higher in such situation, as tough restrictions impact economic activity and markets await signals whether the government will start easing its policy soon.
Fresh safe-haven buying lifted the dollar index, signaling fresh direction after the price was in sideways mode last week, consolidating recent strong fall.
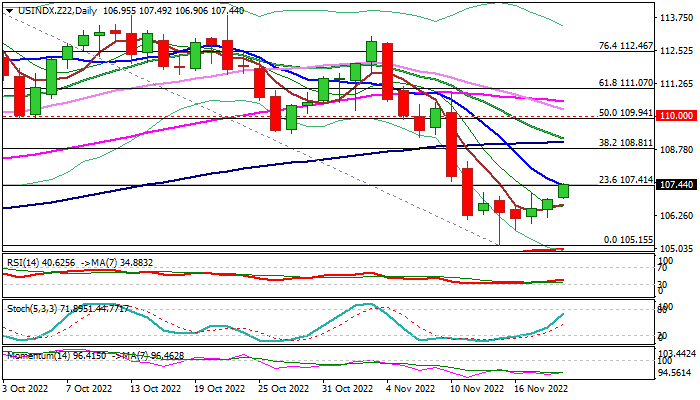
Initial reversal signals are developing on daily chart as fresh gains cracked first pivot at 107.41 (Fibo 23.6% of 114.72/105.15 fall, reinforced by 10DMA), with sustained break here to firm near-term structure and expose next important barriers at 108.81/109.05 (Fibo 38.2% / 100DMA).
North-heading daily indicators support the action, though momentum is still deeply in the negative territory, but weekly bear-trap under Fibo 61.8% of 101.29/114.72) underpins the action.
Recovery needs lift through 109 zone and violation of the base of thick daily cloud (109.61) to confirm reversal signal and open way for further recovery.
Otherwise, recovery will remain fragile and at risk of stall that would signal better opportunities to re-enter larger downtrend off Sep 29 peak (114.72).
Res: 108.30; 108.81; 109.05; 109.61.
Sup: 107.90; 106.68; 105.70; 105.15.
SPX (S&P500) Elliott Wave View : Forecasting The Path
Hello fellow traders. In this article we’re going to take a quick look at the Elliott Wave charts of SPX ( S&P500) , published in members area of the website. As our members know SPX is showing higher high sequences in the short term cycle from the October 13th low. The index is looking for another push up toward 4080.4+ area ideally. Recovery looks incomplete and we expect to see more short term strength. Recently SPX made a short term pull back that has reached its target area and found buyers as expected. In the further text we are going to explain the Elliott Wave Forecast.
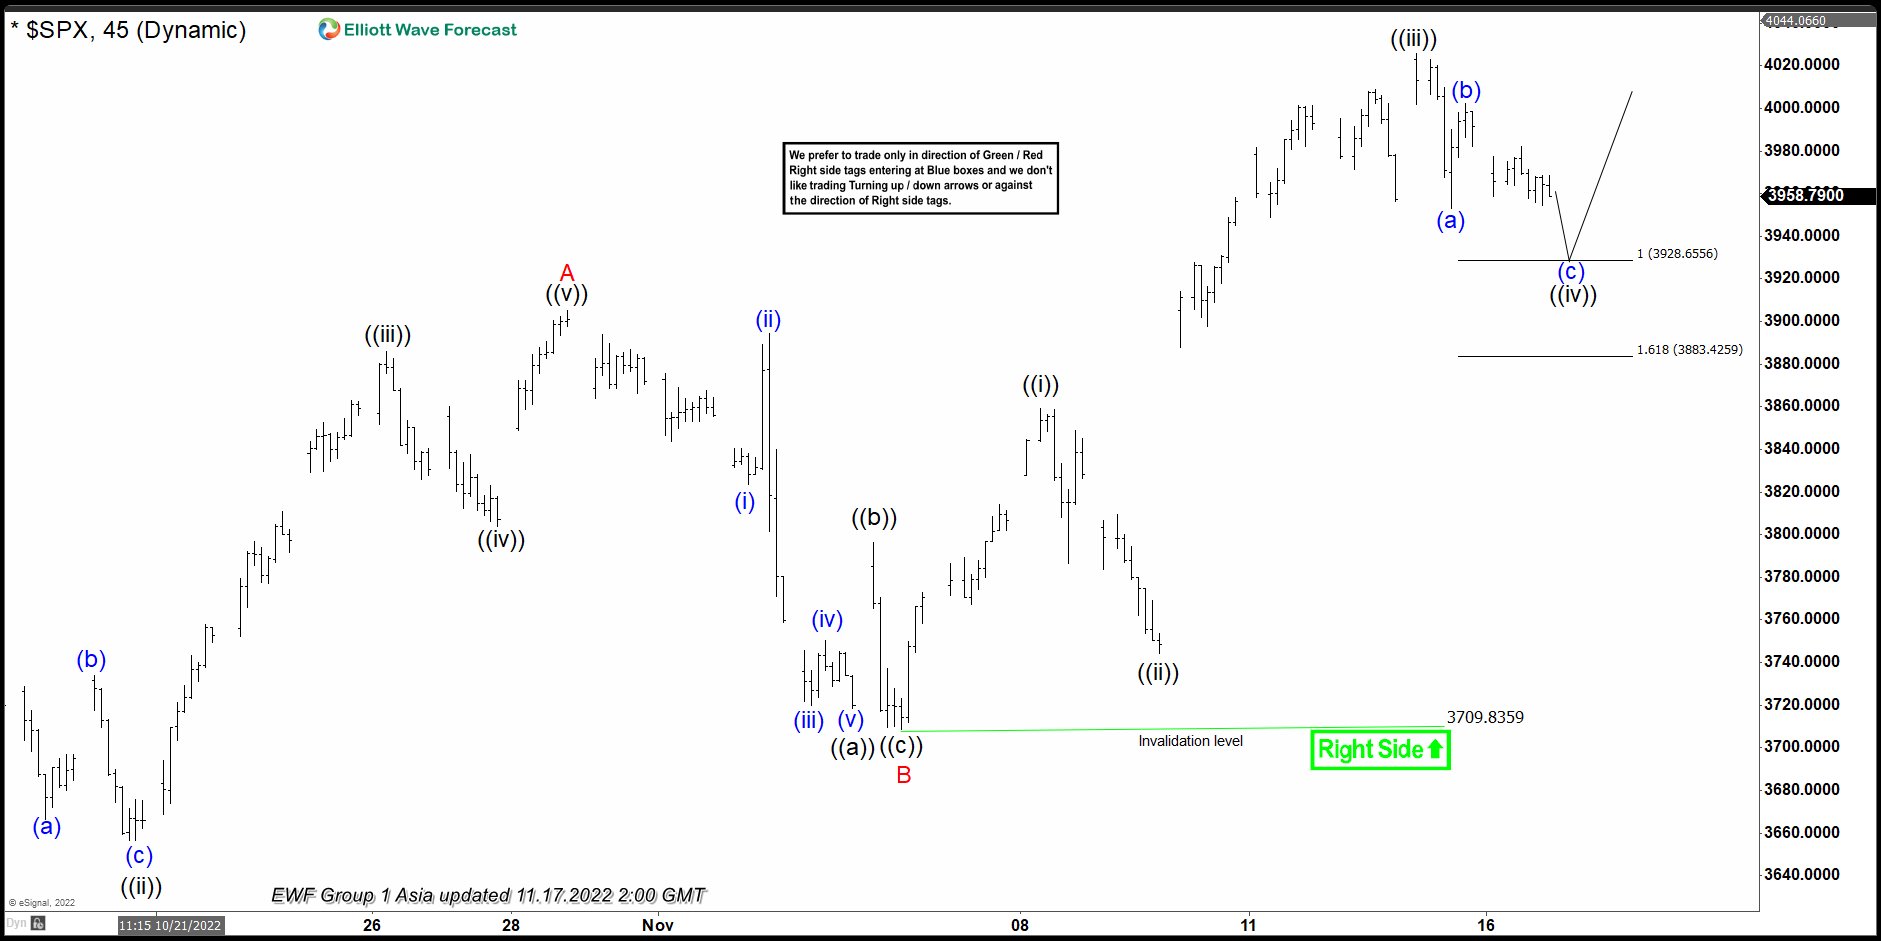
SPX Elliott Wave 1 Hour Chart 11.17.2022
SPX is proposed to be doing Elliott Wave Zig Zag pattern within the cycle from the October 13th Low. Structure is still incomplete. SPX has not reached extremes from the 10.13. low. Besides that , we got only 3 waves up in the cycle from the 3709.8 low which suggests another wave up is still missing. So, current view suggests wave C red is still in progress when we are now in ((iv)) of C. Once current short term pull back completes we expect to see another push up toward 4080.4 area .We expect to see more downside in near term toward 3928.6-3883.4 area. Buyers should ideally appear at the marked zone for the further rally toward new high ideally or for a 3 waves bounce at least.
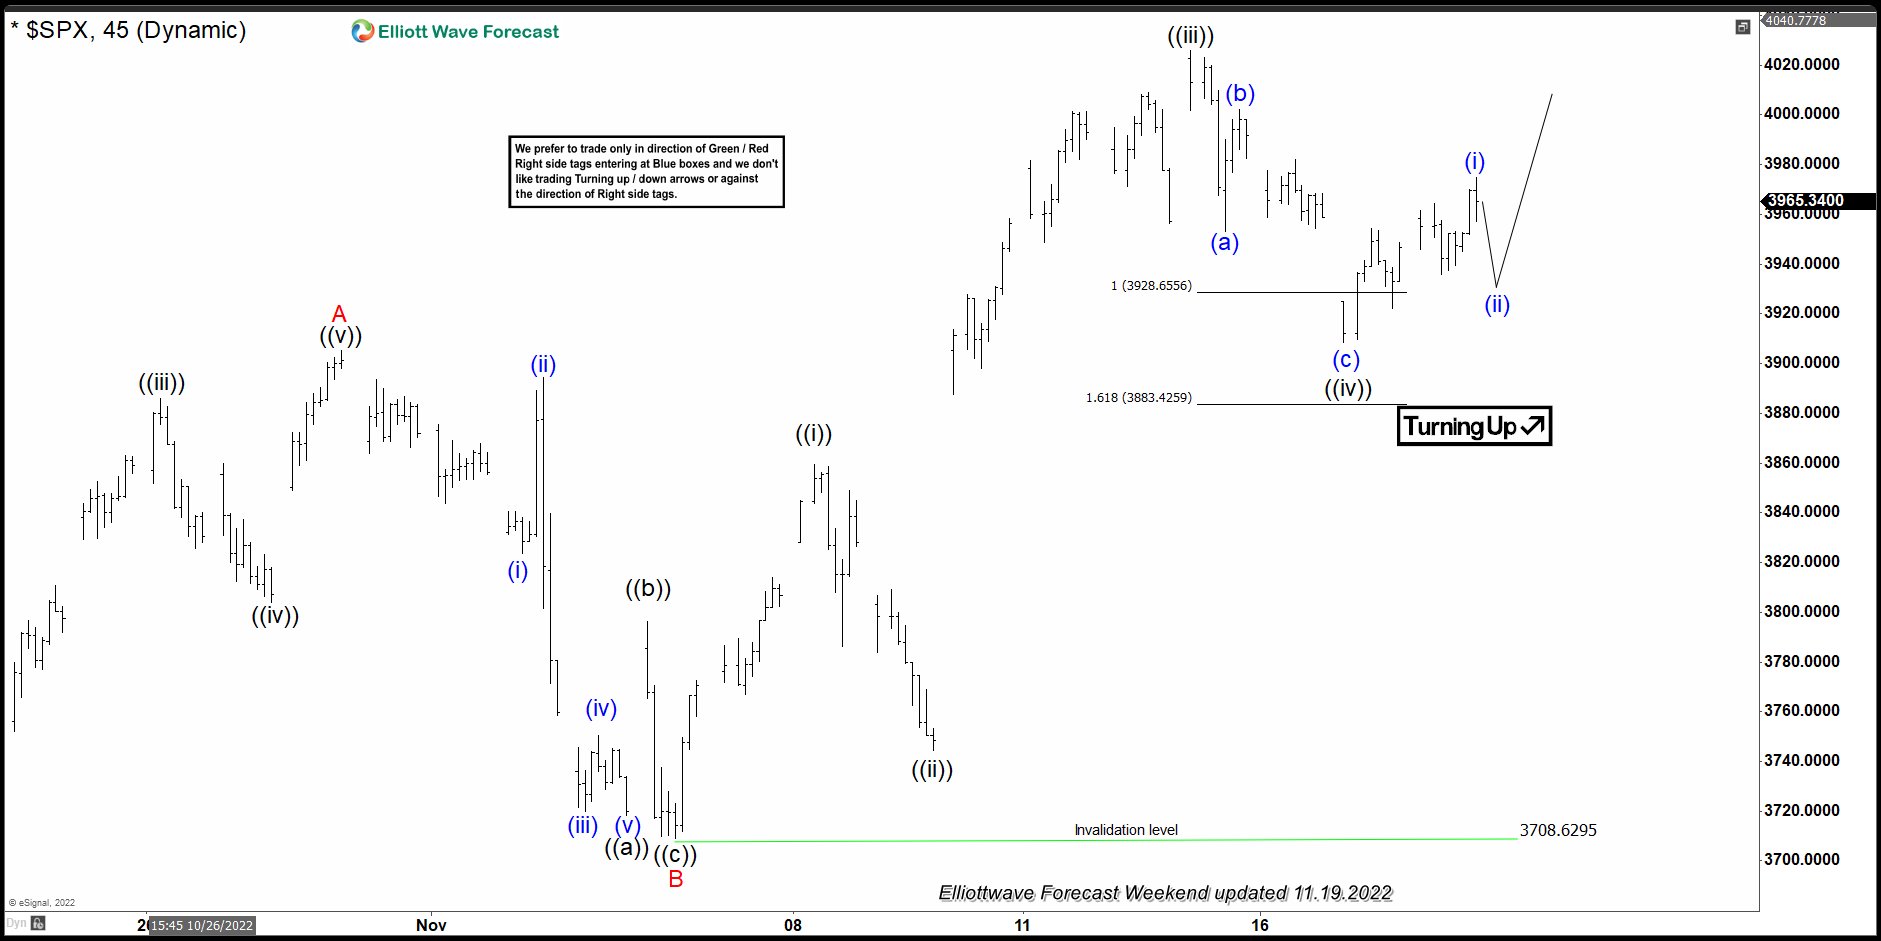
SPX Elliott Wave 1 Hour Chart 11.19.2022
Pull back reached our target zone at 3928.6-3883.4 ( buyers area). SPX found buyers at that zone and we are getting reaction from there. Rally made enough separation from the lows. As a result, any longs from there should be risk free already and partial profit taken. Wave ((iv)) can be done at 3907 low and we should be ideally trading within wave ((v)) toward 4080.4 area. Alternatively if 3907 low gets broken then we can see 7 swings in wave ((iv)) .
One Eye on FOMC Minutes
The week is off to a relatively slow start, with Asia trading mostly in the red and Europe and the US poised to do the same.
We don't get many quiet weeks these days but this may turn out to be one of the few, with the US Thanksgiving bank holiday cutting the week short for many traders and the Fed minutes on Wednesday potentially weighing on activity beforehand.
The recovery rally has stalled over the last week or so as Fed commentary has remained more hawkish than investors wanted. The rebound was also much stronger than is arguably warranted, with the Dow up almost 20% from its October lows.
Policymakers appear keen to stress that one inflation number doesn't make a trend and further evidence will be needed to justify a slower pace of tightening. While they will probably be quietly satisfied that inflation has turned a corner, there may also be a determination not to accept that publicly at the risk of undermining its tightening efforts until now. Another good report next month and the tone will almost certainly notably change.
China stocks tumble as COVID-19 cases rise
The recent news has been less good from China, where surging Covid cases have wobbled markets just as we were seeing an improvement in sentiment. A slight relaxation of Covid restrictions and the prospect of more early next year, alongside a 16-point plan to boost the property market, had triggered a strong rebound in stocks in China and Hong Kong but that has been undermined by the recent surge and restrictions.
Not only would fresh lockdowns in major cities take a sledgehammer to growth into year-end, but it could also complicate any plans that are being put in place to soften the zero-Covid policy next year. We're back into uncertain territory which could slow the recovery in stock markets.
Oil slips further amid China woes
The prospect of more restrictions and therefore lower demand in China has weighed on crude prices recently. Brent slipped back below $90 last week and could register the fourth day of declines if it remains in the red. We're seeing bleak economic prospects all around the globe which continues to weigh on oil prices and if interest rates keep rising as they are, expectations will likely deteriorate further.
That will make the next OPEC+ meeting in a couple of weeks all the more interesting. The group came under fire early last month for its decision to cut output targets by two million barrels per day, even as many countries fight inflation and recession in part as a result of higher oil prices. The question now is whether the group be so bold as to cut output again in light of recent price moves and economic developments.
Paring gains but still encouraging
Gold prices are slipping at the start of the week in risk-averse trade that is supporting the US dollar. The yellow metal has performed extremely well in recent weeks as investors have been buoyed by slightly less hawkish rhetoric from the Fed and some much more positive inflation prints.
It's stalled around $1,780 which was previously a very significant area of support and given some back in recent days but it continues to trade well off the lows which is encouraging. The next test of support could be $1,730 where it met strong resistance on the way down in September and October.
Darker days ahead for crypto?
The landscape is not getting any better for cryptos as we continue to learn more about the fallout from the FTX collapse. Bitcoin is off around 4% this morning, trading below $16,000 and looking very vulnerable. Another sharp drop looks very possible as sentiment in the space has been shredded. It could take some time for that to be repaired and the uncertainty that the FTX scandal has created is an enormous headwind for cryptos in the near term. At this point, I wouldn't be surprised to see $10,000 tested again in the not-too-distant future.
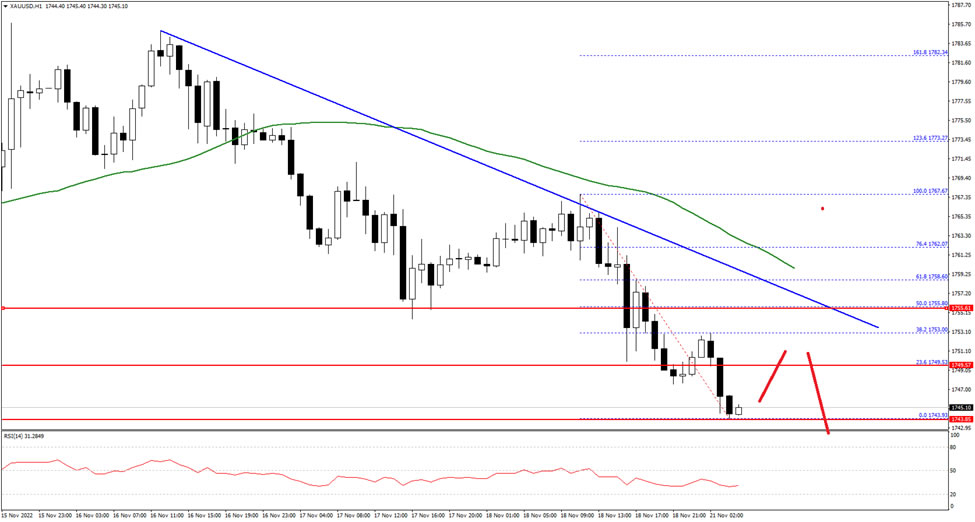
Gold Price is Currently Consolidating Losses from $1,743 low
Gold price started a fresh decline from well above the $1,780 level against the US Dollar. The price declined below the $1,770 to move into a short-term bearish zone.
The pair even traded below the $1,760 level and the 50 hourly simple moving average. Finally, it traded as low as $1,743 and is currently consolidating losses. On the downside, the price is holding the $1,742 support zone.
The next major support is near the $1,735 level, below which the price might decline towards the $1,720 support level in the near term. Any more losses might call for a test of $1,700 on FXOpen.
On the upside, the first major resistance is near the $1,755 level and a bearish trend line on the hourly chart. The next main resistance could be near the $1,770 level, above which the price could start a steady increase towards the $1,785 level.
EUR/CHF Daily Outlook
Daily Pivots: (S1) 0.9834; (P) 0.9863; (R1) 0.9880; More....
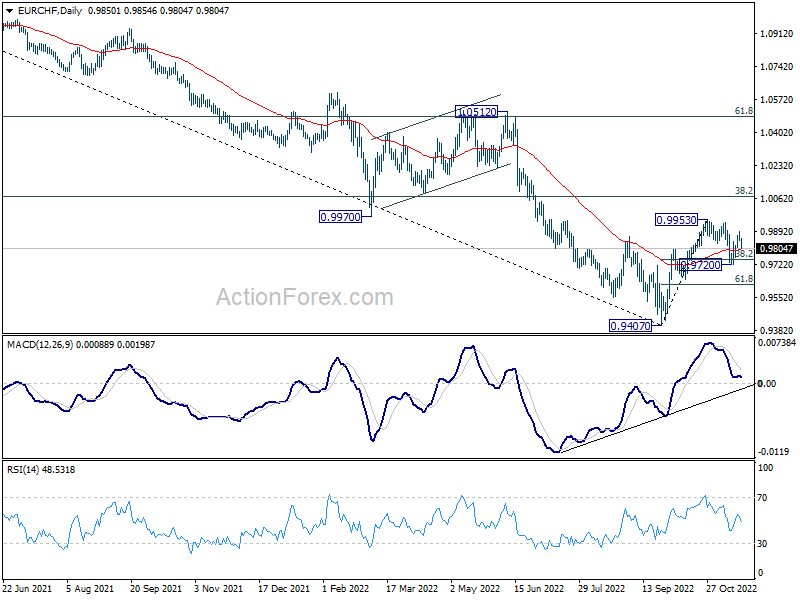
Intraday bias in EUR/CHF is turned neutral again with today's steep retreat. On the upside, firm break of 0.9953 resistance will resume larger rally from 0.9407 to 1.0072 fibonacci level. However, break of 0.9779 will likely resume the fall from 0.9953 through 0.9720.
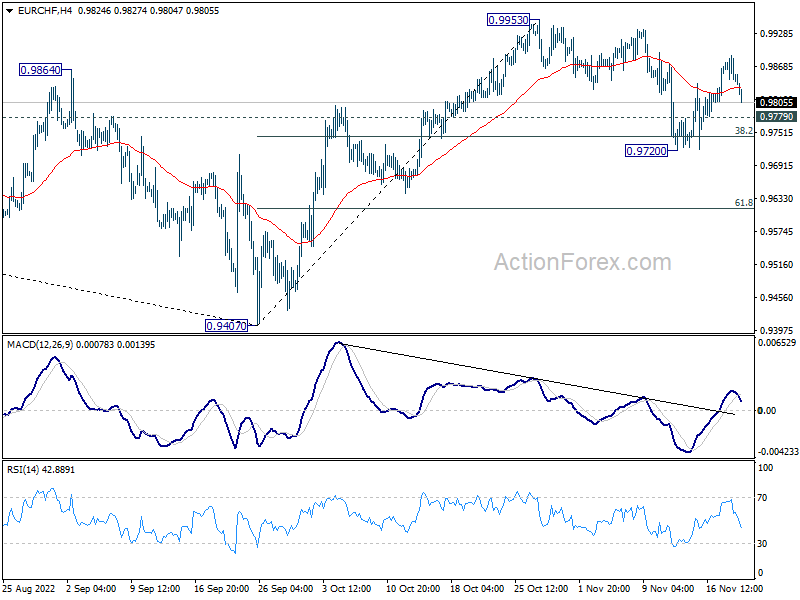
In the bigger picture, rejection by 0.9970 support turned resistance retains medium term bearishness. That is, while 0.9407 is a medium term bottom, price actions from there would develope into a corrective pattern rather than a reversal. Down trend resumption through 0.9407 is mildly favored at a later stage. This will remain the favored case now, as long 38.2% retracement of 1.1149 to 0.9407 at 1.0072 holds.
EUR/GBP Daily Outlook
Daily Pivots: (S1) 0.8659; (P) 0.8703; (R1) 0.8727; More...
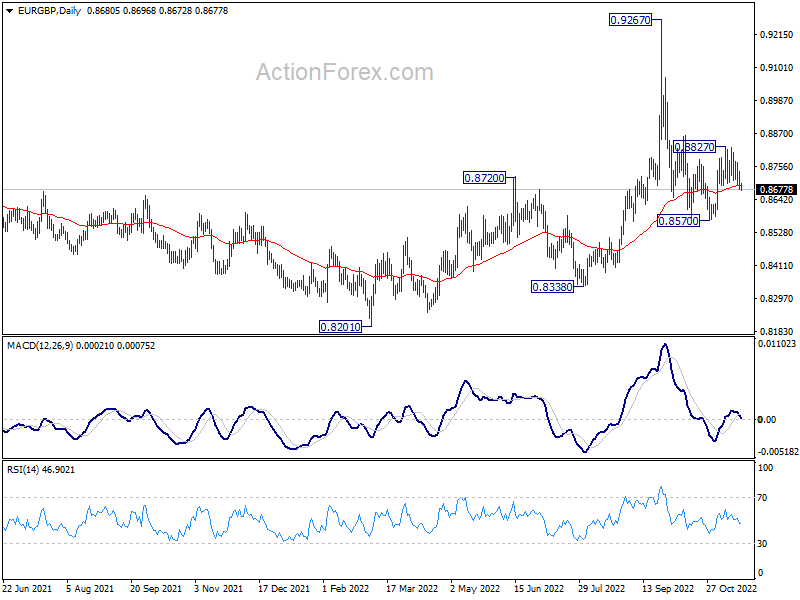
Intraday bias in EUR/GBP is mildly on the downside for 0.8570 support first. Firm break there will resume whole decline from 0.9267. On the upside, above 0.8827 will resume the rebound from 0.8570 and flip bias back to the upside instead.
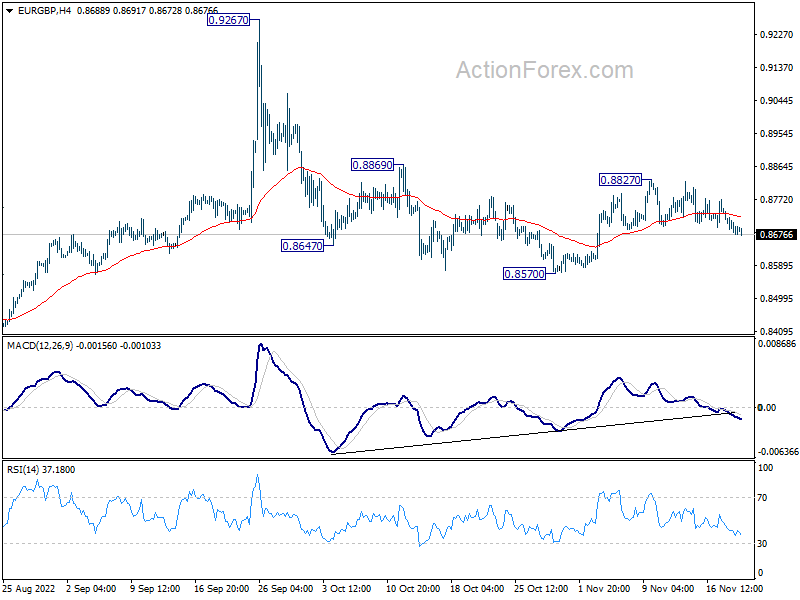
In the bigger picture, current development suggests that fall from 0.9267 is a down leg inside long term range pattern. Deeper fall could be seen towards 0.8201/8338 support zone. But strong support should be seen there to bring reversal. Nevertheless, firm break of 0.8869 resistance will turn favor to the case that such decline is merely a correction in the up trend from 0.8201. That is, further rally would be seen at a later stage through 0.9267.