Sample Category Title
EUR/AUD Daily Outlook
Daily Pivots: (S1) 1.5422; (P) 1.5473; (R1) 1.5525; More...
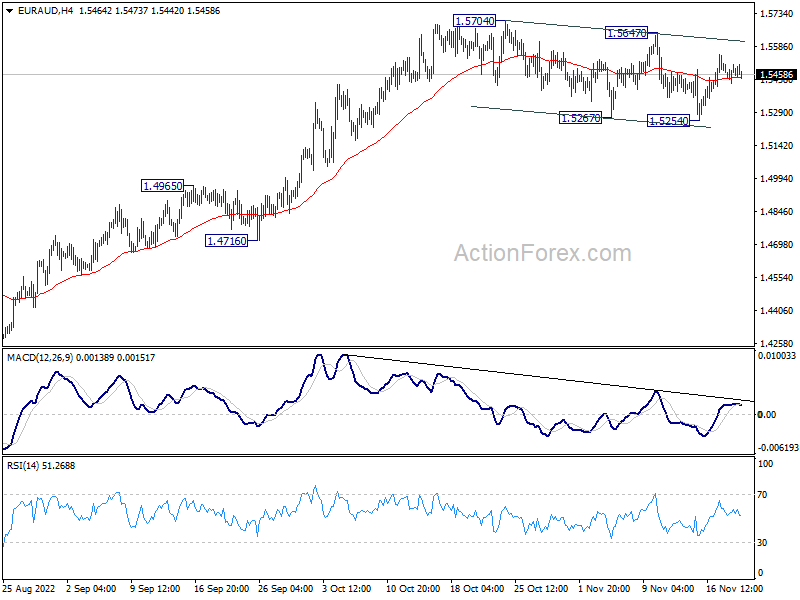
EUR/AUD is staying in consolidation from 1.5704 and intraday bias stays neutral. While another fall cannot be ruled out, downside should be contained by 55 day EMA (now at 1.5280) to bring rebound. On the upside, decisive break of 1.5704 will resume larger rise from 1.4281. However, sustained trading below 55 day EMA will bring deeper correction towards 1.4965 resistance turned support.
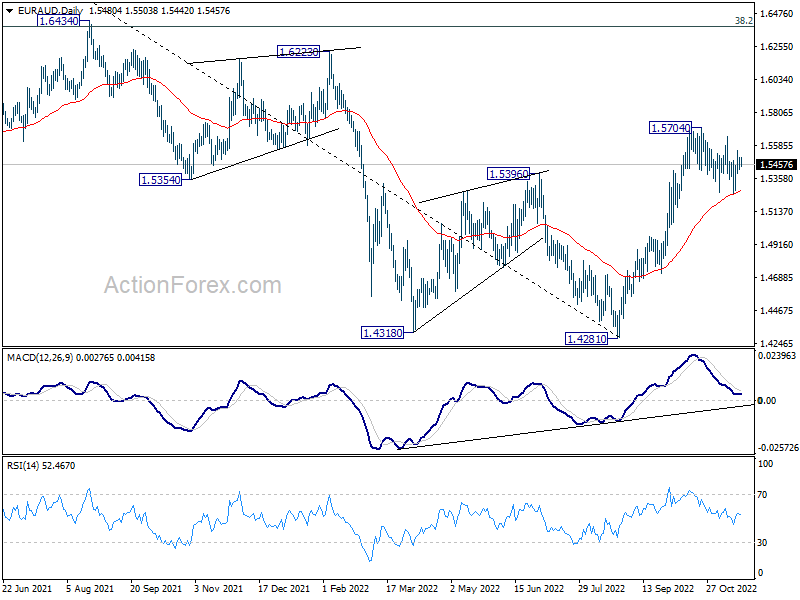
In the bigger picture, a medium term bottom should be in place at 1.4281, on bullish convergence condition in daily MACD. Further rise would be seen back to 1.6434 key resistance next. Break of 1.4965 resistance turned support is needed to indicate reversal. Otherwise, further rally will remain in favor.
EUR/JPY Daily Outlook
Daily Pivots: (S1) 144.44; (P) 144.99; (R1) 145.43; More....
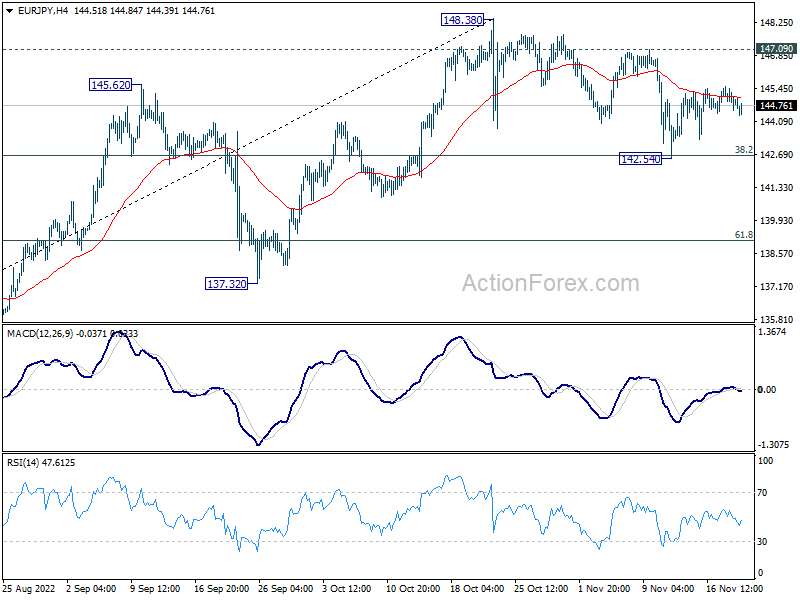
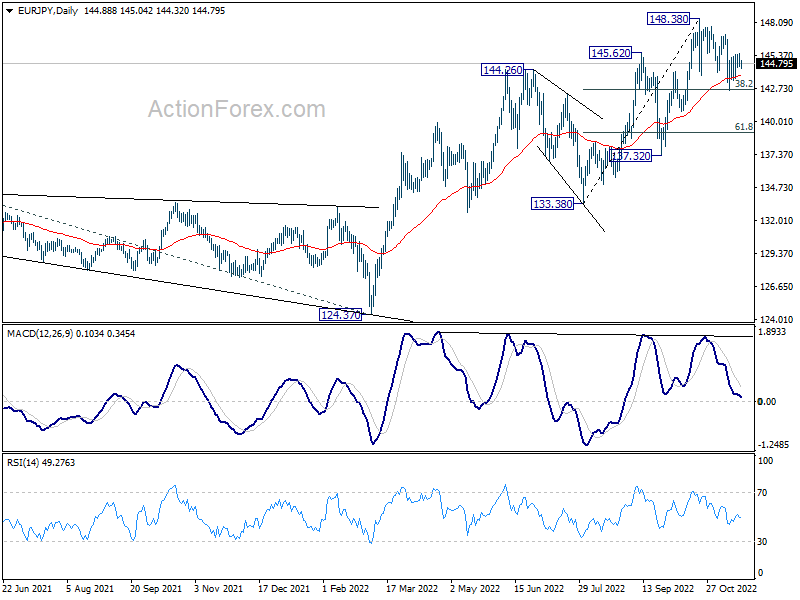
Intraday bias in EUR/JPY remains neutral for the moment. Correction from 148.38 might have completed at 142.54. Break of 147.09 resistance will indicate that larger up trend is ready to resume through 148.38 high. However, on the downside, sustained break of 142.65 will bring deeper fall to 61.8% retracement at 139.11 and possibly below.
In the bigger picture, there is no clear sign of medium term topping yet. Up trend from 114.42 (2020 low) could still resume through 148.38 to 149.76 (2014 high). However, break of 137.32 support argue that a medium term correction has already started to correct the whole up trend from 114.42.
GBP/JPY Daily Outlook
Daily Pivots: (S1) 166.21; (P) 166.76; (R1) 167.40; More...
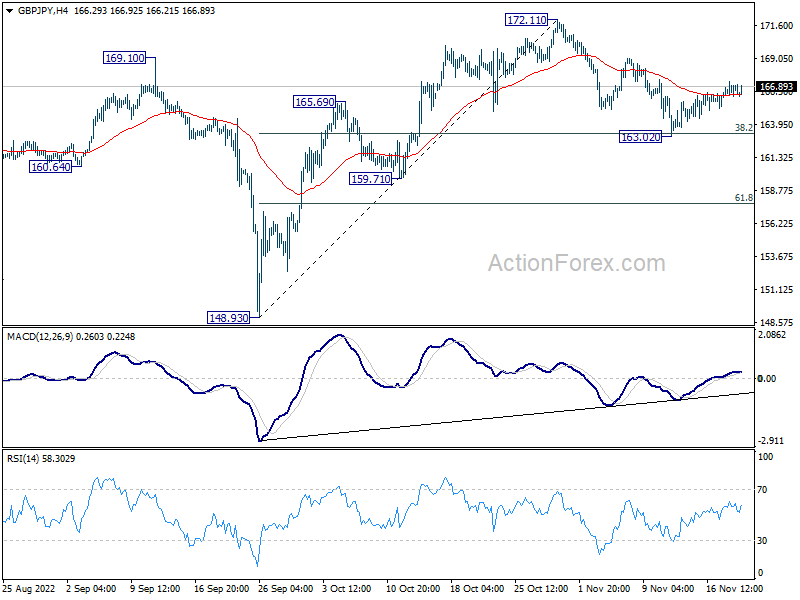
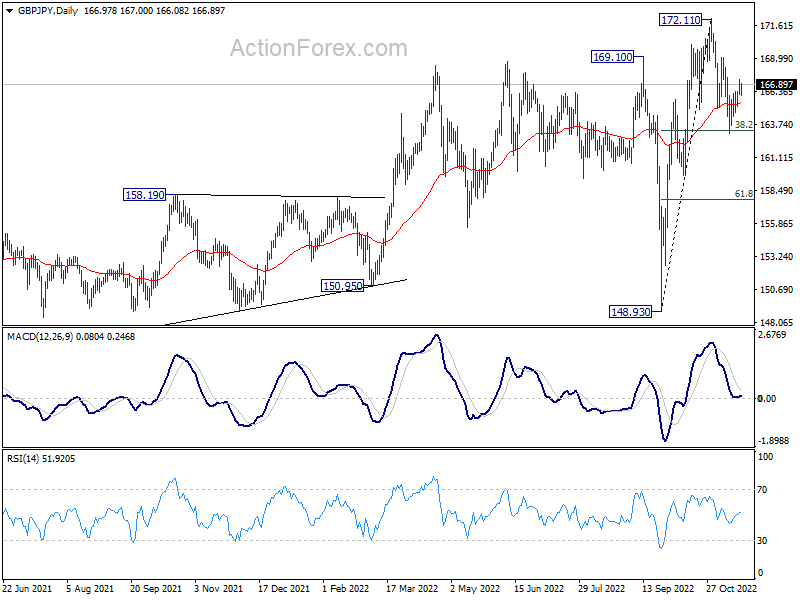
Intraday bias in GBP/JPY stays mildly on the upside for the moment. Correction from 172.11 might have completed at 163.20, after hitting 38.2% retracement of 148.93 to 172.11 at 163.25. Further rise would be seen to retest 172.11 high. On the downside, however, sustained trading below 38.2% retracement of 148.93 to 172.11 at 163.25 will bring deeper decline to 61.8% retracement at 157.78 and possibly below.
In the bigger picture, there is no clear sign of medium term topping yet. Up trend from 123.94 (2020 low) could still resume through 172.11 high at a later stage. However, firm break of 159.71 support will argue that it's already in correction to the up trend from 123.94, and deeper decline would be seen back towards 148.93 support.
Gold Poised for Downside Recovery ahead of More Bullish Actions
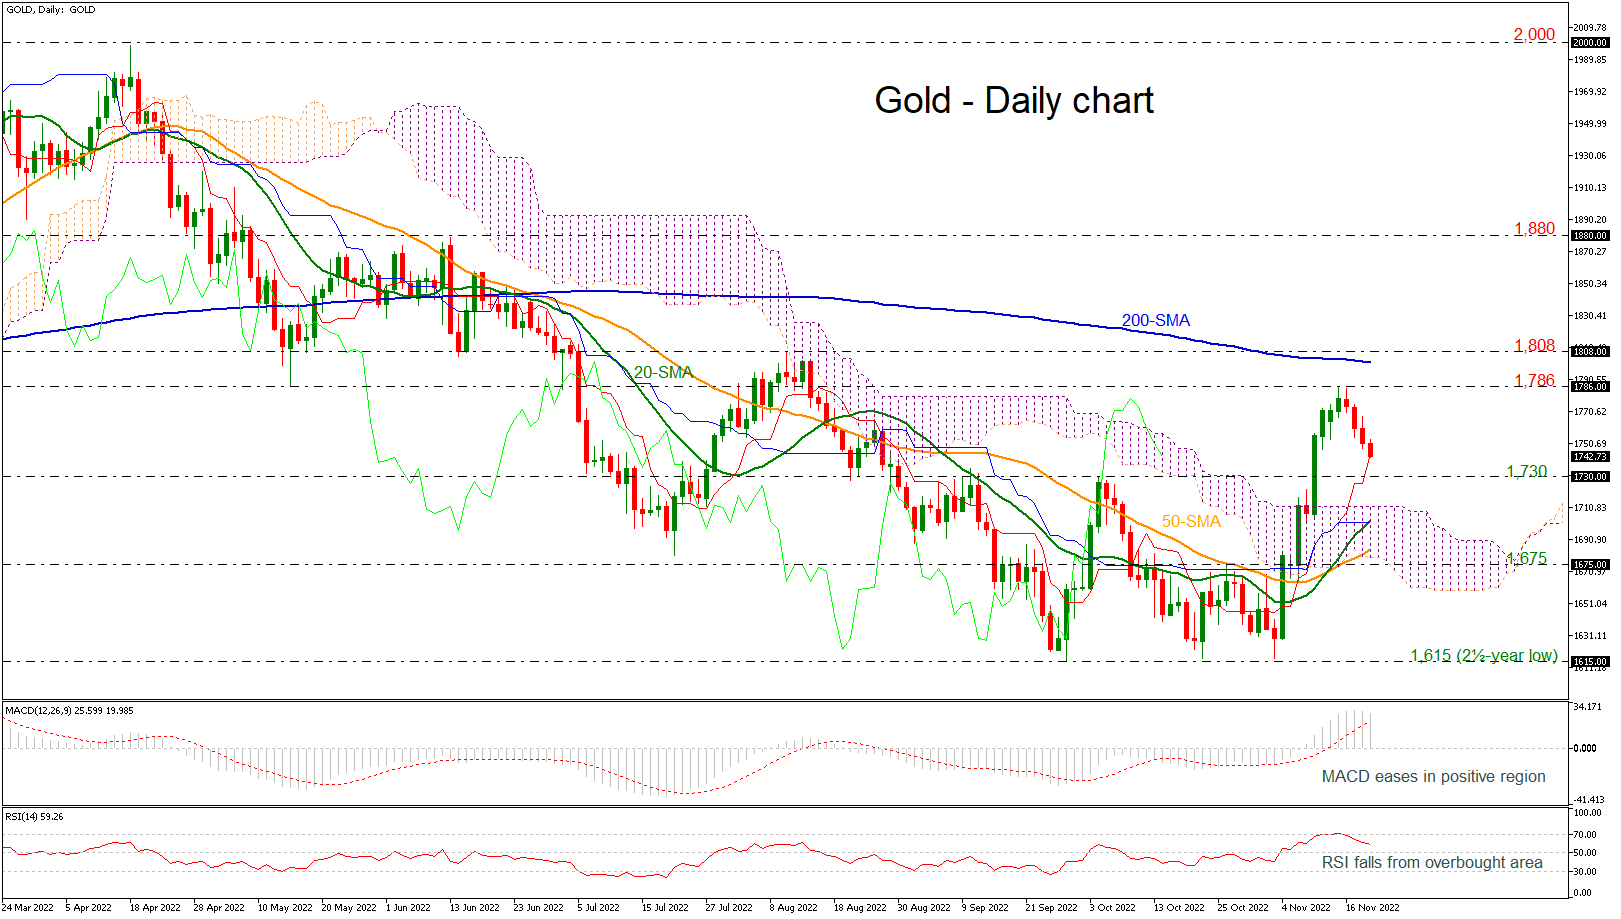
Gold prices have been in a declining movement since the pullback off the 1,786 resistance level; however, the bullish crossover within the 20- and the 50-day simple moving averages (SMAs) are suggesting more upside structure in the short-term.
From a technical perspective, the short-term bias is viewed as negative, reflected by the downward move in the RSI and the MACD. The former is heading south after the touch in the overbought area, while the MACD is weakening its momentum in the positive region. The increasing distance between the red Tenkan-sen and the blue Kijun-sen lines is another bearish signal.
Yet only a decisive close above the nearby resistance of 1,786, can boost buying pressure towards the 200-day SMA at the 1,800 psychological mark. Stretching further, the bulls may next test the 1,808 resistance ahead of the 1,880 barrier, taken from the peak on June 13.
In the event of a downside reversal beneath the red Tenkan-sen line and the 1,730 support level the Ichimoku cloud and the 20- and 50-day SMAs at 1,703 and 1,684 respectively may ease selling pressure. Failure to bounce on the latter, could bring the 1,675 support into view ahead of the two-and-a-half year low of 1,615.
In the bigger picture, the market printed a triple bottom in the previous months at 1,615 and the climb beyond the 1,730 endorsed a bullish bias in the near-term. A drop below this level could confirm the broader bearish outlook. Overall though, gold prices have a potential to gain additional ground as a jump above the 200-day SMA at 1,800 is expected to trigger the next upside move.
Stock Sentiment is Grim
Markets
Boston Fed Collins joined the growing chorus of Fed officials trying to reshape market expectations. She said rates need to rise further and even kept the possibility of a 75 bps move on the table. But just as others did, she puts the focus on how high rates ultimately need to be instead of the pace. Her comments helped the dollar to recoup some of the losses endured earlier in the week. Meanwhile, voluntary TLTRO repayments at the ECB were about half of the €600bn estimations, sucking up only a marginal proportion of euro excess liquidity. EUR/USD finished at 1.0325, closing the week below the important 1.035 resistance which was being tested a few times in the days before. The weekly graph now displays a doji pattern, indicating potential further losses ahead. The trade-weighted dollar formed a bullish weekly hammer. Core bonds traded mixed with US Treasuries hugely underperforming Bunds. The US yield curve inverted further with changes between 5.2 bps and 8.3 bps on the account of real yields. German yields’ early attempt to rise soon went into reverse, ending up flat to 1.8 bps lower at the front. UK gilts extended losses following UK finance minister Hunt’s Autumn Statement. Yields rose 3.5 bps (30y) to 6.3 bps (2y). Sterling is given the benefit of the doubt, gaining against the euro (EUR/GBP closed at 0.868) and marginally vs the dollar (GBP/USD closed at 1.189). Risky assets including equities finished 1.20% higher in Europe (EuroStoxx50) and up to 0.6% in the US (Dow Jones). But the likes of oil had an off day. Brent at some point lost about 4.5% before paring some losses. Closing at $87.62/b still meant a weekly loss of 8.7%.
Covid cases in China/Hong Kong are on the rise again and “test” cities that had relatively mild Covid restrictions despite high case numbers saw measures tightened over the weekend, dampening reopening hopes. The story is setting the mood during Asian dealings this morning. Stock sentiment is grim. China and Hong Kong underperform with losses of 2% and more. The dollar thrives in such an environment. USD/CNY advances to 7.16. EUR/USD dips towards 1.027. Core bonds gain.
The economic calendar won’t inspire a lot today. EMU consumer confidence (tomorrow), European PMI’s and the FOMC meeting minutes (both on Wednesday) and central bank policy meetings in Hungary, Sweden and New Zealand will spice the agenda later though. The slew of ECB speakers (Nagel, Holzmann and others) scheduled for today are a wildcard to trading. The US kicks off its end-of-month refinancing operation in a holiday-shortened week (Thanksgiving Nov 24) with both a $24bn 2-y and a $43bn 5-y auction. This could trigger some UST underperformance in a daily perspective. On the FX front, we look out for the dollar to effectively confirm last week’s doji/hammer formation.
News Headlines
The UK Sunday Times reported that senior government officials were exploring a pathway to closer economic ties with the EU under a Swiss-style arrangement over the next decade. The UK government immediately pushed back against the idea with PM Sunak able to address the issue this morning when he’ll deliver a speech at the Confederation of British Industry’s yearly conference. The Swiss-style deal includes several red lines for hardline brexiteers in the tory party, including payments to the budget, EU market regulation and free movement of labor.
Rating agency Fitch affirmed the Italian credit rating at BBB with a stable outlook. Factors that could, individually or collectively, lead to negative rating action/downgrade are debt sustainability concerns for example in case of expenditure pressures, a more severe macroeconomic shock due to energy rationing or other spillovers from the war in Ukraine and a disorderly tightening of financing conditions outside the scope of the ECB’s Transmission Protection Instrument. Italy has a similar BBB (stable) rating at S&P while Moody’s uses a weaker Baa3-rating with a negative outlook.
EUR/USD Daily Outlook
Daily Pivots: (S1) 1.0311; (P) 1.0359; (R1) 1.0412; More...
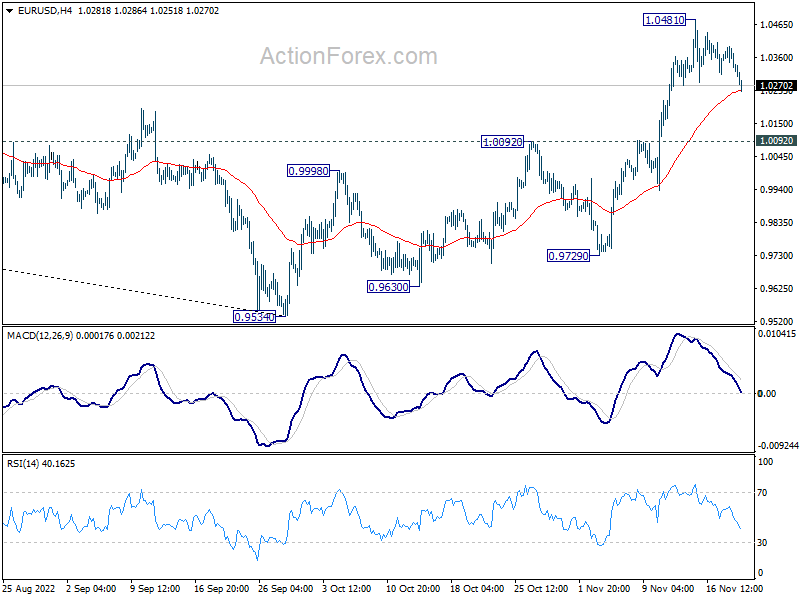
Intraday bias in EUR/USD stays neutral at this point, as consolidation from 1.0481 is extending. Downside of retreat should be contained by 1.0092 resistance turned support to bring another rally. On the upside, break of 1.0481 will resume the rise from 0.9534 and target 1.0609 fibonacci level. However, sustained break of 1.0092 will turn bias to the downside for 55 day EMA (now at 1.0034) and below.
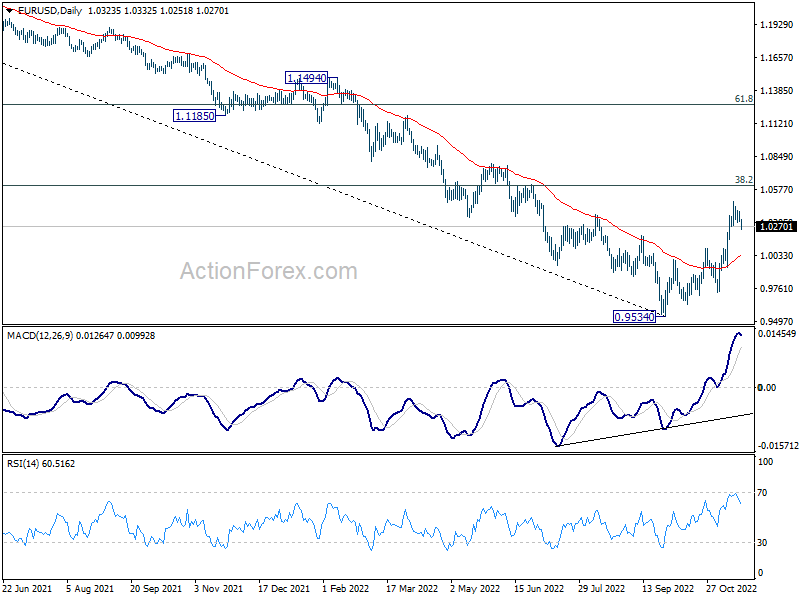
In the bigger picture, a medium term bottom was in place at 0.9534, on bullish convergence condition in daily MACD. Even as a corrective rise, rally from 0.9534 should target 38.2% retracement of 1.2348 (2021 high) to 0.9534 at 1.0609. Sustained trading above 55 week EMA (now at 1.0566) will raise the chance of trend reversal and target 61.8% retracement at 1.1273. This will now remain the favored case as long as 1.0092 resistance turned support holds.
GBP/USD Daily Outlook
Daily Pivots: (S1) 1.1766; (P) 1.1862; (R1) 1.1961; More...
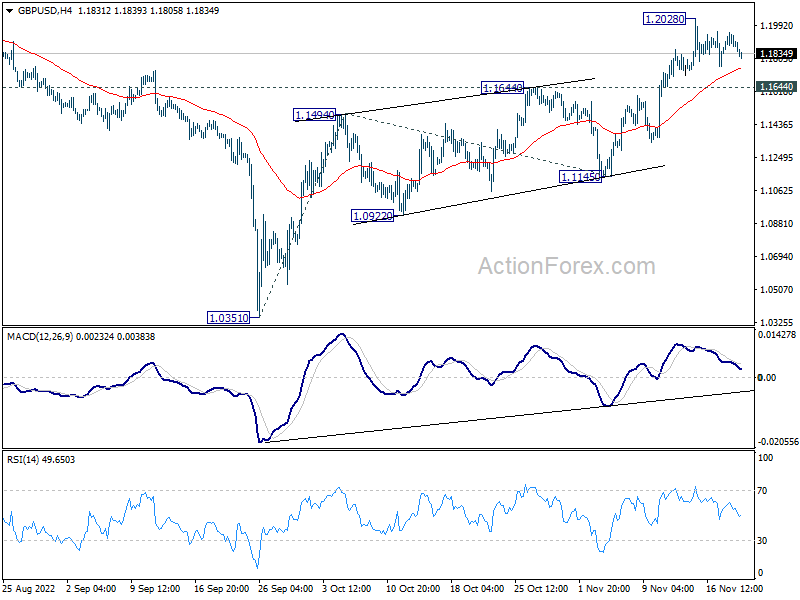
GBP/USD is still extending the consolidation pattern from 1.2028 and intraday bias stays neutral. Further rise is expected as long as 1.1644 resistance turned support holds. On the upside, break of 1.2028 will resume whole rise from 1.0351 to 100% projection of 1.0351 to 1.1494 from 1.1145 at 1.2288. However, sustained break of 1.1644 will bring deeper fall to 1.1145 support instead.
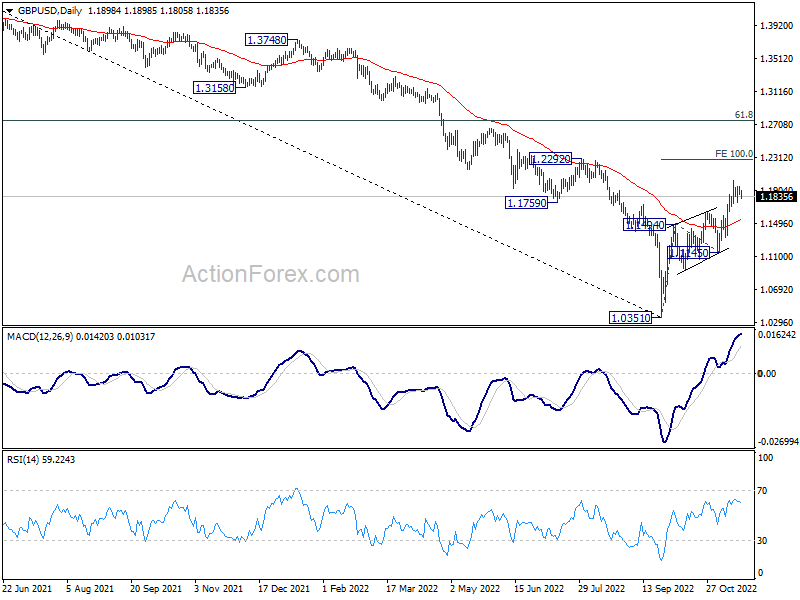
In the bigger picture, rise from 1.0351 medium term bottom is at least correcting whole down trend from 1.4248 (2021 high). Further rise is expected as long as 1.1145 support holds. Next target is 61.8% retracement of 1.4248 to 1.0351 at 1.2759.
USD/CHF Daily Outlook
Daily Pivots: (S1) 0.9514; (P) 0.9534; (R1) 0.9568; More...
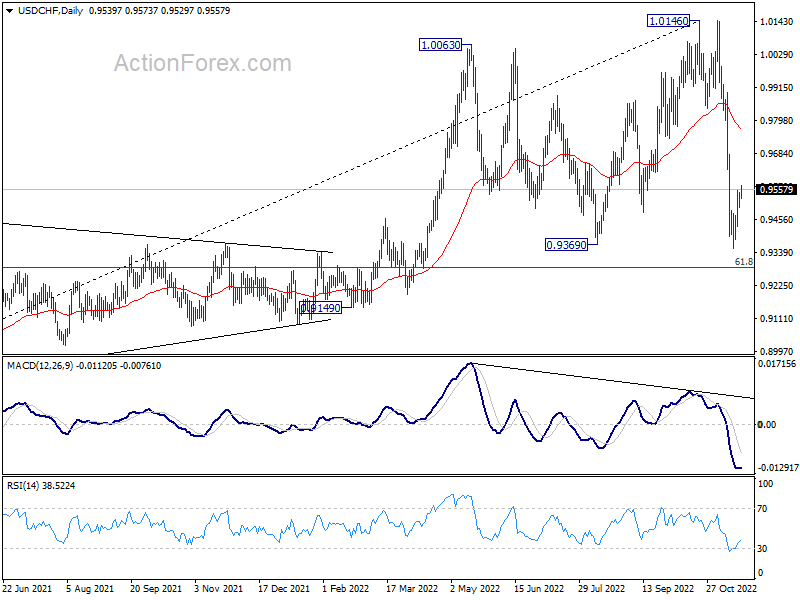
Intraday bias in USD/CHF remains neutral as consolidation from 0.9355 is extending. Further decline is expected as long as 0.9680 resistance holds. Break of 0.9355 will resume the fall from 1.0146 to 0.9287 fibonacci level. Nevertheless, firm break of 0.9680 will bring stronger rebound to 55 day EMA (now at 0.9767).
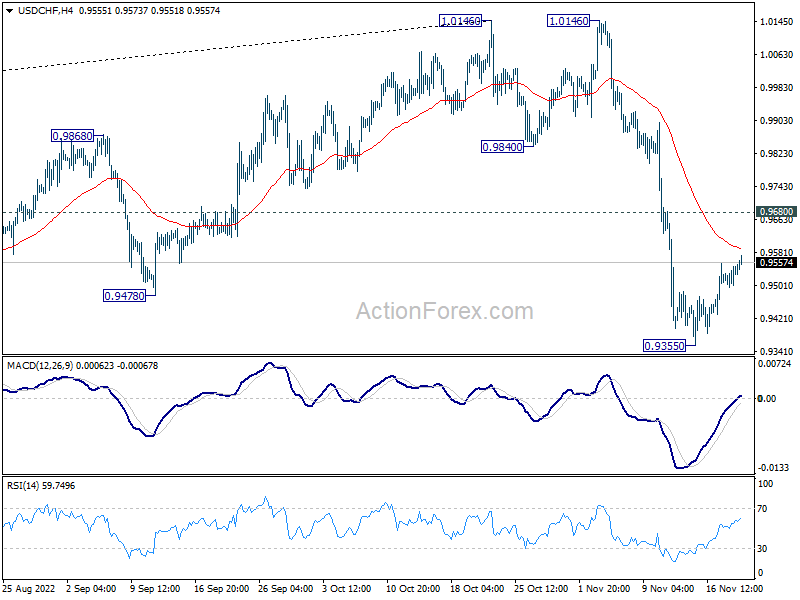
In the bigger picture, rise from 0.8756 (2021 low) has completed at 1.0146, well ahead of 1.0342 long term resistance (2016 high). Based on current downside momentum, fall from 1.0146 might be a medium term down trend itself. Break of 61.8% retracement of 0.8756 to 1.0146 at 0.9287 will pave the way to 0.8756. In any case, risk will stay on the downside as long as 55 day EMA (now at 0.9767) holds.
USD/JPY Daily Outlook
Daily Pivots: (S1) 139.84; (P) 140.17; (R1) 140.70; More...
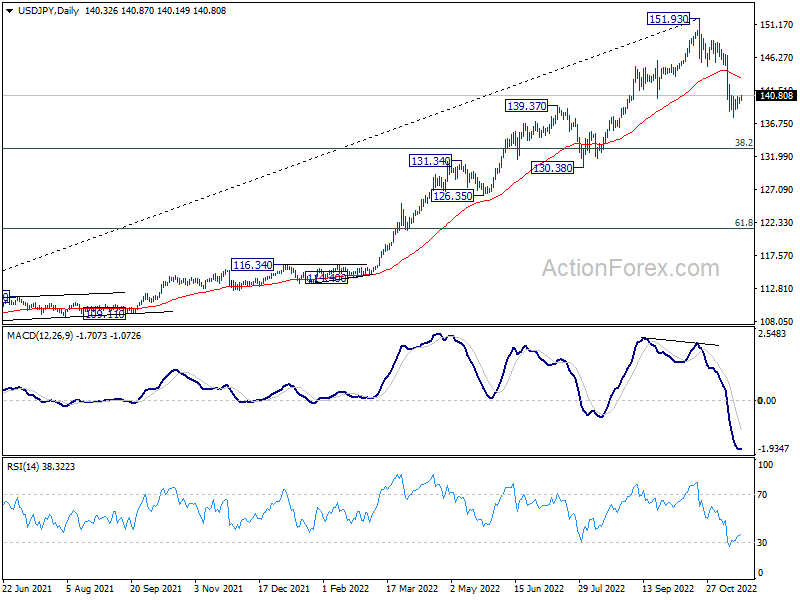
Intraday bias in USD/JPY remains neutral for the moment as consolidations from 137.66 is extending. Further decline is in favor as long as 142.45 minor resistance holds. On the downside, break of 137.66 will resume the decline from 151.93, to 133.07 fibonacci level, as a correction to the larger up trend. Nevertheless, firm break of 142.45 will turn bias back to the upside for stronger rebound to 55 day EMA (now at 143.44) and above.
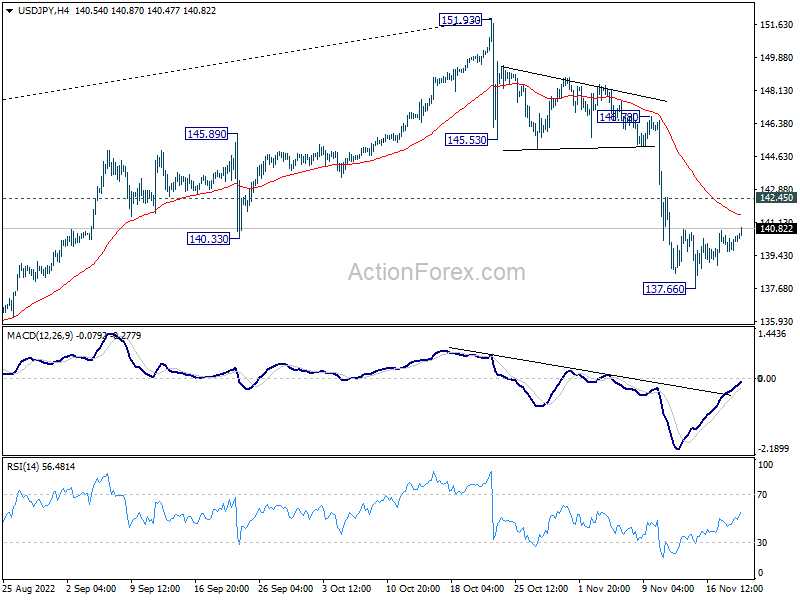
In the bigger picture, a medium term top should be formed at 151.93. Fall from there is correcting larger up trend from 102.58. It's too early to call for bearish trend reversal. But even as a corrective move, such decline should target 38.2% retracement of 102.58 to 151.93 at 133.07, or further to 55 week EMA (now at 130.28).
USD/CAD Daily Outlook
Daily Pivots: (S1) 1.3322; (P) 1.3366; (R1) 1.3430; More....
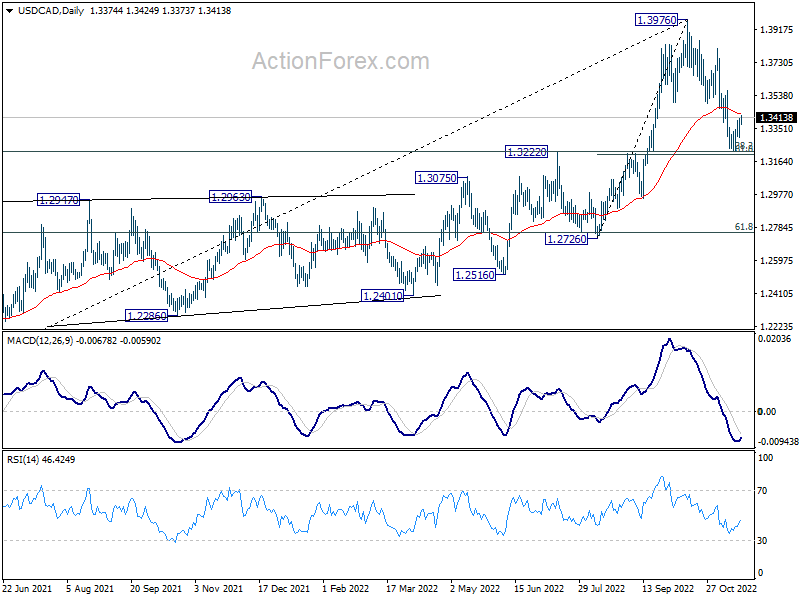
Intraday bias in USD/CAD remains neutral for the moment. On the upside, firm break of 1.3494 will indicate that correction from 1.3976 has completed at 1.3224, ahead of 1.3207 cluster support (61.8% retracement of 1.2726 to 1.3976 at 1.3204). Intraday bias will be turned back to the upside for 1.3807/3976 resistance zone. However, on the downside, sustained break of 1.3204/7 will carry larger bearish implication and target 1.2952 support next.
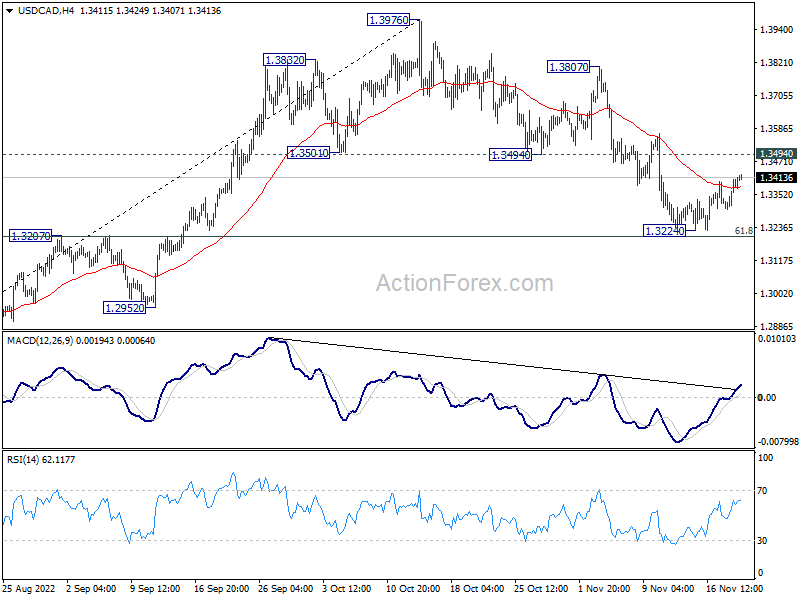
In the bigger picture, as long as 1.3222 cluster support (38.2% retracement of 1.2005 to 1.3976 at 1.3223) holds, larger up trend from 1.2005 (2021 low) is still expected to resume through 1.3976 high at a later stage. . However, firm break of 1.3222/3 will indicate that the trend might have reversed. Deeper fall would be seen to next cluster support at 1.2726 (61.8% retracement at 1.2758).