

Sample Category Title
Elliott Wave View: DAX Ending 5 Waves Rally
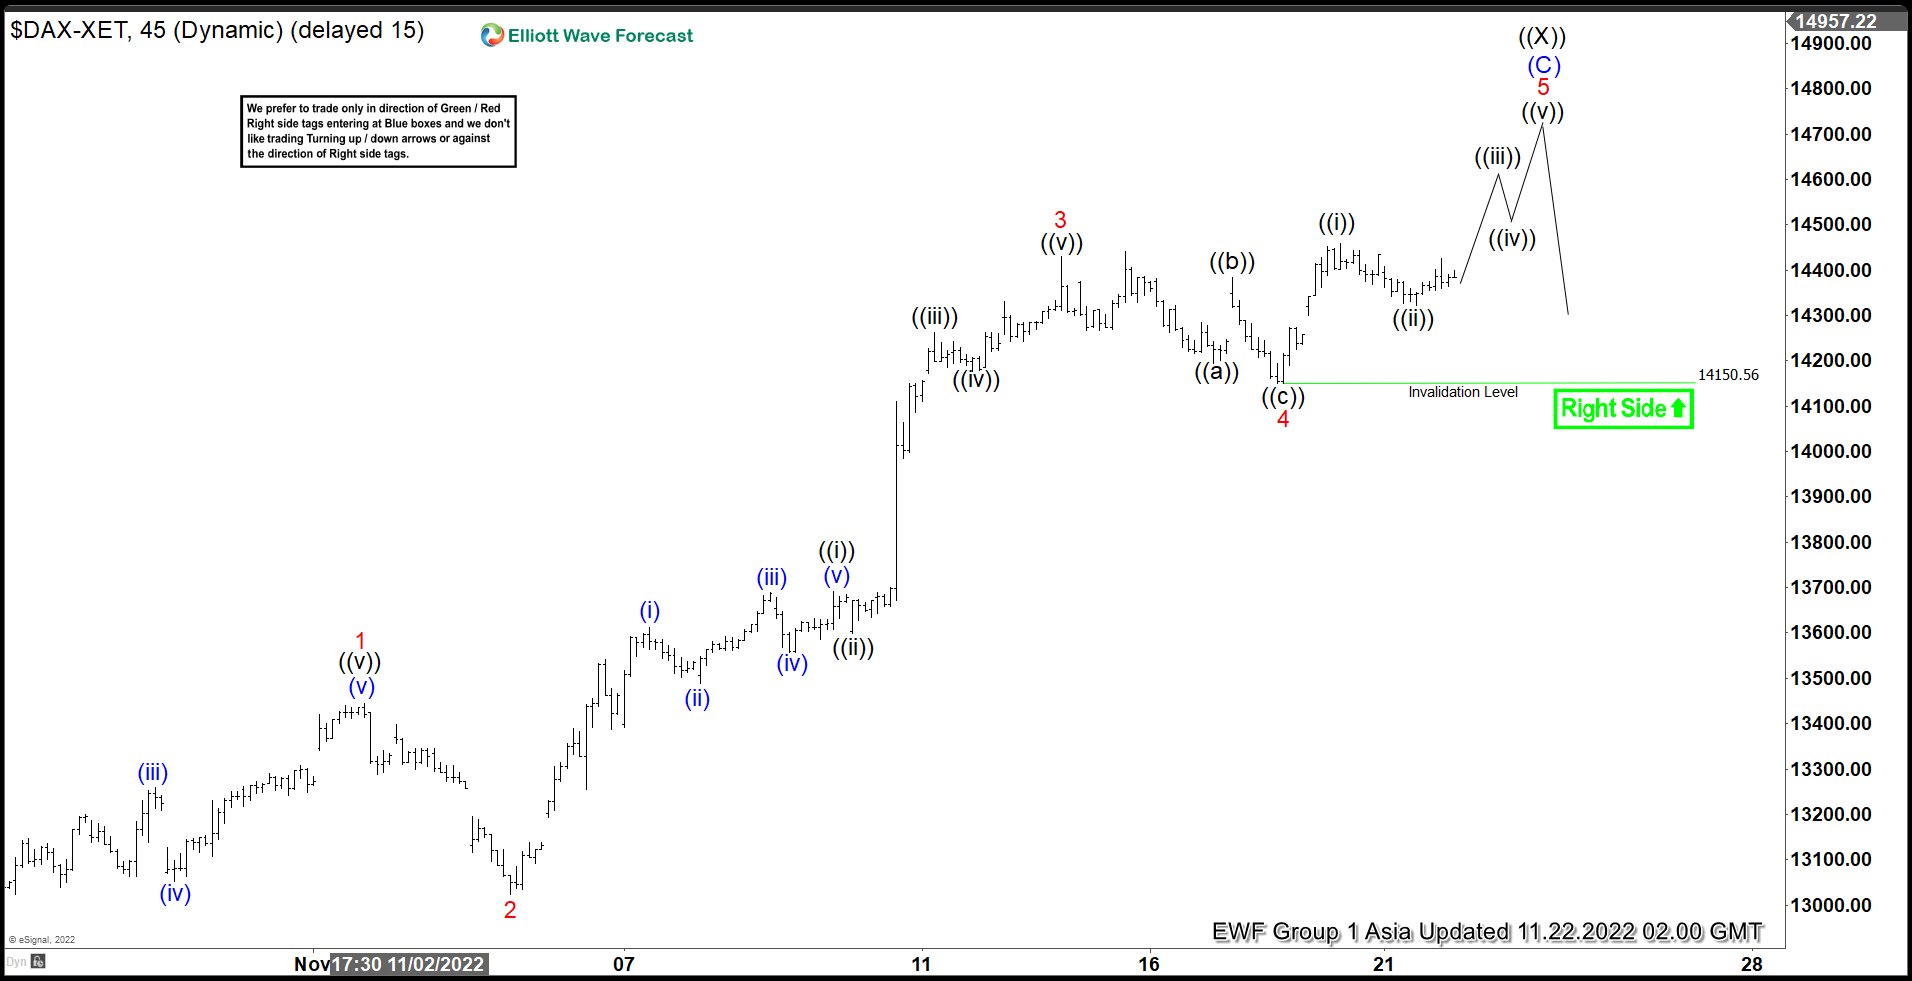
Short term Elliott Wave View in DAX suggests cycle from 9.28.2022 low is unfolding as a 5 waves impulse structure. Up from 9.28.2022 low, wave 1 ended at 13444.07 and pullback in wave 2 ended at 13022.64. Up from there, Index rallied in another 5 waves in lesser degree. Wave ((i)) ended at 13691.12 and wave ((ii)) ended at 13599.35. Index resumed higher in wave ((iii)) towards 14263.48, dips in wave ((iv)) ended at 14177.59, and final wave ((v)) ended at 14431.18 which completed wave 3.
Pullback in wave 4 ended at 14150.56 with subdivision as a zigzag. Down from wave 3, wave ((a)) ended at 14195.3, wave ((b)) ended at 14384.54, and wave ((c)) ended at 14150.56. Wave 5 is in progress as another impulse in lesser degree. Up from wave 4, wave ((i)) ended at 14457.76 and dips in wave ((ii)) ended at 14321.84. Near term, while above 14150.56, expect the Index to extend higher a bit more to complete wave 5. It will also end the higher degree cycle wave (C) of ((X)). Once the 5 waves higher from 9.28.2022 low is completed, the Index should at minimum pullback in 3 waves to correct the cycle.
DAX 45 Minutes Elliott Wave Chart
ECB Holzmann backs another 75bps hike to give a strong signal about determination
ECB Governing Council member Robert Holzmann told FT in an interview, that he could "see no signs that core inflation is reducing" . He added that another big rate hike "would give a strong signal about our determination," as "it would tell businesses and trade unions we are serious so don't underestimate us, be careful."
He backs another 75bps rate hike in December but he was still "open to changing my mind" based on the ECB's new quarterly economic forecasts. He added that interest rates could need to rise to a level where they "caused pain". Hence, it's important to hike "early" because "afterwards the pain is much, much larger."
Technical Outlook and Review
USD/JPY:
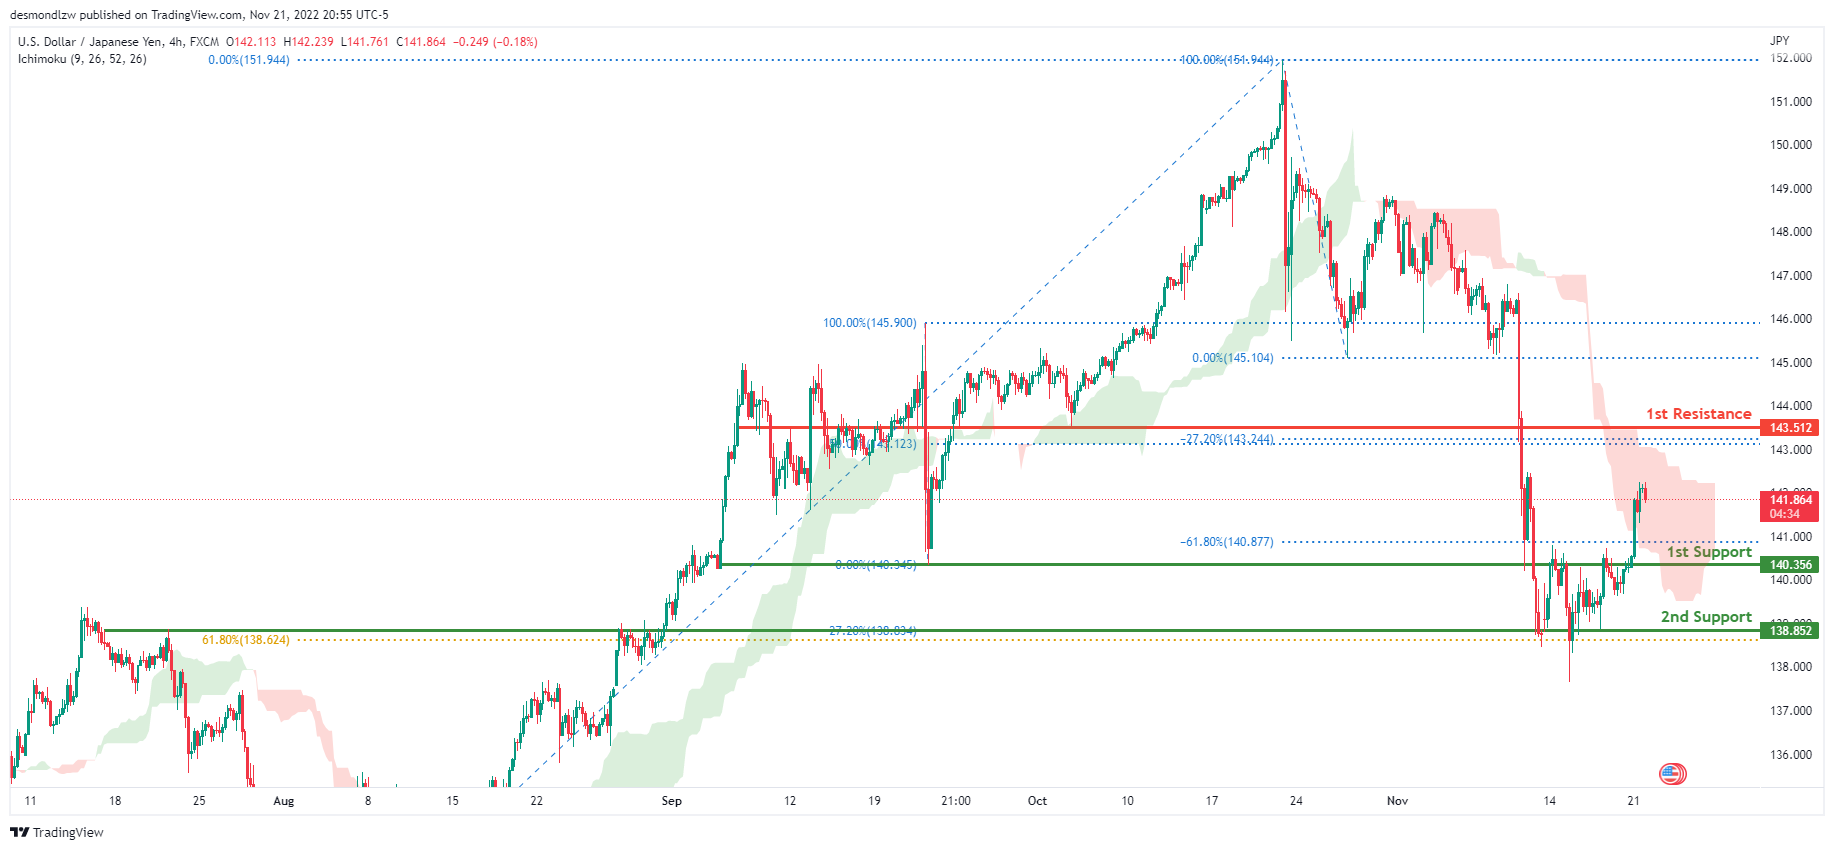
The current general bias for USDJPY on the H4 chart is bullish. To add confluence to this, the price is crossing the Ichimoku cloud which indicates a bullish market. If the bullish momentum continues, expect USDJPY to head towards the 1st resistance line at 143.512 where the -27.2% Fibonacci expansion line and 50% Fibonacci line are located .In an alternative scenario, price could go back down to retest the 1st support at 140.356, where the -61.8% Fibonacci expansion line and previous low are located
Areas of consideration:
- H4 time frame, 1st resistance at 143.512
- H4 time frame, 1st support at 140.356
DXY:
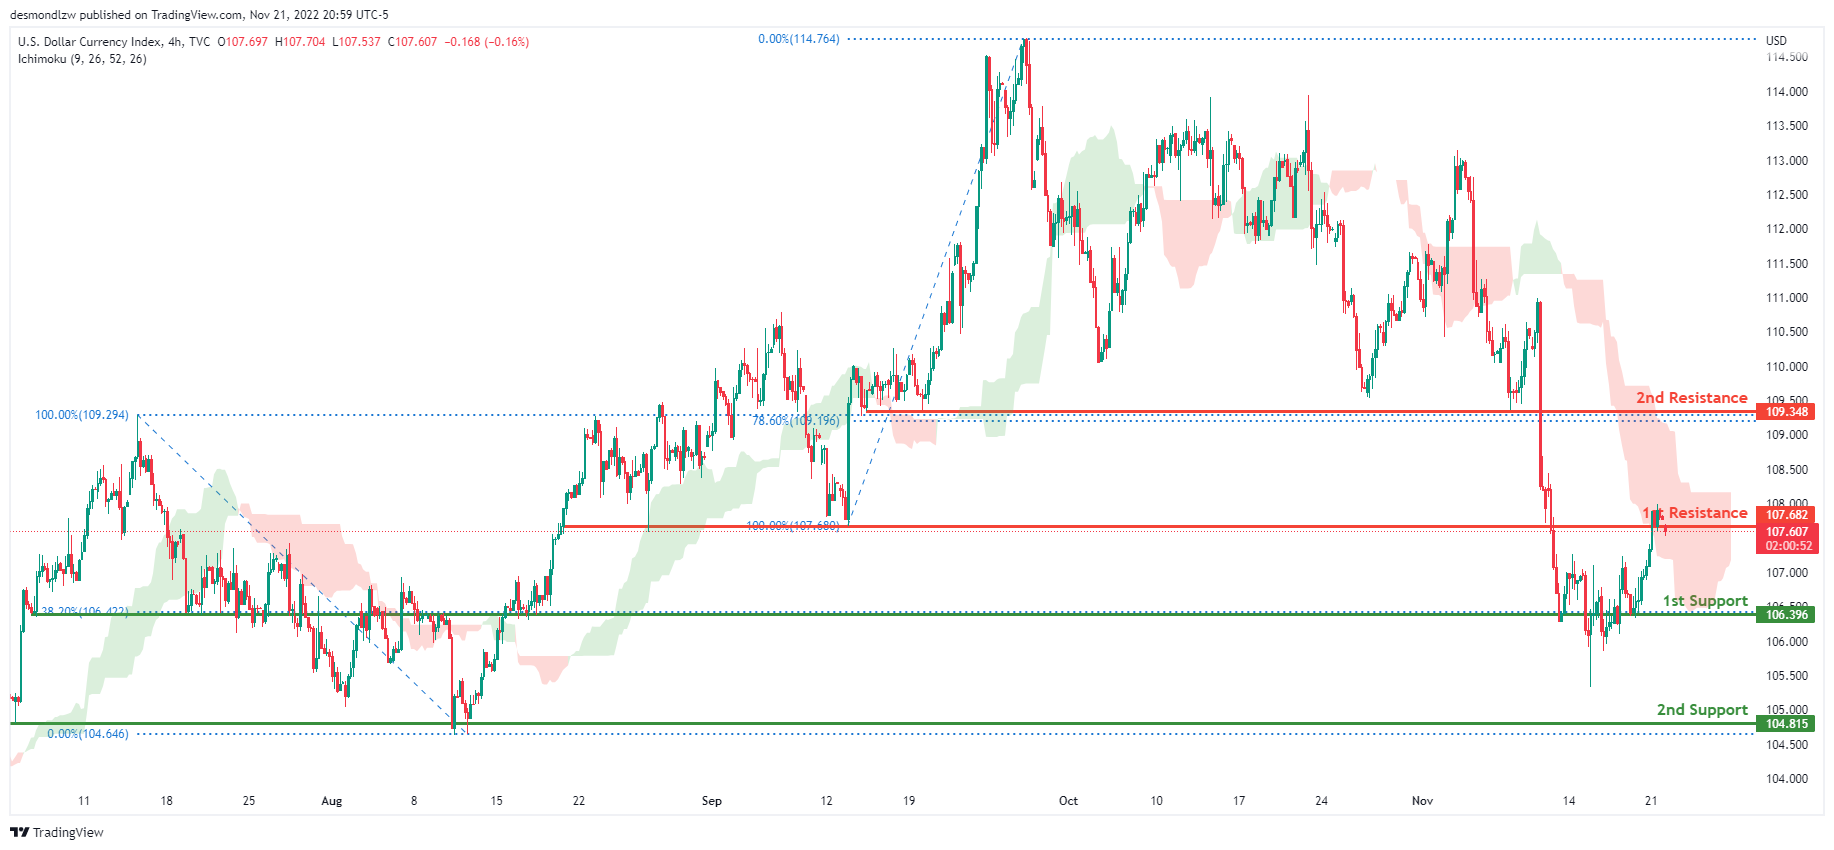
On the H4 chart, the overall bias for DXY is bearish. To add confluence to this, the price is below the Ichimoku cloud which indicates a bearish market. If this bearish momentum continues, price could break the 1st support line at 106.396 where the 38.2% fibonacci line is located, before heading towards the 2nd support at 104.815 where the previous low and the 0% Fibonacci line are located. In an alternative scenario, price could head back up and retest the 1st resistance line at 107.682, where the previous low and 100% Fibonacci line are located. If this 1st resistance line is broken, the 2nd resistance is located at 109.348, where the 78.6% Fibonacci line is located
Areas of consideration:
- H4 time frame, 1st resistance at 107.682
- H4 time frame, 2nd resistance at 109.348
- H4 time frame, 1st support at 106.396
- H4 time frame, 2nd support at 104.815
EUR/USD:
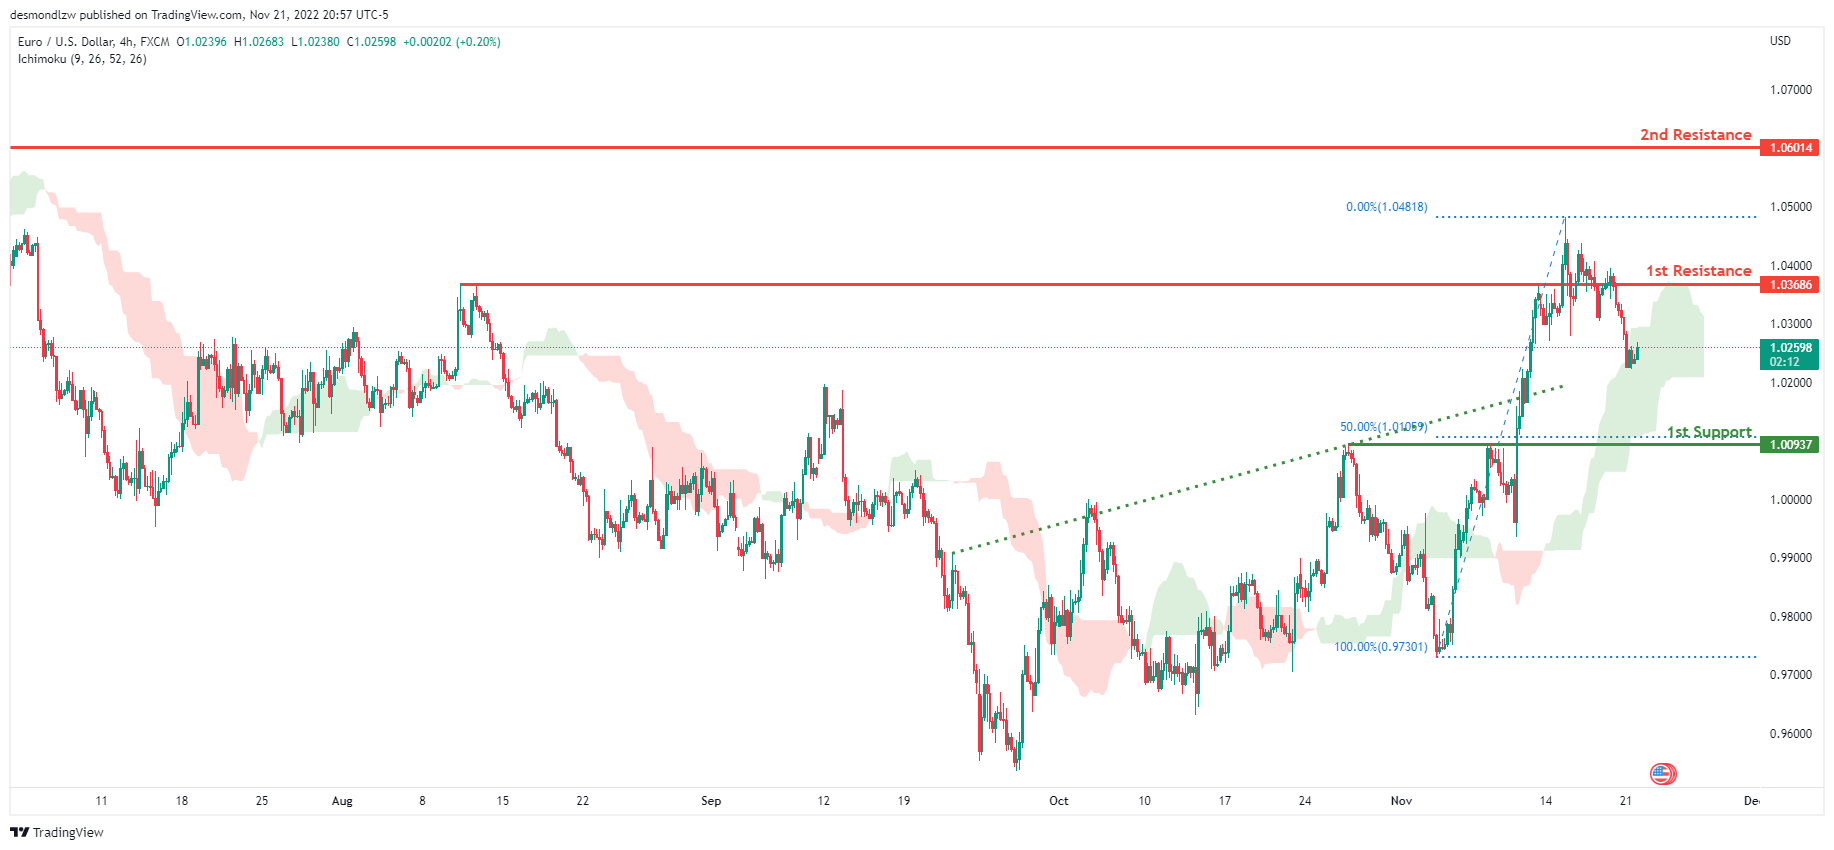
Looking at the H4 chart, my overall bias for EURUSD is bullish due to the current price being above the Ichimoku cloud, indicating a bullish market. To add confluence to this bias, price has also broken above the ascending trend line. If this bullish momentum continues, expect the price to possibly head back up to retest the 1st resistance at 1.03686, where the previous swing high is located. In an alternate scenario, price could possibly head back down towards the 1st support level at 1.00937, where the 50% Fibonacci line is located.
Areas of consideration :
- H4 1st resistance at 1.03686
- H4 1st support at 1.00937
GBP/USD:
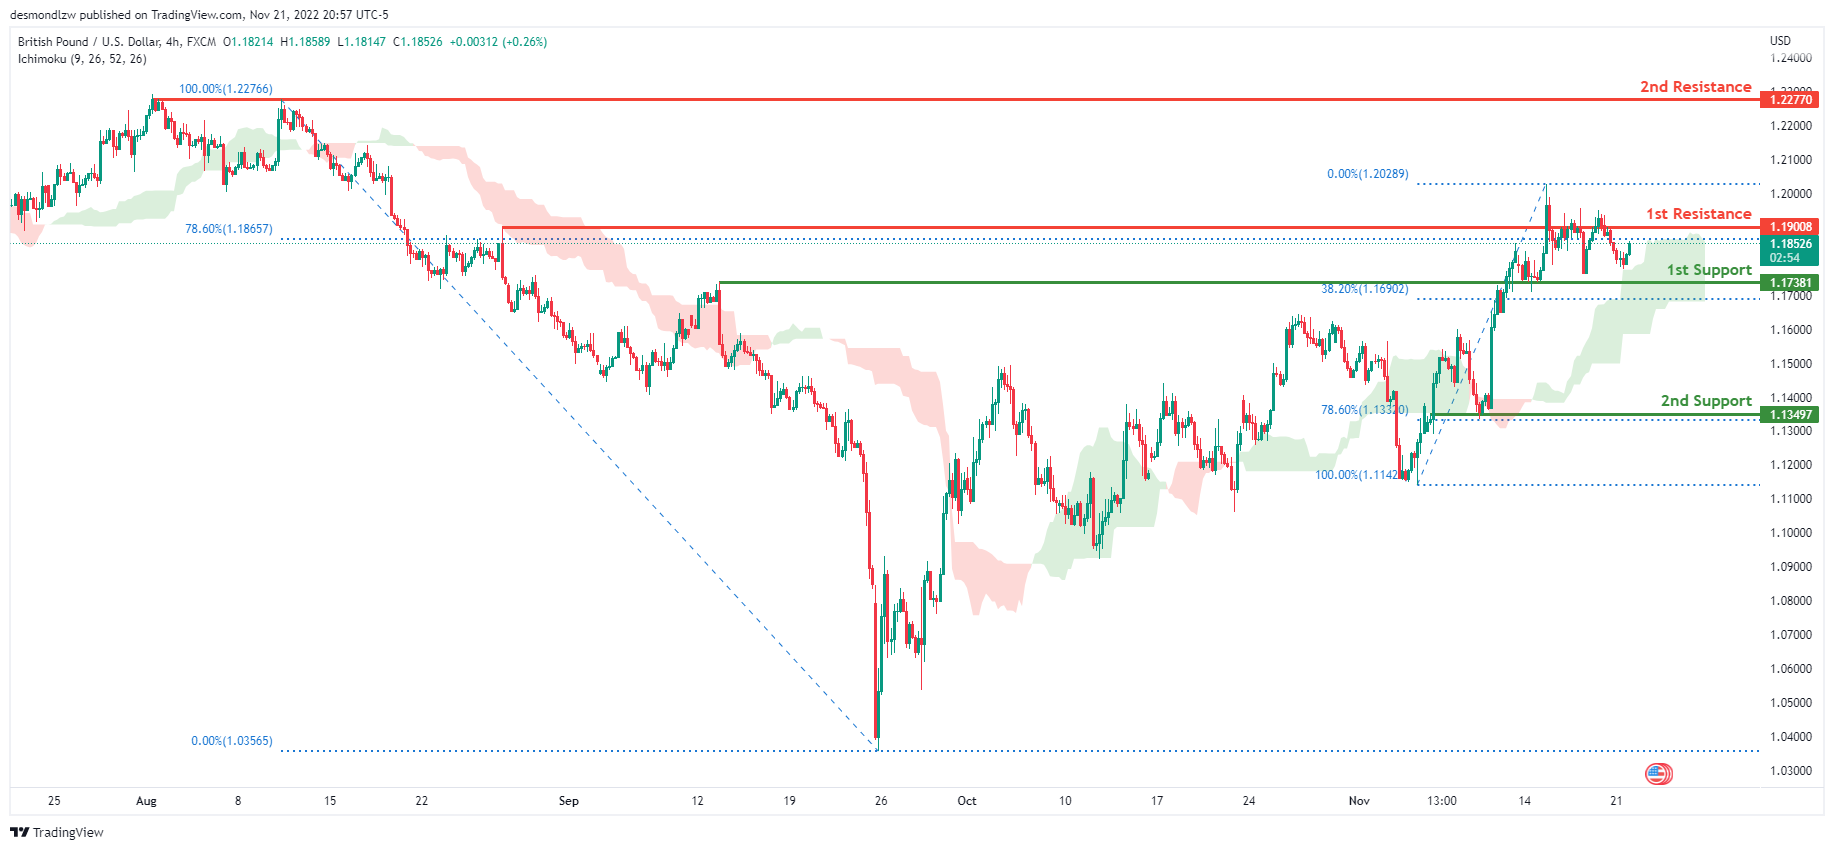
On the H4, the price is moving above the ichimoku cloud, suggesting that the price may break the first resistance level at 1.19008, which corresponds to the 78.6% fibonacci and the previous swing high, before heading to the 2nd resistance line at 1.22770, where the previous swing high is. Alternatively, the price may break the first support level at 1.17381, which is where the previous swing high and 38.2% Fibonacci line are, before moving on to the second support level at 1.13497, which is the 78.6% Fibonacci line.
Areas of consideration:
- H4 1st resistance at 1.19008
- H4 2nd resistance at 1.22770
- H4 1st support at 1.17381
USD/CHF:
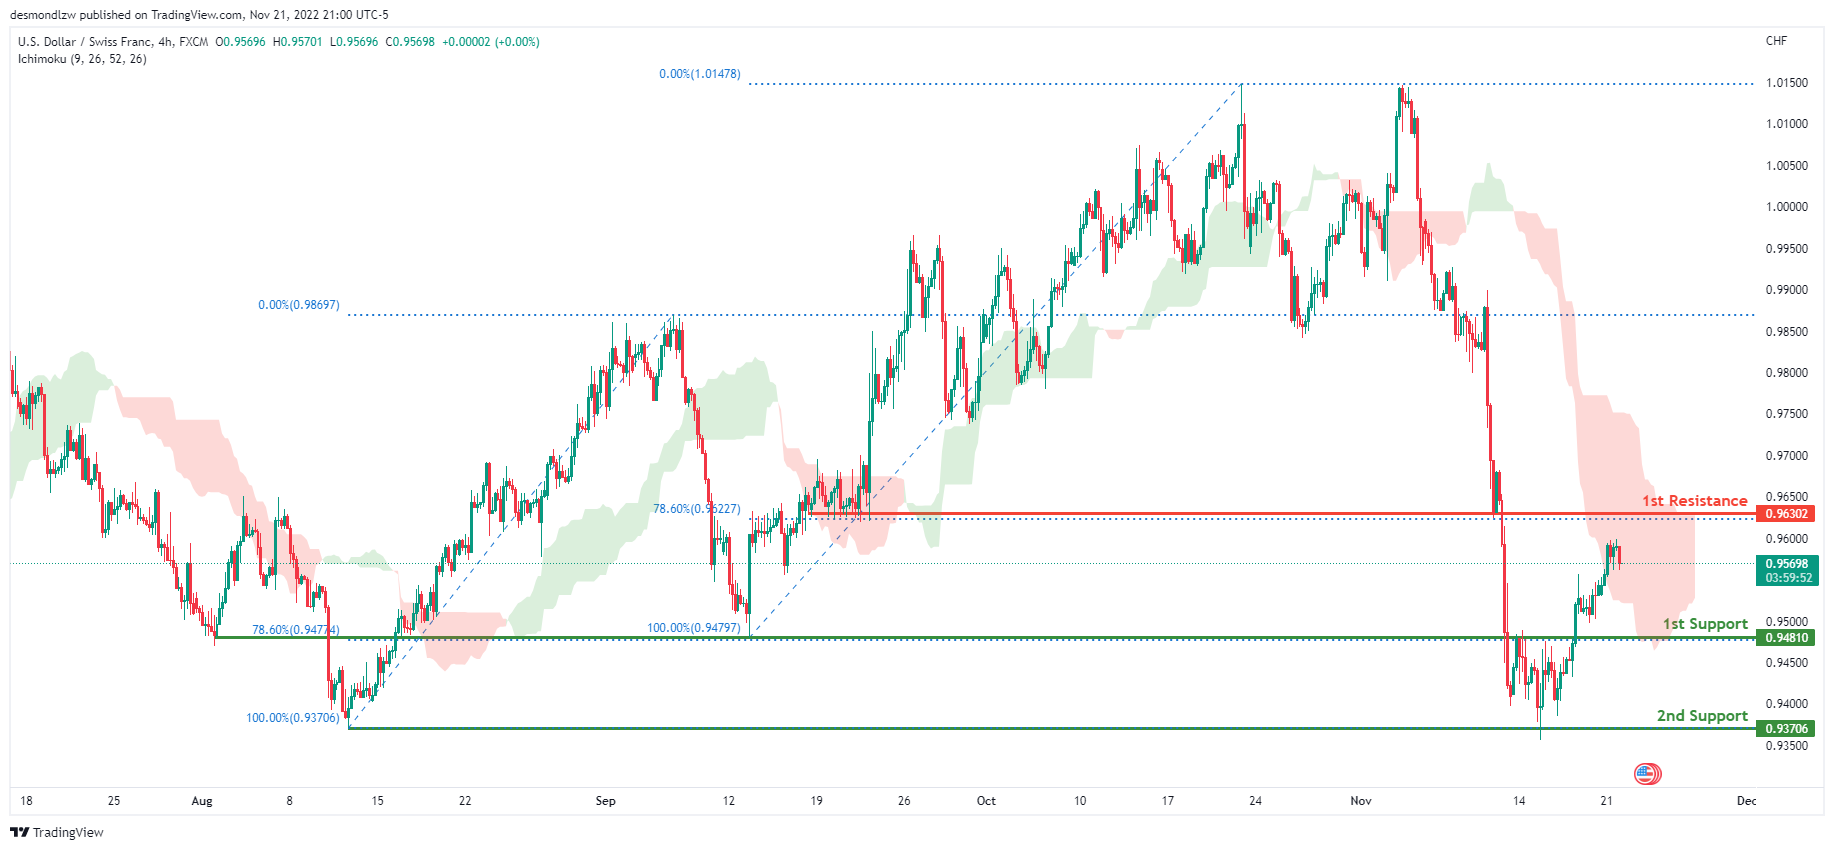
The overall bias for USDCHF on the H4 chart is bearish. In addition, the price is below the Ichimoku cloud, indicating a bearish market. If the current bearish trend continues, the price might move back down to retest the first support line at 0.94810, where the 78.6% Fibonacci line is. In an alternate scenario, price could rise towards the first resistance line at 0.96302, where the 78.6% Fibonacci line is.
Areas of consideration
- H4 1st support at 0.94810
- H4 1st resistance at 0.96302
XAU/USD (GOLD):
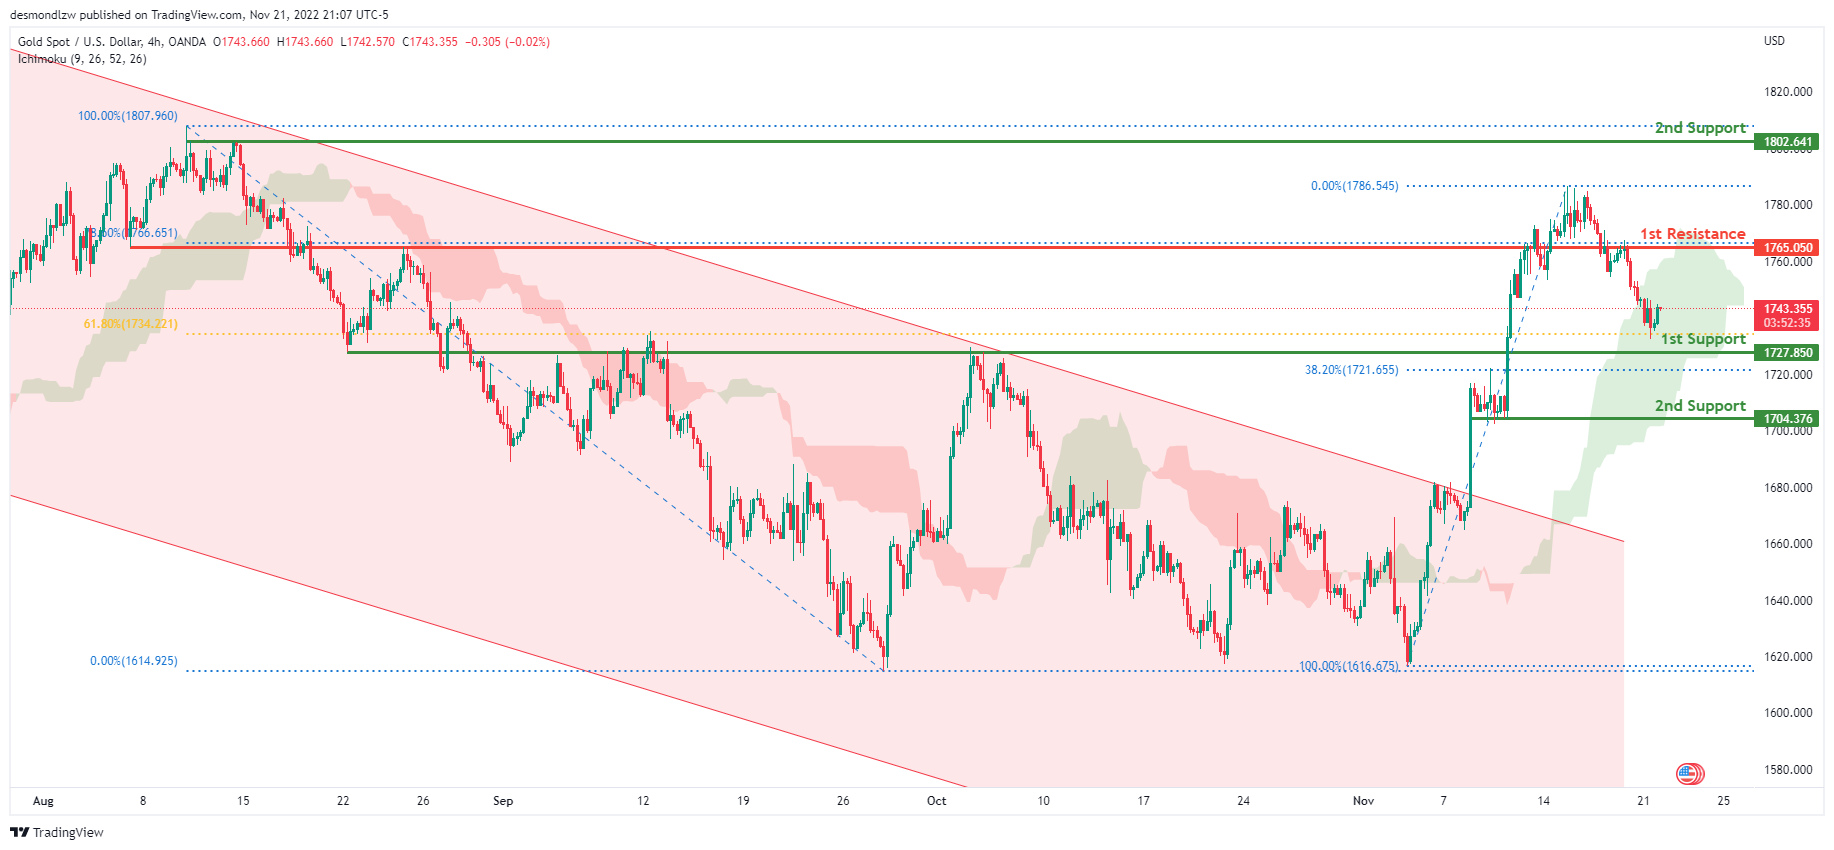
Looking at the H4 chart, my overall bias for XAUUSD is bullish due to the current price being above the Ichimoku cloud, indicating a bullish market. To add confluence to this bias, price has also broken above the descending channel. If this bullish momentum continues, expect price to possibly head towards the 1st resistance at 1765.050, where the 78.6% Fibonacci line is located. In an alternate scenario, price could possibly head back down towards the 1st support level at 1727.850, where the 38.2% and 61.8% Fibonacci lines are located.
Areas of consideration:
- H4 time frame, 1st resistance at 1765.483
- H4 time frame, 1st support at 1727.850
AUD/USD:
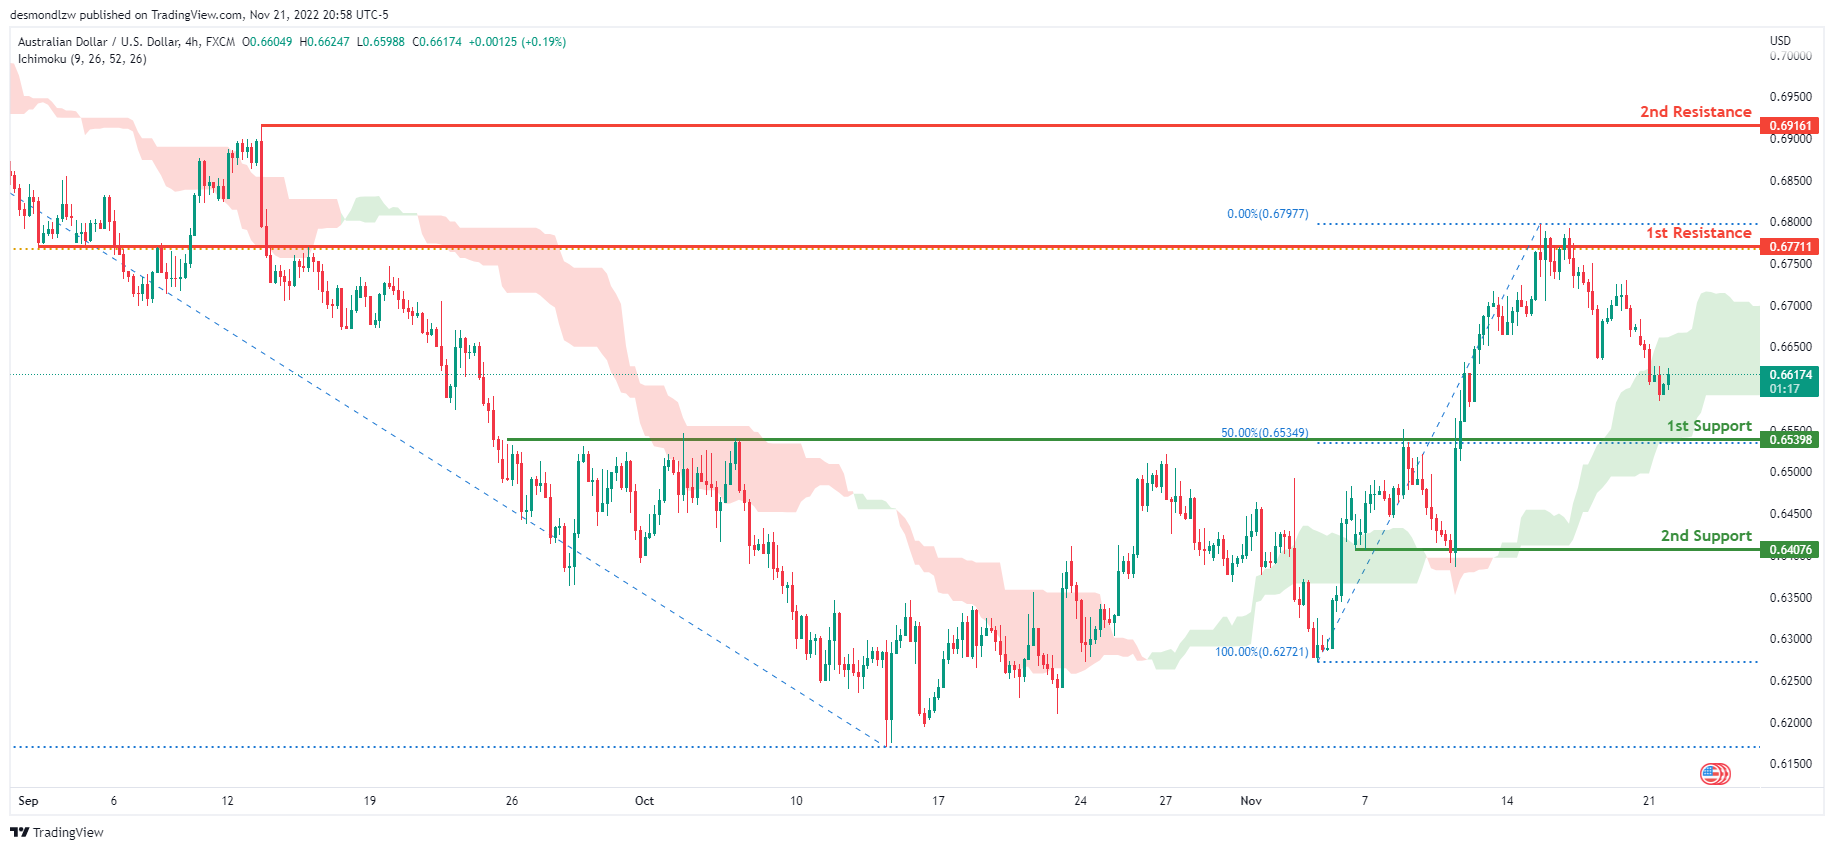
With the price moving above the ichimoku cloud on the H4, we have a bullish bias that the price may break the first resistance at 0.67711, which is in line with the 61.8% fibonacci line, before heading towards the 2nd resistance line at 0.69161, the previous swing high. Alternatively, the price could fall to the first support level at 0.65398, which is marked by the 50% Fibonacci line.
Areas of consideration
- H4, 1st resistance at 0.67711
- H4, 2nd resistance at 0.69161
- H4, 1st support at 0.65398
NZD/USD:
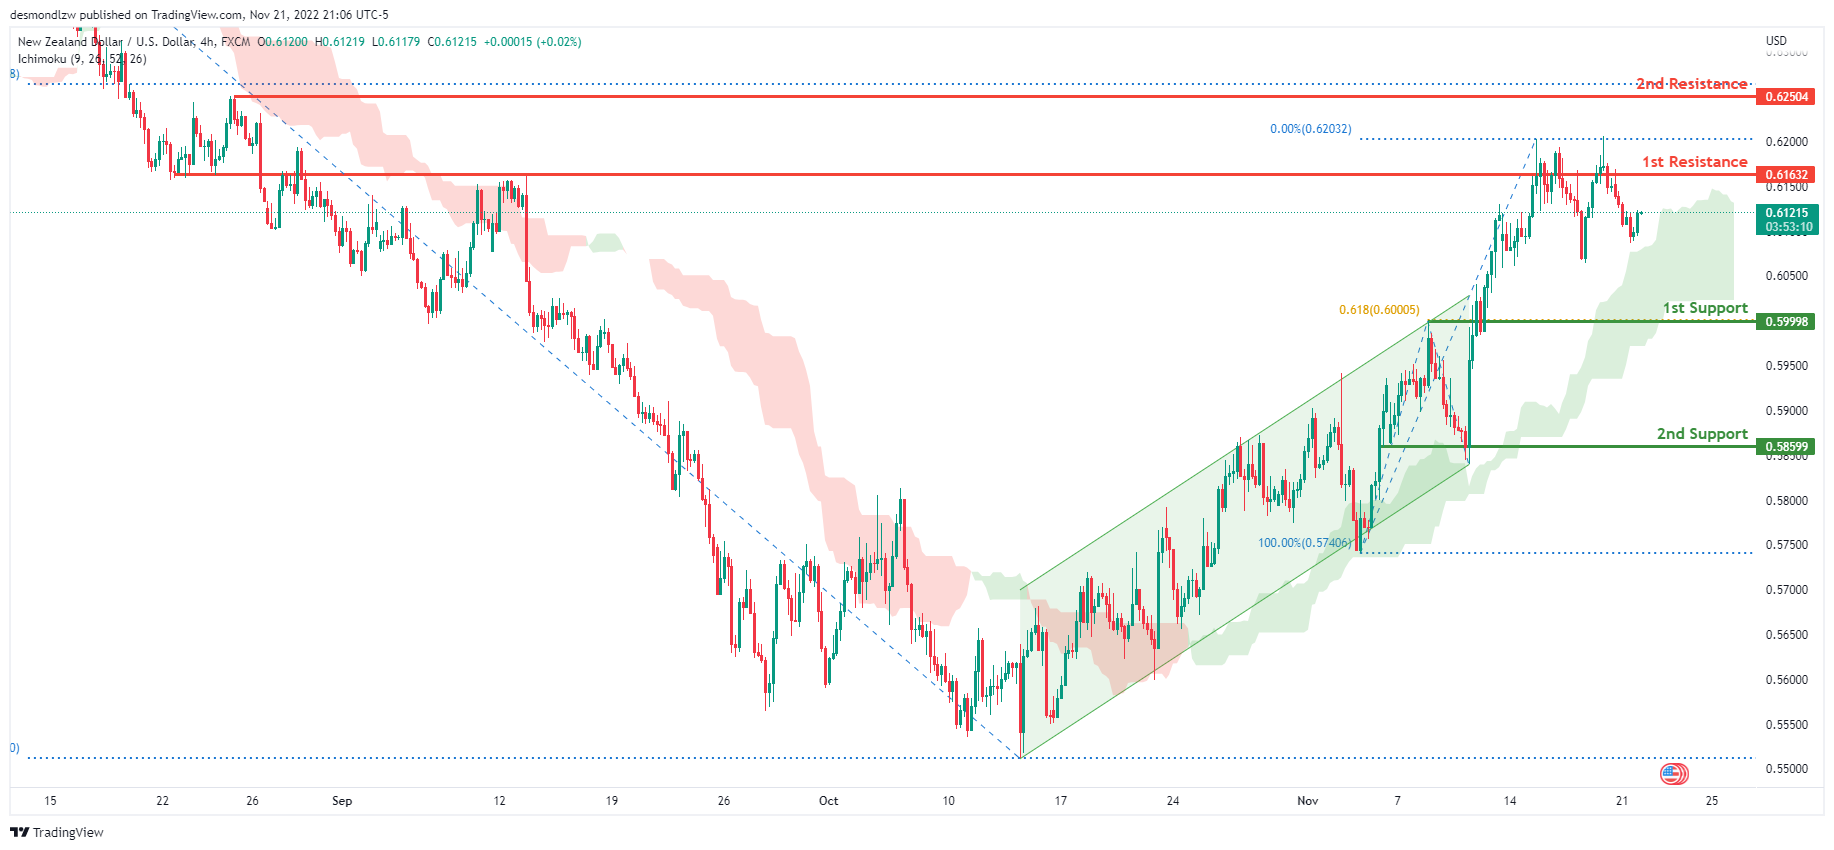
On the H4 chart, the price is moving above the Ichimoku cloud and has broken out of the ascending channel. If this bullish momentum continues, the price may break the 1st resistance at 0.61632, which is in line with the previous swing high and 0% fibonacci line, before heading towards the 2nd resistance line at 0.62504, where the 78.6% Fibonacci line is. Alternatively, the price may head back towards the 1st support at 0.59998, where the 61.8% Fibonacci projection line is located.
Areas of consideration:
- H4 time frame, 1st resistance at 0.61632
- H4 time frame, 1st support at 0.59998
USD/CAD:
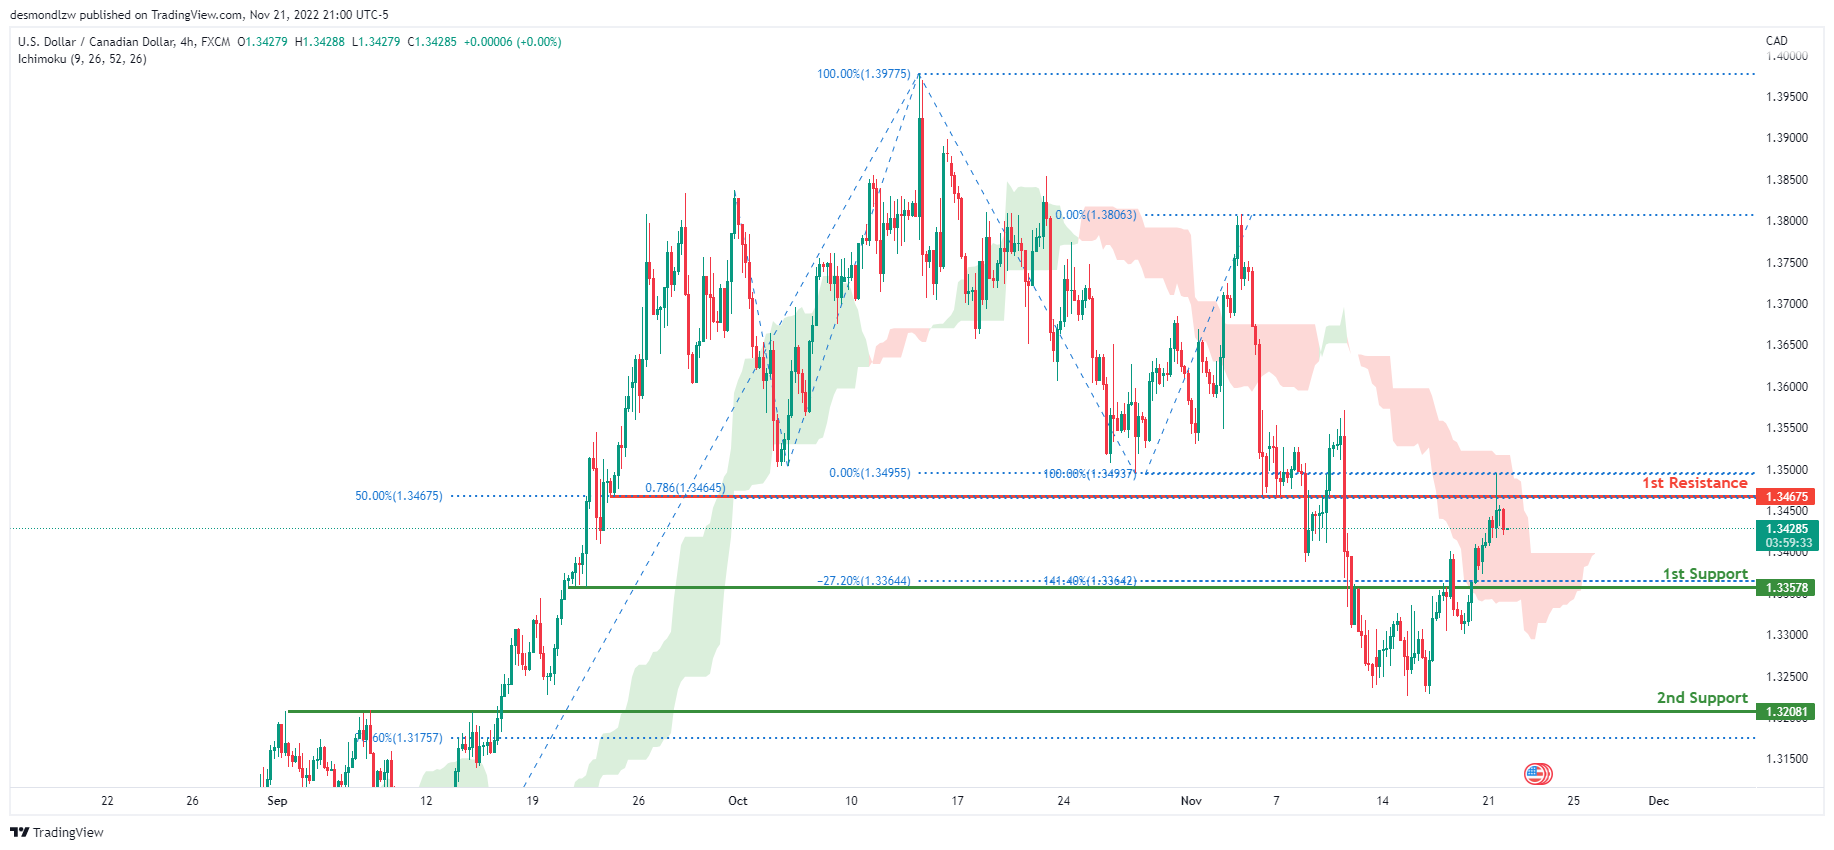
On the H4 chart, the overall bias for USDCAD is bearish. To add confluence to this, the price is below the Ichimoku cloud which indicates a bearish market. If this bearish momentum continues, expect the price to head down towards the 1st resistance line at 1.34675, where the 50% Fibonacci line and 78.6% Fibonacci projection line is. In an alternative scenario, price could head back down to retest the 1st support line at 1.33578, where the -27.2% Fibonacci expansion line and 141.4% Fibonacci line is.
Areas of consideration:
- H4 time frame, 1st resistance at 1.34675
- H4 time frame, 1st support at 1.33578
OIL:
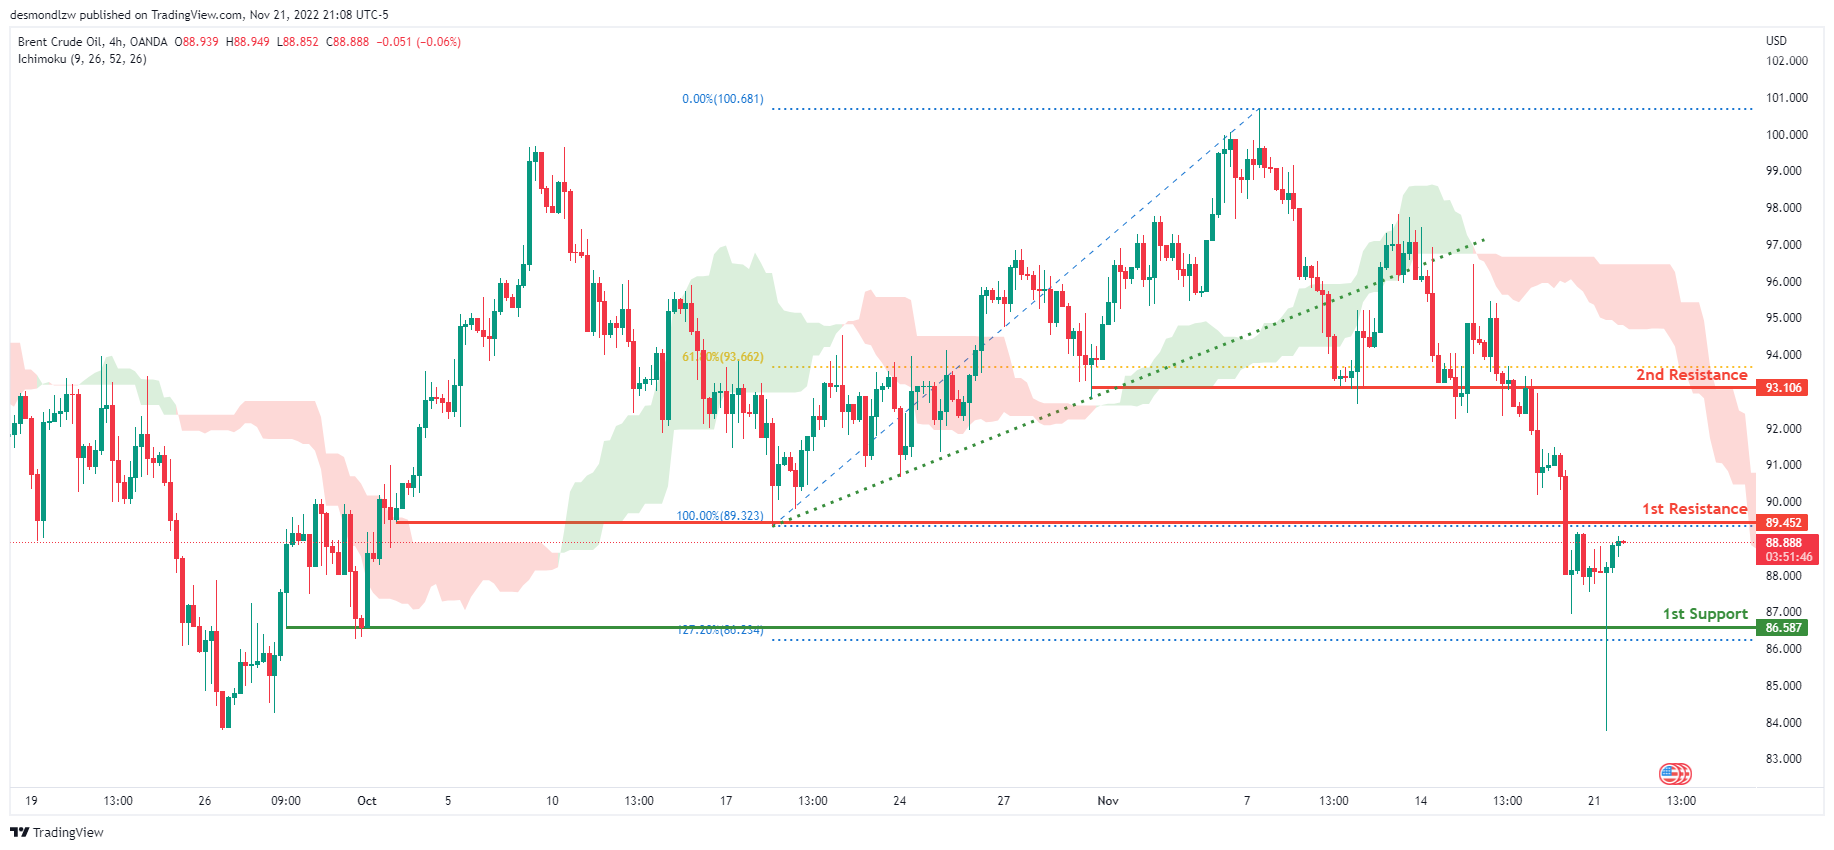
Looking at the H4 chart, my overall bias for BCOUSD is bearish due to the current price being below the Ichimoku cloud, indicating a bearish market. If this bearish momentum continues, expect price to possibly head towards the 1st support at 86.587, where the 127.2% Fibonacci extension line is located. In an alternate scenario, price could possibly head back up towards the 1st resistance level at 89.452, where the previous swing low is located.
Areas of consideration:
- H4 time frame, 1st resistance at 89.452
- H4 time frame, 1st support at 86.587
- H4 time frame, 2nd support at 89.452
Dow Jones Industrial Average:
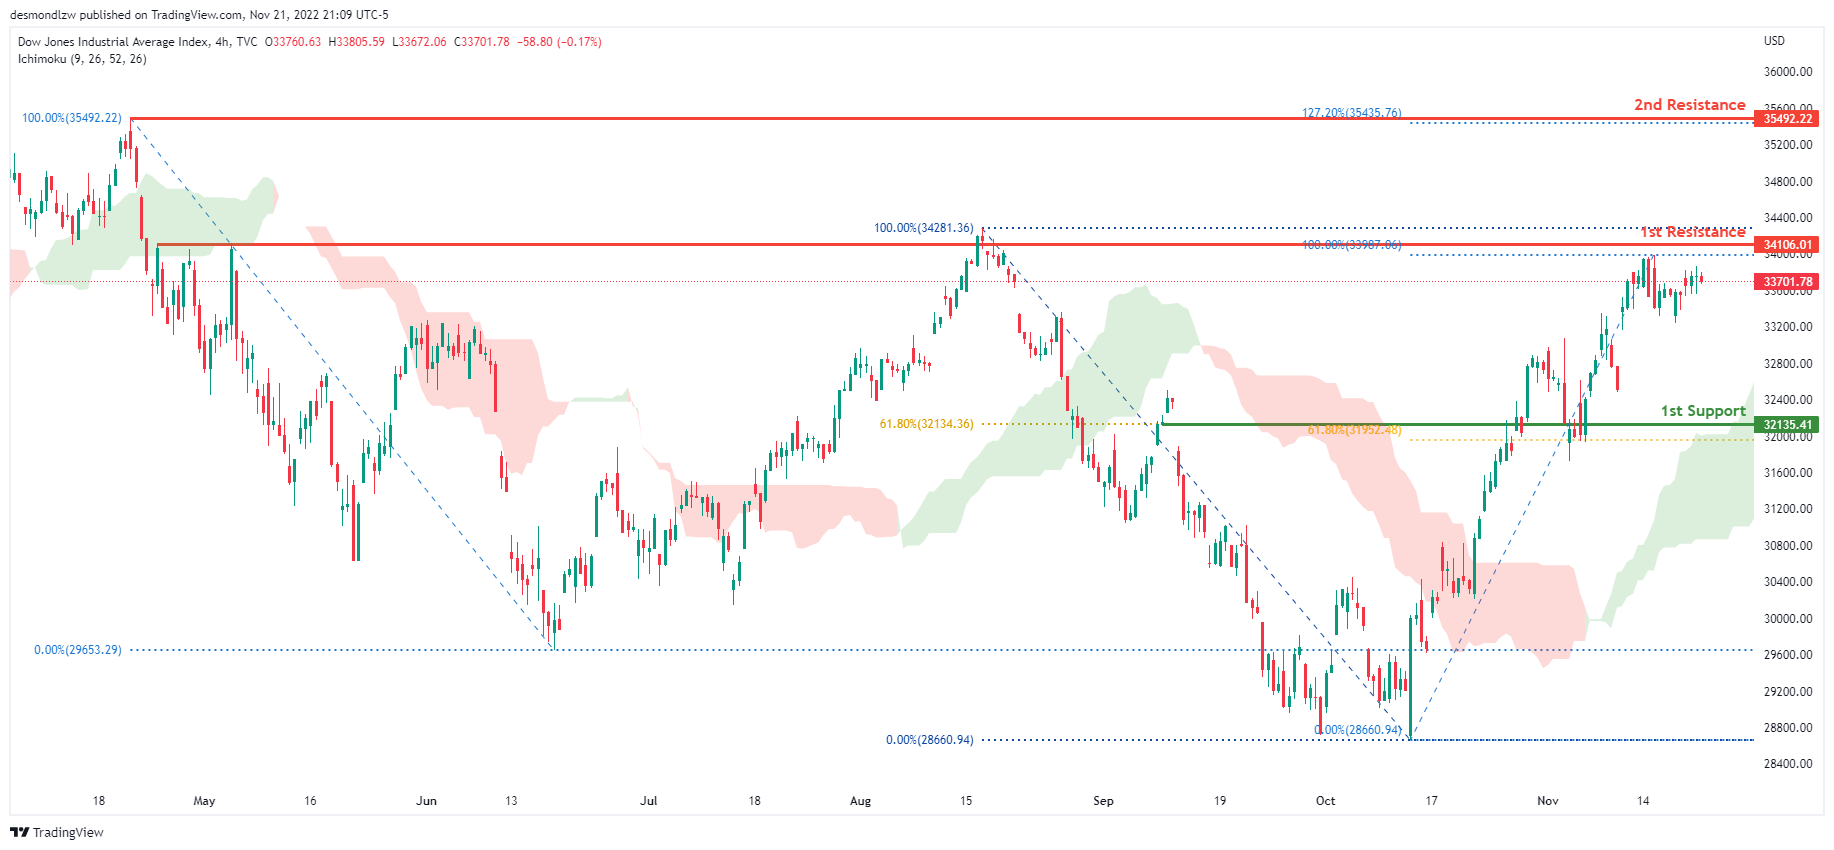
On the H4 chart, the overall bias for DJI is bullish. To add confluence to this, the price is above the Ichimoku cloud which indicates a bullish market. If this bullish momentum continues, expect the price to possibly head towards the 1st resistance at 34106.01 where the previous high and 100% Fibonacci line is located. In an alternative scenario, price could head towards the 1st support line at 32135.41, where 2 of the 61.8% Fibonacci lines are located.
Areas of consideration:
- H4 time frame, 1st support at 32135.41
- H4 time frame, 1st Resistance at 34106.01
DAX:
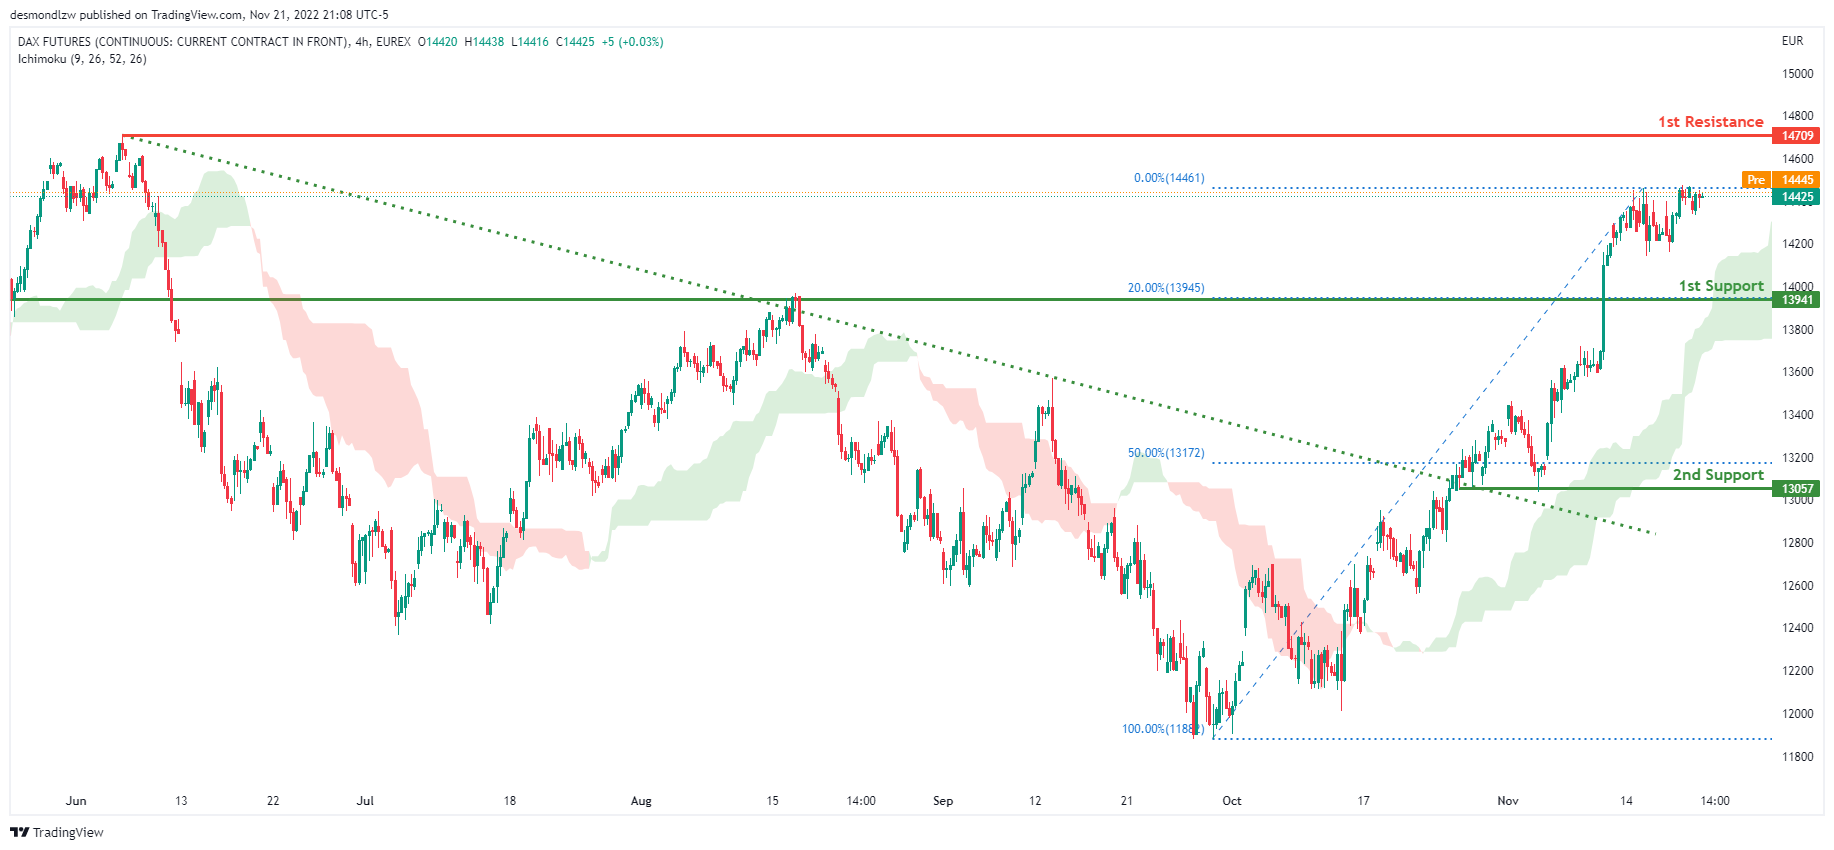
The H4 chart shows a bullish bias, with price breaking through the descending trendline and rising above the Ichimoku cloud. Price is expected to maintain its bullish momentum and rise to the first resistance level at 14709, where the previous swing high is located. Alternatively, the price could fall to the first support level at 13941, which corresponds to the 20% Fibonacci line.
Areas of consideration:
- H4 time frame, 1st resistance is at 14709
- H4 time frame, 1st support is at 13941
ETHUSD:
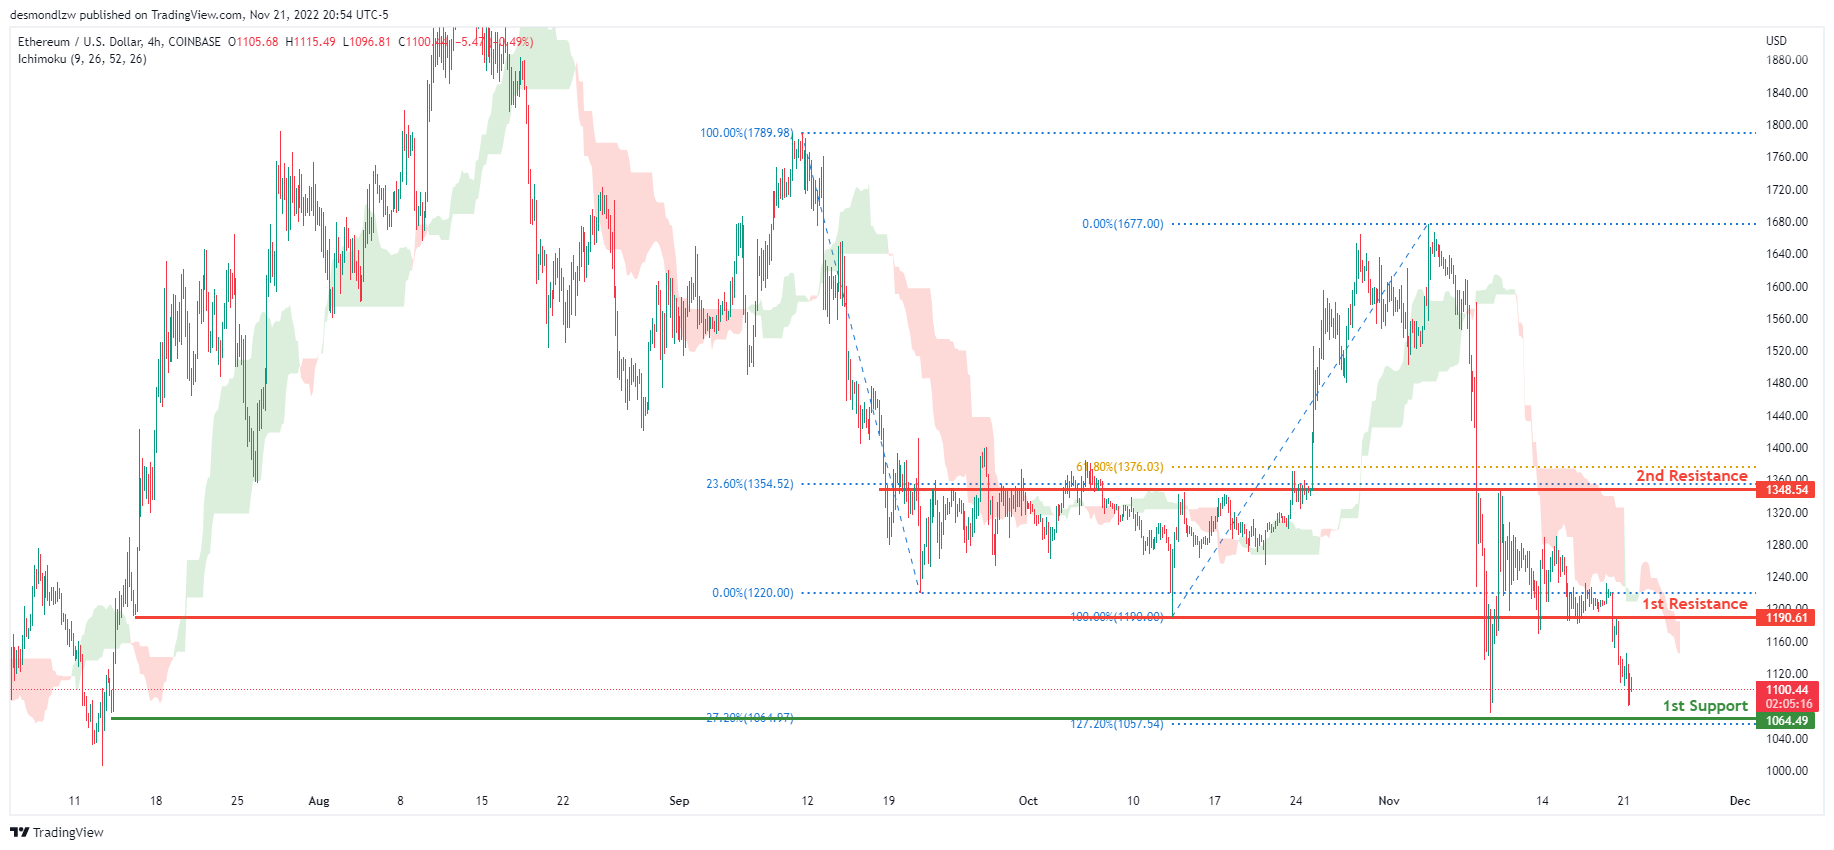
Looking at the H4 chart, my overall bias for XXX is bearish due to the current price being below the Ichimoku cloud, indicating a bearish market .If this bearish momentum continues, expect price to possibly head towards the 1st support at 1064.49, where the -27.2% Fibonacci expansion line and 127.2% Fibonacci extension line are located. In an alternate scenario, price could possibly head back up towards the 1st resistance level at 1190.61, where the previous swing low is located.
Areas of consideration:
- H4 time frame, 1st resistance of 1190.61
- H4 time frame, 1st support at 1064.49
BTCUSD:
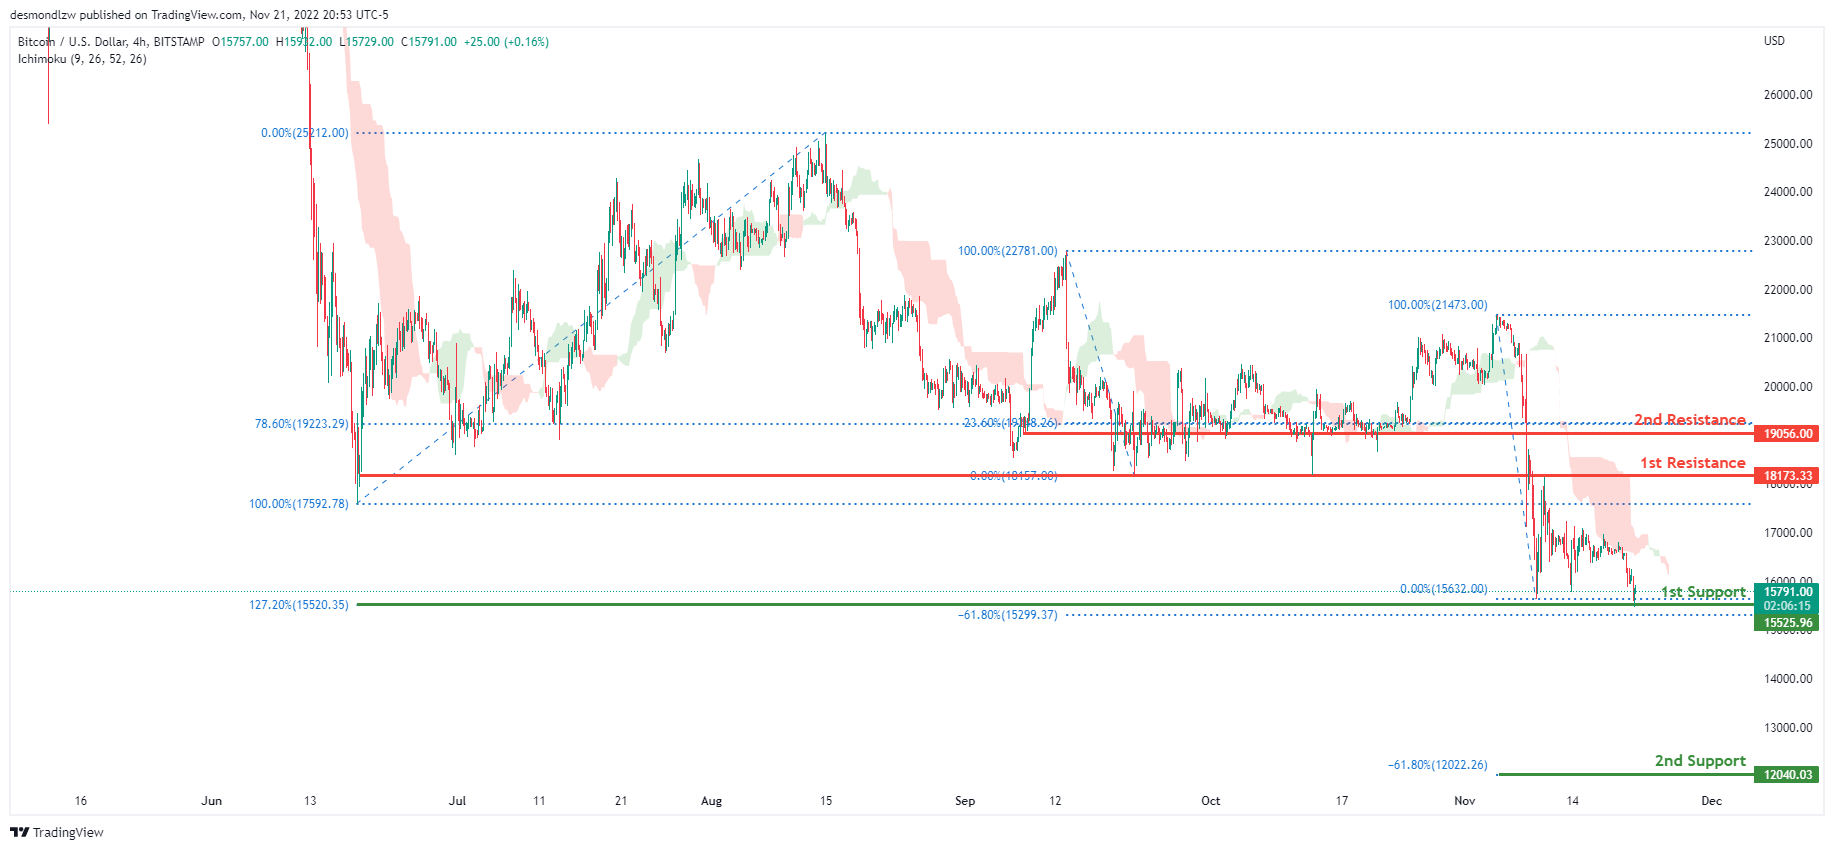
On the H4 chart, the overall bias for BTCUSD is bearish. To add confluence to this, the price is below the Ichimoku cloud which indicates a bearish market. If this bearish momentum continues, expect the price to head towards the 1st support line at 15525.96, where the 127.2% Fibonacci extension line and -61.8% Fibonacci expansion line is located. If price breaks the 1st support line, price could possibly head towards the 2nd support line at 12040.03 where the -61.8% Fibonacci expansion line is located. In an alternative scenario, price could head back up to retest the 1st resistance line at 18173.33, where the previous low and 0% Fibonacci line is located.
Areas of consideration:
- H4 time frame, 1st resistance 18173.33
- H4 time frame, 1st support at 15525.96
- H4 time frame, 2nd support at 12040.03
S&P 500:
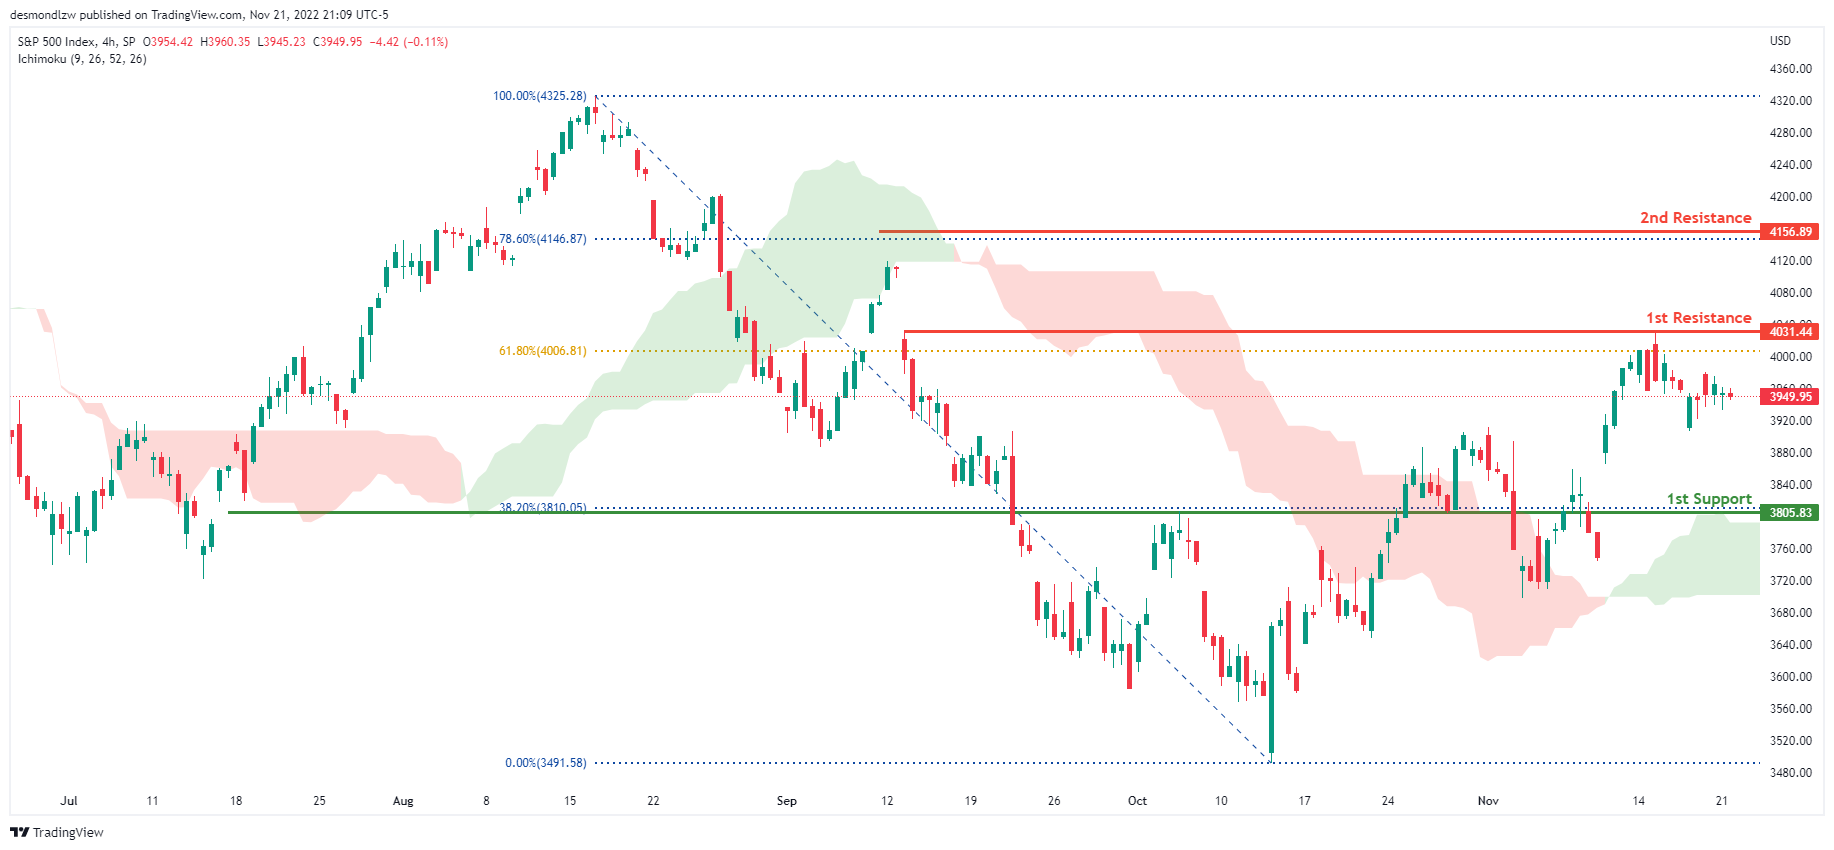
The overall bias for the S&500 on the H4 chart is bullish, with prices above the Ichimoku cloud. If the bullish momentum continues, the price will rise to the first resistance line at 4011.74, where the 61.8% Fibonacci line is located. If the first resistance line is broken, the second resistance line is at 4119.28, which is the previous swing high and the 78.6% Fibonacci line. In an alternate scenario, price could return to the first support line at 3805.83, where the 38.2% Fibonacci line is located.
Areas of consideration:
- H4 time frame, 1st support at 3805.83
- H4 time frame, 1st resistance at 4011.74
- H4 time frame, 2nd resistance at 4119.28
GBP/USD Daily Outlook
Daily Pivots: (S1) 1.1766; (P) 1.1837; (R1) 1.1895; More...
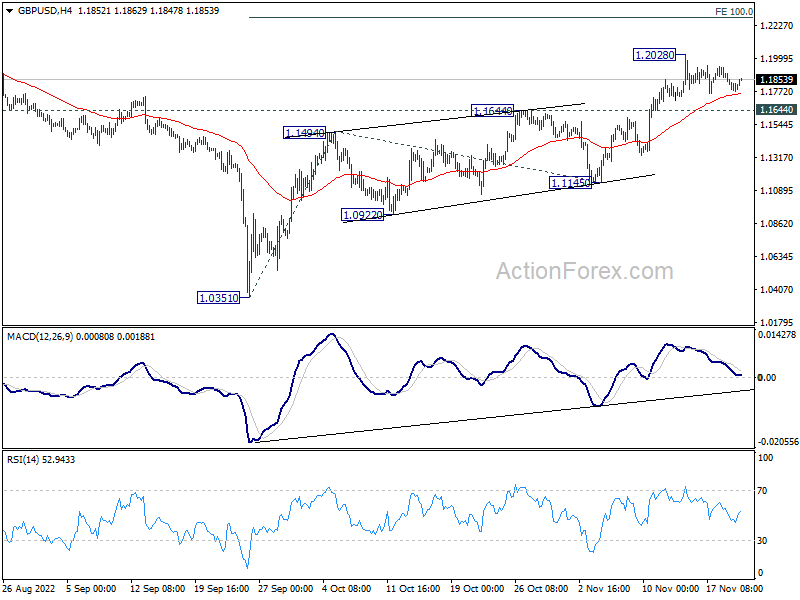
GBP/USD is staying inside tight range below 1.2028 as sideway consolidation continues. Intraday bias remains neutral first, and further rally is expected as long as 1.1644 resistance turned support holds. On the upside, break of 1.2028 will resume whole rise from 1.0351 to 100% projection of 1.0351 to 1.1494 from 1.1145 at 1.2288. However, sustained break of 1.1644 will bring deeper fall to 1.1145 support instead.
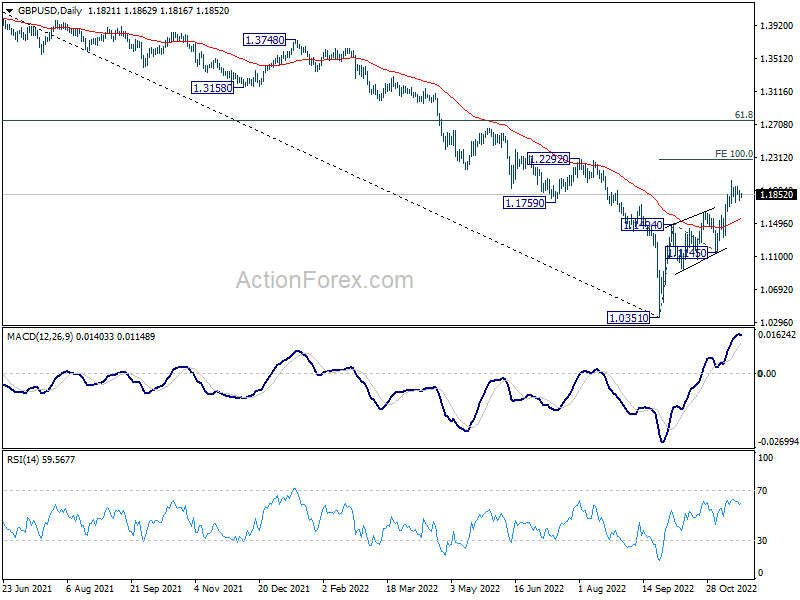
In the bigger picture, rise from 1.0351 medium term bottom is at least correcting whole down trend from 1.4248 (2021 high). Further rise is expected as long as 1.1145 support holds. Next target is 61.8% retracement of 1.4248 to 1.0351 at 1.2759.
Dollar Rally Stalled Once Again, CAD Looks into Retail Sales
Dollar's rebound stalled once again quickly, as risk markets appear to have stabilized. Overall, Swiss Franc is following the greenback as the second strongest for the week so far, then Canadian. Yen is the worst performer, followed by Aussie and Kiwi. Euro and Sterling are mixed with Sterling having an upper hand. Canadian retail sales will be a feature of the day while many central bankers will speak. Hopefully, there would be some more decisive market actions.
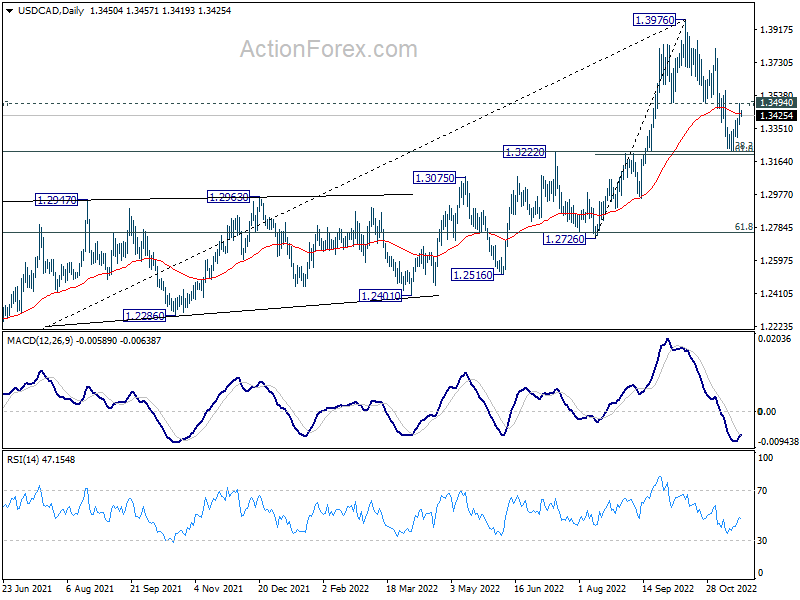
Technically, USD/CAD is now pressing 1.3494 support turned resistance. Decisive break there will indicate that correction from 1.3976 has completed with three waves down to 1.3224. More important, that would be successful defense of 1.3222 key resistance turned support, and reinforce medium term bullishness. In this case, there's prospect of retesting 1.3976 high next.
In Asia, at the time of writing, Nikkei is up 0.70%. Hong Kong HSI is down -0.39%. China Shanghai SSE is up 0.75%. Singapore Strait Times is up 0.51%. Japan 10-year JGB yield is up 0.0007 at 0.246. Overnight, DOW dropped -0.13%. S&P 500 dropped -0.39%. NASDAQ dropped -1.09%. 10-year yield rose 0.007 to 3.825.
Fed Mester: Makes sense that we can slow down a bit
Cleveland Fed President Loretta Mester said yesterday, "we're at a point where we're going to enter a restrictive stance of policy. At that point, I think it makes sense that we can slow down a bit the ... pace of increases."
"We're still going to raise the funds rate, but we're at a reasonable point now where we can be very deliberate in setting monetary policy," she added.
"I think we can slow down from the 75 at the next meeting. I don't have a problem with that, I do think that's very appropriate," Mester said. "But I do think we're going to have to let the economy tell us going forward what pace we have to be at."
"Right now my forecast is that we're going to see some real, good progress on inflation next year," Mester said. "We won't be back to 2%, but we'll see some meaningful progress next year. But if we don't see that, then we're going to have to make sure our policy really reacts to the incoming information. So I can't tell you today what the path going forward will be."
Fed Daly: Premature to take anything off the table
San Francisco Fed President Mary Daly said yesterday that "it's premature in my mind to take anything off the table", regarding the size of rate hike in December. She added. "I'm going into the meeting with the full range of adjustments that we could make on the table.
Daly also said recent CPI data was "way too early to cause a turning point on inflation... One month does not a victory make. It doesn't give me comfort. We will need more good months of data before call this a turning point."
"As we work to bring policy to a sufficiently restrictive stance -- the level required to bring inflation down and restore price stability -- we will need to be mindful," Daly also said. "Adjusting too little will leave inflation too high. Adjusting too much could lead to an unnecessarily painful downturn."
ECB Centeno: Many conditions in place for less than 75bps hike
ECB Governing Council member Mario Centeno was asked yesterday about whether the central bank should hike by less that 75bps in December. He said, "I think there are conditions in place -- many conditions -- for the increase to be less than that number".
Centeno also noted that "rates in Europe continue to be roughly half those in the United States", and that's a good indicator of the difference between the economic fundamentals of the two regions. He also urged restraint in wage growth and company margins as that "could help the ECB a lot in combating inflation".
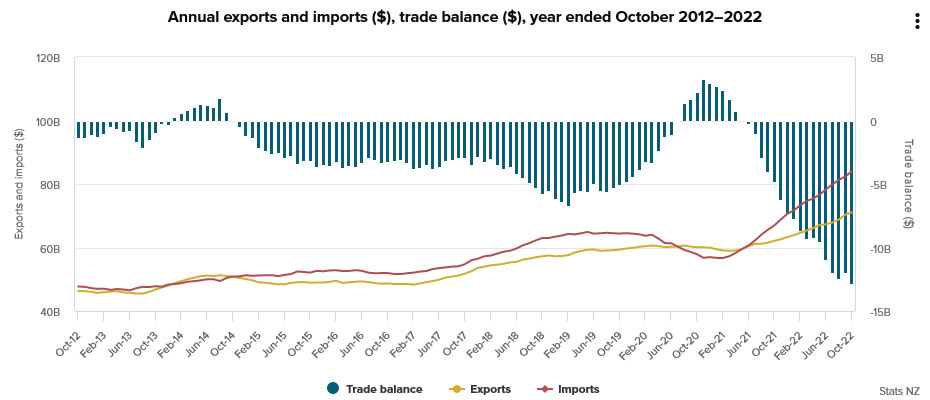
NZ goods exports rose 14% yoy in Oct, imports surged 24% yoy
New Zealand goods exports rose 14% yoy to NZD 6.1B in October. Goods imports rose 24% yoy to NZD 8.3B. Trade deficit widened from NZD -1.7B to NZD -2.1B, much larger than expectation of NZD -1.7B.
Annual goods expects, comparing with the year ended October 2021, rose 14% to NZD 71.1B. Annual goods imports rose 25% to NZD 84.0B. Annual trade deficit swelled to fresh record of NZD -12.9B, comparing to NZD -4.9B a year ago.
Looking ahead
UK public sector net borrowing and Eurozone current account will be released in European session. Later in the day, Canada retail sales will take center stage, while new housing price index will also be published.
GBP/USD Daily Outlook
Daily Pivots: (S1) 1.1766; (P) 1.1837; (R1) 1.1895; More...
GBP/USD is staying inside tight range below 1.2028 as sideway consolidation continues. Intraday bias remains neutral first, and further rally is expected as long as 1.1644 resistance turned support holds. On the upside, break of 1.2028 will resume whole rise from 1.0351 to 100% projection of 1.0351 to 1.1494 from 1.1145 at 1.2288. However, sustained break of 1.1644 will bring deeper fall to 1.1145 support instead.
In the bigger picture, rise from 1.0351 medium term bottom is at least correcting whole down trend from 1.4248 (2021 high). Further rise is expected as long as 1.1145 support holds. Next target is 61.8% retracement of 1.4248 to 1.0351 at 1.2759.
Economic Indicators Update
| GMT | Ccy | Events | Actual | Forecast | Previous | Revised |
|---|---|---|---|---|---|---|
| 21:45 | NZD | Trade Balance (NZD) Oct | -2129M | -1715M | -1615M | -1696M |
| 07:00 | GBP | Public Sector Net Borrowing (GBP) Oct | 19.2B | |||
| 09:00 | EUR | Eurozone Current Account (EUR) Sep | -20.3B | -26.3B | ||
| 13:30 | CAD | New Housing Price Index M/M Oct | 0.20% | -0.10% | ||
| 13:30 | CAD | Retail Sales M/M Sep | 1.10% | 0.70% | ||
| 13:30 | CAD | Retail Sales ex Autos M/M Sep | 1.00% | 0.70% | ||
| 15:00 | EUR | Eurozone Consumer Confidence Nov P | -26 | -28 |
NZ goods exports rose 14% yoy in Oct, imports surged 24% yoy
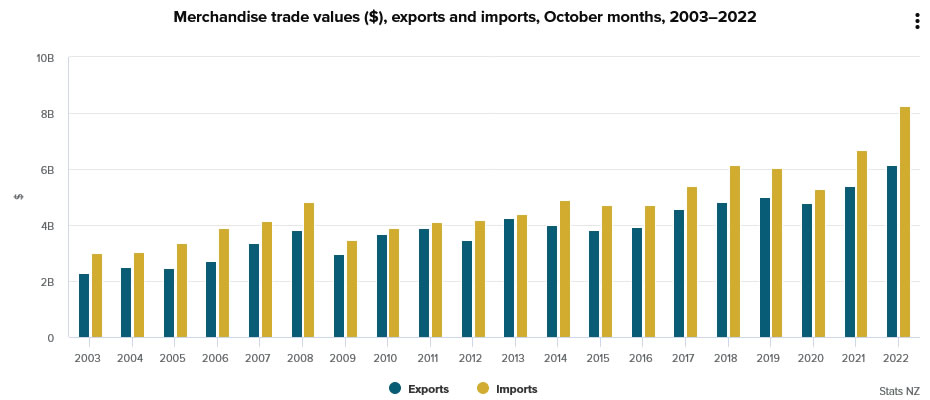
New Zealand goods exports rose 14% yoy to NZD 6.1B in October. Goods imports rose 24% yoy to NZD 8.3B. Trade deficit widened from NZD -1.7B to NZD -2.1B, much larger than expectation of NZD -1.7B.
Annual goods expects, comparing with the year ended October 2021, rose 14% to NZD 71.1B. Annual goods imports rose 25% to NZD 84.0B. Annual trade deficit swelled to fresh record of NZD -12.9B, comparing to NZD -4.9B a year ago.
Fed Mester: Makes sense that we can slow down a bit
Cleveland Fed President Loretta Mester said yesterday, "we're at a point where we're going to enter a restrictive stance of policy. At that point, I think it makes sense that we can slow down a bit the ... pace of increases."
"We're still going to raise the funds rate, but we're at a reasonable point now where we can be very deliberate in setting monetary policy," she added.
"I think we can slow down from the 75 at the next meeting. I don't have a problem with that, I do think that's very appropriate," Mester said. "But I do think we're going to have to let the economy tell us going forward what pace we have to be at."
"Right now my forecast is that we're going to see some real, good progress on inflation next year," Mester said. "We won't be back to 2%, but we'll see some meaningful progress next year. But if we don't see that, then we're going to have to make sure our policy really reacts to the incoming information. So I can't tell you today what the path going forward will be."
Fed Daly: Premature to take anything off the table
San Francisco Fed President Mary Daly said yesterday that "it's premature in my mind to take anything off the table", regarding the size of rate hike in December. She added. "I'm going into the meeting with the full range of adjustments that we could make on the table.
Daly also said recent CPI data was "way too early to cause a turning point on inflation... One month does not a victory make. It doesn't give me comfort. We will need more good months of data before call this a turning point."
"As we work to bring policy to a sufficiently restrictive stance -- the level required to bring inflation down and restore price stability -- we will need to be mindful," Daly also said. "Adjusting too little will leave inflation too high. Adjusting too much could lead to an unnecessarily painful downturn."
ECB Centeno: Many conditions in place for less than 75bps hike
ECB Governing Council member Mario Centeno was asked yesterday about whether the central bank should hike by less that 75bps in December. He said, "I think there are conditions in place -- many conditions -- for the increase to be less than that number".
Centeno also noted that "rates in Europe continue to be roughly half those in the United States", and that's a good indicator of the difference between the economic fundamentals of the two regions. He also urged restraint in wage growth and company margins as that "could help the ECB a lot in combating inflation".
GBP/USD Could Resume Upsides Unless It Breaks This Support
Key Highlights
- GBP/USD climbed higher and tested the 1.2000 resistance zone.
- A major bullish trend line is forming with support near 1.1740 on the 4-hours chart.
- Crude oil price gained bearish momentum below the $80.00 support.
- Canada’s retail sales could decline 0.7% in Sep 2022 (MoM).
GBP/USD Technical Analysis
The British Pound started a major increase above the 1.1650 and 1.1750 resistance levels against the US Dollar. GBP/USD even broke the 1.1800 resistance zone.
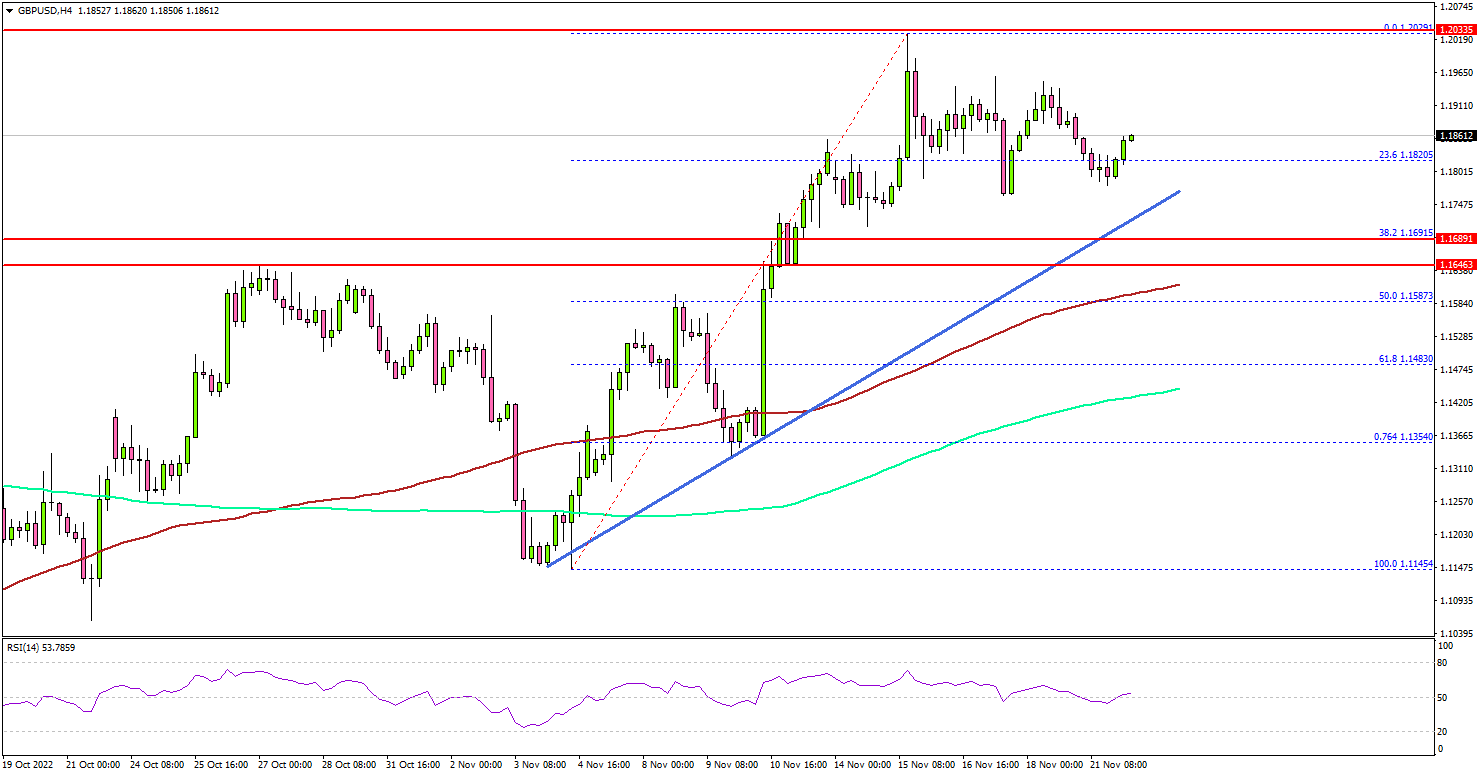
Looking at the 4-hours chart, the pair settled above the 1.1700 level, the 100 simple moving average (red, 4-hours) plus the 200 simple moving average (green, 4-hours).
It traded as high as 1.2029 and recently started a downside correction. It traded below the 1.1950 support level. There was a move below the 23.6% Fib retracement level of the upward move from the 1.1145 swing low to 1.2029 high.
An initial support is near the 1.1750 level. There is also a major bullish trend line forming with support near 1.1740 on the same chart.
The next major support is near the 1.1700 zone, below which the pair might test the 100 simple moving average (red, 4-hours). It is near the 50% Fib retracement level of the upward move from the 1.1145 swing low to 1.2029 high.
The main support sits at 1.1500. A close below the 1.1500 level might start another strong decline. In the stated case, GBP/USD could decline towards the 1.1200 support.
On the upside, an immediate resistance is near 1.1920 level. The next major resistance may perhaps be near 1.2000. Any more gains could set the pace for a move towards the 1.2250 resistance zone.
Looking at oil price, the bears remained in action and there was a strong decline below the $80.00 support zone.
Economic Releases
- Canadian Retail Sales for Sep 2022 (MoM) – Forecast -0.7%, versus +0.7% previous.
- Canadian Retail Sales ex Autos for Sep 2022 (MoM) – Forecast -0.4%, versus +0.7% previous.