Sample Category Title
Fed Harker expects slowing hike pace approaching a sufficiently restrictive stance
Philadelphia Fed President Patrick Harker said, "in the upcoming months, in light of the cumulative tightening we have achieved, I expect we will slow the pace of our rate hikes as we approach a sufficiently restrictive stance." Next year, "I expect we will hold at a restrictive rate for a while to let monetary policy do its work," he added.
"As long as we are moving consistently and meaningfully to collapse inflation down, I think again we can continue to raise as we need to but also pause when it makes sense along that path," Harker explained. "I just don't think we need to go way up...and way down, that doesn't make sense to me, policy wise."
Harker also noted there are signs of deceleration in the economy. "Credit card purchase data indicate that consumer spending, which comprises around 70 per cent of economic activity in the United States, is slowing, with services and retail leading the decline," he said. "Investment in housing has weakened, and even the boom in manufacturing, which has buoyed the economy, is starting to wane."
Sunset Market Commentary
Markets
And markets corrected further. Moves since the lower-than-expected US inflation print simply extended with economic data serving as an accelerator. European stocks add a meagre 0.6% but US indices open with very solid 0.9-2.5% gains. The US NY Empire manufacturing index surpassed the bar with ease, coming in at 4.5 vs a -6 consensus. But new orders turned negative again and the outlook for six months ahead turned deeper below zero from -1.8 to -6.1. Financial markets definitely also spotted the PPI easing by more than expected. Headline factory inflation for September was revised lower to 8.4% and slowed to 8% vs 8.3% expected. Core gauges retreated from 7.1% to 6.7% and 5.6% to 5.4%. All of them are still at elevated levels but similar to last Thursday’s CPI, that’s of no importance to markets who just want to see pressure decline, both on prices and on the Fed. US yields at some point shed between 4.2 and more than 9 bps at the front and 4.6-6 bps at the longer end of the curve before taking back some bps as the US session gets going. German yields dip 3.3 to 6 bps across the curve. The 10y yield yesterday didn’t confirm the break beneath its upward sloping trend channel but is attacking that support area again today (2.09%). The European swap counterpart is losing 6.6 bps and is closing in on the June interim high/October correction low 2.72/2.73%. Gilts underperform global peers with yields advancing 1.4 to 3.8 bps. We didn’t see a specific trigger but noted that UK yields bottomed around the time of a £2.25bn 2046 bond auction that tailed and had a lower bid-cover than previously. The UK labour market report was a mixed bag, unable to provide any guidance.
The dollar stayed in the defensive overall, unable to benefit from a potential flare-up in the Ukraine war after Russian missiles hit two residential buildings. The trade-weighted greenback (DXY) slipped from 107 to 105.94 at the time of writing. Intermediate support (June 2022 interim high) is being tested as we speak with the actual next reference already located at 105.01 (May 2022 interim high/38.2% retracement of the 2021-2022 rally). EUR/USD got an early morning technical boost as EUR/USD surpassed the 1.035/7 resistance area. The pair went as high as 1.048 before paring gains to just north of 1.04. The dollar extends declines against Asian currencies too. USD/JPY erases yesterday’s uptick to trade back below 139. At 7.04, USD/CNY is trading at the weakest since mid-September. Staying in Anglo-Saxo spheres, sterling is doing well. EUR/GBP dropped from 0.88 to 0.871 while GBP/USD with a little help from the dollar tested the 1.20 big figure.
News Headlines
Several Central European countries reported a first estimate of Q3 GDP growth today. However, most often only a global estimate was provided, without much details of on the composition/structure of demand. A positive surprise came from Poland showing growth of 0.9% Q/Q and 3.5Y/Y. As such the country avoided a technical recession after a quarterly decline of -2.1% in Q2. Romania also grew 1.3% Q/Q and 4.0% Q/Q. Central bank governor Mugur Isarescu earlier this week indicated that consumption and EU funds continue to support domestic demand. Growth in Slovakia eased from 1.3% Y/Y tot 1.2% Y/Y, but did beat expectations for a slowdown tot 0.9% Y/Y. Activity growth in Bulgaria printed at a solid 0.6% Q/Q resulting in 4.3M Y/Y growth (compared to 4.2% in Q2). The country today also published slightly softer than expected October CPI data at 0.9% M/M but with the Y/Y figure easing from 18.7% to 3.2%. Hungarian Q3 growth contracted (-0.4% Q/Q) slowing Y/Y growth to 4.0% from 6.5% in Q2.
According to Financial Times reporting, Russia and Ukraine are close reach a deal on the exports of grain from Ukraine. The current agreement expires on Saturday if one of the parties makes an objection to the prolongation. The FT says that the extension is being negotiated by the UN on the sidelines of the G20 meeting in Bali. In the compromise, amongst others, Russia is reported to be able to use the same route that was used for the Ukraine’s agricultural exports. It would also be allowed to use a pipeline for ammonia through Ukraine to the port of Odessa. The agreement is also said to include a technical solution of the payments of Russian exports of grain and fertilizer.
GBP/USD: Cable Cracks Psychological 1.20 Barrier
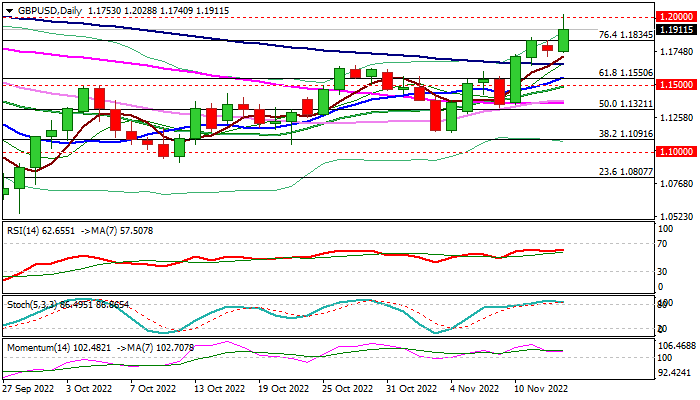
Cable dented psychological 1.20 barrier and traded above this level for the first time since mid- August, in fresh acceleration higher after bulls paused for consolidation on Monday.
Weaker dollar on better than expected US PPI data which added to hopes that US inflation has peaked and holding in downward trajectory, provided fresh boost to sterling.
Bulls broke above 1.1834 (Fibo 76.4% of 1.2293/1.0348) where the action was repeatedly rejected in past two days and added to bullish signals on probe above 1.20 barrier.
Close above 1.1834 to keep bulls intact, though overbought conditions on daily chart cannot rule out deeper pullback towards broken 100DMA (1.1651) where dips should be contained.
Res: 1.2000; 1.2028; 1.2048; 1.2100
Sup: 1.1834; 1.1749; 1.1710; 1.1651
EURUSD: Euro Hits Multi-Month High on Probe Above 200DMA
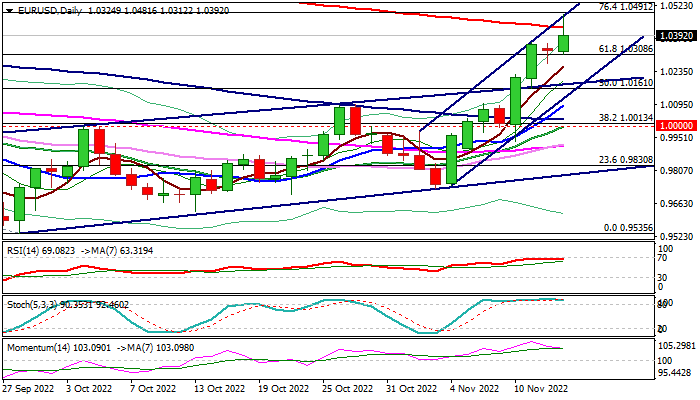
The Euro resumed its steep uptrend after bulls took a brief breather on Monday and cracked 200DMA (1.0428), hitting the highest in 4 –1/2 months.
Fresh advance peaked at 1.0481, just ahead of barriers at 1.0491/1.0500 (Fibo 76.4% of 1.0786/0.9535 bear-leg/psychological).
Subsequent easing below 200DMA warn that bulls face strong headwinds at pivotal resistance zone, as daily studies are overbought and strong bullish momentum is easing, though the action is still lacking firmer signal of pullback as stochastic is ranging deeply in the overbought territory and RSI is moving around the overbought borderline.
Broken Fibo 61.8% (1.0308) offers initial and solid support, with extended dips expected to find ground above broken upper borderline of bull-channel (1.0197) to keep bulls in play.
Sustained break above 200DMA would generate initial bullish signal which would look for confirmation on lift above pivotal 1.0500 zone and open way towards targets at 1.0786/1.0844 (May 30 peak/base of falling weekly cloud).
Res: 1.0428; 1.0491; 1.0550; 1.0614.
Sup: 1.0364; 1.0308; 1.0259; 1.0197.
European Final CPIs and Yield Gap
With all the focus on G20 and COP27, many European leaders have been out of the continent. News has been relatively sparse, which has allowed the shared currency to drift higher. In the last couple of weeks, it made a couple of runs at parity before finally breaking through thanks to US CPI figures. That opens the question of whether the trend will continue higher, or there will be a return to parity.
For now, the market has to run without proximal intervention from central banks. Both the ECB and the Fed won't meet until a month from now. Thus, focus has to remain on data. Recent data has been relatively good for both economies. But with the different postures of the central banks, market reaction has been in opposite directions.
Wait.. data has been good?
The most recent macro data from Europe was September industrial production that came in above expectations. But that had more to do with forecasts being relatively low due to higher energy prices and reports through the summer that businesses were either reducing output on winding down operations. Since the expectations were priced in, it's a relatively good result.
The main issue is that Europe has high and growing inflation, while recent trends in the US suggest inflation is slowing down. Better economic data means the ECB can keep hiking. Meanwhile, lower inflation in the US means that the Fed could be less aggressive.
How wide can the gap get
The main driver of the Euro below parity with the dollar was the gap in real interest rates. Sure, there was also an effect from general market uncertainty driving investors to the safety of the dollar. But, real yields tell the story about whether it's worth more to have funds in dollars or Euros. Or, more accurately considering the circumstances, which loses less value.
With America's high interest rates and slowing inflation, it means that holding dollars loses less value than holding Euros with lower interest rates and higher inflation. But, that situation might have reached its, and be about to reverse. As inflation in the shared economy pushes into the double digits, the ECB will be under more pressure to raise rates. With inflation coming down, the Fed could slow hiking. Meaning that the real rate gap could be about to shrink, and that could push the Euro higher.
So, no return to parity?
Not necessarily. Over the last couple of days, Fed officials have come out to say that the market is getting ahead of itself on speculation that rates won't be rising as fast. And ECB officials have been relatively quiet over the past few days. The initial move higher in the EURUSD was driven more by speculation than reaction to direction from either central bank.
Europe is still facing a challenging winter, and that might keep the ECB from tightening for a while longer. Meanwhile, US core inflation is still triple the Fed's target. Both sides of the Atlantic seem to agree that inflation is pushing recession risk. Hence, the argument that they have to care about a recession is likely also an argument that they will double down on the fight against inflation.
Eurozone October Final CPI is expected to be confirmed at 10.7%, up from 9.9% in September.
Pound Clears the Way Up
The British pound is on the offensive, having risen to a three-month high against the dollar thanks to a developing correction in the latter, market stabilisation following the change of government and pro-inflationary news.
Jobless claims rose by 3.3K in October after a 3.9K increase in September. September’s data was an impressive revision from the initially reported 25.5K jump. Statistics now point to stabilisation in the number of unemployed near 1.5m – 2009-2013 levels. A month ago, the UK labour market was losing jobs rather briskly.
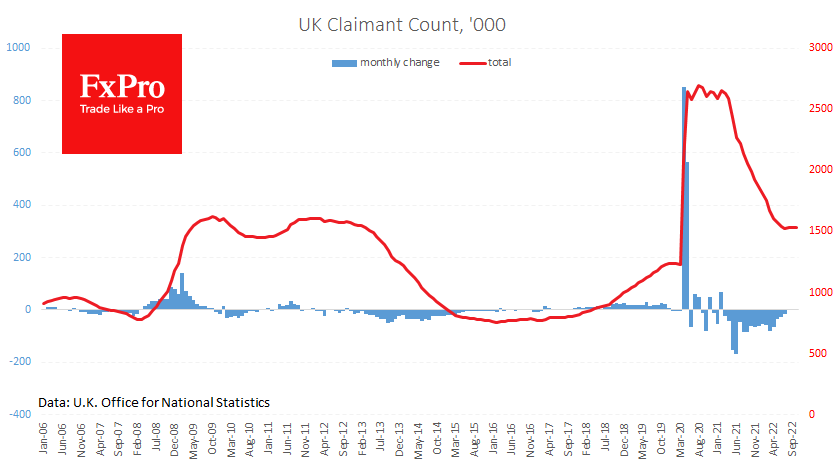
More positivity comes from the wage dynamics. Taking bonuses into account, they are up 6% in the three months to August, better than the 5.5% a month earlier. In addition, rumours are circulating about the Prime Minister’s intention to raise the minimum wage, which could further push wages.
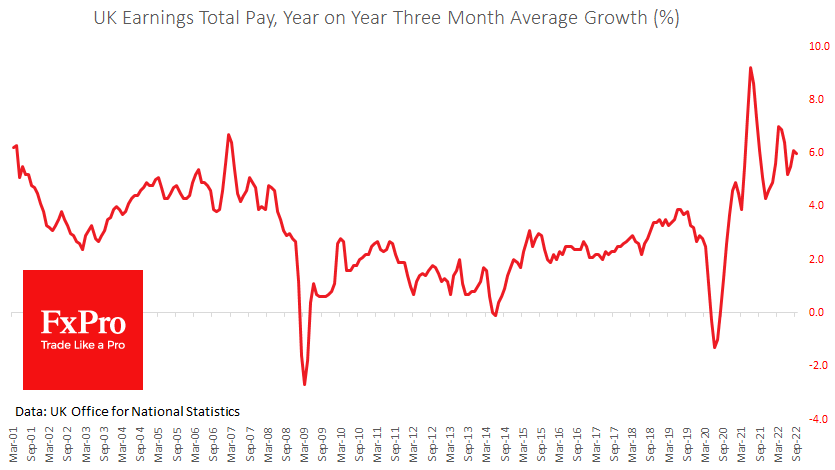
A more substantial than previously estimated labour market and new signs of rising wages create more incentive for the Bank of England to raise interest rates actively.
GBPUSD surpassed 1.19 on Tuesday, adding more than 15% to the lows at 1.0330 set on September 26th. The Cable overcame a pullback of more than 38.2% of the amplitude of the decline from the highs of 2021 to the lows of September, a significant Fibonacci retracement level. Breaking this mark indicates that we see more than a corrective bounce in the Pound before a new round of decline.
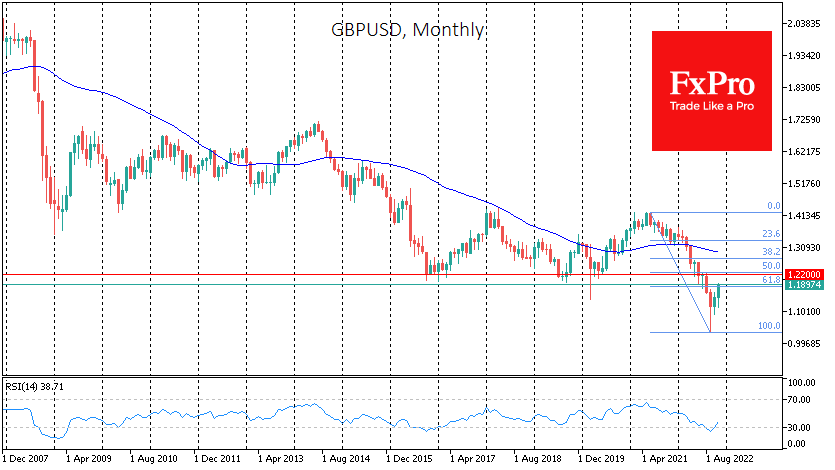
However, despite the impressive size of the rally of the last almost two months, the Pound still has the potential to rally further due to the extreme previous oversold condition. The nearest local bullish target looks to be the 1.2200 area, where the pair received support on declines in 2016, 2019 and 2020.
There are chances that this area will now turn into an equally significant resistance. This area is also close to the 50% mark of the decline, a move above which could clear the way further up.
DXY: Bears Have Established Their Positions
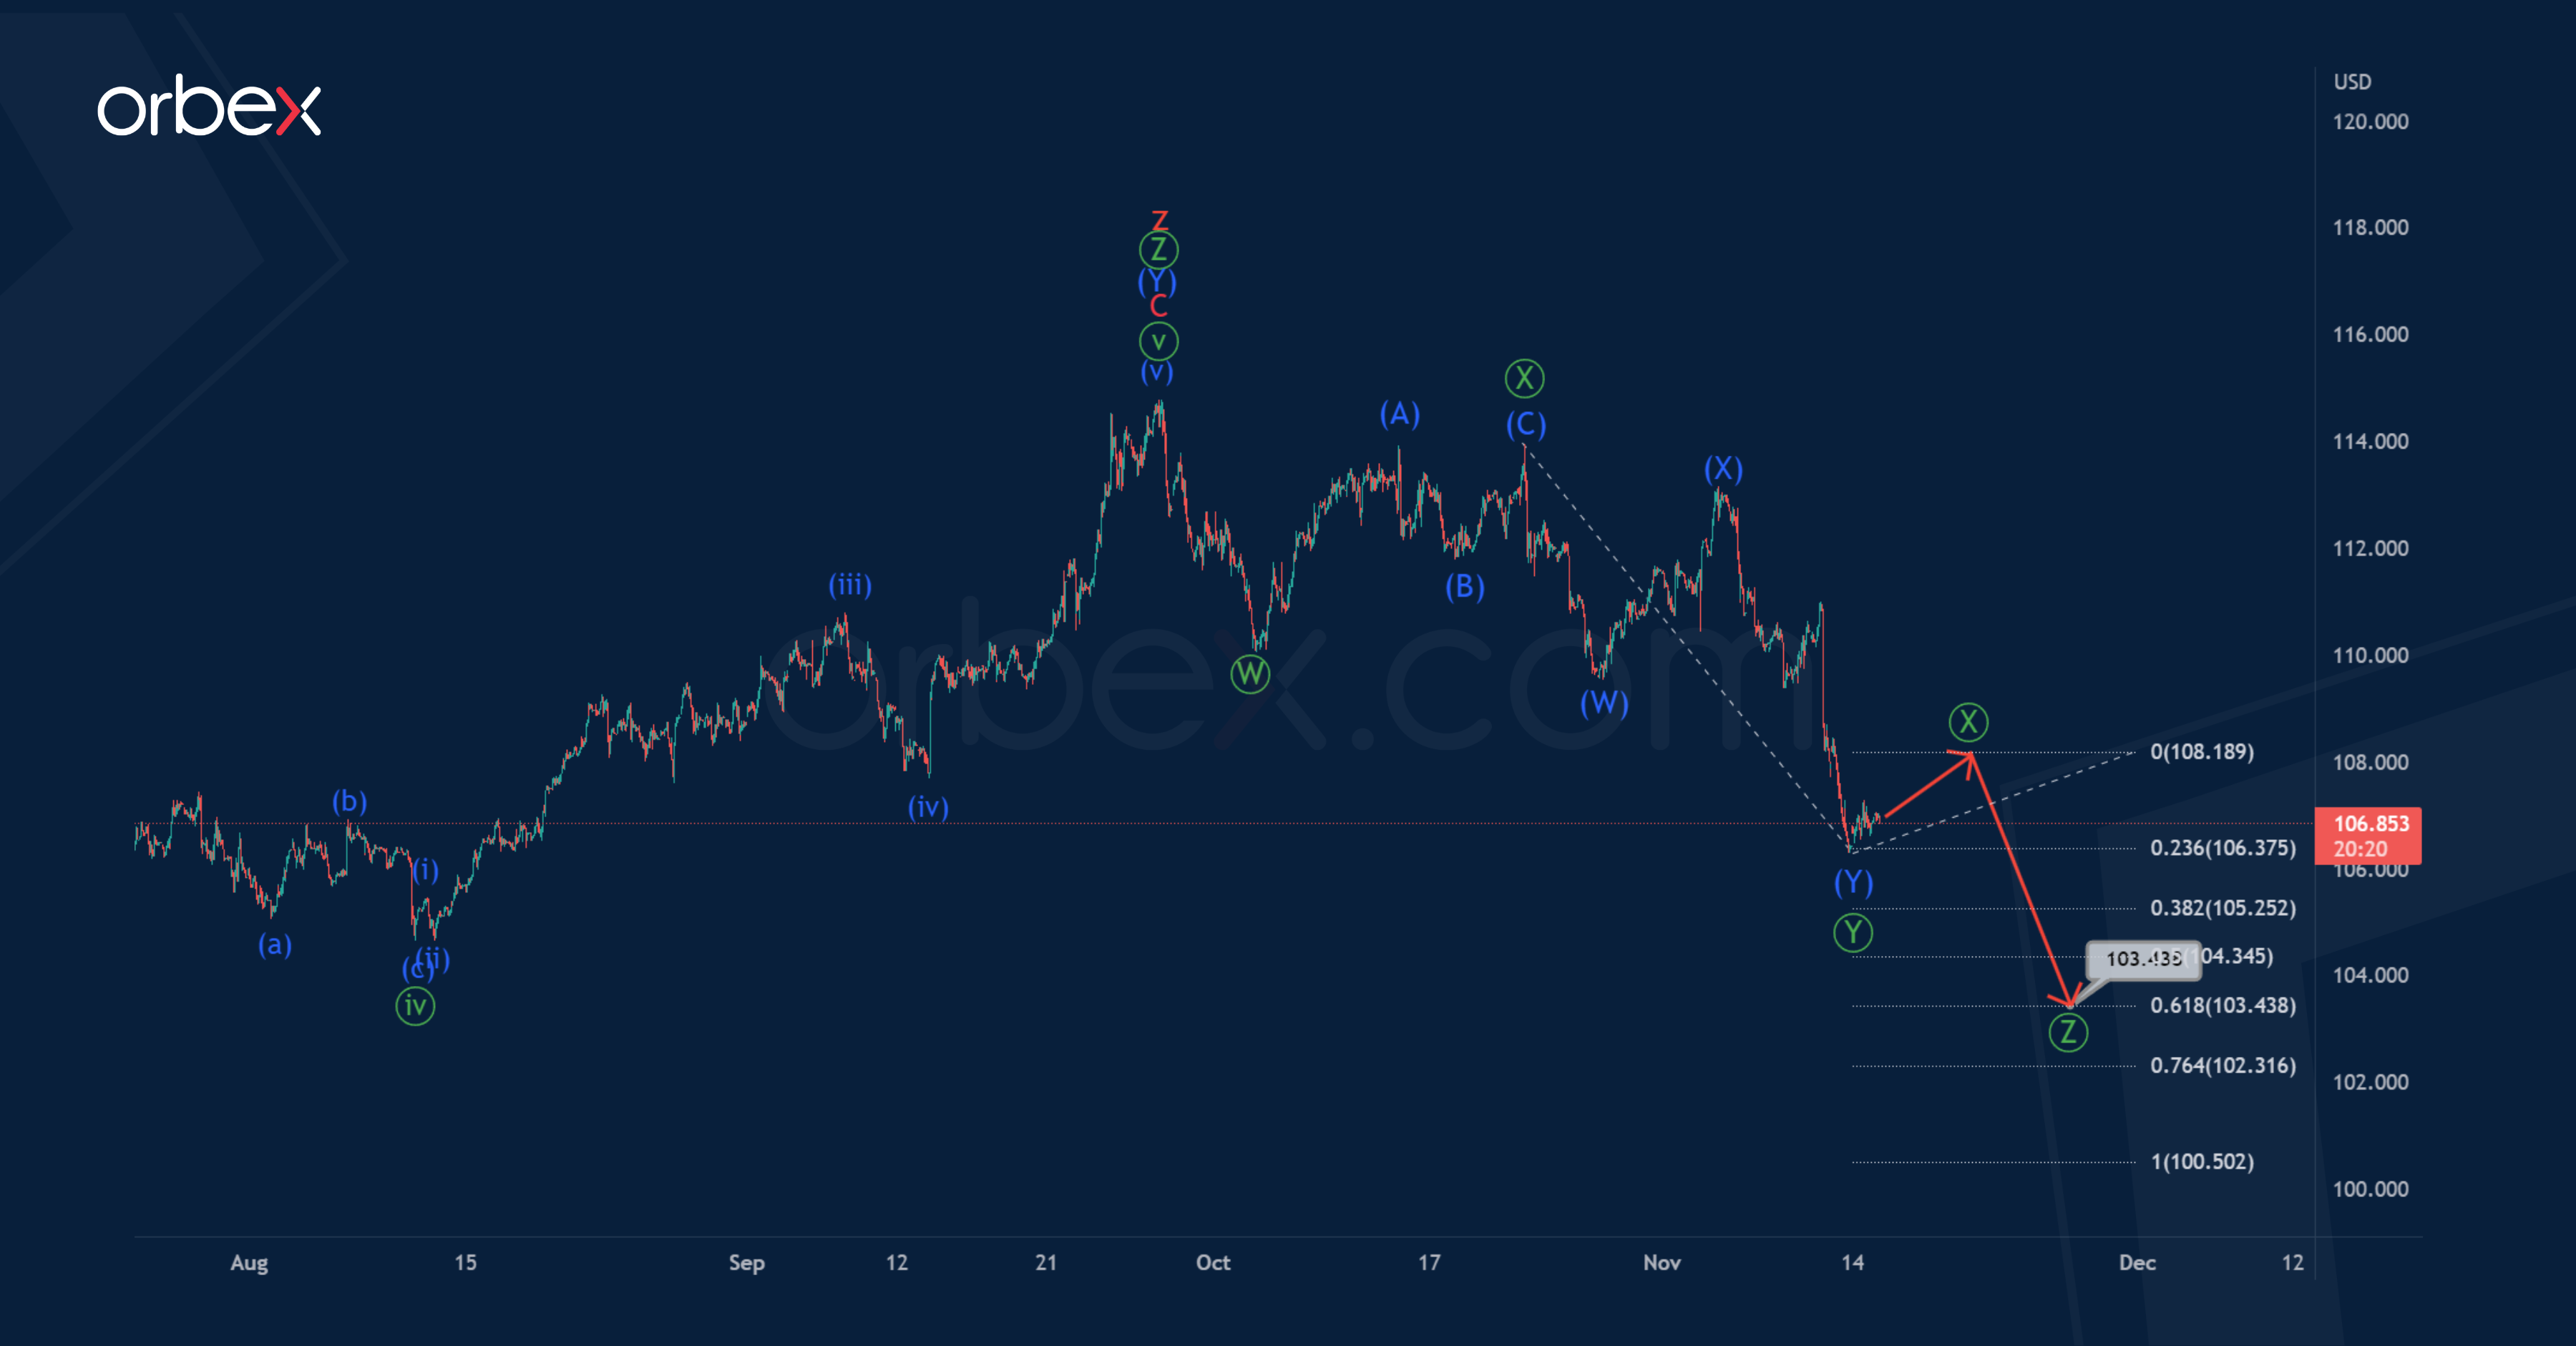
The 1H timeframe of the DXY index shows the completion of the global corrective trend, which took the form of a triple zigzag consisting of five main cycle waves w-x-y-x-z.
Thus, at present, the market could begin the formation of the initial part of a new bearish trend.
It is assumed that the bears form a triple zigzag pattern. The sub-waves look completed. In the near future, after a slight correction in the intervening wave, the price is expected to continue falling in the primary wave. Its end is expected to reach 103.43. At that level, it will be at 61.8% of wave.
Let's consider an alternative option in which the formation of a cycle triple zigzag will continue.
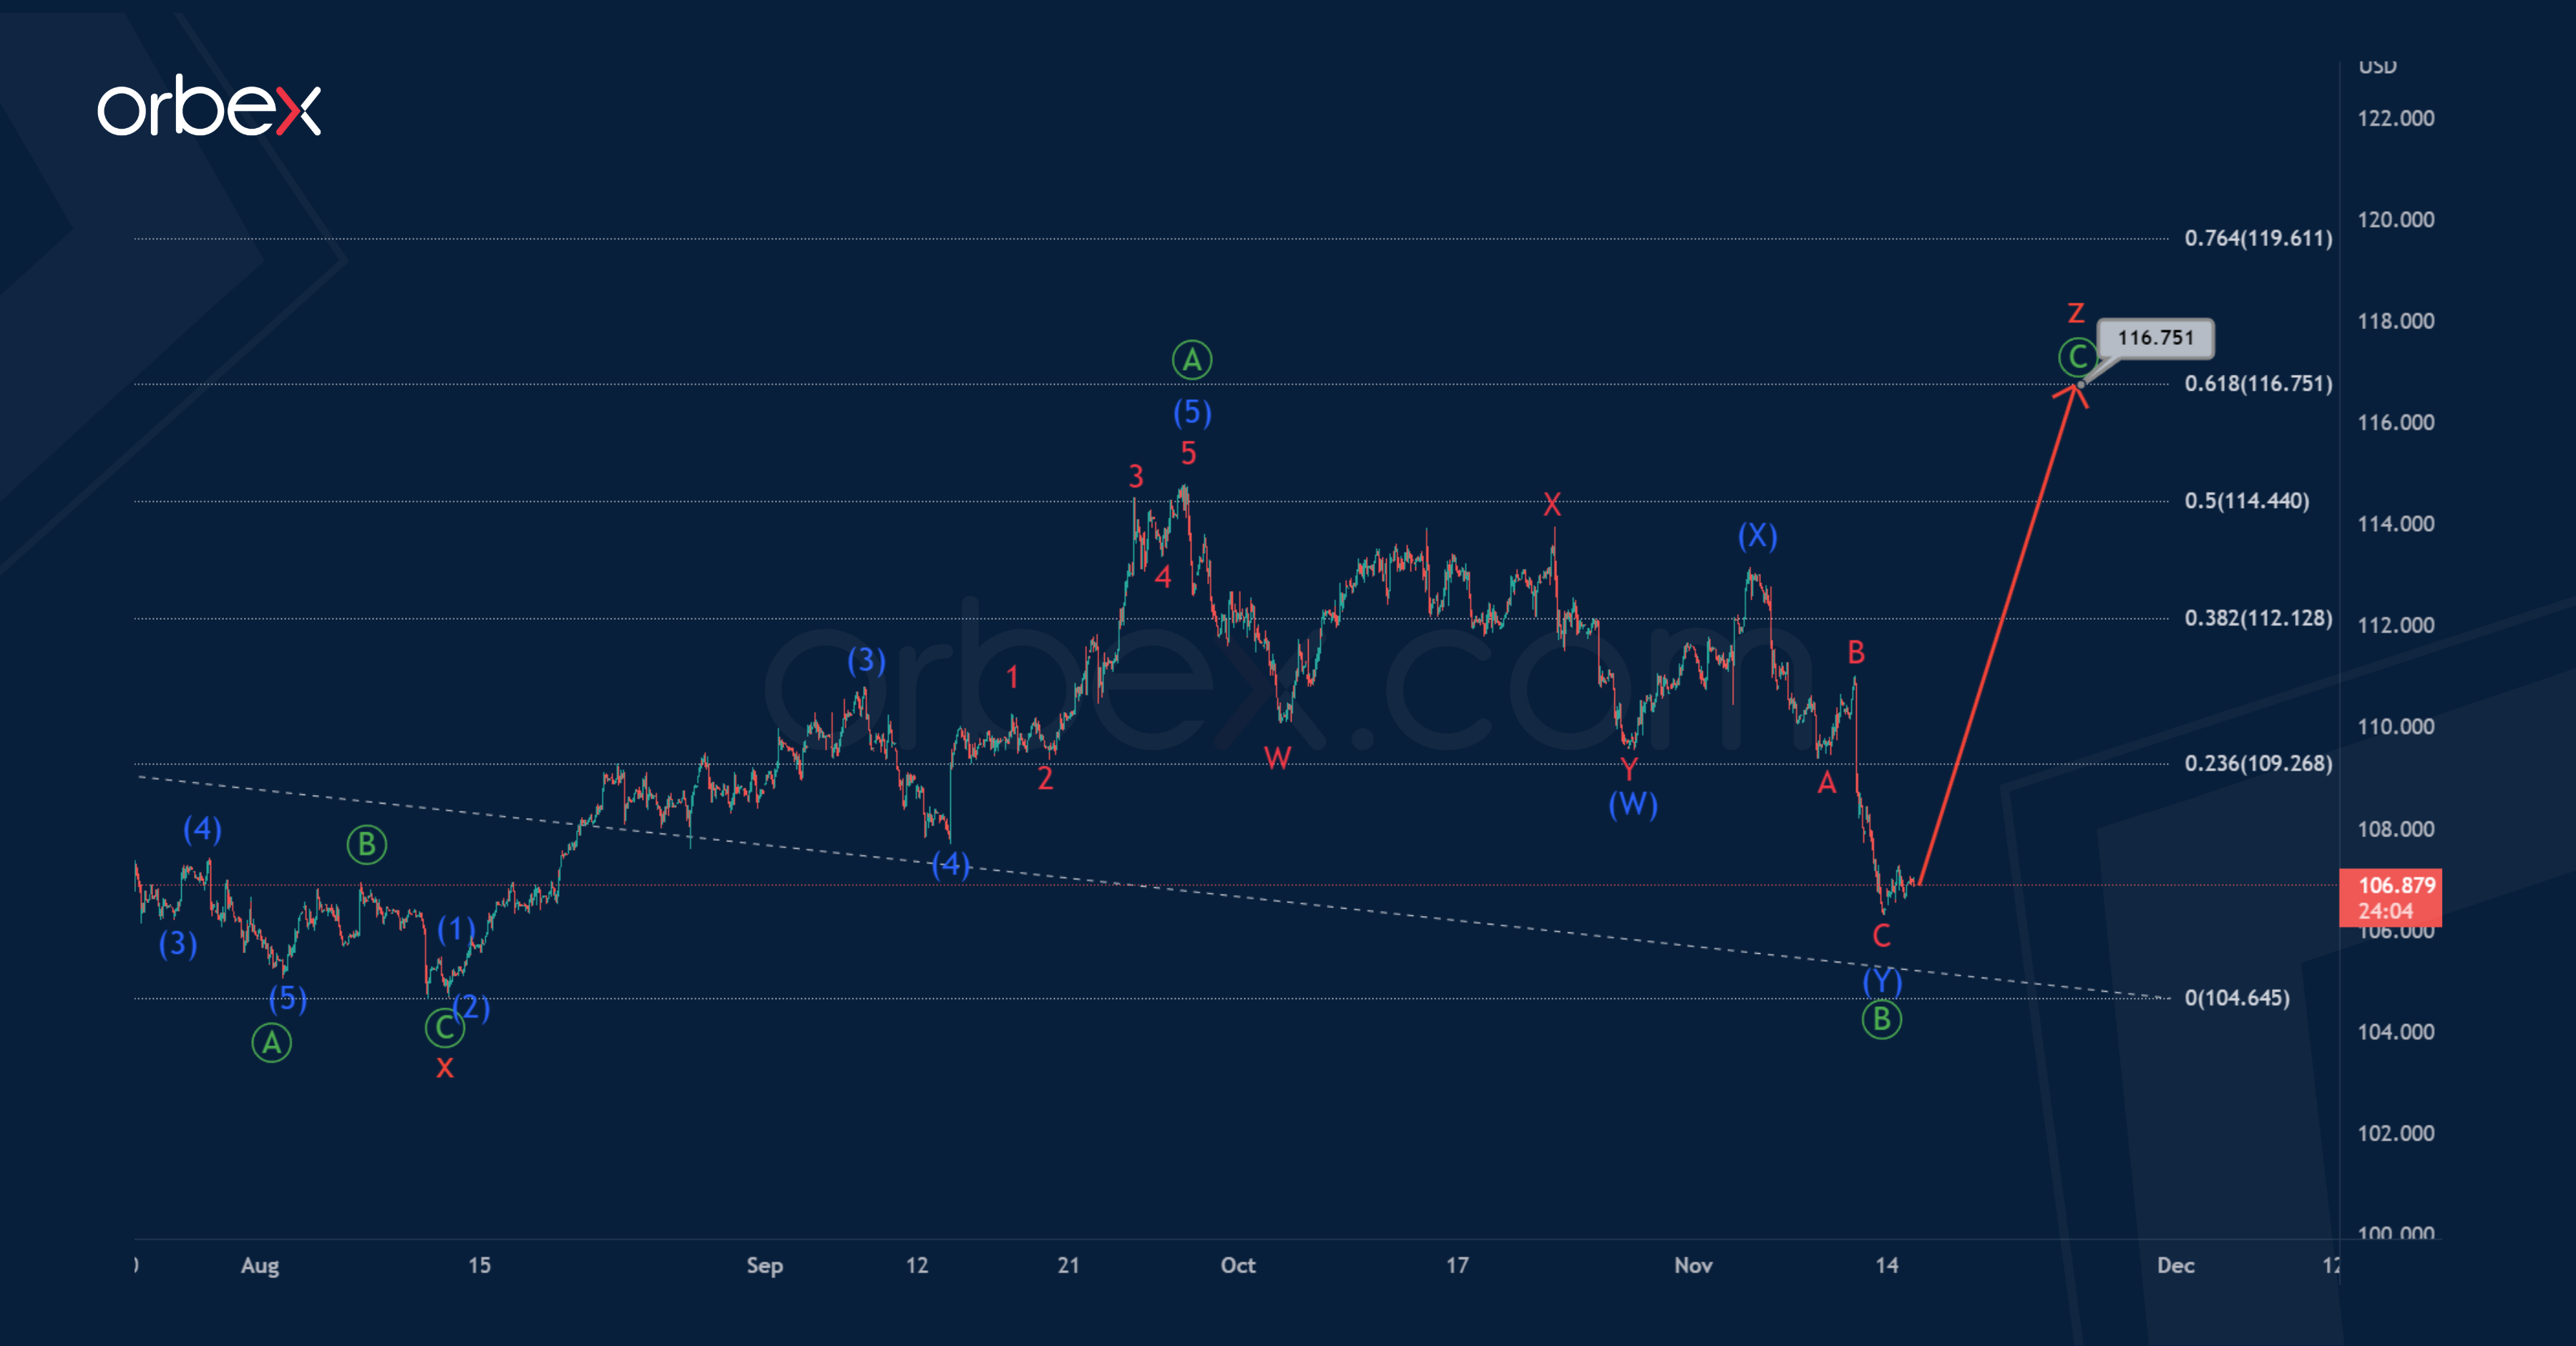
Most likely, at the level of 104.64, the bearish cycle wave x was completed, which took the form of a standard zigzag of the primary degree. After that, an upward impulse price movement in the wave z began.
The wave z may take the form of a zigzag, where the first impulse and the correction in the form of an intermediate double zigzag are already completed.
The entire wave z may complete its pattern near 116.75. At that level, it will be at the 61.8% Fibonacci extension of wave y.
USD/JPY Mid-Day Outlook
Daily Pivots: (S1) 138.89; (P) 139.84; (R1) 140.88; More...
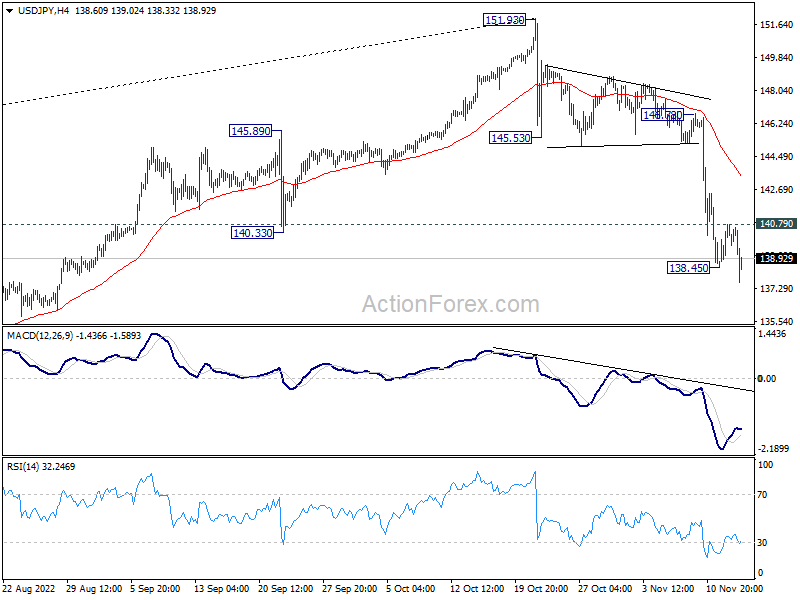
USD/JPY's fall from 151.93 resumed after brief consolidations and intraday bias is back on the downside. Current decline should target 133.07 fibonacci level, as a correction to the larger up trend. On the upside, above 140.79 minor resistance will turn intraday bias neutral and bring consolidations first, before staging another decline.
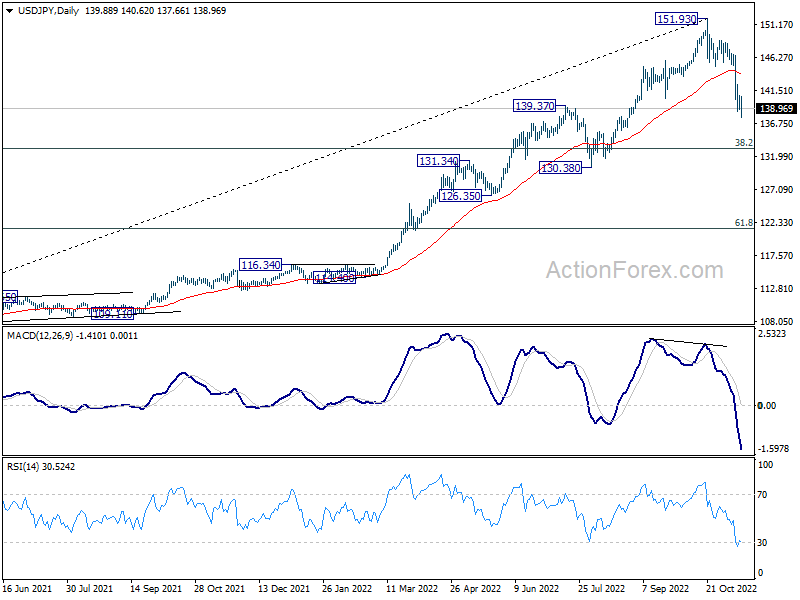
In the bigger picture, a medium term top should be formed at 151.93. Fall from there is correcting larger up trend from 102.58. It's too early to call for bearish trend reversal. But even as a corrective move, such decline should target 38.2% retracement of 102.58 to 151.93 at 133.07, or further to 55 week EMA (now at 130.58).
USD/CHF Mid-Day Outlook
Daily Pivots: (S1) 0.9395; (P) 0.9442; (R1) 0.9479; More...
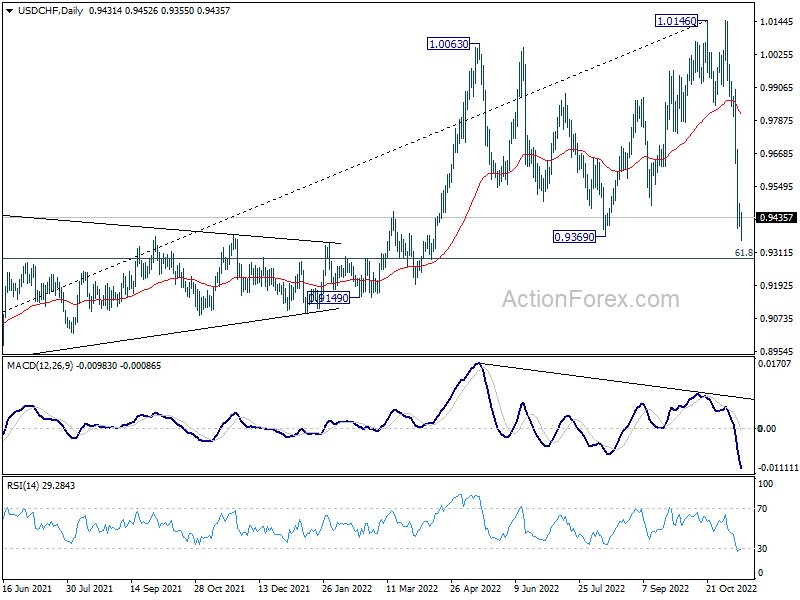
Intraday bias in USD/CHF remains on the downside despite some loss of downside momentum. Next target is 0.9369 support is already met and next target is 0.9287 fibonacci level. On the upside, break of 0.9488 minor resistance will turn intraday bias neutral first and bring consolidation, before staging another decline.
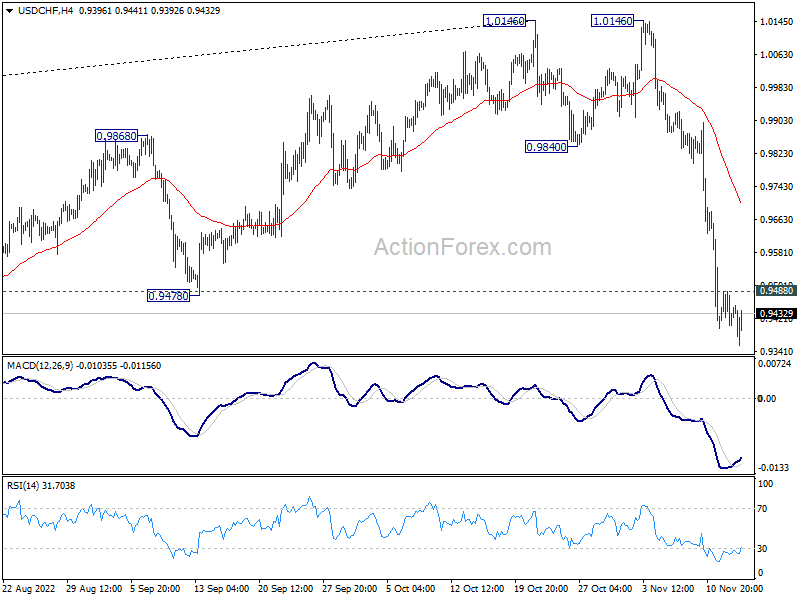
In the bigger picture, rise from 0.8756 (2021 low) has completed at 1.0146, well ahead of 1.0342 long term resistance (2016 high). Based on current downside momentum, fall from 1.0146 might be a medium term down trend itself. Break of 61.8% retracement of 0.8756 to 1.0146 at 0.9287 will pave the way to 0.8756. In any case, risk will stay on the downside as long as 55 day EMA (now at 0.9821) holds.