Sample Category Title
USD/CHF Daily Outlook
Daily Pivots: (S1) 0.9377; (P) 0.9427; (R1) 0.9496; More...
A temporary low is formed at 0.9355 and intraday bias in USD/CHF is turned neutral for some consolidations. Upside of recovery should be limited by 0.9680 minor resistance to bring another decline. Below 0.9355 will resume the fall from 1.0146 to 0.9287 fibonacci level.
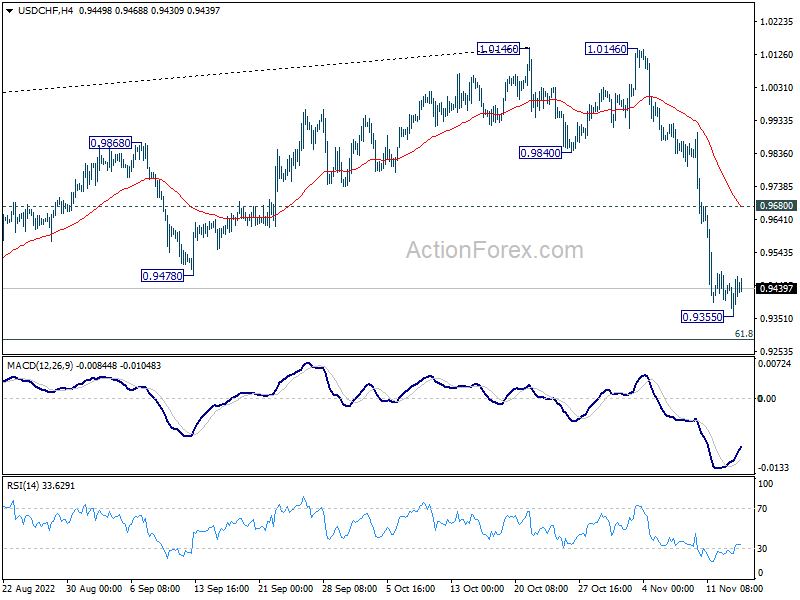
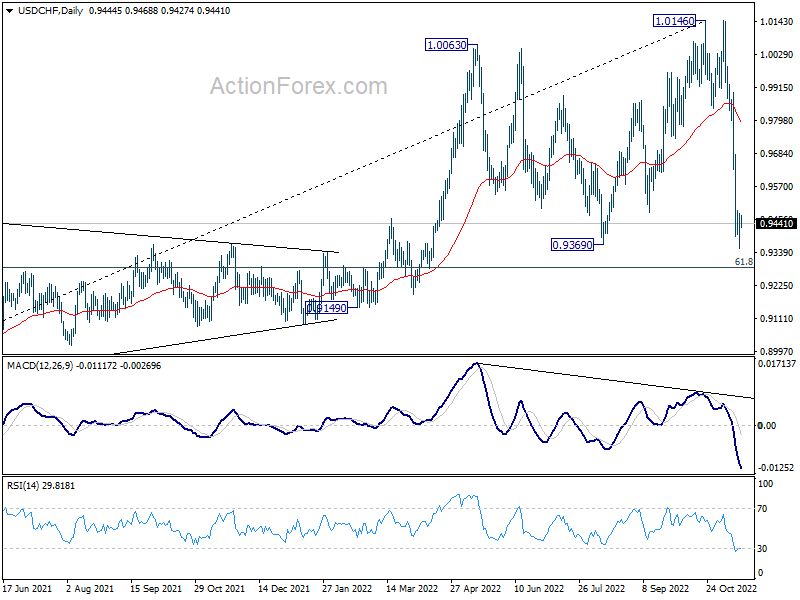
In the bigger picture, rise from 0.8756 (2021 low) has completed at 1.0146, well ahead of 1.0342 long term resistance (2016 high). Based on current downside momentum, fall from 1.0146 might be a medium term down trend itself. Break of 61.8% retracement of 0.8756 to 1.0146 at 0.9287 will pave the way to 0.8756. In any case, risk will stay on the downside as long as 55 day EMA (now at 0.9793) holds.
GBP/USD Daily Outlook
Daily Pivots: (S1) 1.1729; (P) 1.1878; (R1) 1.2016; More...
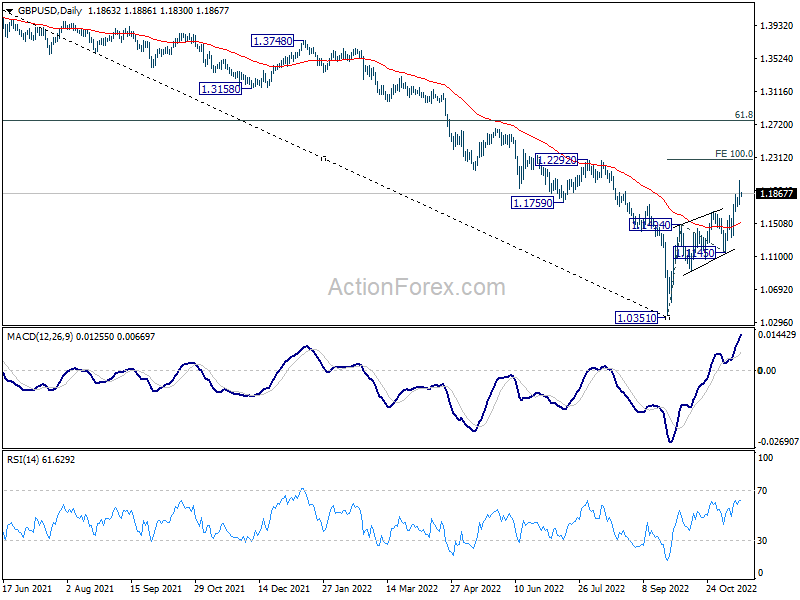
Intraday bias in GBP/USD remains on the upside for the moment. Current rise from 1.0351 should target 100% projection of 1.0351 to 1.1494 from 1.1145 at 1.2288. On the downside, break of 1.1708 minor support will turn intraday bias neutral and bring consolidation again, before staging another rally.
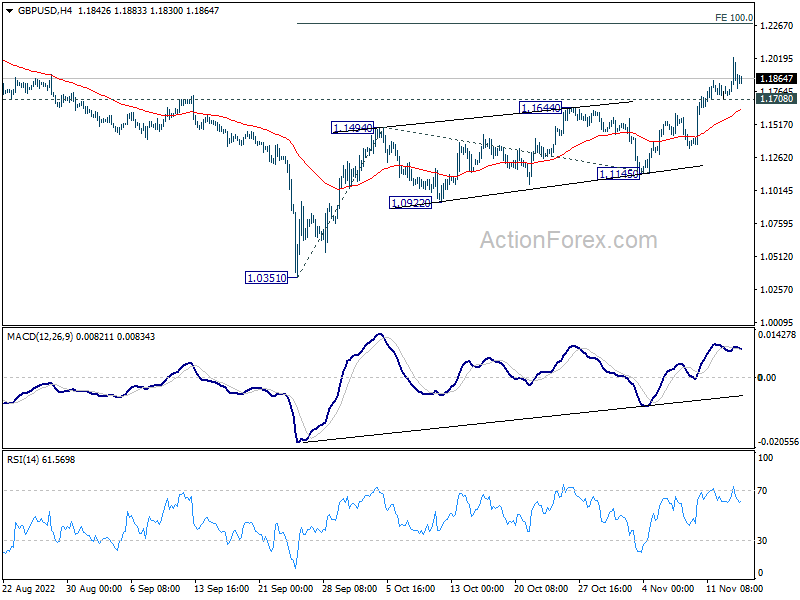
In the bigger picture, rise from 1.0351 medium term bottom is at least correcting whole down trend from 1.4248 (2021 high). Further rise is expected as long as 1.1145 support holds. Next target is 61.8% retracement of 1.4248 to 1.0351 at 1.2759.
Technical Outlook and Review
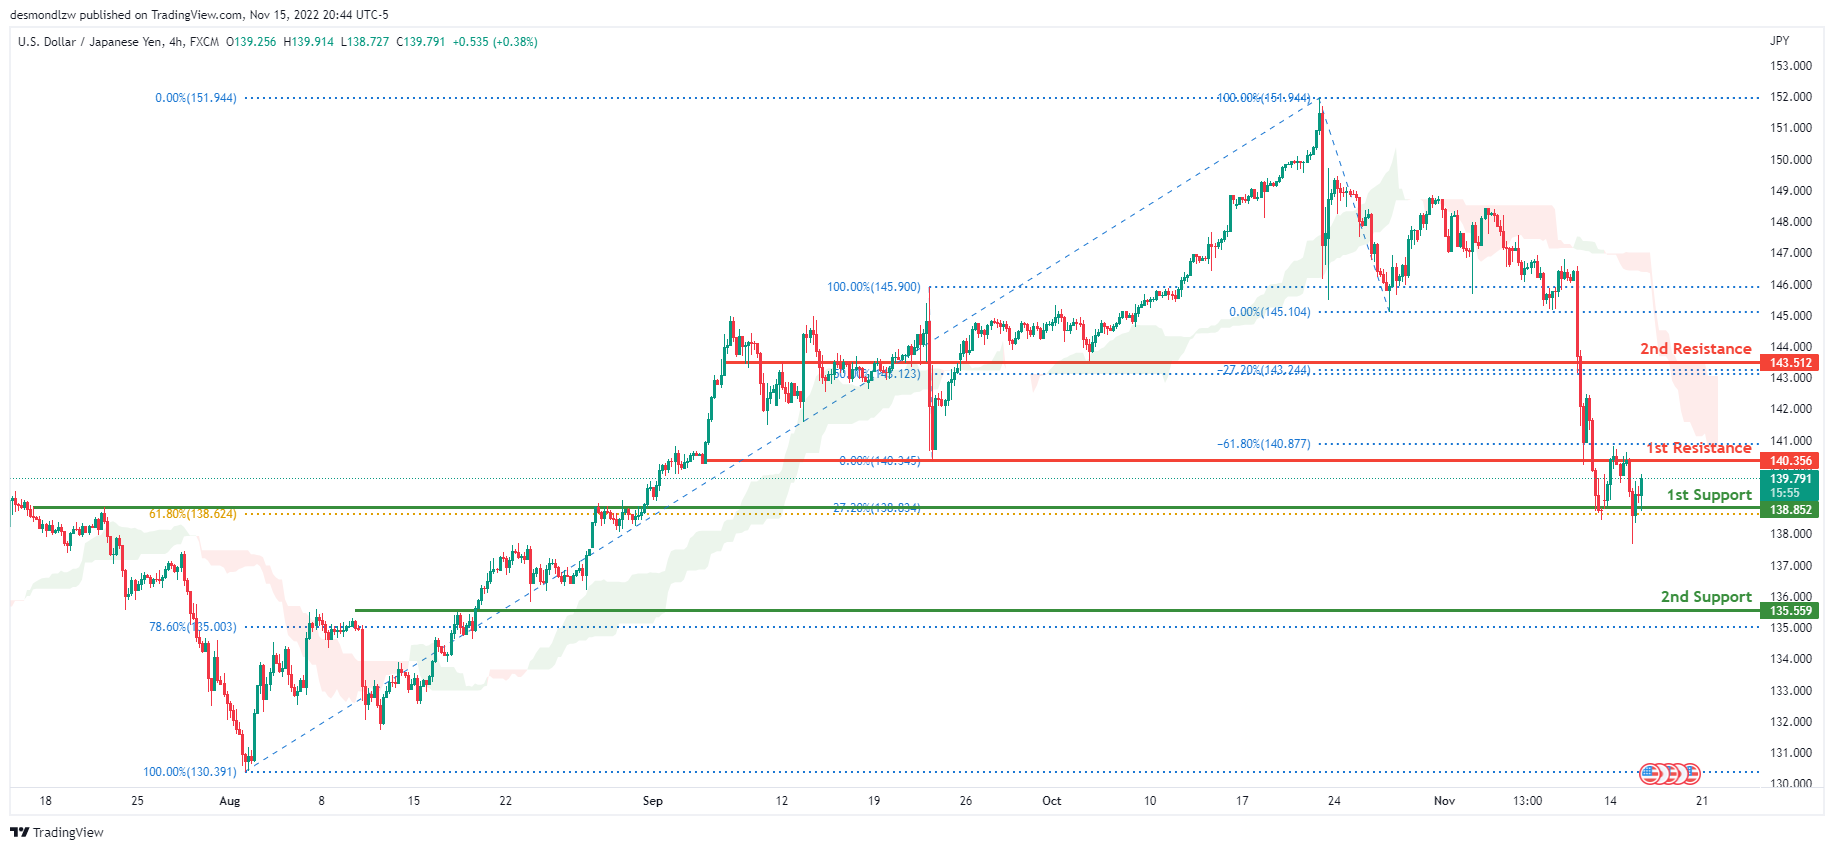
USD/JPY:
The current general bias for USDJPY on the H4 chart is bearish. To add confluence to this, the price is below the Ichimoku cloud which indicates a bearish market. If the bearish momentum continues, expect USDJPY to break the 1st support line at 138.852 where the -27.2% Fibonacci expansion line is located and head towards the 2nd support line at 135.554 where the 78.6% Fibonacci line is located. In an alternative scenario, price could go back up to break the 1st resistance at 140.356, where the -61.8% Fibonacci expansion line and previous low are located before heading towards the 2nd resistance line at 143.512 where the -27.2% Fibonacci expansion line and 50% Fibonacci line are located.
Areas of consideration:
- H4 time frame, 1st resistance at 140.356
- H4 time frame, 2nd resistance at 143.512
- H4 time frame, 1st support at 138.852
- H4 time frame, 2nd support at 135.554
DXY:
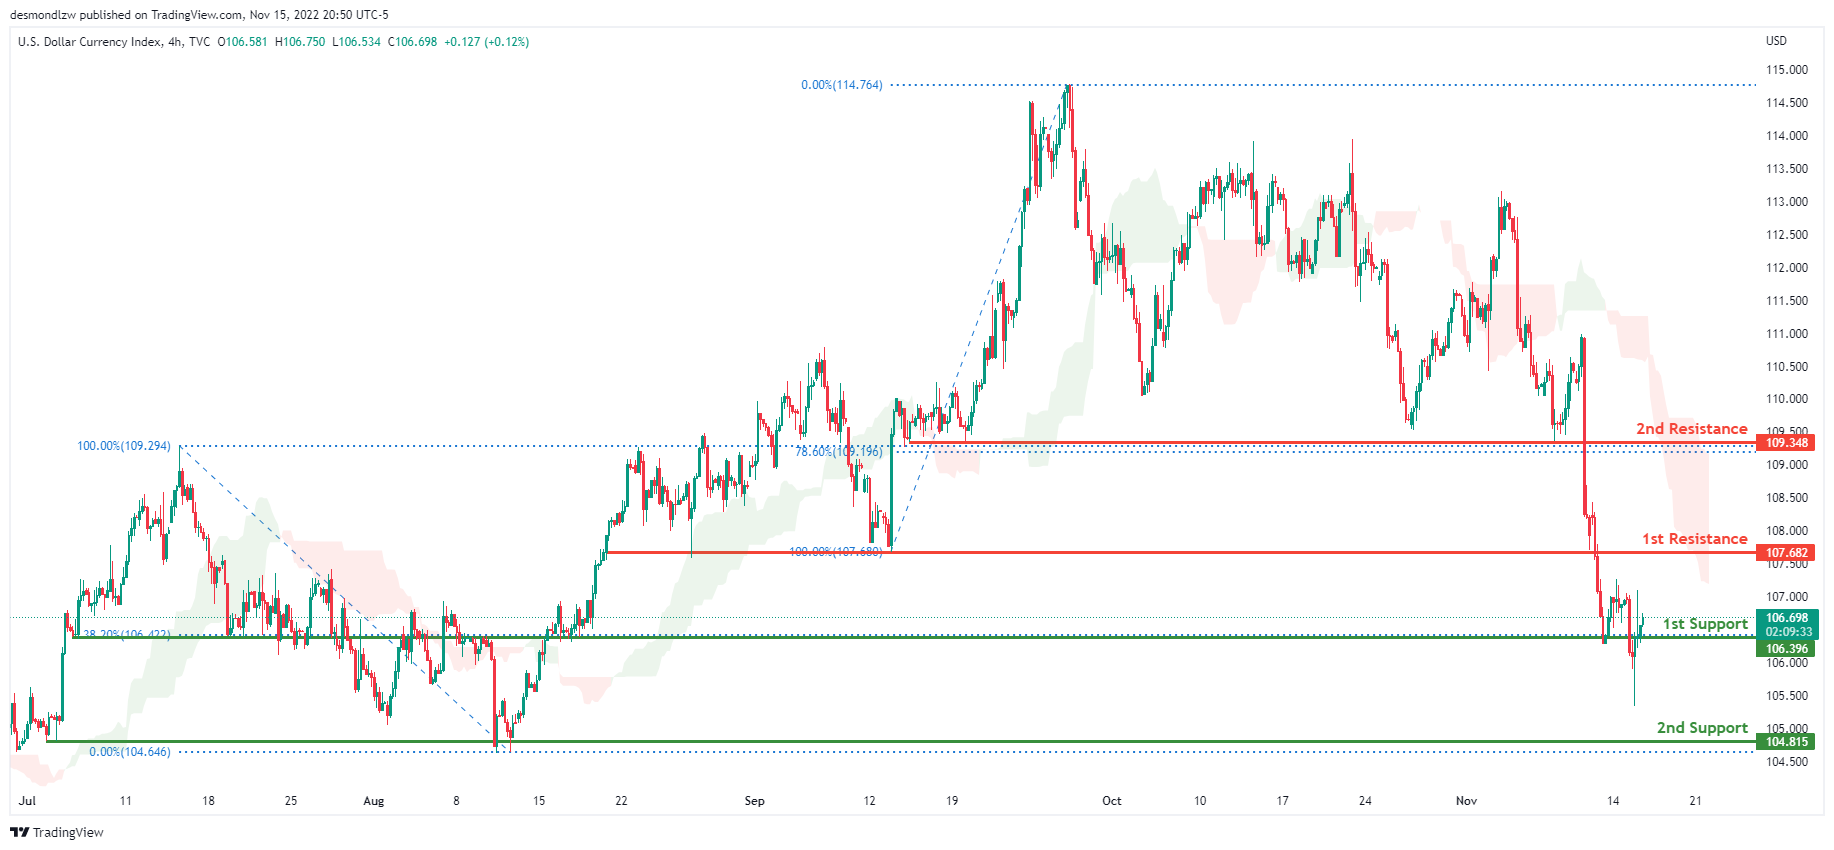
On the H4 chart, the overall bias for DXY is bearish. To add confluence to this, the price is below the Ichimoku cloud which indicates a bearish market. If this bearish momentum continues, price could break the 1st support line at 106.396 where the 38.2% fibonacci line is located, before heading towards the 2nd support at 104.815 where the previous low and the 0% Fibonacci line are located. In an alternative scenario, price could head back up and retest the 1st resistance line at 107.682, where the previous low and 100% Fibonacci line are located.
Areas of consideration:
- H4 time frame, 1st resistance at 107.682
- H4 time frame, 1st support at 106.396
- H4 time frame, 2nd support at 104.815
EUR/USD:
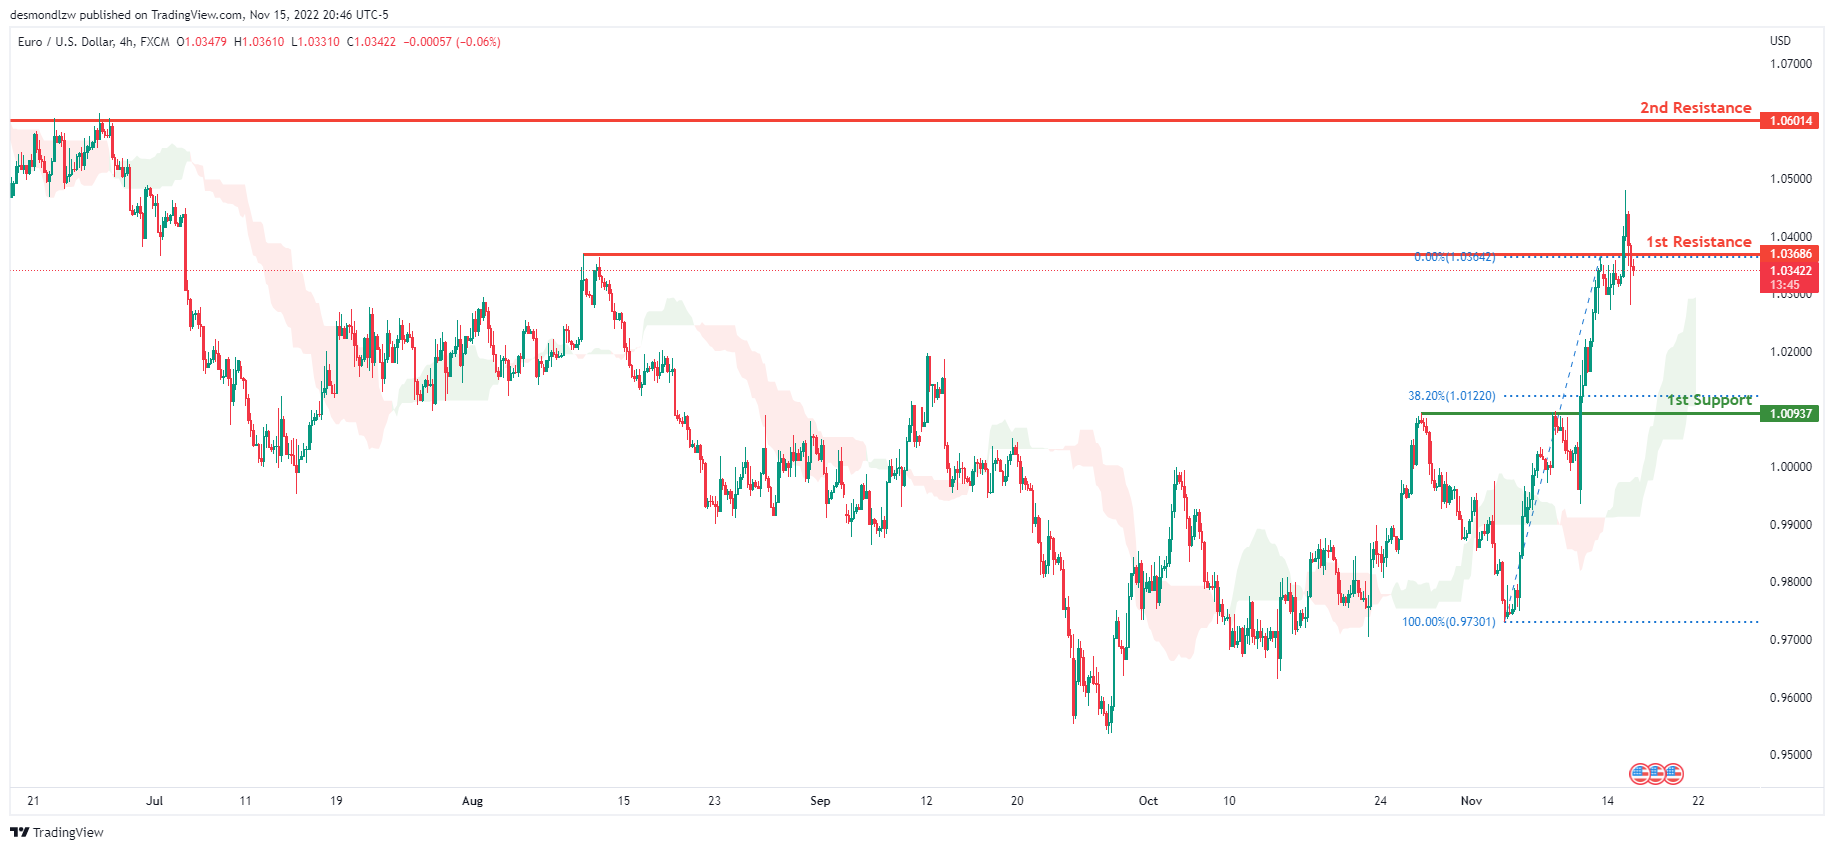
On H4, with the price moving above the ichimoku cloud, we have a bullish bias that the price may break the first resistance level at 1.03686, which corresponds to the swing high and the 0% fibonacci extension, before heading to the 2nd resistance at 1.06014, where the previous swing high is. If the first resistance is breached, the second resistance is at 1.06014, the previous swing high. Alternatively, the price could fall to the first support level at 1.00937, which corresponds to the 38.2% fibonacci retracement.
Areas of consideration :
- H4 1st resistance at 1.03686
- H4 2nd resistance at 1.06014
- H4 1st support at 1.00937
GBP/USD:
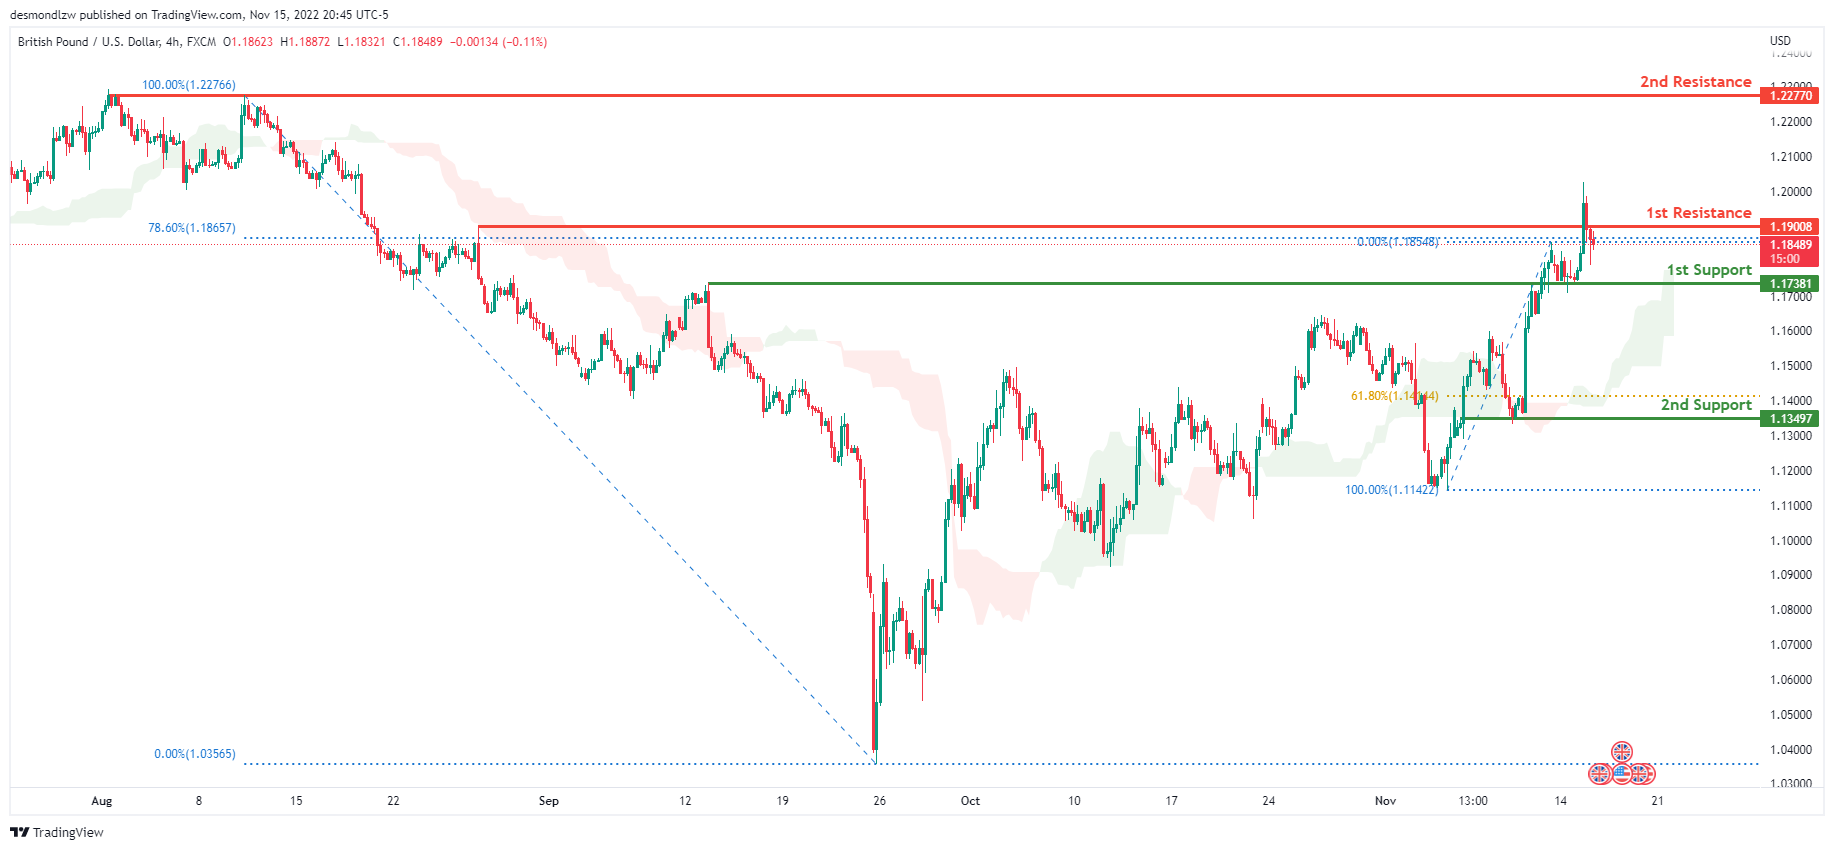
On the H4, the price is moving above the ichimoku cloud, suggesting that the price may break the first resistance level at 1.19008, which corresponds to the 78.6% fibonacci and the previous swing high, before heading to the 2nd resistance line at 1.22770, where the previous swing high is. Alternatively, the price may break the first support level at 1.17381, which is the previous swing high, before moving on to the second support level at 1.13497, which is the 61.8% Fibonacci line.
Areas of consideration:
- H4 1st resistance at 1.19008
- H4 2nd resistance at 1.22770
- H4 1st support at 1.17381
USD/CHF:
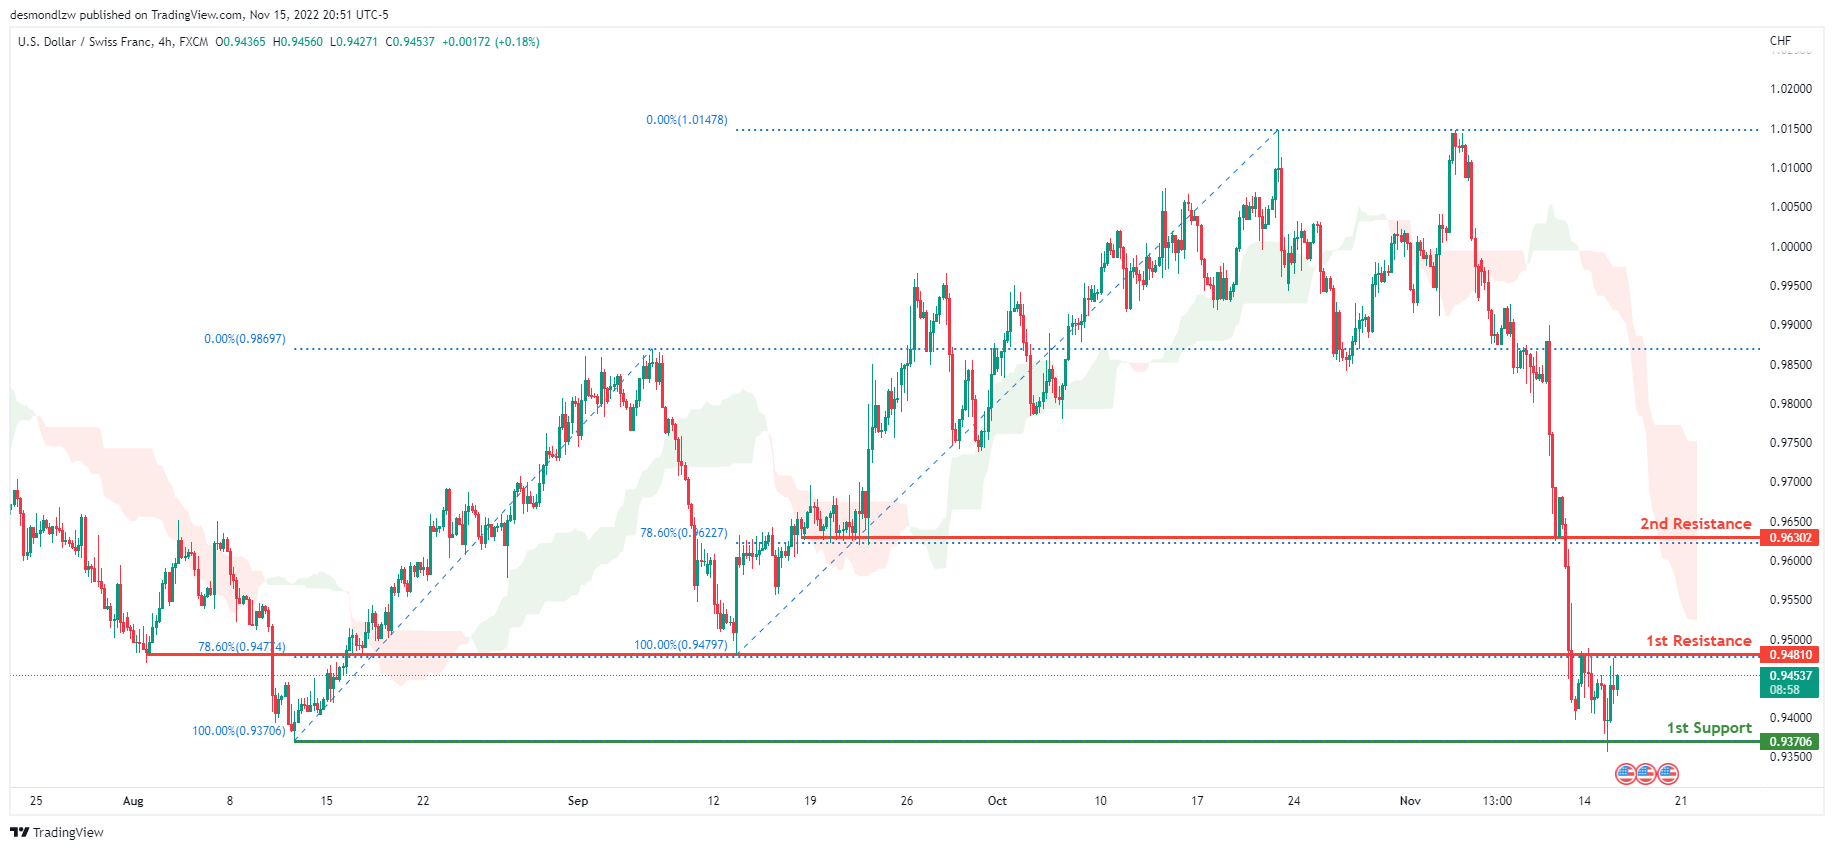
The overall bias for USDCHF on the H4 chart is bearish. In addition, the price is below the Ichimoku cloud, indicating a bearish market. If the current bearish trend continues, the price might move towards the first support line at 0.93706, where the previous low was located. In an alternate scenario, price could rise to retest the first resistance line at 0.94810, which is also the 78.6% Fibonacci line. If the first resistance line is broken, the second resistance line is at 0.96302, which is the 78.6% Fibonacci line.
Areas of consideration
- H4 1st support at 0.93706
- H4 1st resistance at 0.94810
- H4 2nd resistance at 0.96302
XAU/USD (GOLD):
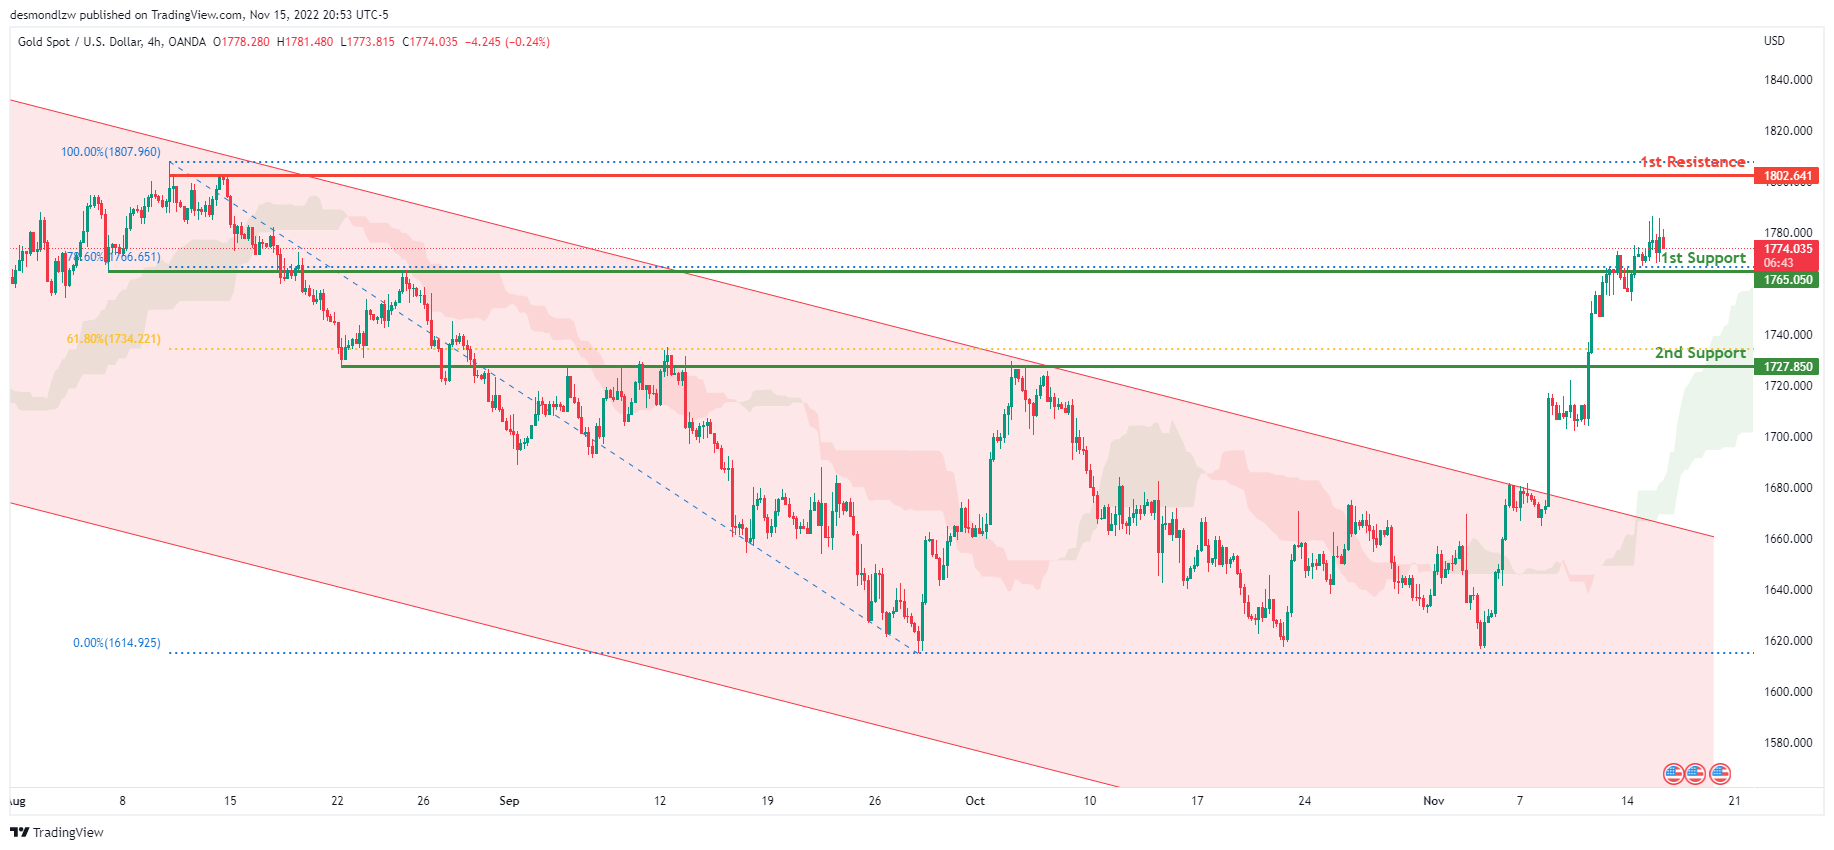
On H4, with the price breaking the descending channel and above the ichimoku cloud, we can expect the price to rise towards the 1st resistance at 1802.641, where the previous swing high is. Alternatively, the price may drop to the 1st support at 1765.050, which is in line with the 78.6% fibonacci line.
Areas of consideration:
- H4 time frame, 1st resistance at 1765.483
- H4 time frame, 1st support at 1727.850
AUD/USD:
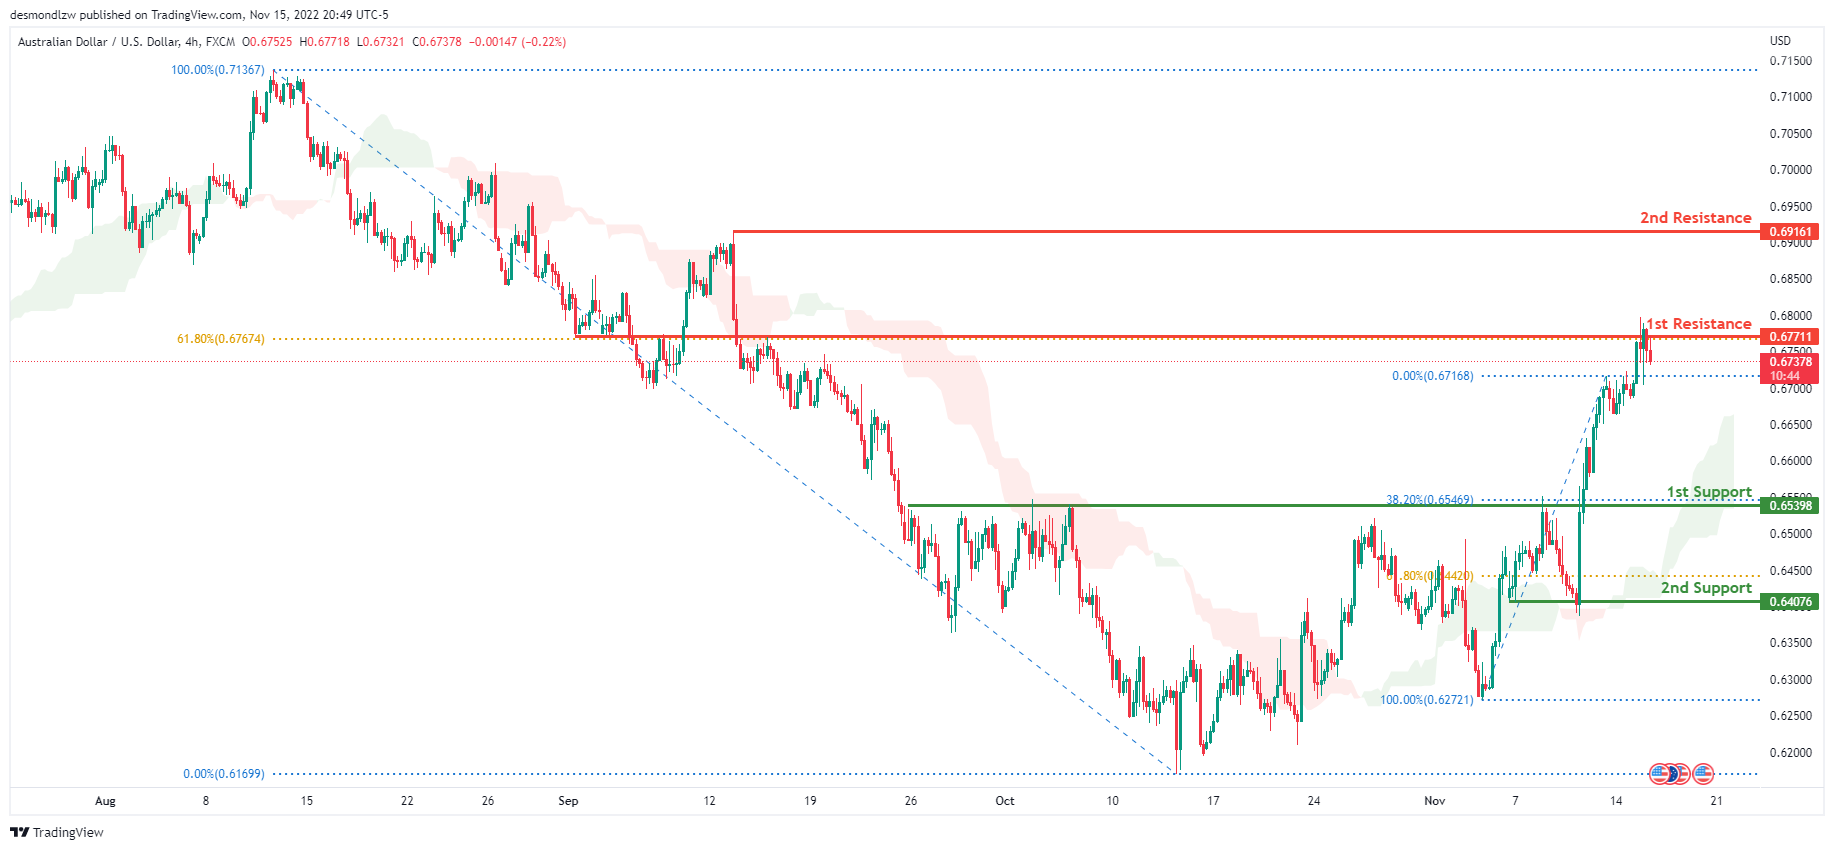
With the price moving above the ichimoku cloud on the H4, we have a bullish bias that the price may break the first resistance at 0.67711, which is in line with the 161.8% fibonacci line, before heading towards the 2nd resistance line at 0.69161, the previous swing high. Alternatively, the price could fall to the first support level at 0.65398, which is marked by the 38.2% Fibonacci line.
Areas of consideration
- H4, 1st resistance at 0.67711
- H4, 2nd resistance at 0.69161
- H4, 1st support at 0.65398
NZD/USD:
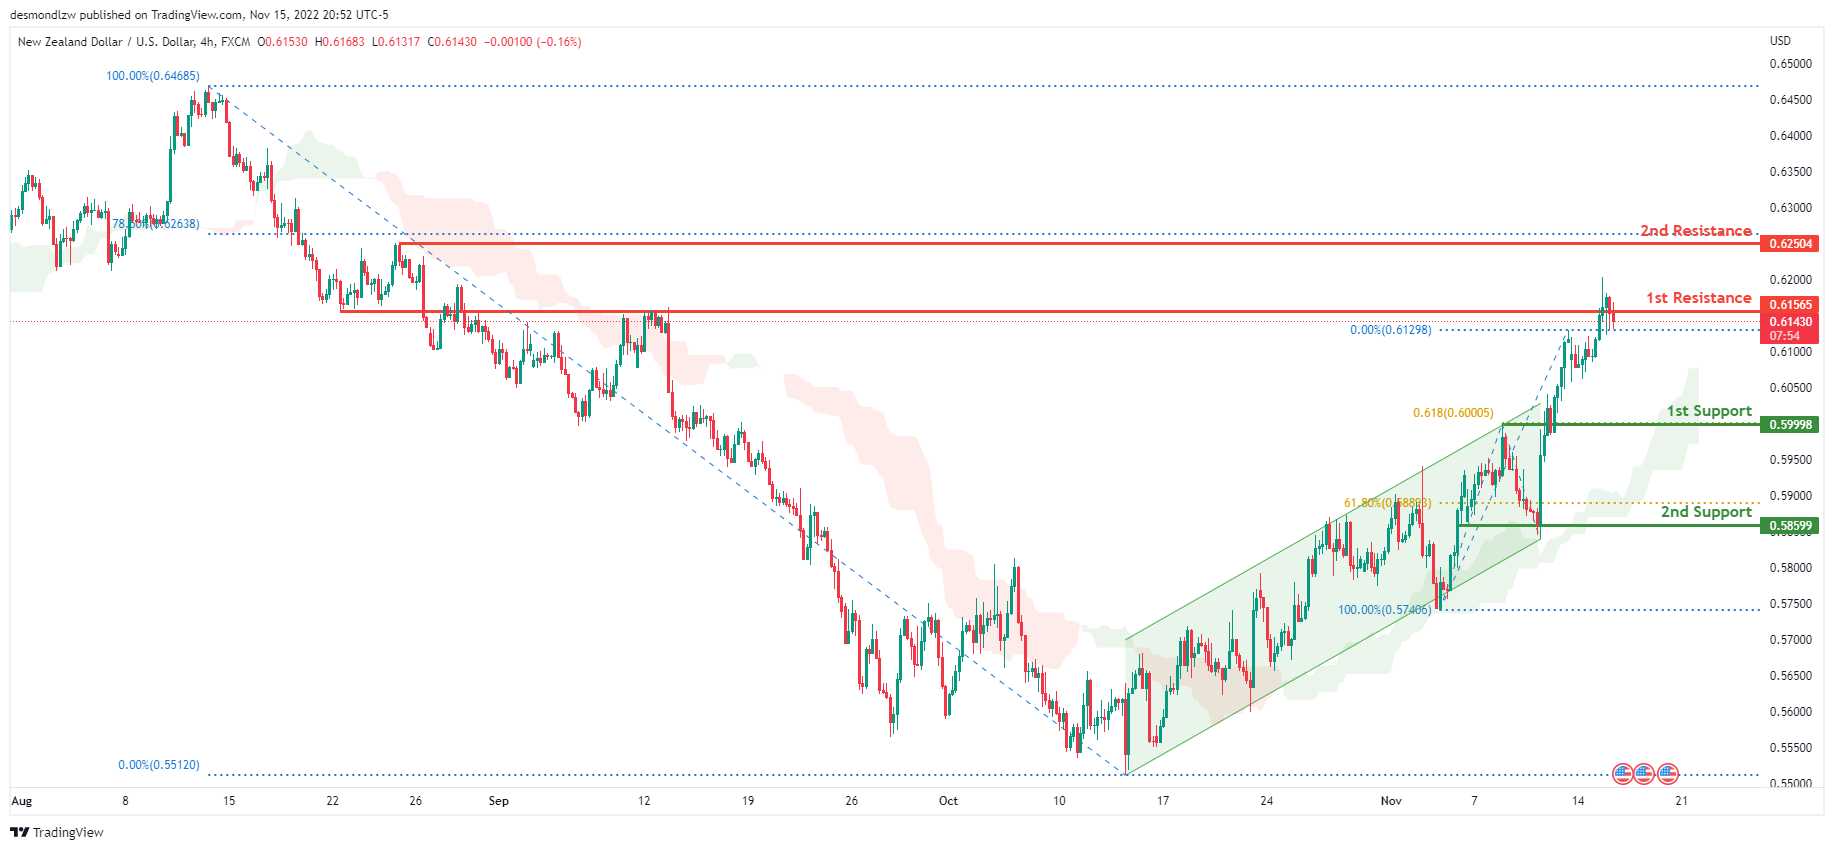
On the H4 chart, the price is moving above the Ichimoku cloud and has broken out of the ascending channel. If this bullish momentum continues, the price may break the 1st resistance at 0.61565, which is in line with the previous swing high and 0% fibonacci line, before heading towards the 2nd resistance line at 0.62504, where the 78.6% Fibonacci line is. Alternatively, the price may head back towards the 1st support at 0.59998, where the 61.8% Fibonacci projection line is located.
Areas of consideration:
- H4 time frame, 1st resistance at 0.61565
- H4 time frame, 1st support at 0.59998
USD/CAD:
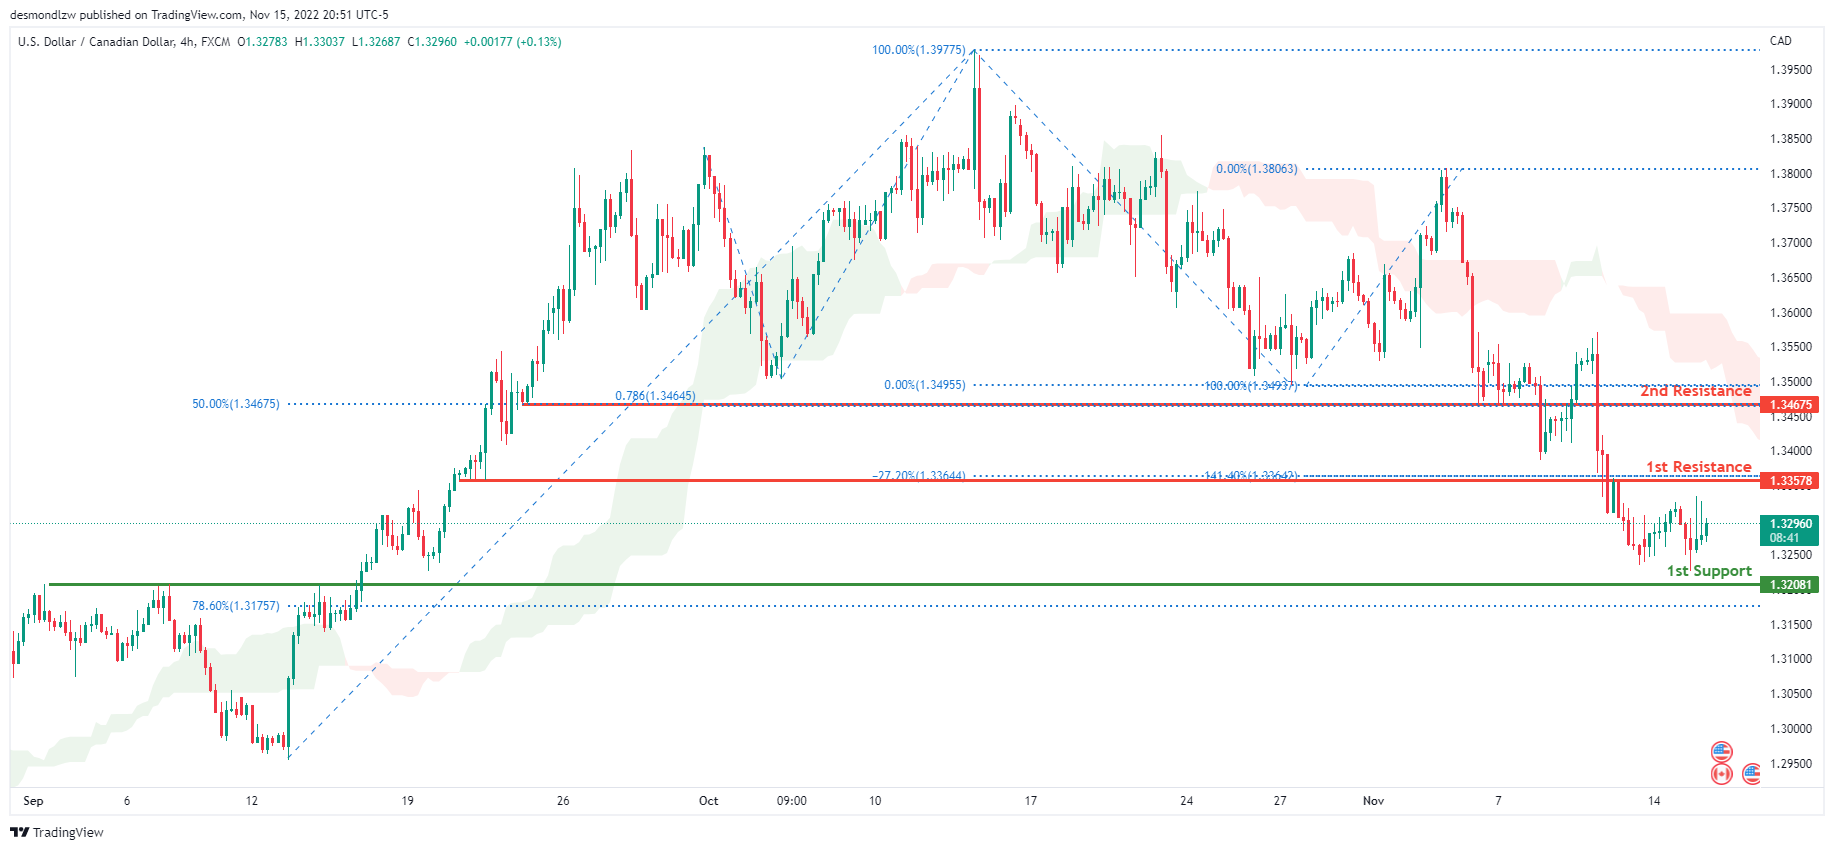
On the H4 chart, the overall bias for USDCAD is bearish. To add confluence to this, the price is below the Ichimoku cloud which indicates a bearish market. If this bearish momentum continues, expect the price to head down towards the 1st support line at 1.32081, where the 78.6% Fibonacci line is located.. In an alternative scenario, price could head back up breaking the 1st resistance line at 1.33578, where the -27.2% Fibonacci expansion line and 141.4% Fibonacci line are located.
Areas of consideration:
- H4 time frame, 1st resistance at 1.33578
- H4 time frame, 1st support at 1.32081
OIL:
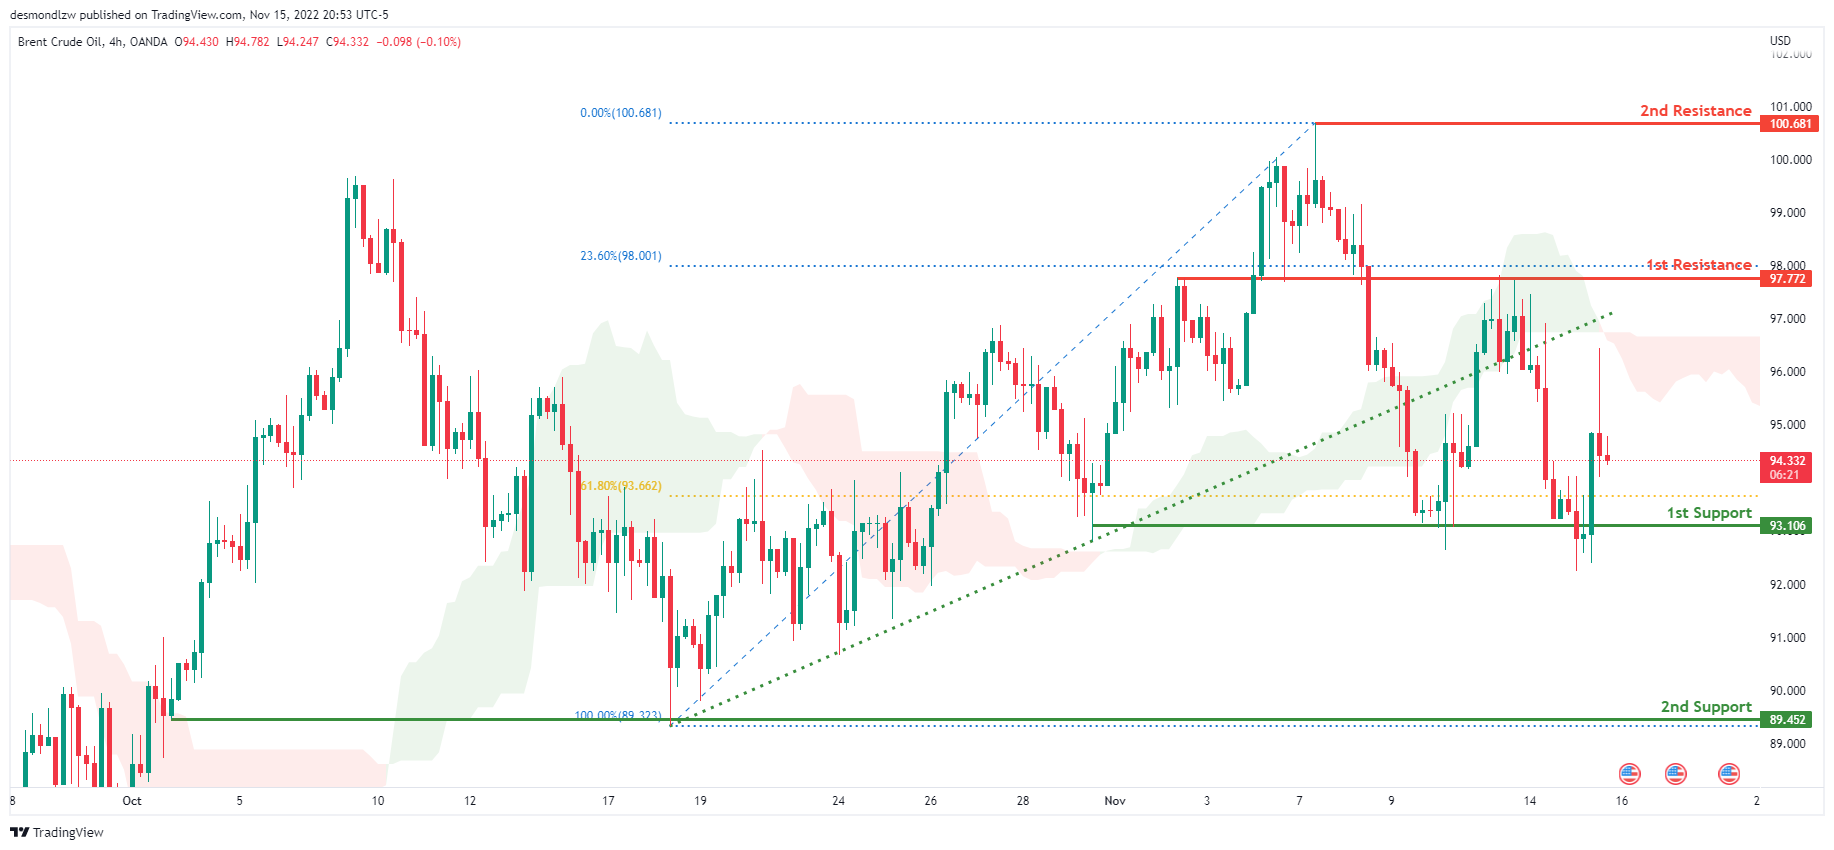
Looking at the H4 chart, the current overall bias for Oil is bearish. To add confluence to this, the price is below the Ichimoku cloud which indicates a bearish market. If this bearish momentum continues, expect price to break the 1st support at 93.106 where the previous swing low and 61.8% Fibonacci line are located before heading towards the 2nd support at 89.452, where the previous swing low lies. In an alternative scenario, price could head back up to retest the 1st resistance line at 97.772 where the 23.6% Fibonacci line is located.
Areas of consideration:
- H4 time frame, 1st resistance at 97.772
- H4 time frame, 1st support at 93.106
- H4 time frame, 2nd support at 89.452
Dow Jones Industrial Average:
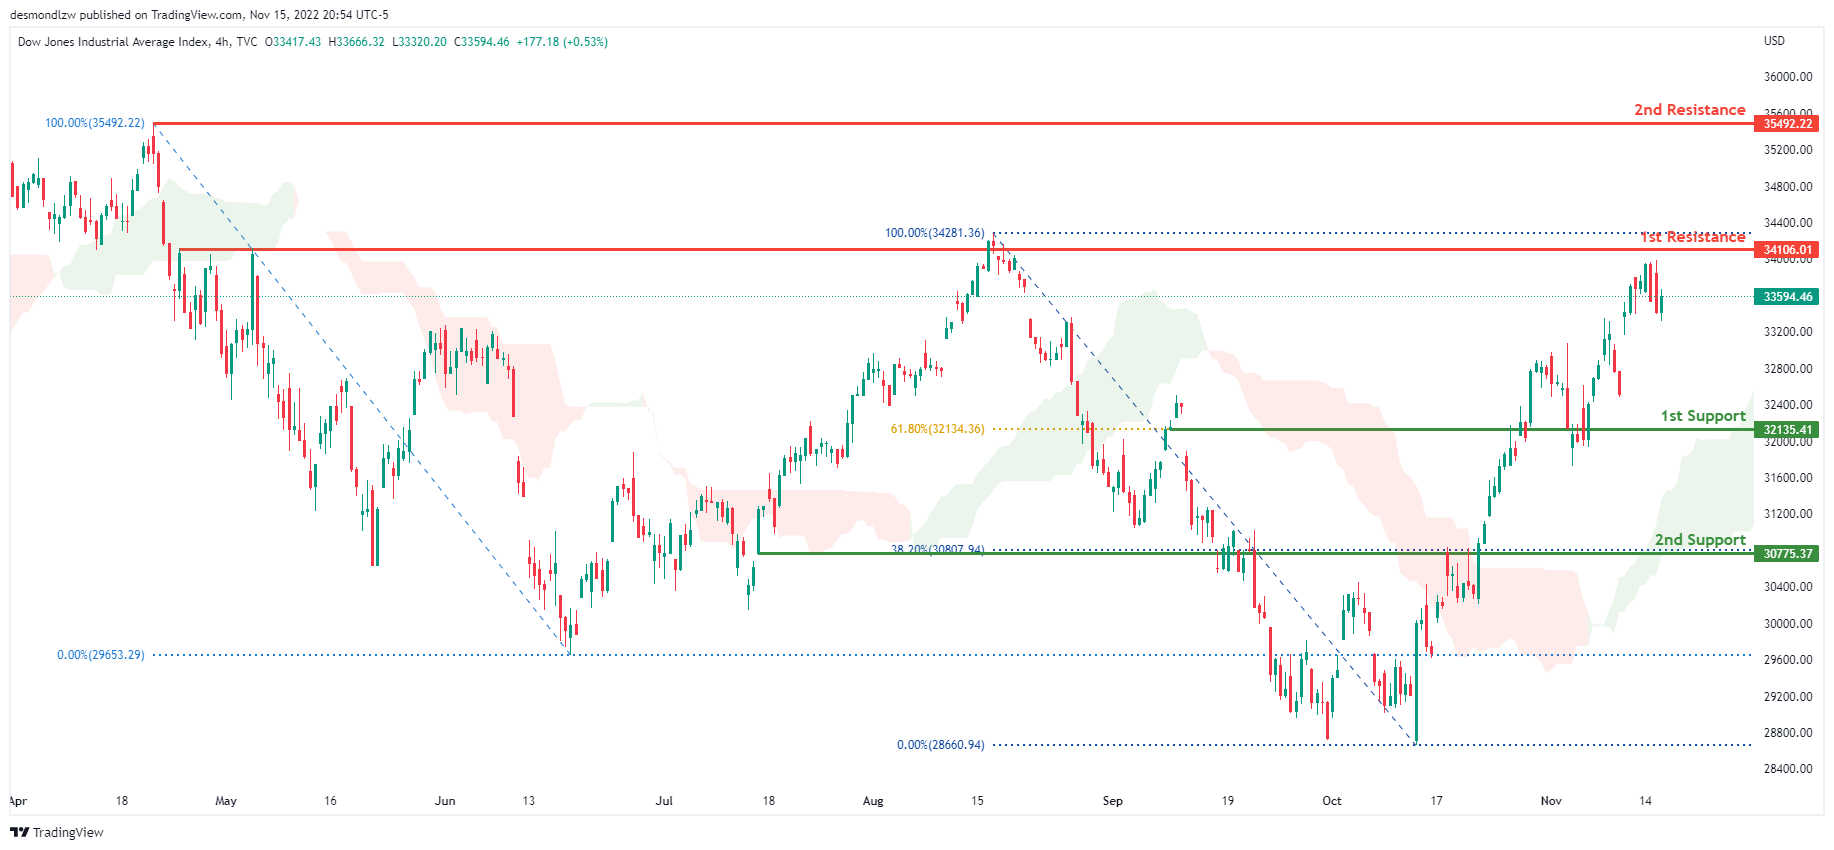
On the H4 chart, the overall bias for DJI is bullish. To add confluence to this, the price is above the Ichimoku cloud which indicates a bullish market. If this bullish momentum continues, expect the price to possibly head towards the 1st resistance at 34106.01 where the previous high and 100% Fibonacci line is located. In an alternative scenario, price could head towards the 1st support line at 32135.41, where the 61.8% Fibonacci line is located.
Areas of consideration:
- H4 time frame, 1st support at 32135.41
- H4 time frame, 1st Resistance at 34106.01
DAX:
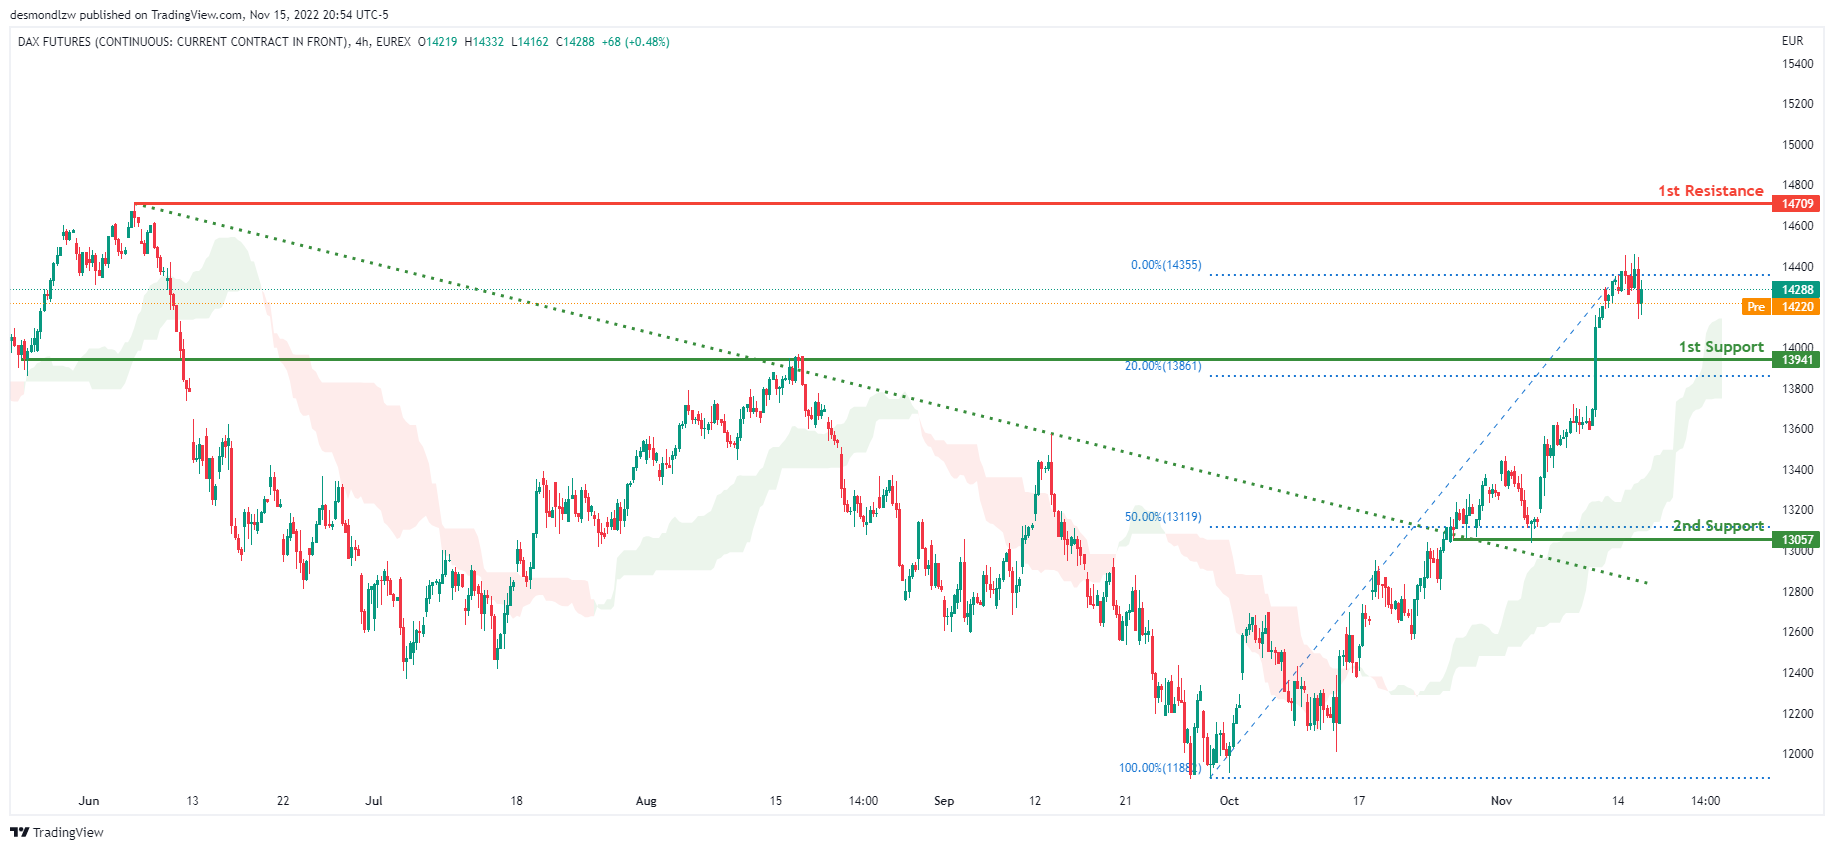
The H4 chart shows a bullish bias, with price breaking through the descending trendline and rising above the Ichimoku cloud. Price is expected to maintain its bullish momentum and rise to the first resistance level at 14709, where the previous swing high is located. Alternatively, the price could fall to the first support level at 13941, which corresponds to the 20% Fibonacci line.
Areas of consideration:
- H4 time frame, 1st resistance is at 14709
- H4 time frame, 1st support is at 13941
ETHUSD:
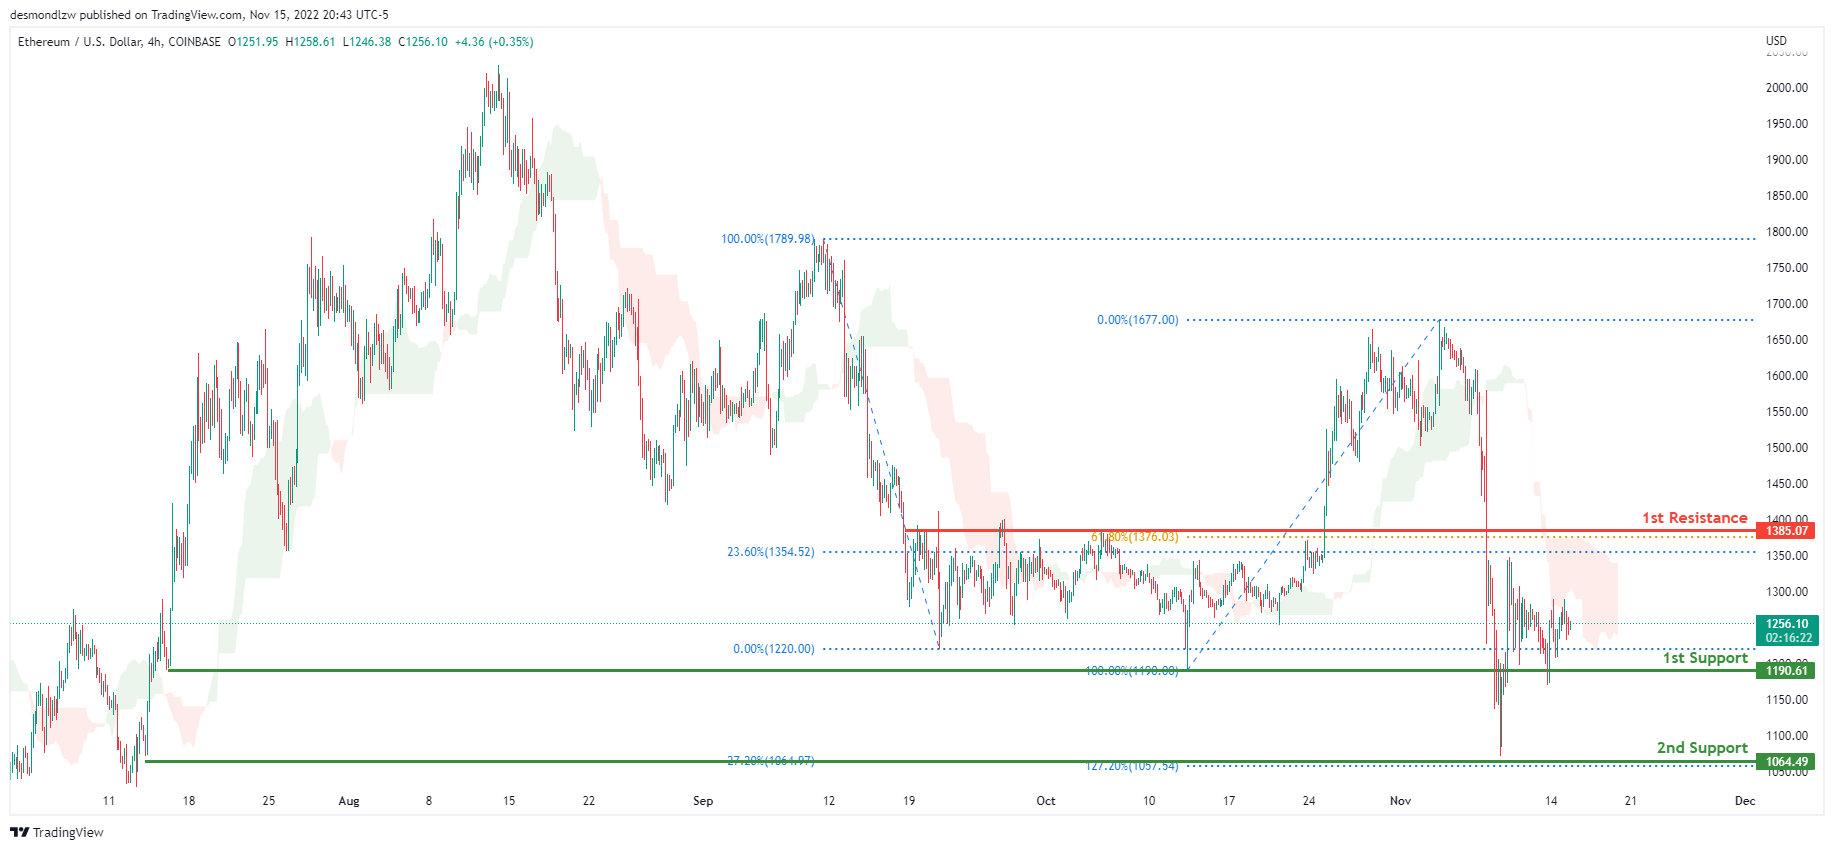
Looking at the H4 chart, the current overall bias for ETHUSD is bearish, with price currently under the Ichimoku cloud indicating a bearish market. If this bearish momentum continues, expect the price to break the 1st support line at 1190.61 where the previous low and 100% Fibonacci line was located and head towards the 2nd support at 1064.49 where the -27.2% Fibonacci expansion line and 127.2% Fibonacci extension line are located. In an alternative scenario, price could head back up to retest the 1st resistance line at 1385.07, where the 23.6% and 61.8% Fibonacci lines are located.
Areas of consideration:
- H4 time frame, 1st resistance of 1385.07
- H4 time frame, 1st support at 1190.61
- H4 time frame, 2nd support at 1064.49
BTCUSD:
On the H4 chart, the overall bias for BTCUSD is bearish. To add confluence to this, the price is below the Ichimoku cloud which indicates a bearish market. If this bearish momentum continues, expect the price to head towards the 1st support line at 15525.96, where the 127.2% Fibonacci extension line and -61.8% Fibonacci expansion line is located. In an alternative scenario, price could head back up to retest the 1st resistance line at 18173.33, where the previous low and 0% Fibonacci line is located.
Areas of consideration:
- H4 time frame, 1st resistance 18173.33
- H4 time frame, 1st support at 15525.96
S&P 500:
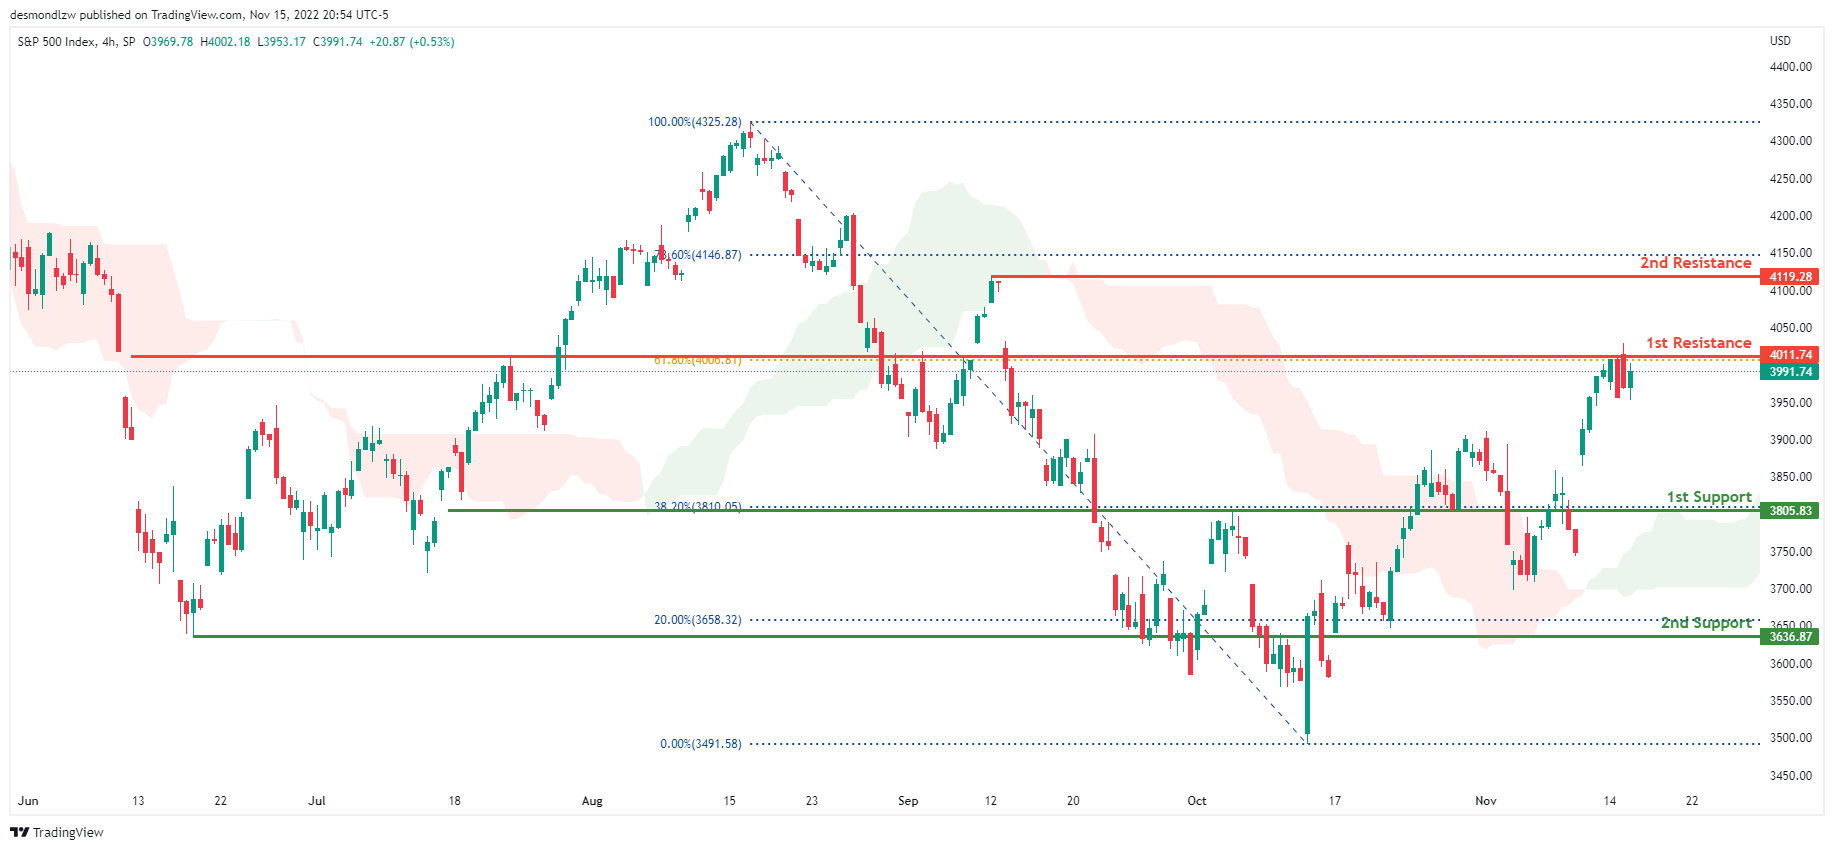
The overall bias for the S&500 on the H4 chart is bullish, with prices above the Ichimoku cloud. If the bullish momentum continues, the price will rise to the first resistance line at 4011.74, where the 61.8% Fibonacci line is located. If the first resistance line is broken, the second resistance line is at 4119.28, which is the previous swing high and the 78.6% Fibonacci line. In an alternate scenario, price could return to the first support line at 3805.83, where the 38.2% Fibonacci line is located.
Areas of consideration:
- H4 time frame, 1st support at 3805.83
- H4 time frame, 1st resistance at 4011.74
- H4 time frame, 2nd resistance at 4119.28
EUR/USD Daily Outlook
Daily Pivots: (S1) 1.0258; (P) 1.0369; (R1) 1.0458; More...
A temporary top is formed at 1.0481 with current retreat. Intraday bias in EUR/USD is turned neutral for some consolidations. Downside should be contained by 1.0092 resistance turned support to bring another rally. Break of 1.0481 will resume the rise from 0.9534 and target 1.0609 fibonacci level.
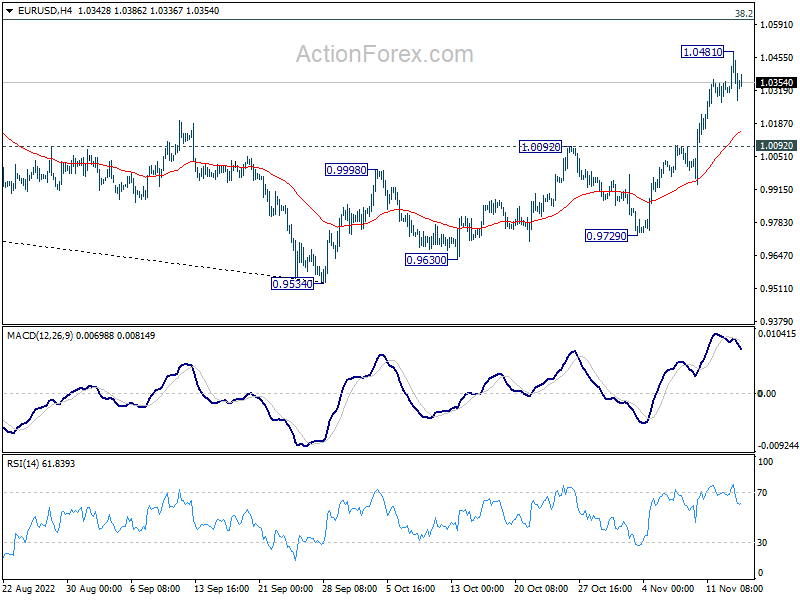
In the bigger picture, a medium term bottom was in place at 0.9534, on bullish convergence condition in daily MACD. Even as a corrective rise, rally from 0.9534 should target 38.2% retracement of 1.2348 (2021 high) to 0.9534 at 1.0609. Sustained trading above 55 week EMA (now at 1.0566) will raise the chance of trend reversal and target 61.8% retracement at 1.1273. This will now remain the favored case as long as 1.0092 resistance turned support holds.
Dollar Recovering, Eyes on UK and Canada CPI
The selloff in Dollar overnight didn't last very long. The greenback is trying to recovery in Asian session, as traders turned cautious on news that Poland was struck by a Russia-made projectile. But overall trading is subdued so far. Aussie and Kiwi are the strongest ones for the week at this point, supported by optimism over China reopening. Yen and Swiss Franc are the weakest on positive risk sentiment. Dollar, Euro and Sterling are mixed. Focuses will now turn to inflation data from the UK and Canada.
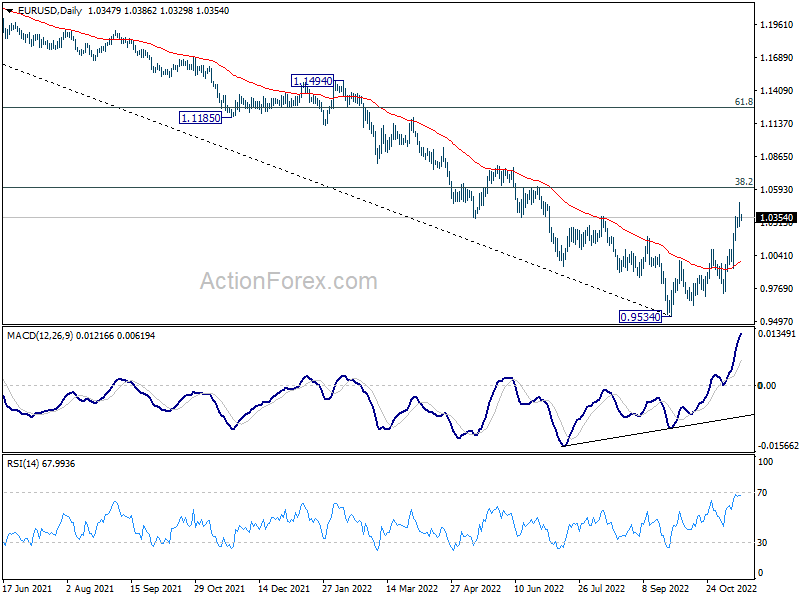
Technically, some attention will stay on Gold to gauge whether Dollar is ready for recovery. Gold is clearly losing upside momentum as seen in 4 hour MACD, as it approaches 38.2% retracement of 2070.06 to 1614.60 at 1788.58. Break of 1753.09 minor support will indicate that a temporary top is at least in place. Deeper decline would then be seen back to 4 hours 55 EMA (now at 1726.20).
In Asia, at the time of writing, Nikkei is up 0.13%. Hong Kong HSI is down -1.14%. China Shanghai SSE is down -0.22%. Singapore Strait Times is down -0.05%. Japan 10-year JGB yield is up 0.0008 at 0.245. Overnight, DOW rose 0.17%. S&P 500 rose 0.87%. NASDAQ rose 1.45%. 10-year yield dropped -0.066 to 3.799.
GBP/CAD pressing key resistance ahead of UK and Canada CPI
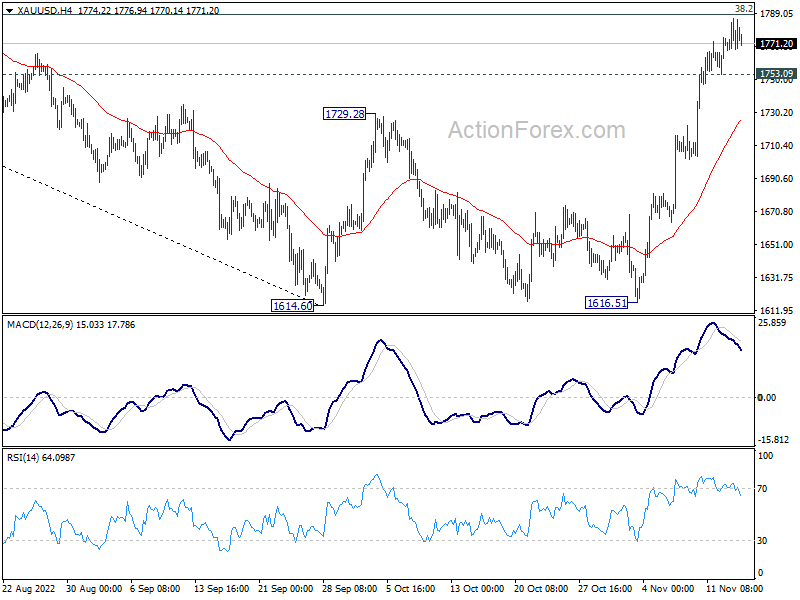
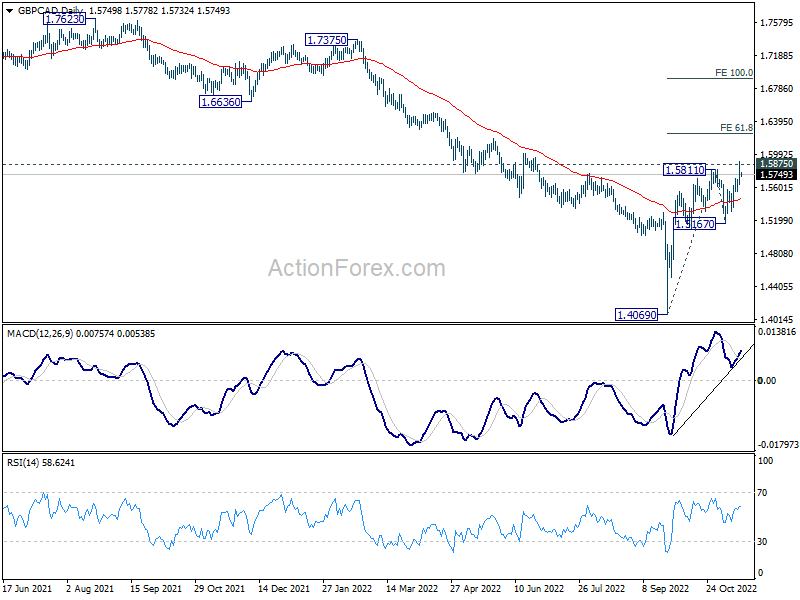
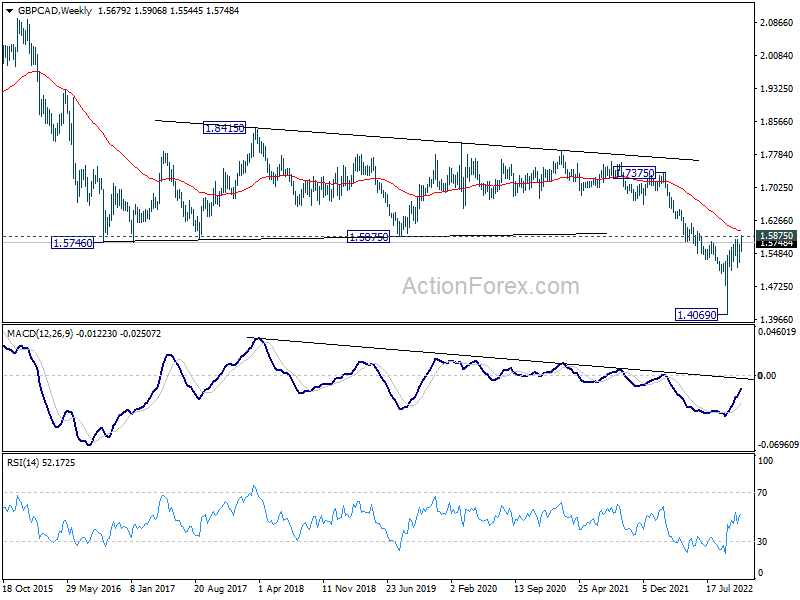
GBP/CAD is a pair to watch today with inflation data from the UK and Canada featured. The cross tried to resume the rise from 1.4069 this week, and breached 1.5811 resistance. Yet, there is no clear follow through buying so far.
Looking at the bigger picture, it's now pressing an important resistance at 1.5875 (2019 low). 55 week EMA (now at 1.6012) is also in proximity. Rejection by this resistance zone, followed by break of 1.5167 support, will keep medium term outlook neutral-to-bearish.
However, sustained break of the resistance will solidify the case of bullish trend reversal. Further break of 61.8% projection of 1.4069 to 21.5811 from 1.5167 at 1.6244 will likely prompt upside acceleration to 100% projection at 1.6909.
Japan machine orders dropped -4.6% mom in Sep
Japan private-sector machine orders dropped sharply by -4.6% mom in September, much worse than expectation of 0.7% mom. That followed a -5.8% mom decline in August.
Nevertheless, for October-December period, manufacturers surveyed by the Cabinet Office are expecting core orders to rise 3.6%.
The government also downgraded its view on machinery orders to "recovery is stalling", from "economy was picking up".
Australia Westpac leading index signals sustained weak growth next year
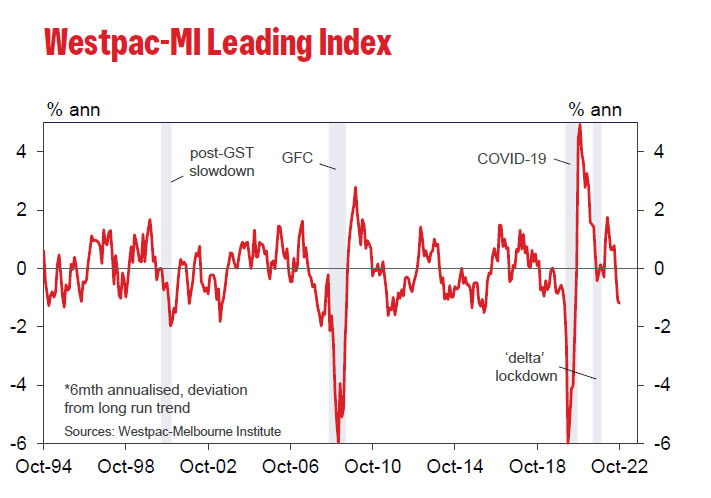
Australia Westpac Leading Index dropped from -1.09% to -1.19% in October, a new post-pandemic low. Westpac said the is consistent with "sustained weak growth" in 2023. It expects GDP growth to slow from around 3.4% in 2022 to just 1% next year.
It added, "key drivers of the slowdown are: monetary policy tightening; falling commodity prices; and softness in jobs growth as capacity constraints bite."
Regarding RBA policy, Westpac expects another 25bps rate hike at the December 6 meeting. And, "a mooted pause in the tightening is unlikely to occur in 2022 or the early months of 2023 as the Bank continues to underperform its inflation objectives."
Looking ahead
Inflation data from the UK is the major focus in European session, with CPI and PPI featured. Later in the day, Canada will publish CPI and housing starts. US will release retail sales, import price, industrial production, business inventories and NAHB housing index.
EUR/USD Daily Outlook
Daily Pivots: (S1) 1.0258; (P) 1.0369; (R1) 1.0458; More...
A temporary top is formed at 1.0481 with current retreat. Intraday bias in EUR/USD is turned neutral for some consolidations. Downside should be contained by 1.0092 resistance turned support to bring another rally. Break of 1.0481 will resume the rise from 0.9534 and target 1.0609 fibonacci level.
In the bigger picture, a medium term bottom was in place at 0.9534, on bullish convergence condition in daily MACD. Even as a corrective rise, rally from 0.9534 should target 38.2% retracement of 1.2348 (2021 high) to 0.9534 at 1.0609. Sustained trading above 55 week EMA (now at 1.0566) will raise the chance of trend reversal and target 61.8% retracement at 1.1273. This will now remain the favored case as long as 1.0092 resistance turned support holds.
Economic Indicators Update
| GMT | Ccy | Events | Actual | Forecast | Previous | Revised |
|---|---|---|---|---|---|---|
| 23:30 | AUD | Westpac Leading Index M/M Oct | -0.10% | 0.00% | ||
| 23:50 | JPY | Machinery Orders M/M Sep | -4.60% | 0.70% | -5.80% | |
| 00:30 | AUD | Wage Price Index Q/Q Q3 | 1.00% | 0.90% | 0.70% | 0.80% |
| 04:30 | JPY | Tertiary Industry Index M/M Sep | -0.4% | 0.60% | 0.70% | |
| 07:00 | GBP | CPI M/M Oct | 1.70% | 0.50% | ||
| 07:00 | GBP | CPI Y/Y Oct | 10.60% | 10.10% | ||
| 07:00 | GBP | Core CPI Y/Y Oct | 6.40% | 6.50% | ||
| 07:00 | GBP | RPI M/M Oct | 1.80% | 0.70% | ||
| 07:00 | GBP | RPI Y/Y Oct | 13.40% | 12.60% | ||
| 07:00 | GBP | PPI Input M/M Oct | 1.00% | 0.40% | ||
| 07:00 | GBP | PPI Input Y/Y Oct | 17.70% | 20.00% | ||
| 07:00 | GBP | PPI Output M/M Oct | 0.00% | 0.20% | ||
| 07:00 | GBP | PPI Output Y/Y Oct | 14.80% | 15.90% | ||
| 07:00 | GBP | PPI Core Output M/M Oct | 1.30% | 0.70% | ||
| 07:00 | GBP | PPI Core Output Y/Y Oct | 14.00% | 14.00% | ||
| 13:15 | CAD | Housing Starts Oct | 275K | 300K | ||
| 13:30 | CAD | CPI M/M Oct | 0.80% | 0.10% | ||
| 13:30 | CAD | CPI Y/Y Oct | 7.00% | 6.90% | ||
| 13:30 | CAD | CPI Median Y/Y Oct | 4.80% | 4.70% | ||
| 13:30 | CAD | CPI Trimmed Y/Y Oct | 5.30% | 5.20% | ||
| 13:30 | CAD | CPI Common Y/Y Oct | 5.90% | 6.00% | ||
| 13:30 | USD | Retail Sales M/M Oct | 0.90% | 0.00% | ||
| 13:30 | USD | Retail Sales ex Autos M/M Oct | 0.40% | 0.10% | ||
| 13:30 | USD | Import Price Index M/M Oct | -0.50% | -1.20% | ||
| 14:15 | USD | Industrial Production M/M Oct | 0.20% | 0.40% | ||
| 14:15 | USD | Capacity Utilization Oct | 80.40% | 80.30% | ||
| 15:00 | USD | Business Inventories Sep | 0.50% | 0.80% | ||
| 15:00 | USD | NAHB Housing Market Index Nov | 36 | 38 | ||
| 15:30 | USD | Crude Oil Inventories | -2.0M | 3.9M |
GBP/CAD pressing key resistance ahead of UK and Canada CPI
GBP/CAD is a pair to watch today with inflation data from the UK and Canada featured. The cross tried to resume the rise from 1.4069 this week, and breached 1.5811 resistance. Yet, there is no clear follow through buying so far.
Looking at the bigger picture, it's now pressing an important resistance at 1.5875 (2019 low). 55 week EMA (now at 1.6012) is also in proximity. Rejection by this resistance zone, followed by break of 1.5167 support, will keep medium term outlook neutral-to-bearish.
However, sustained break of the resistance will solidify the case of bullish trend reversal. Further break of 61.8% projection of 1.4069 to 21.5811 from 1.5167 at 1.6244 will likely prompt upside acceleration to 100% projection at 1.6909.
Japan machine orders dropped -4.6% mom in Sep
Japan private-sector machine orders dropped sharply by -4.6% mom in September, much worse than expectation of 0.7% mom. That followed a -5.8% mom decline in August.
Nevertheless, for October-December period, manufacturers surveyed by the Cabinet Office are expecting core orders to rise 3.6%.
The government also downgraded its view on machinery orders to "recovery is stalling", from "economy was picking up".
Australia Westpac leading index signals sustained weak growth next year
Australia Westpac Leading Index dropped from -1.09% to -1.19% in October, a new post-pandemic low. Westpac said the is consistent with "sustained weak growth" in 2023. It expects GDP growth to slow from around 3.4% in 2022 to just 1% next year.
It added, "key drivers of the slowdown are: monetary policy tightening; falling commodity prices; and softness in jobs growth as capacity constraints bite."
Regarding RBA policy, Westpac expects another 25bps rate hike at the December 6 meeting. And, "a mooted pause in the tightening is unlikely to occur in 2022 or the early months of 2023 as the Bank continues to underperform its inflation objectives."
Bitcoin Price Recovery Could Fade Above $17,500
Key Highlights
- Bitcoin price started an upside correction from the $15,540 zone.
- A key bearish trend line is forming with resistance near $17,320 on the 4-hours chart.
- The price could struggle to gain bullish momentum above $17,500 and $18,000.
- EUR/USD and GBP/USD extended gains above 1.0400 and 1.1950 respectively.
Bitcoin Price Technical Analysis
Bitcoin price declined heavily against the US dollar after the collapse of FTX exchange. BTC/USD broke the $20,000 support and even spiked below the $16,000 level.
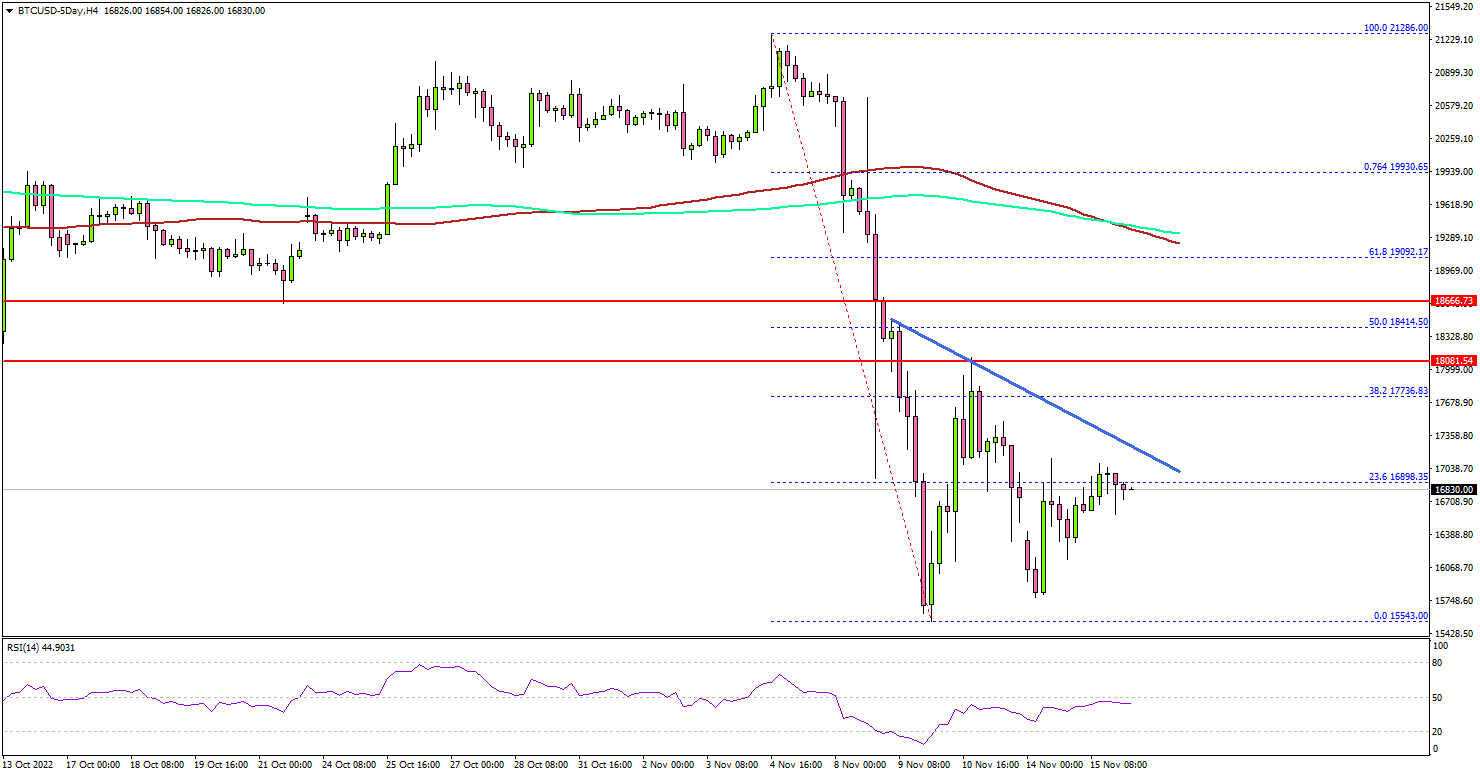
Looking at the 4-hours chart, the pair settled below the $17,000 level, the 100 simple moving average (red, 4-hours), and the 200 simple moving average (green, 4-hours).
It traded as low as $15,543 before the bulls took a stand. Bitcoin price started a recovery wave above the $16,500 resistance zone. There was a minor move above the 23.6% Fib retracement level of the main drop from the $22,286 swing high to $15,543 low.
On the upside, the price is facing a significant resistance at $17,350. There is also a key bearish trend line forming with resistance near $17,320 on the same chart.
The next resistance sits near the $18,000 zone. It is near the 50% Fib retracement level of the main drop from the $22,286 swing high to $15,543 low. A close above the $18,000 level may perhaps start another steady increase in the coming days.
In the stated case, the price could rise towards the $19,150 level. Any more gains could set the pace for a move towards the $20,000 level.
On the downside, an initial support sits near the $16,150 level. The main breakdown support sits near the $15,500 zone. If there is a downside break, bitcoin might decline towards the $13,800 support in the coming days.
Economic Releases
- UK Consumer Price Index for Oct 2022 (YoY) – Forecast +10.7%, versus +10.1% previous.
- UK Core Consumer Price Index for Oct 2022 (YoY) – Forecast +6.4%, versus +6.5% previous.
- US Retail Sales for Oct 2022 (MoM) – Forecast +1.0%, versus 0% previous.
USDCHF Wave Analysis
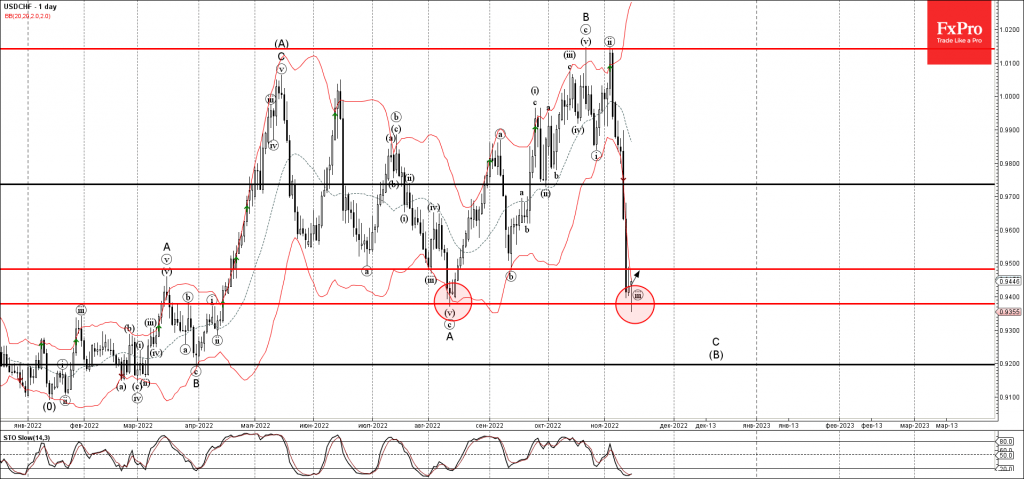
- USDCHF reversed up from support level 0.9380
- Likely to rise to resistance level 0.9485
USDCHF recently reversed up from the support level 0.9380 (former multi-month low from the start of August) standing below the lower daily Bollinger Band.
The upward reversal from the support level 0.9380 stopped the earlier short-term impulse wave (iii) of the sharp C-sequence from the middle of October.
Given the oversold daily Stochastic, USDCHF can be expected to rise further toward the next resistance level 0.9485 (former monthly low from September).