Sample Category Title
AUDCAD Wave Analysis
- AUDCAD broke the resistance level 0.8835
- Likely to rise to resistance level 0.8965
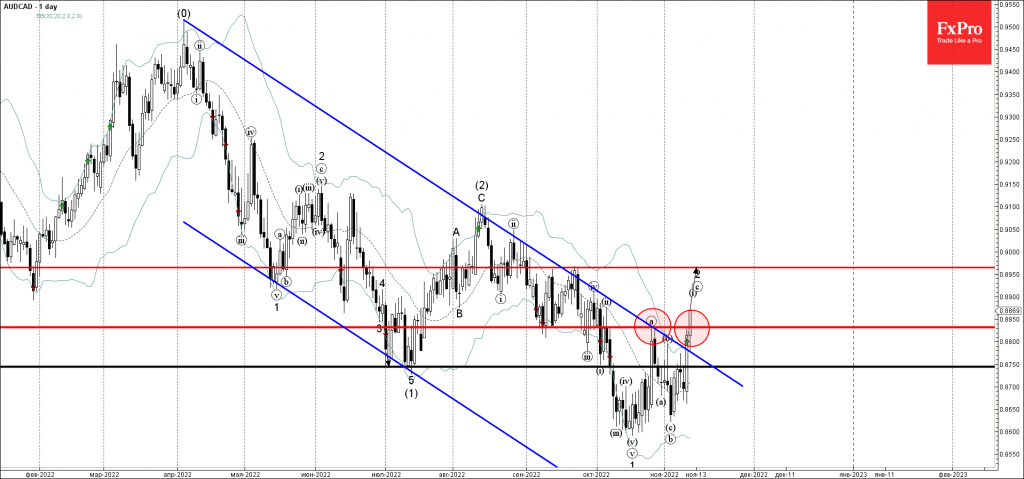
AUDCAD recently broke the resistance level 0.8835 (top of wave (a) from the end of October, former support from September).
The breakout of the resistance level 0.8835 was preceded by the breakout of the resistance trendline of the weekly down channel from April – which accelerated the active impulse wave (c).
AUDCAD can be expected to rise further toward the next resistance level 0.8965 (former double top from September and the forecast price for the completion of the active wave c).
UK Economy Softer Landing and More Solid Pound
The pound rally gained new momentum on Friday morning, following a respite after the 3% rise in GBPUSD on Thursday. The British currency was supported predominantly by better-than-expected economic data and comments from the Governor of the Bank of England on the intention for further rate hikes.
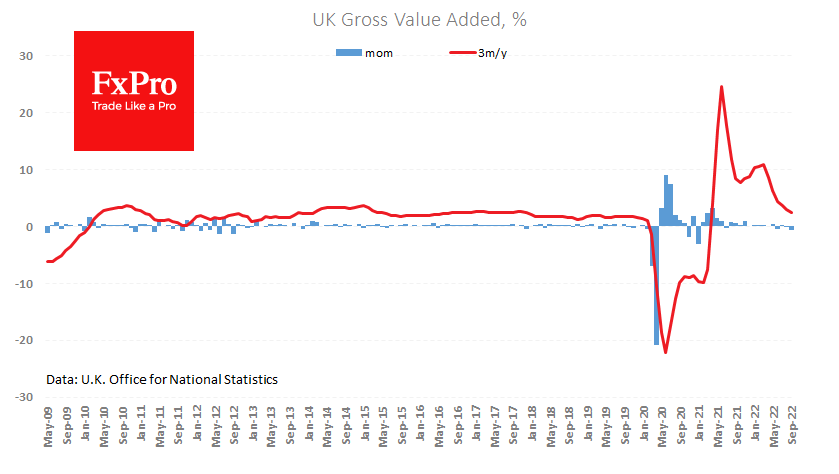
The UK economy contracted by 0.2% in the third quarter – noticeably less than the forecasted drop of 0.5%. One year ago, growth in the same period diminished to 2.4% after 4.4% in the second quarter and +2.1% expected. For September, the economy contracted by 0.6%, following a decline of 0.1% in August.
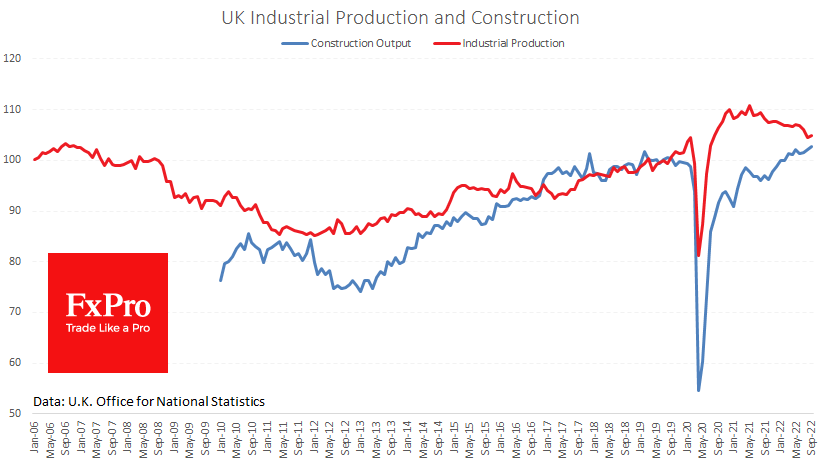
Industrial production added 0.2% in September, losing 3.1% y/y. Manufacturing is more challenging, holding on to volumes in September after contracting by a cumulative 2.9% in the previous three months.
Separately, there is an improvement in the balance of foreign trade. The monthly deficit decreased to 15.6bn compared to 17.2bn a month before, 16.1bn a year ago and a peak of 23 in January. However, this is well above ‘normal’ levels from 2013 to 2019, near 12bn. Exports are up 46% y/y, or 11.8bn and imports are up 27% or 11.4bn.
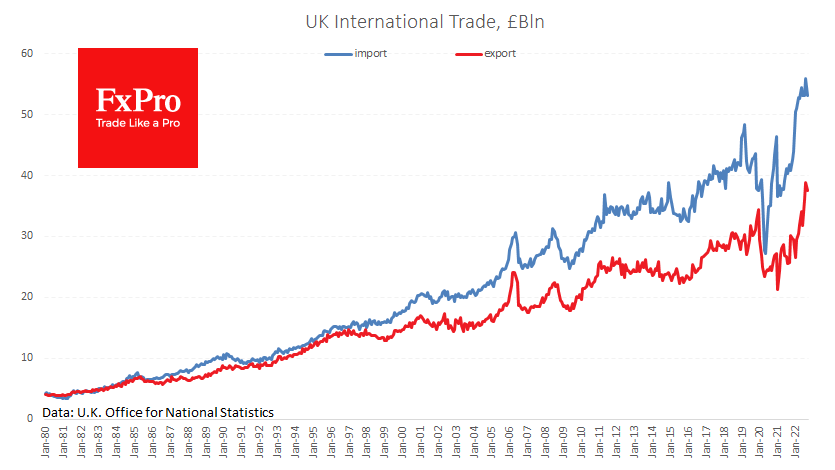
The UK economy has started to contract without surprises, evidenced by earlier labour market figures. So far, it is a softer landing than previously feared.
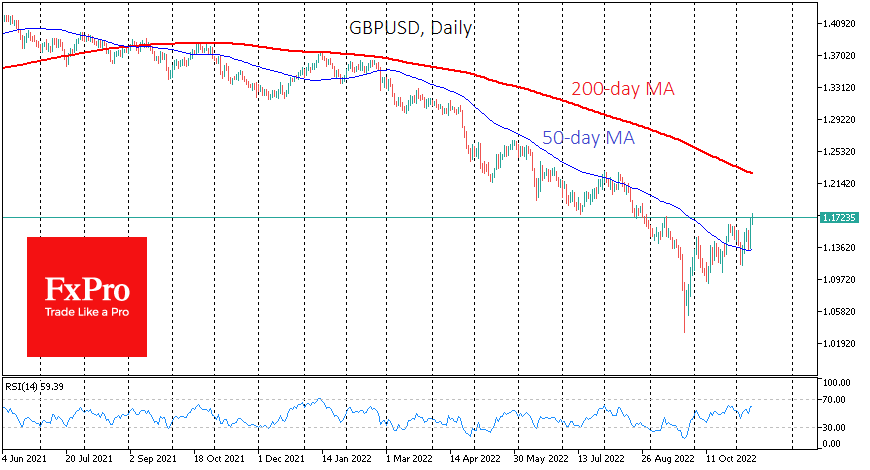
Nevertheless, it is essential for market participants that the published data shows a less tragic slowdown trajectory and that the decline in commodity prices in recent months is easing the pressure on imports and industry. In this environment, there are more and more reasons for long-term buying of the British pound, which renewed its historic low against the dollar in September. As a result, the GBPUSD is now above 1.1750, having beaten off losses since August.
The rise in the British currency also shows signs of breaking the downtrend as GBPUSD has surpassed previous local highs and has consolidated above the 50-day average. On the technical analysis side, GBPUSD may encounter little resistance up to the 1.20 area by the end of the month, where the bulls will still have to prove their strength.
What Just Happened With the Dollar?
Yesterday, the US reported headline and core CPI figures well below expectations. Stock markets around the world jumped, and the dollar got weaker as yields fell. The market cut its outlook for rate hikes. Commodities also got a boost. Is this the start of a new trend, or will the move fade? Let's take a look under the headlines to better understand what is going on, and what could be coming.
The most important takeaway
As pointed out earlier in the week, the data has an important impact on expectations around future Fed policy. Before the release, economists were evenly split on whether the Fed would raise rates by 25bps or 50bps at their next meeting. After the release, the percentage of economists forecasting 25bps jumped to over 85%, with the market moving to price in a lower hike.
Not only that but the market reevaluated its terminal rate for Fed hikes. Before it was estimated that the Fed would hike to slightly above 5.00%. It currently is at 4.00%, meaning more than four 25bps moves until the end of the hiking cycle. Now, that has been repriced to the terminal rate being below 5.00%, so there would be a maximum of 100bps of hikes over the next five months. That is, according to current estimates.
The future trajectory
That could mean a 25bps in December, and then even the possibility of a pause in January. Or just three more quarter-point hikes. That substantially reduced yields on US treasuries, which in turn dragged down the value of the dollar. But, here's the big question: Will this trend be sustained? Because right up until yesterday, inflation was rising. This could be just a short-term correction in a continuing trend - or the CPI figure could be revised with the next release.
Looking closer at the components of CPI, a few things stand out. First was the drop in rent, the largest contributor to the miss of estimates. Rent prices have declined in line with a major slump in the housing market, as higher interest rates have made buying homes more expensive. With house prices slowing down, rents aren't rising.
Getting further into the details
The other two areas where there were unexpected price drops was in apparel and used vehicles. Both of these were driven by tighter financial conditions as Americans have seen their real wages fall for 18 consecutive months. With higher borrowing costs, it's harder for Americans to dip into credit to buy things, as well.
With a stronger dollar, the cost of imported goods has gone down. But with expectations that the Fed won't hike as much, the dollar would get weaker and imported goods would start costing more. We should remember that last quarter's GDP was positive primarily because consumers were buying less imported goods. Such as apparel. If the dollar continues its downward trend, it could bring back core inflation and weigh on this quarter's GDP result.
Although the immediate speakers from the Fed after the data release have hinted at lower rates, the bottom line is that the lower inflation reading depends a lot on interest rates. Over the next month, interest rate expectations might be lower and that could push inflation a little higher and change the evaluation of what will happen at the next Fed meeting. Remember; November CPI figures come out the day before the FOMC in December.
BoE Bailey: Takes 18 to 24 months to bring inflation under control
BoE Governor Andrew Bailey said that inflation was "way above where we (want) it to be". He added, "inflation is bad for the least well-off generally and this inflation is particularly bad."
Bailey noted that further rate hikes were likely in the coming months. Meanwhile, efforts to bring inflation under control are likely to take between 18 months and two years.
GBPJPY Pauses Decline at 50-day SMA
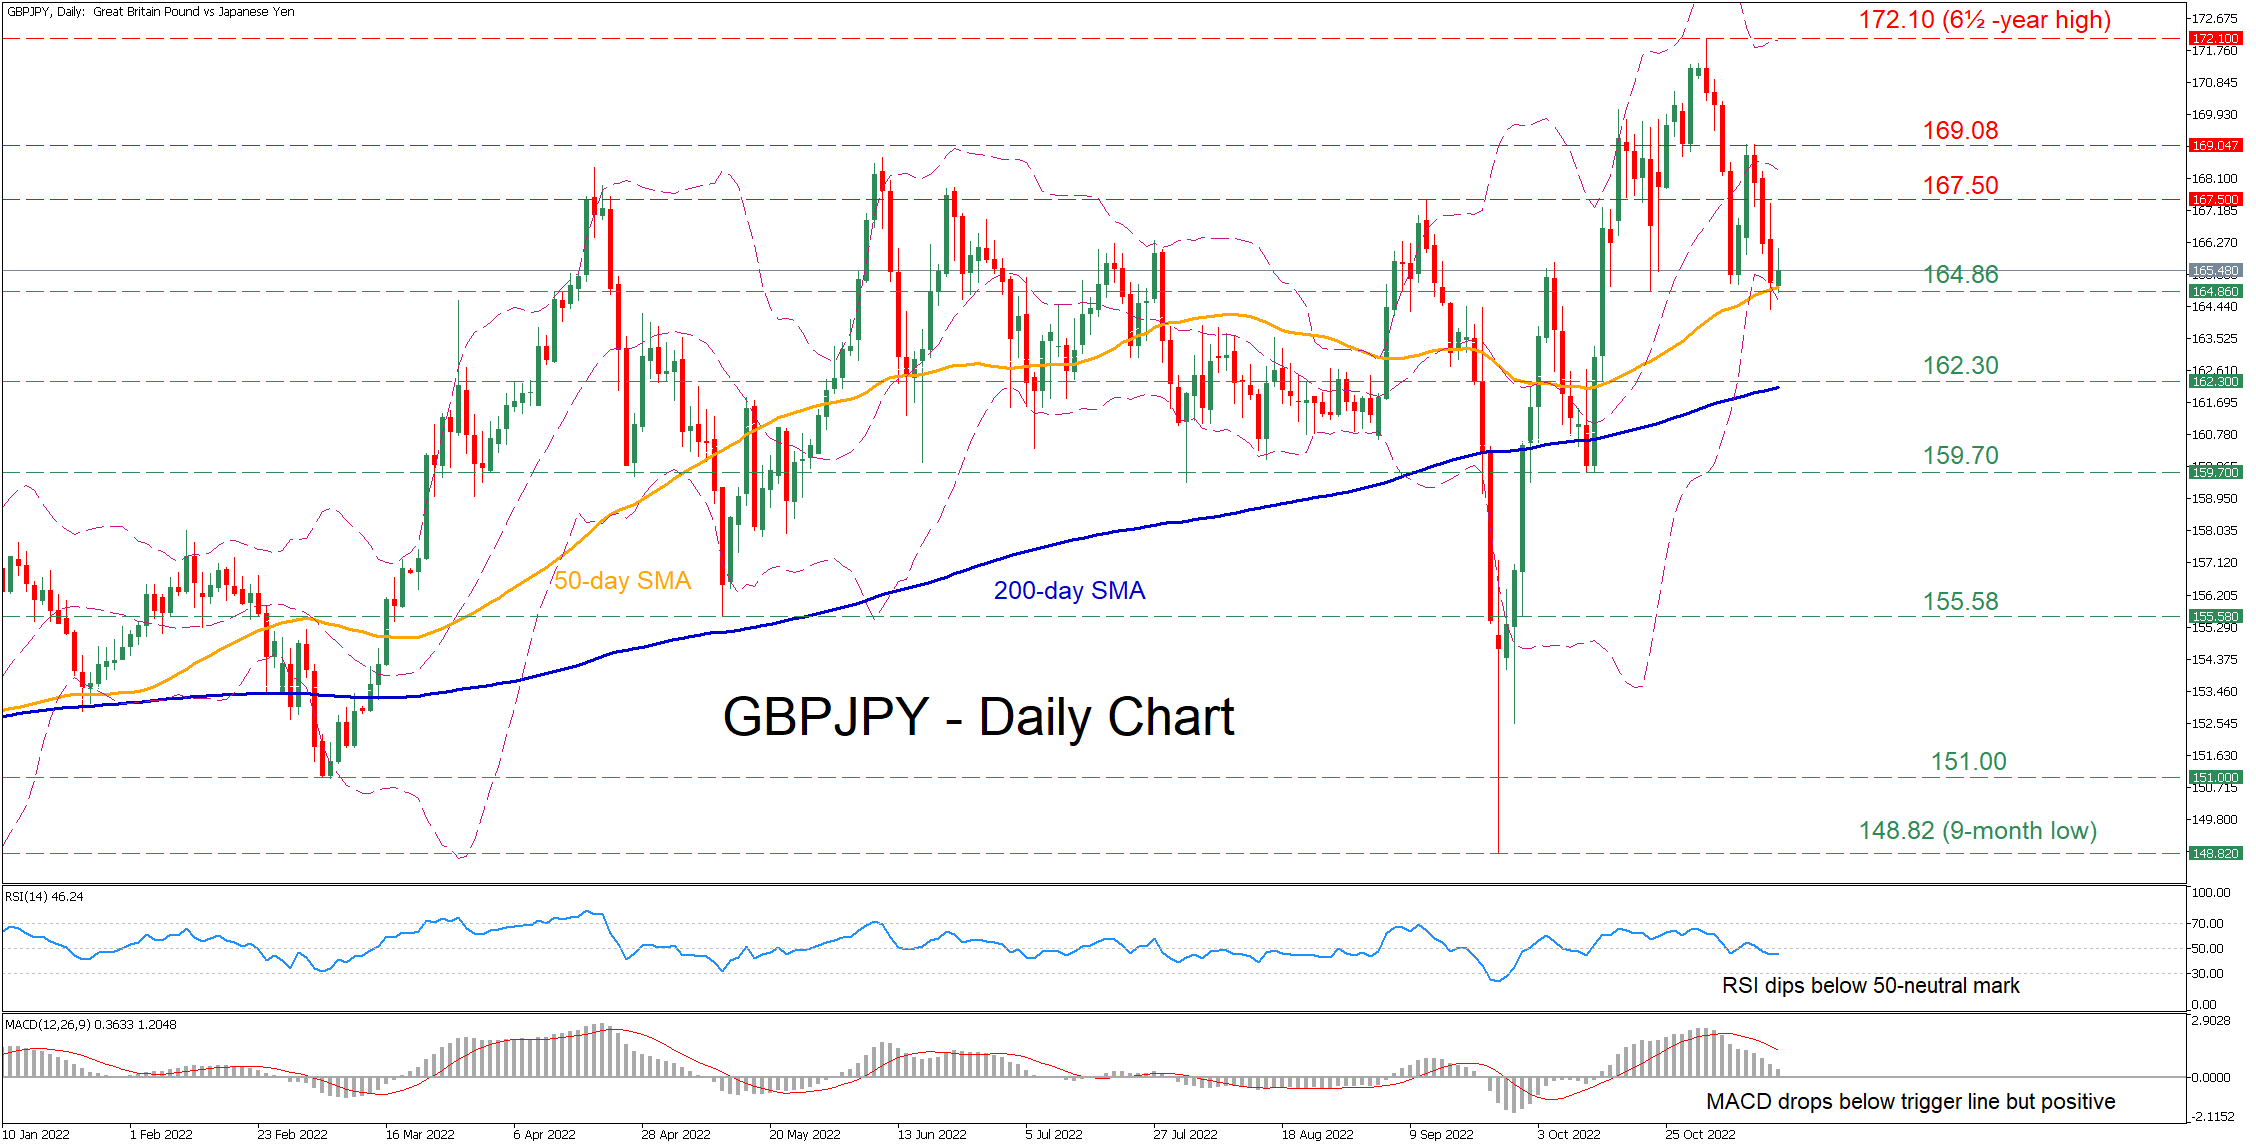
GBPJPY has experienced a steep uptrend since late September, with the price gaining almost 15% and posting a fresh 6½-year high of 172.10. Even though the pair has been losing ground in the short term, the 50-day simple moving average (SMA) has capped its downside.
The short-term oscillators are indicating that bearish forces are strengthening. Specifically, the RSI has dived beneath its 50-neutral mark, while the MACD histogram is softening below its red signal line but remains in the positive territory.
If selling pressures persist, immediate support could be met at 164.86, which overlaps with the 50-day SMA. Sliding beneath that floor, the bears could aim for 162.30 before the October low of 159.70 appears on the radar. Failing to halt there, the attention could shift to the May bottom of 155.58.
On the flipside, bullish actions could propel the price towards the October resistance of 167.50. Piercing through this region, further advances could come to a halt at the double-top region of 169.08. A break above the latter may then set the stage for the 6½-year high of 172.10.
Overall, GBPJPY managed to cease its decline for now, but its short-term picture is constantly deteriorating. Therefore, a break below the 50-day simple moving average could trigger a sustained downtrend.
GBPUSD: The Weekly Bullish Engulfing Adds to Positive Near-term Outlook
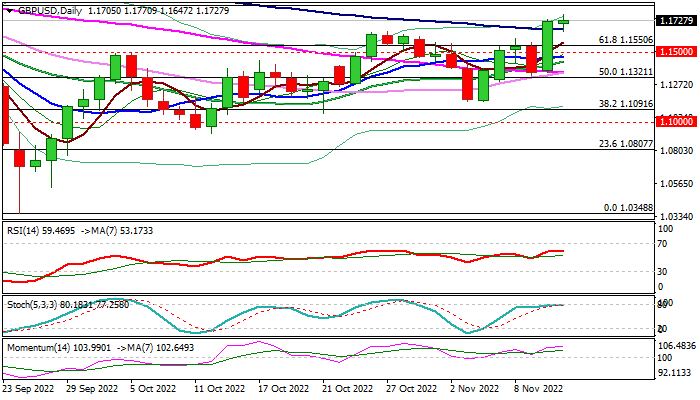
Cable keeps positive tone following Thursday’s 3.3% rally, which generated an additional bullish signal on close above descending 100DMA (1.1658).
Weaker dollar keeps pound inflated and bulls focus target at 1.1834 (Fibo 76.4% of 1.2293/1.0348), the last obstacle en-route to psychological 1.20 barrier.
Bullish daily techs are additionally supported by formation of bullish engulfing pattern on weekly chart, though a pause for consolidation on overbought conditions / partial profit-taking cannot be ruled out.
Broken 100DMA offers immediate support ahead of broken Fibo 61.8% (1.1550) and 1.1500 level which should keep the downside protected and offer better buying levels.
Res: 1.1770; 1.1834; 1.1900; 1.2000.
Sup: 1.1658; 1.1645; 1.1550; 1.1500.
Dollar Index: Dollar Remains Under Strong Pressure and Extends Weakness on Friday
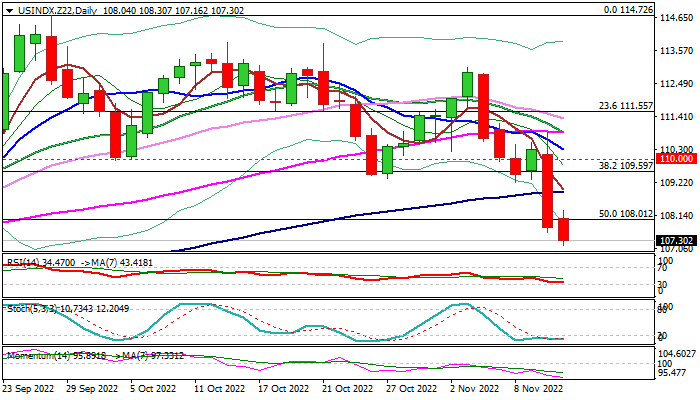
The dollar index remains under strong pressure and extends weakness in European session on Friday, following 2.2% fall previous day, when the greenback was deflated by lower than expected US inflation rise in October that adds to hopes that strong price pressures have started to ease, and the US central bank may start softening its aggressive stance in tightening monetary policy to bring high inflation under control.
The dollar is also on track for the biggest weekly loss since the third week of March 2020 that adds to signals of reversal, which is developing on weekly chart.
Daily studies turned to bearish setup as fresh bearish acceleration have so far retraced over 50% of 101.29/114.72 upleg) after Thursday’s sharp fall broke through pivotal support at 109.59 (Fibo 38.2% / base of thick daily cloud) and bearish momentum continues to strengthen.
Bears focus next target at 106.42 (Fibo 61.8% of 101.29/114.72), violation of which would risk extension towards rising 200DMA (104.68), as dollar’s sentiment has weakened significantly.
However, bears may take a breather on oversold conditions and week-end profit taking, with upticks to ideally stay capped under broken 100DMA (108.93) which guards pivotal barriers at 109.59/110.00 (broken Fibo 38.2% / psychological).
Res: 108.30; 108.93; 109.59; 110.00.
Sup: 107.16; 106.42; 105.42; 104.68.
Yen Extends Rally as Japan’s PPI Eases
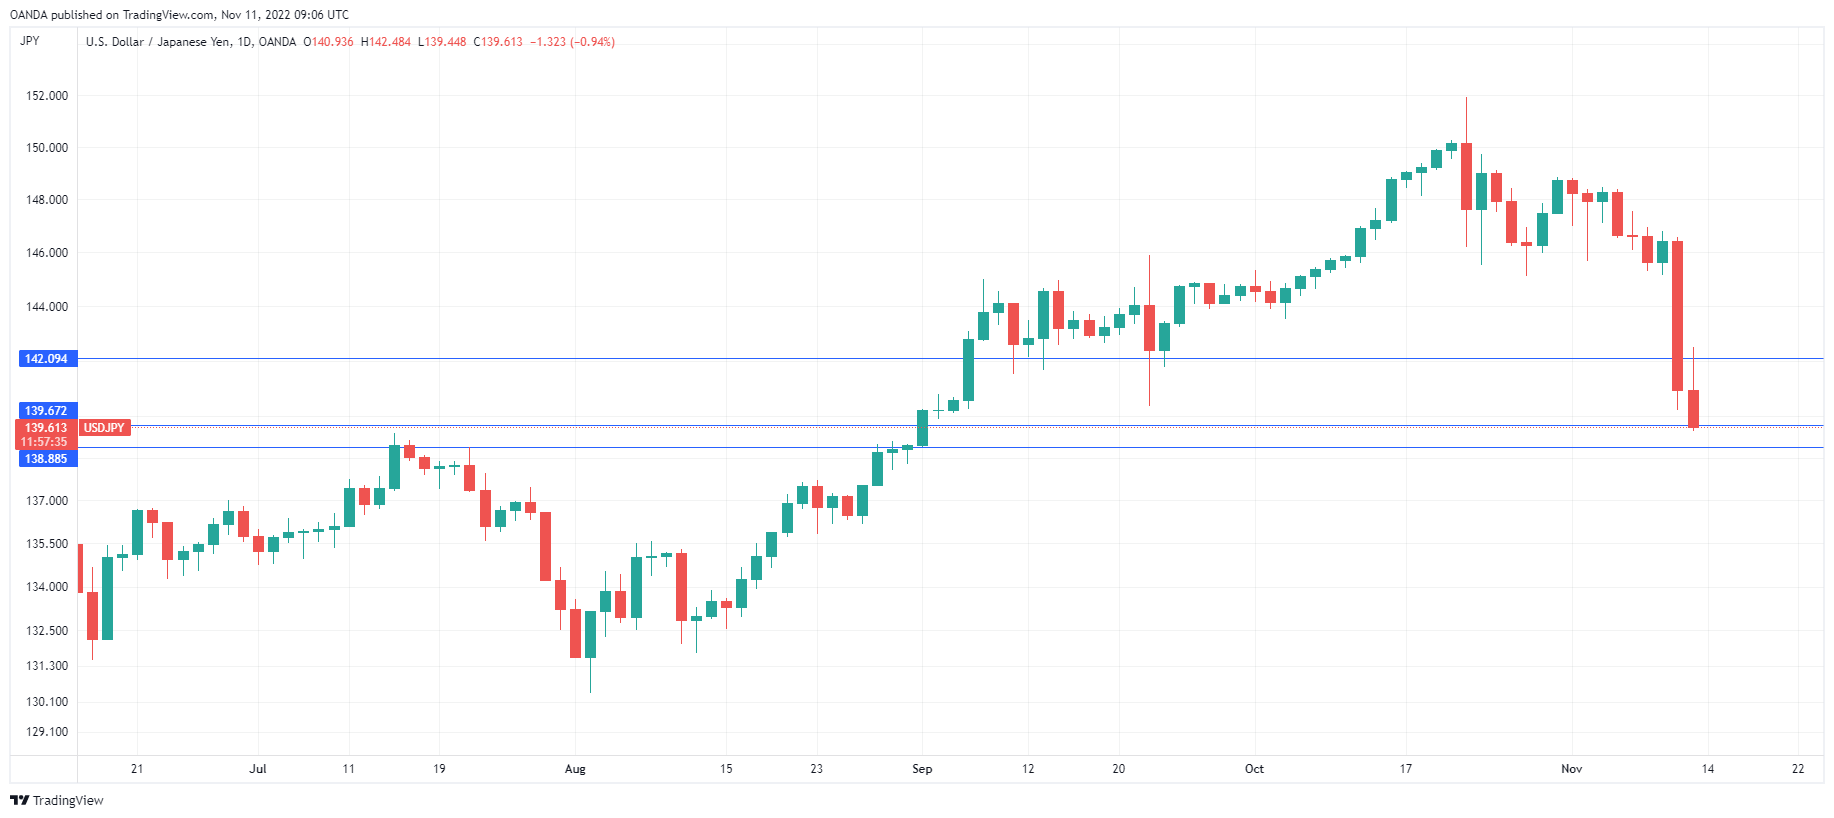
The Japanese yen is taking a breather after posting huge gains on Thursday. In the European session, USD/JPY is trading at 140.30, down 0.45%.
Japan’s PPI declines
The week wrapped up with a key inflation release. Japan’s Producer Price Index slowed to 9.1% in October, down from 10.2% in September. Still, this was above the consensus of 8.8%. Consumer inflation is running around 3%, much lower than in other developed countries but high for Japan. The Bank of Japan has taken note of the rise in inflation but has said that it will not change its ultra-loose policy until it is convinced that inflation is not transient.
The yen has fallen around 20% this year against the dollar but jumped on the bandwagon on Thursday after a soft US inflation report caused the dollar to plummet. Headline inflation dropped to 7.7%, down from 8.2% and core inflation dropped to 6.3%, down from 6.6%. Although inflation remains high, both indicators were lower than expected, which triggered a stampede as US stock markets soared and the US dollar was crushed.
The soft inflation report has raised expectations that the Fed will ease up on the pace of tightening and will raise rates by “only” 50 basis points rather than 75 bp at the December meeting. According to Fed Watch, the markets had priced in a 50 basis point hike in December at 55% (45% for a 75 bp move) prior to the inflation release. This changed dramatically after the inflation release – currently, a 50 bp hike is priced in at 85%, with just 15% for a 75 bp move.
Investors seem to be ignoring Fed Chair Powell’s comment last week that the benchmark rate would peak at a higher level than previously expected, which could mean a terminal rate of 5.0% or even higher. The enthusiasm investors are showing could dampen if the upcoming employment and inflation reports point are stronger than expected.
USD/JPY Technical
- USD/JPY has support at 139.66 and 138.88
- 142.11 is the next resistance line
British Pound Extends Rally
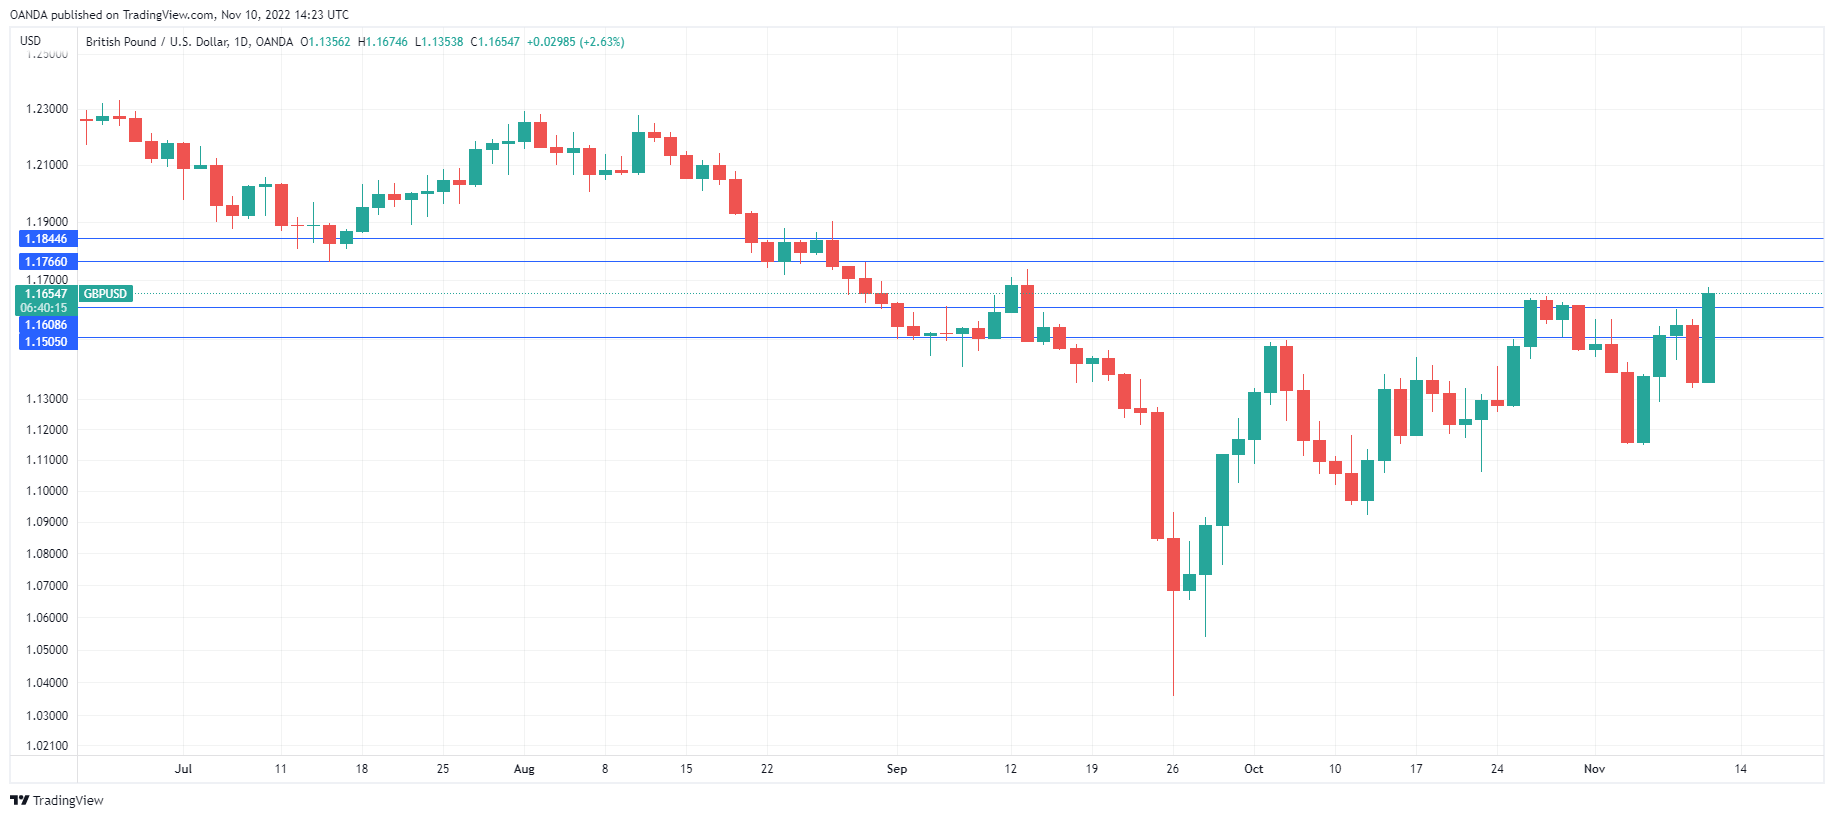
The British pound has extended its gains today, following a huge Thursday. In the European session, GBP/USD is trading at 1.1729, up 0.15%.
US dollar crashes after soft inflation report
The US dollar was in full retreat on Thursday, after the October inflation report indicated that inflation had fallen more than expected. Headline CPI dropped to 7.7%, down from 8.2% in September and below the consensus of 8.0%. Core inflation slowed to 6.3%, down from 6.6% and lower than the forecast of 6.5%. Although inflation still remains high, investors were impressed and went all in on equities. US stocks posted their biggest one-day gain in over two years, and the US dollar was crushed in the stampede. GDP/USD jumped a massive 3.1% and pushed above 1.17 for the first time since mid-September.
The soft inflation report has fueled bets that the Fed will ease up on the pace of tightening. According to Fed Watch, the markets had priced in a 50 basis point hike in December at 55% (45% for a 75 bp move) prior to the inflation release, but this has changed to an 85% likelihood of a 0.50% (15% for 75 bp increase). Investors appear to be ignoring Fed Chair Powell’s comment last week that the benchmark rate would peak at a higher level than previously expected, which could mean a terminal rate of 5.0% or even higher. The Fed has not switched to a dovish stance, but investors are betting that the drop in inflation will force the Fed to pivot.
In the UK, today’s data was soft but better than expected. GDP for Q3 came in at -0.2% QoQ, down from 0.2% in Q2 but above the consensus of -0.5%. Manufacturing Production for September improved to zero, up from -1.6% reading in August and above the consensus of -0.4%.
GBP/USD Technical
- GBP/USD is testing resistance at 1.1767. The next resistance line is 1.1844
- 1.1609 and 1.1467 and providing support
XAUUSD: Bulls Have a Great Potential to Bring the Price to 1802.65
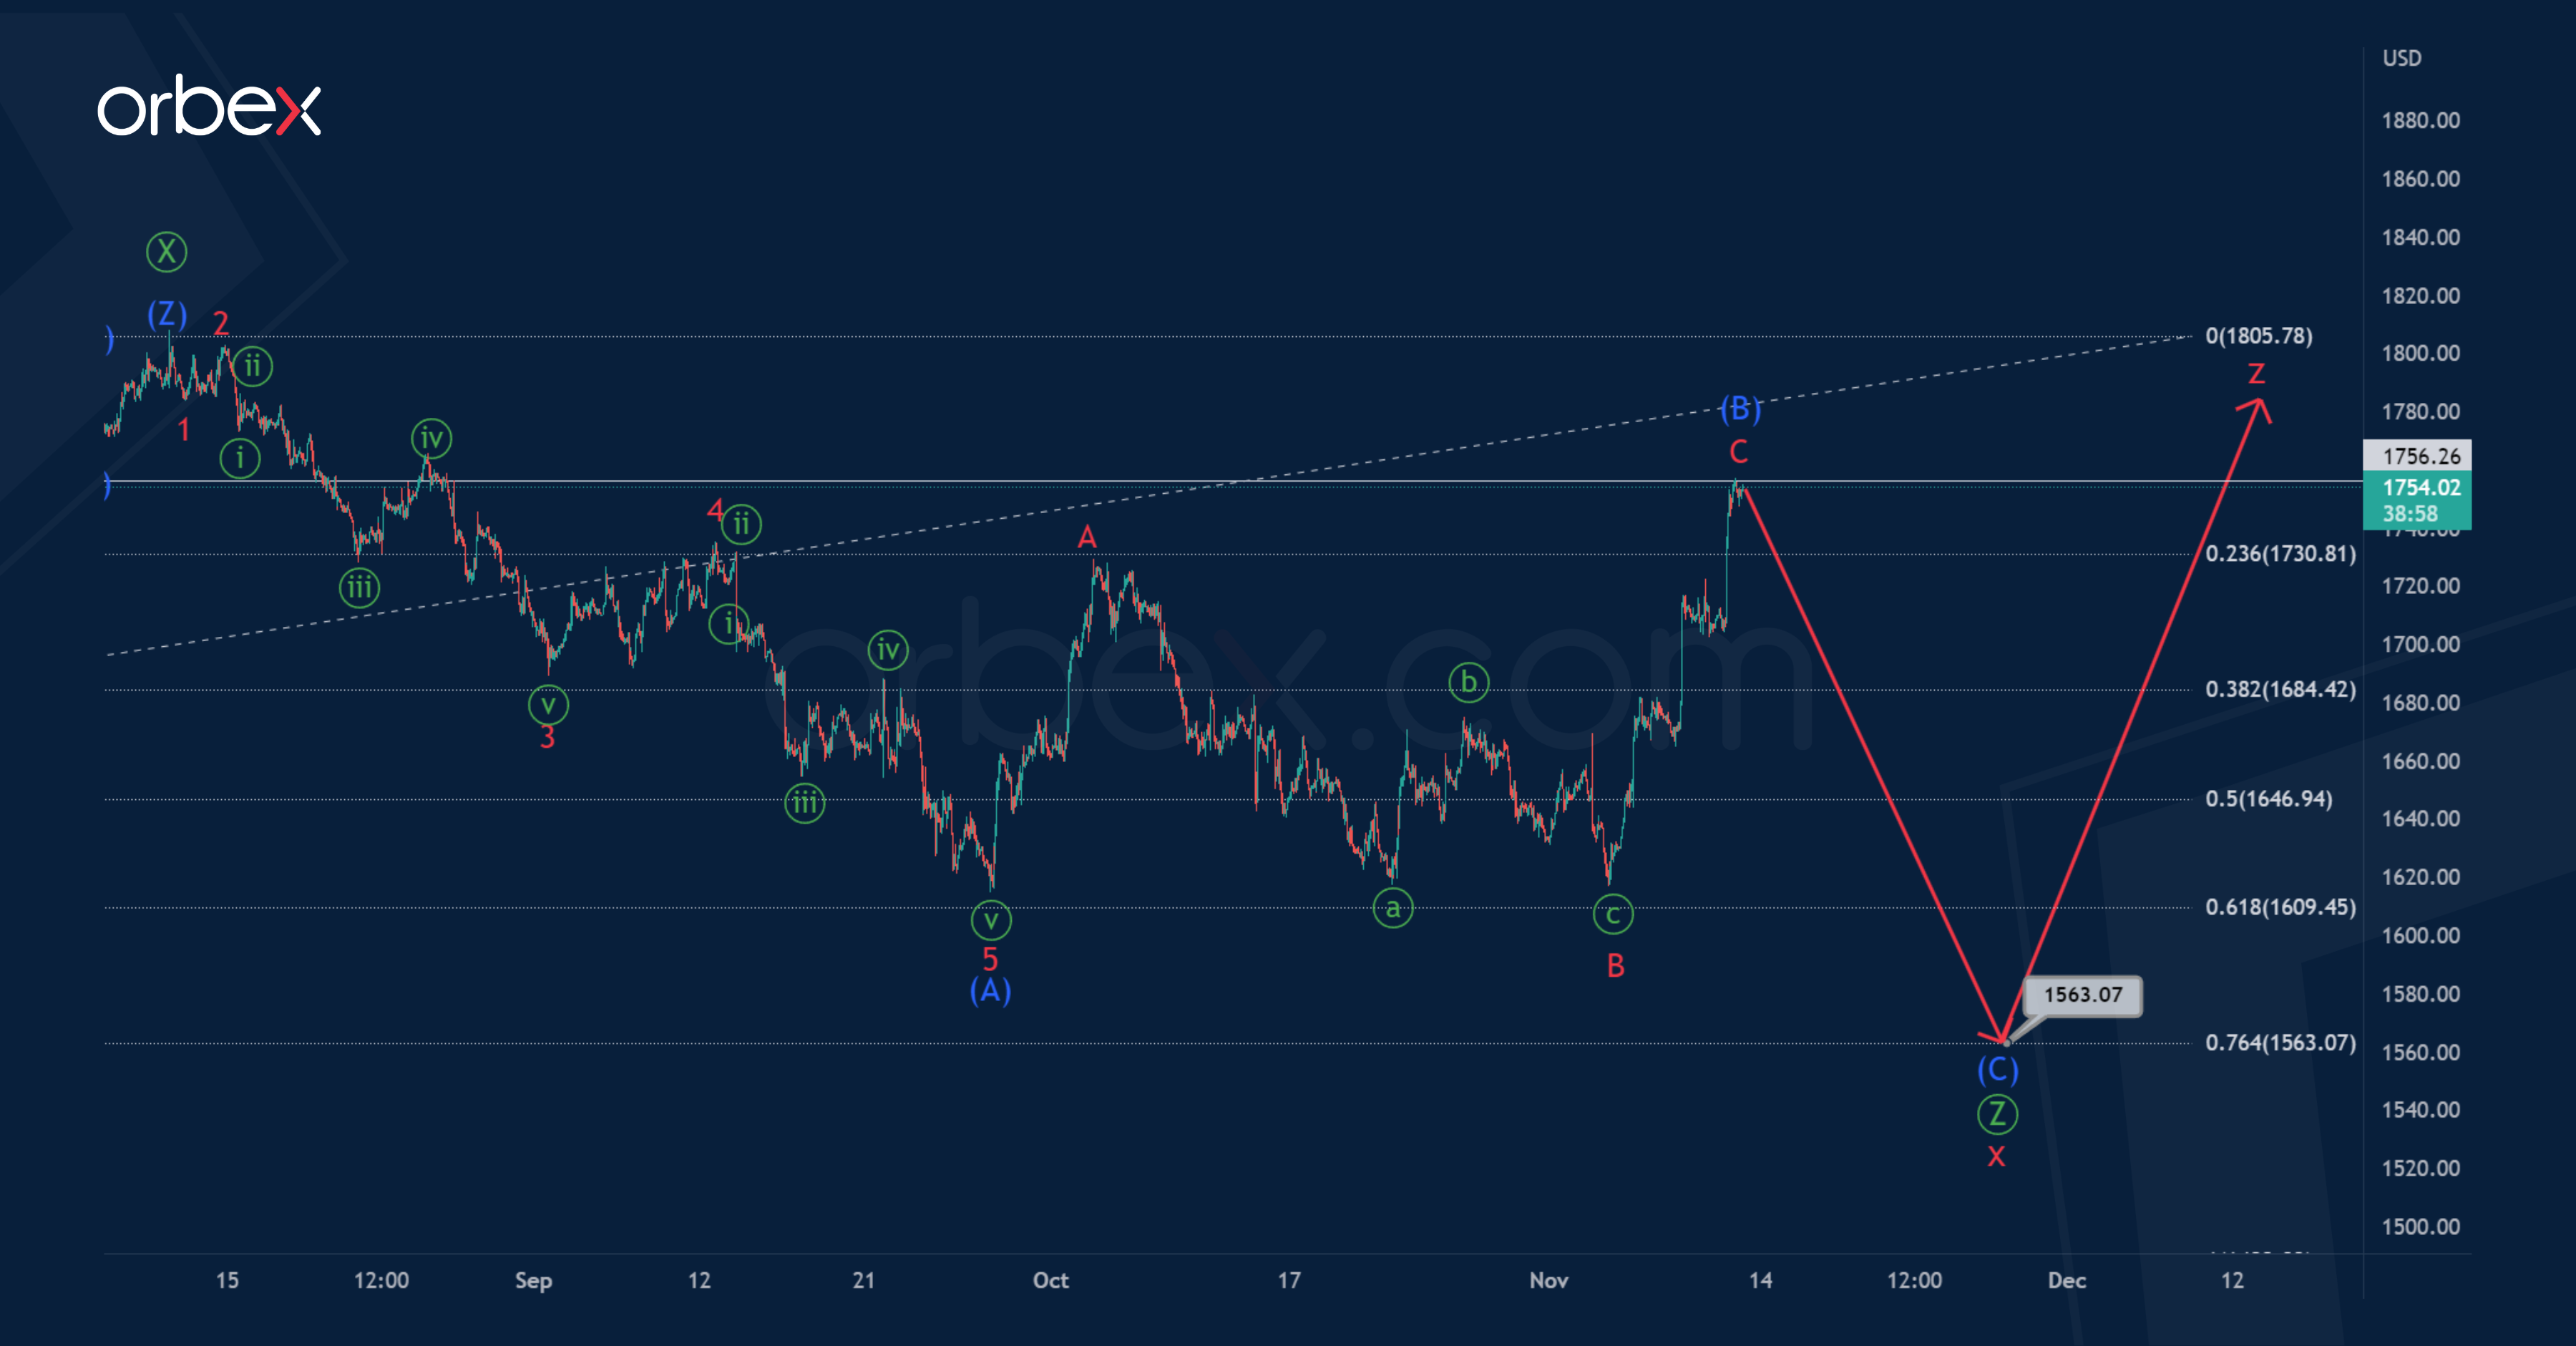
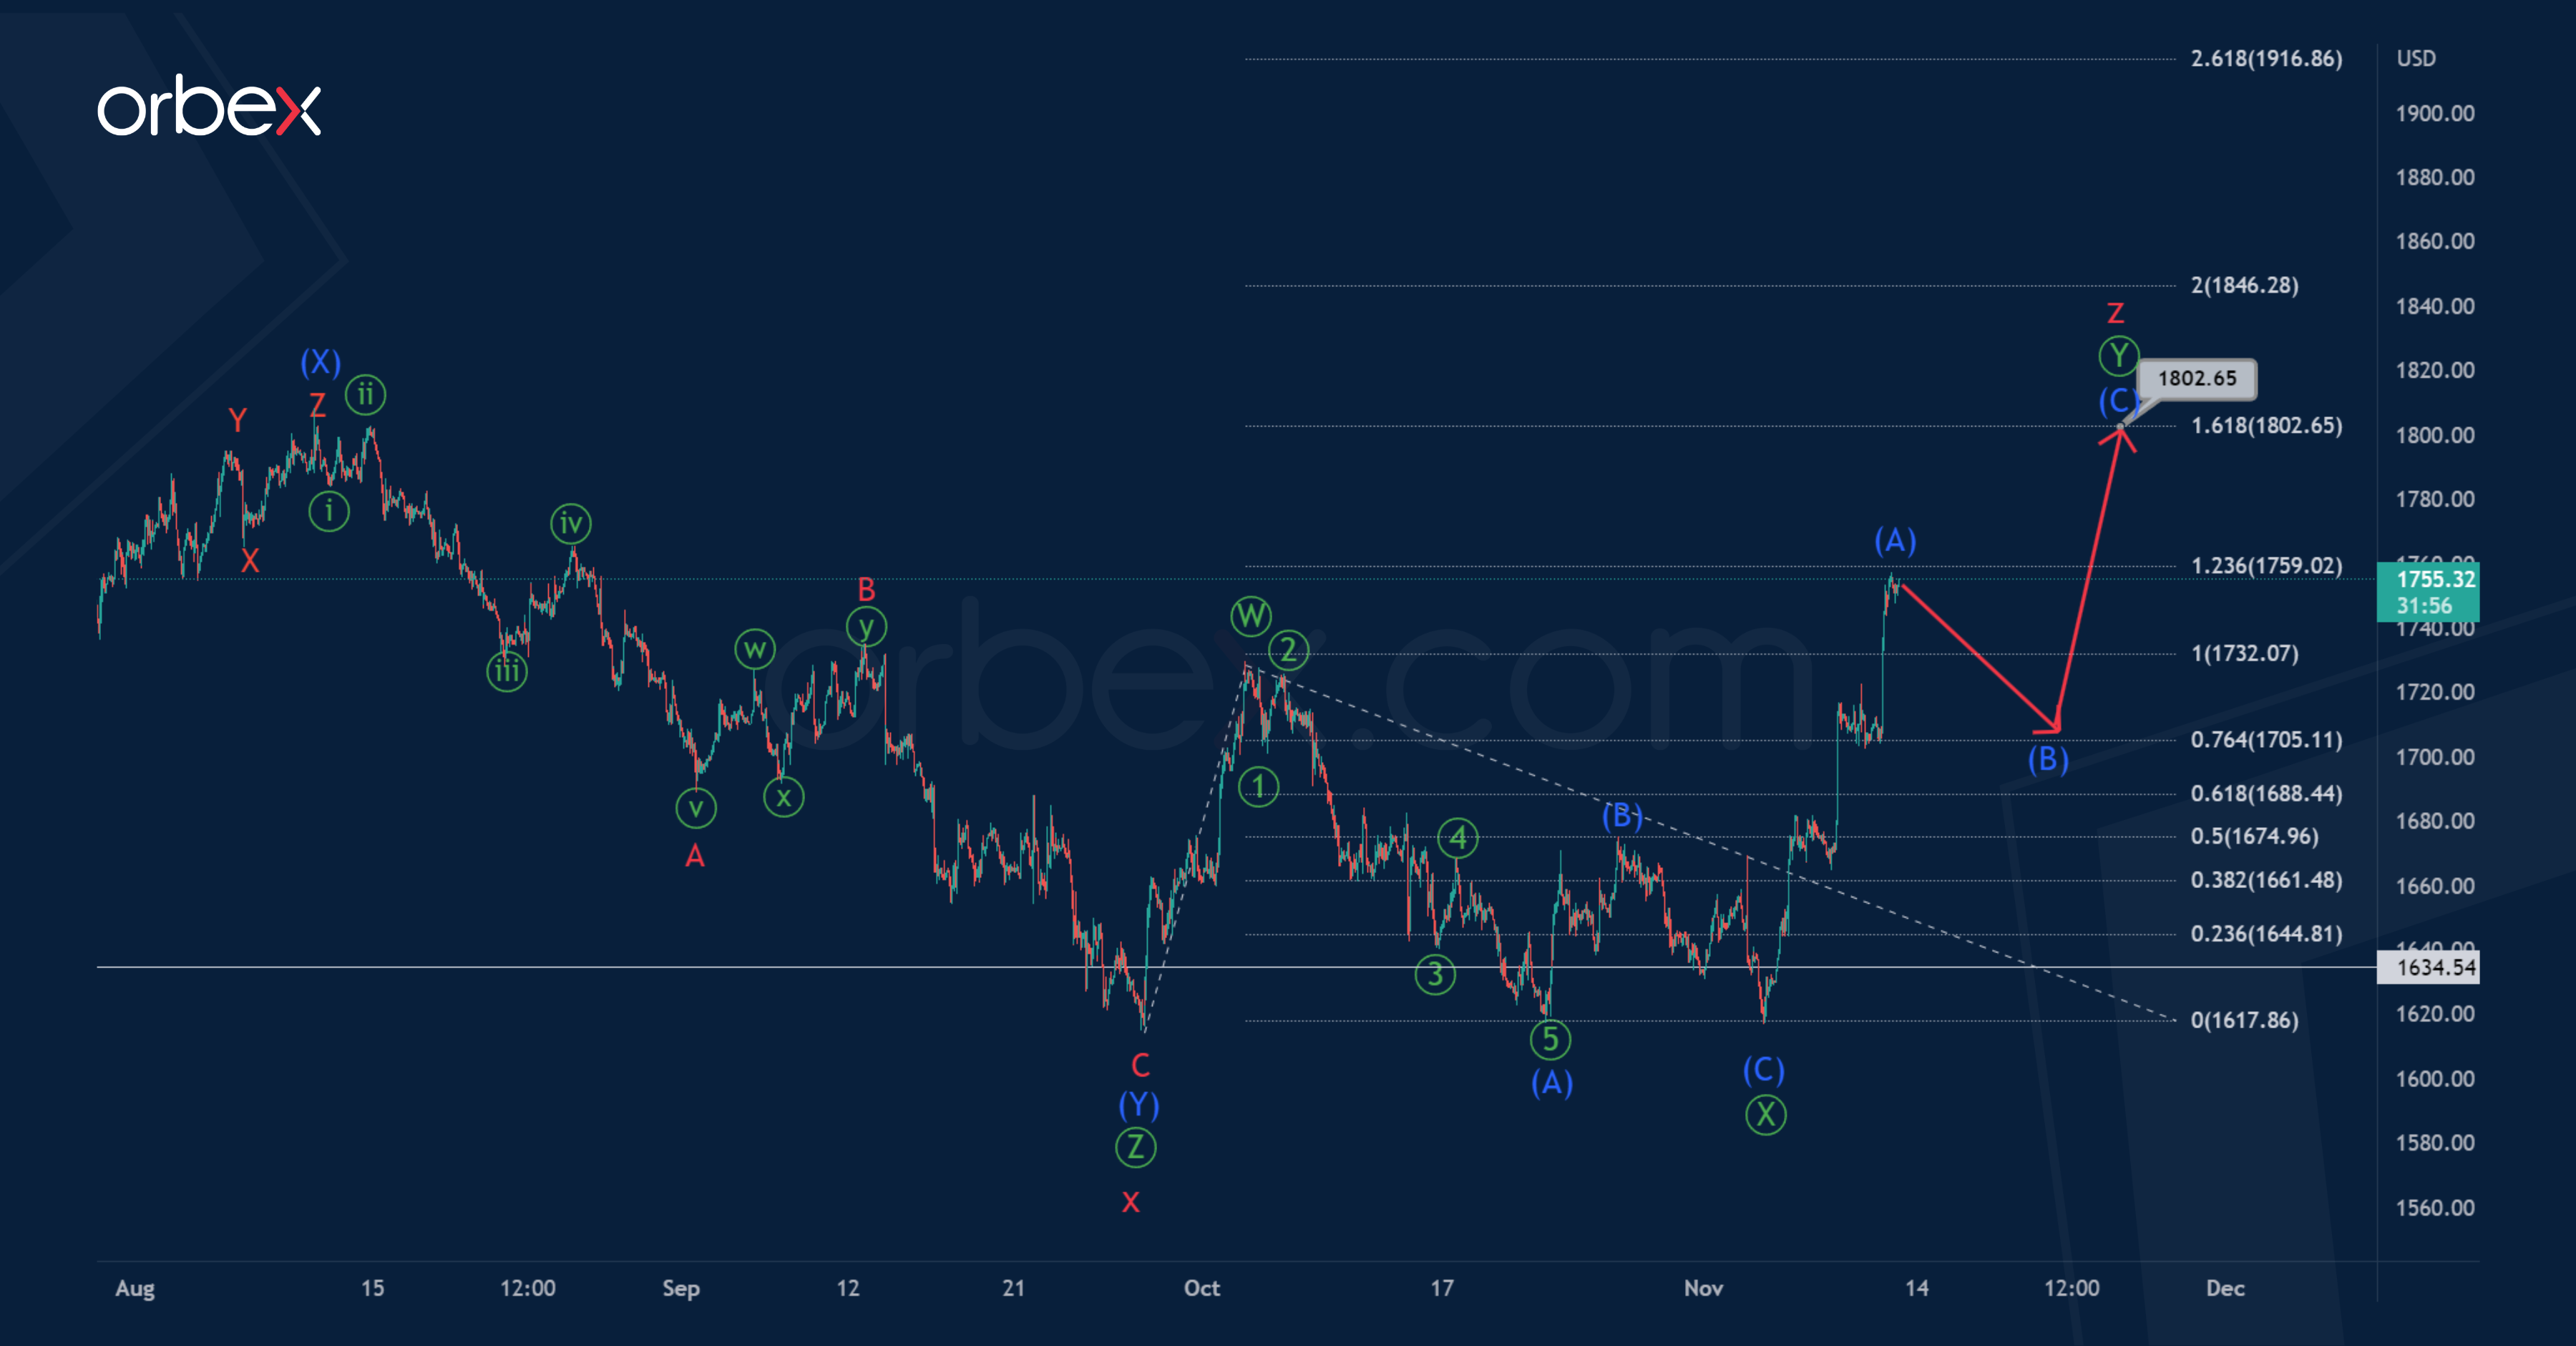
Most likely, as a few weeks ago, a large correction pattern is forming on XAUUSD, taking the form of a cycle triple zigzag.
The 1H timeframe shows the structure of the completed cycle intervening wave x, which looks like a bearish triple zigzag Ⓦ-Ⓧ-Ⓨ-Ⓧ-Ⓩ.
There is a possibility that the cycle wave z takes the form of a primary double zigzag Ⓦ-Ⓧ-Ⓨ, and now the price is in the second actionary wave Ⓨ.
It is assumed that the primary double zigzag may end near 1802.65. At that level, wave Ⓨ will be at 161.8% of wave Ⓦ.
However, there is a possibility where the downward movement of the pair will continue in the cycle wave x. The final primary wave is under development.
Thus, a downward movement of XAUUSD is expected in the near future. The primary wave Ⓩ may take the form of an intermediate zigzag (A)-(B)-(C).
The final of the correction pattern zigzag (A)-(B)-(C) is possible near 1563.07. At that level, primary wave Ⓩ will be at 76.4% of primary wave Ⓨ.
Only after reaching the specified level, the development of the cycle wave z will begin.