Sample Category Title
Pound Traders Turn Gaze to UK Inflation Data and Budget Announcement
Despite the UK economy contracting by less than expected in Q3, investors continued to scale back their BoE rate-hike bets. However, they may have to reexamine those bets next week, as the economic agenda includes the employment report for September on Tuesday at 07:00 GMT, the inflation numbers for October on Wednesday at the same time, and the Autumn Statement on Thursday. The time has yet to be confirmed, but such announcements tend to be delivered at around 12:30 GMT.
Economy contracts by less than expected
The first estimate of the UK GDP revealed that the economy shrank by only 0.2% in Q3, which means that a contraction of more than 0.55% may be needed in the last three months of the year for the BoE’s forecasts of a 0.75% contraction during H2 2022 to materialize. Yet, investors dragged their rate-path projections lower. The probability for a 50bps hike at the December gathering remained near 80%, but the implied terminal rate was lowered to 4.47% from 4.6%.
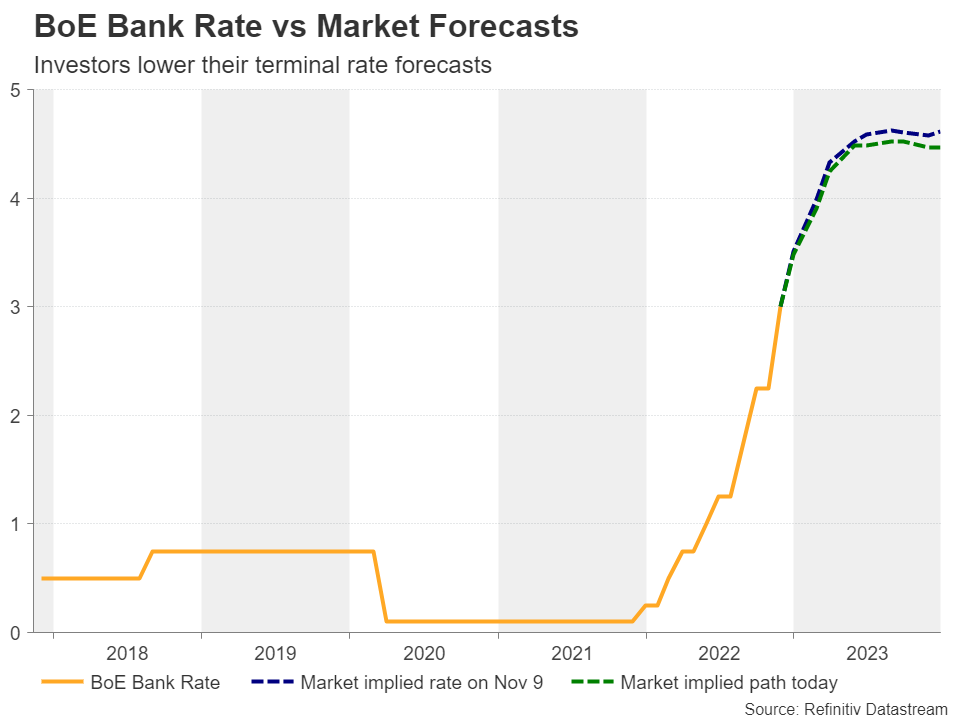
Maybe investors paid more attention to the bigger-than-expected monthly contraction for September, which may have been interpreted as setting the stage for a much worse fourth quarter. Nonetheless, that number may have been exacerbated due to the standstill in economic activity around the time of the funeral for Queen Elizabeth.
Jobs and inflation data up next
On Tuesday, the jobs report is forecast to show that the unemployment rate held steady at 3.5% in September and that average weekly earnings excluding bonuses have accelerated. Nonetheless, with an inflation rate at 10.1% during that month, real wages likely stayed well into the negative territory and disposable incomes at record lows.
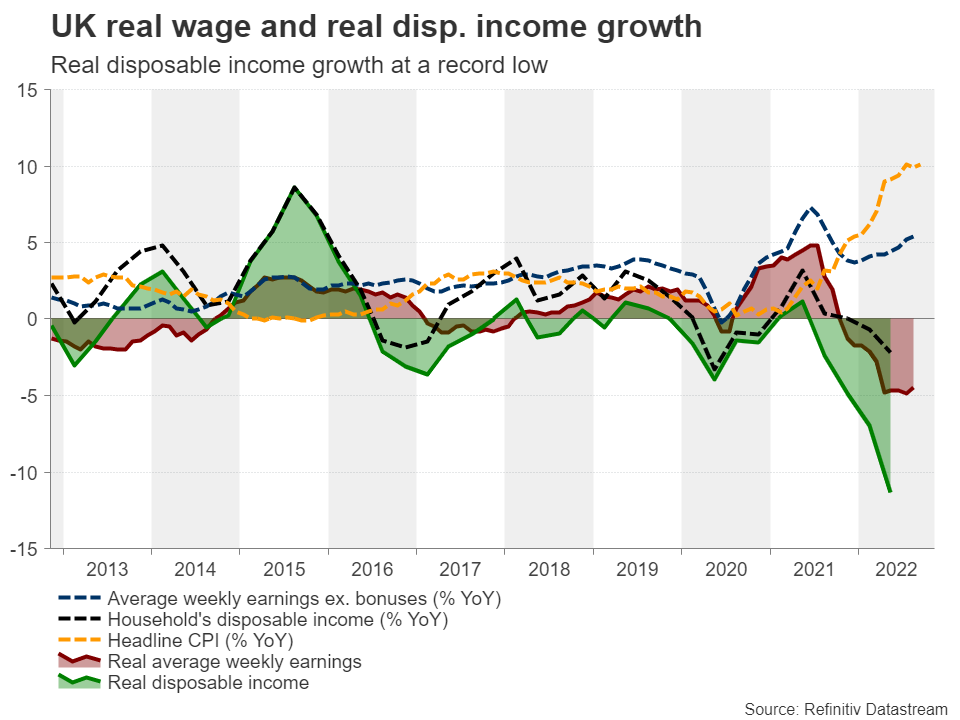
Therefore, investors’ concerns over a worst Q4 are more than reasonable, and Wednesday’s inflation data have the potential to enhance them. The headline rate is expected to have continued to rise, hitting 10.8% y/y, though the core rate is expected to have ticked down to 6.4% from 6.5%. This implies that the surge in the headline rate may be due to volatile items like food and energy, and the recovery in oil priced during October corroborates that view.
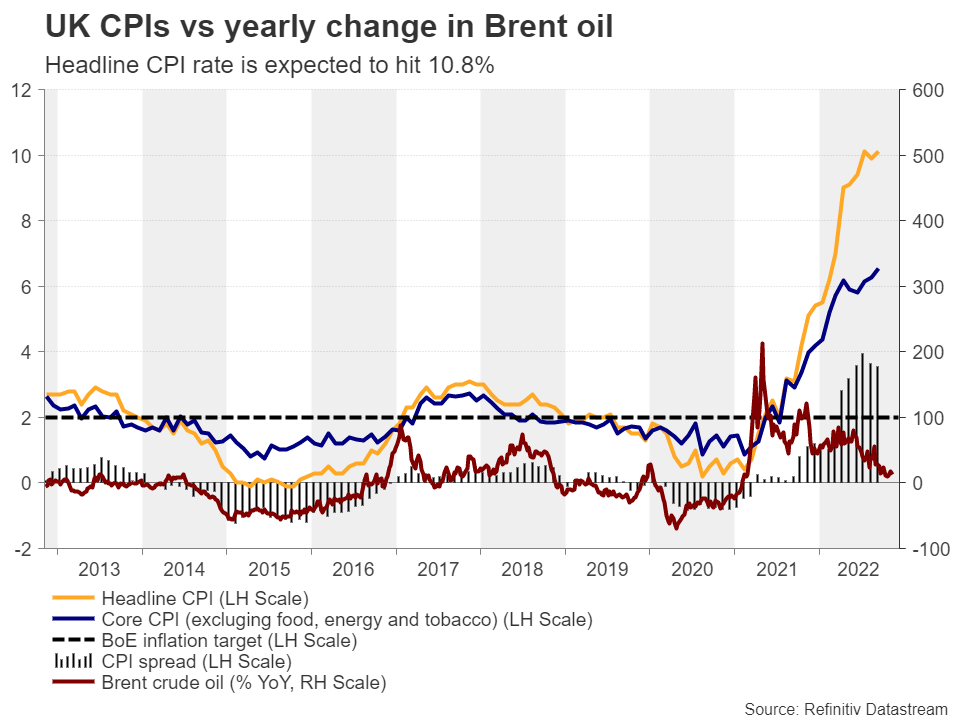
Oil prices may continue to rise in case of a harsh winter, but with the BoE appearing to have shifted its focus more on the wounded economy now rather than to inflation, accelerating consumer prices are unlikely to prompt investors to ramp up their rate-hike bets, especially just a day ahead of the budget announcement.
Autumn Statement enters the spotlight as well
On Thursday, Chancellor Jeremy Hunt will unveil the government’s plan for tackling the nation’s budget deficit, which is expected to have now widened to 50bn pounds form around 44bn at the end of June.
The new agenda will most probably contrast with the plans announced by Kwasi Kwarteng, as abolishing the deficit may require spending cuts at levels of austerity, like in 2010. It has also been reported that Hunt will announce a limit of 2% to public sector pay increases and a freeze to various tax thresholds, including income tax. Considering how high inflation is, the former will result in further declines in real wages, while the latter will drag more people into higher-rate tax brackets as their nominal salaries increase. With regards to corporate taxation, Hunt has already confirmed that the rate will rise to 25% in April next year. This implies downside risks to the BoE’s already lackluster projections, as officials were not able to include the potential impact of the fiscal agenda in their November calculations.
What does all this mean for the pound?
As for the pound, expectations of next week’s events keep the risk of another round of selling in the foreseeable future firmly on the table, despite pound/dollar rising above a medium-term downtrend line yesterday. That was more due to the dollar weakening on the US inflation data rather than the pound strengthening. Yes, the pound’s link to the broader market sentiment has strengthened this year due to the UK’s twin deficit, but its correlation with the S&P 500 remains weaker than other traditional risk-linked currencies, like the aussie the kiwi and the loonie.
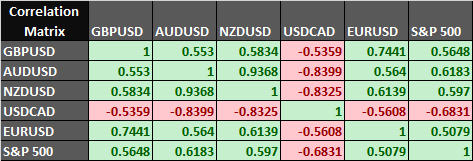
So, with the Fed still being considered a more hawkish central bank than the BoE, and the risk of a new flare up in global growth concerns anything but vanished, any further advances in the pair may stay limited.
For now, a combination of more weakness in the dollar due to increasing hopes of a less aggressive Fed, and further improvement in the broader market sentiment could help pound/dollar appreciate for a while longer. The break above the downtrend line drawn from the high of February 23 may allow advances towards the psychological round number of 1.2000 and if the bulls are not willing to stop there, then the rally may continue towards the 1.2295 area.
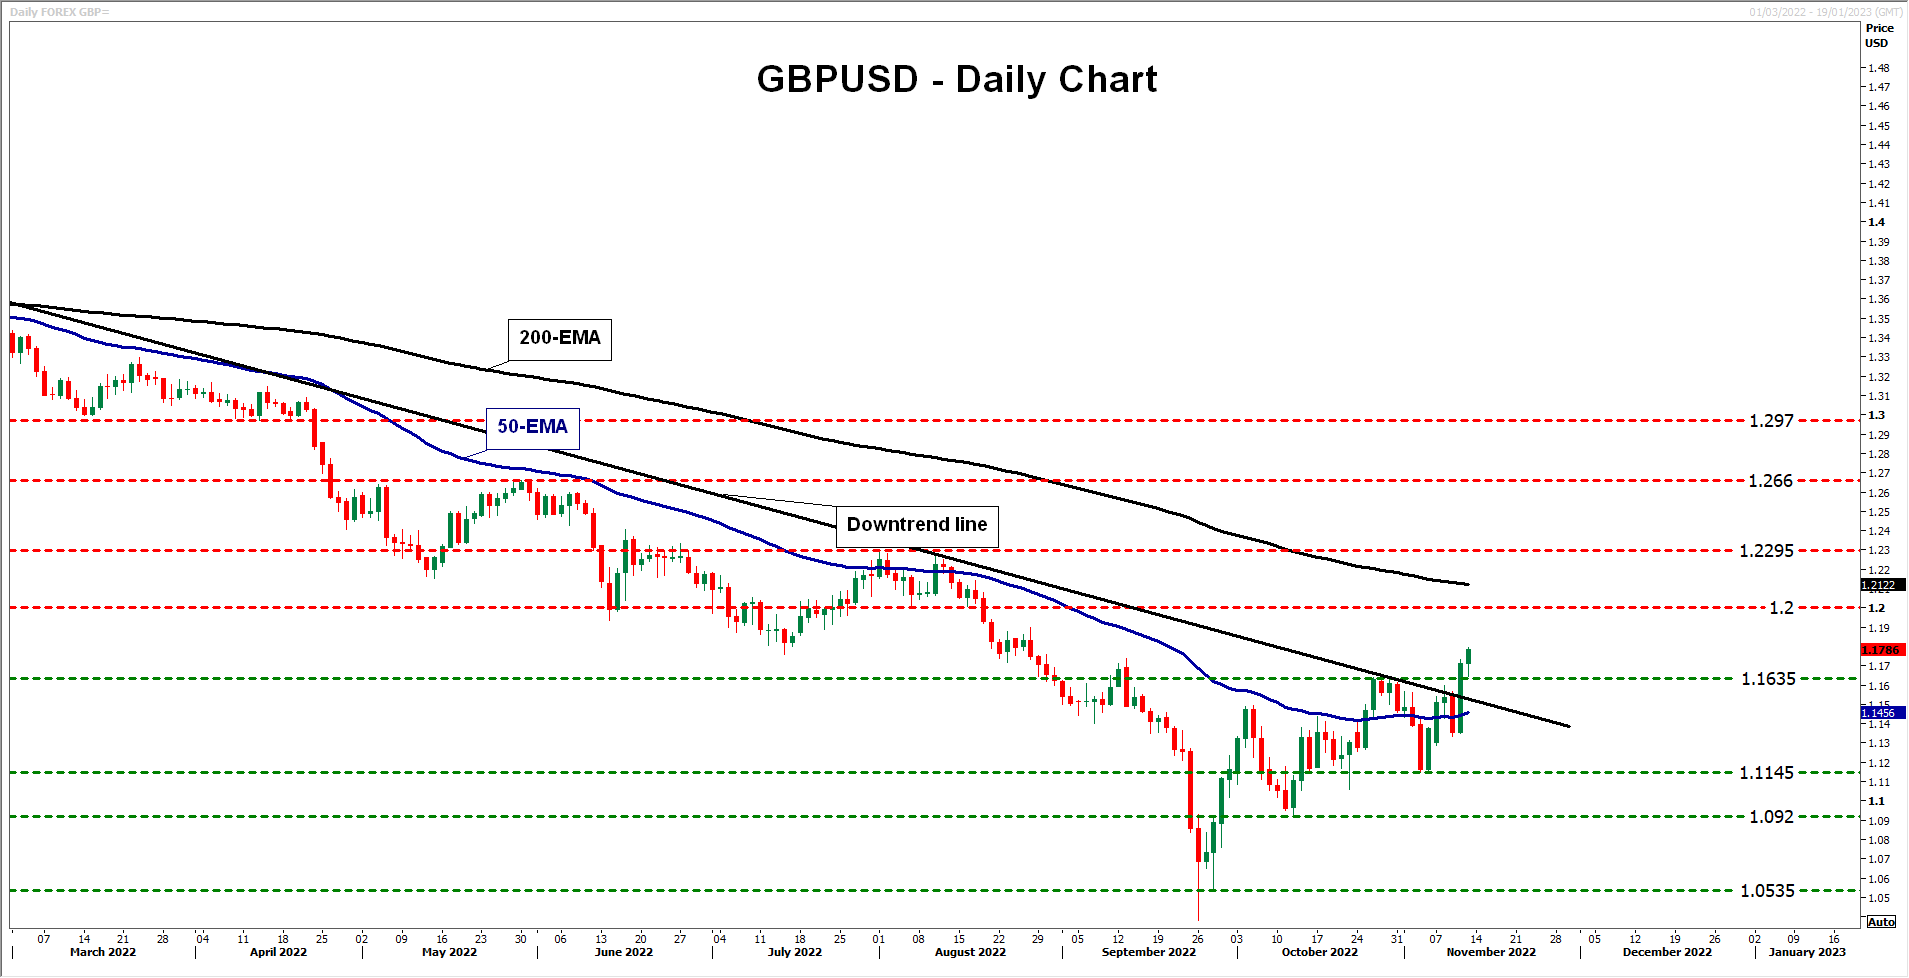
On the downside, a break below the 1.1145 barrier may be needed to signal that the prior downtrend is back in force. That move would confirm the pair’s return below the downtrend line and may initially target the low of October 12 at 1.0920. Should that zone get breached as well, the bears may set the stage for extensions towards the 1.0535 territory.
EUR/USD Started Strong Recovery, Dollar Takes Hit
Key Highlights
- EUR/USD started a steady increase above the 1.0200 resistance.
- It broke many hurdles near 1.0100 and 1.0200 on the 4-hours chart.
- USD/JPY declined heavily below the 142.50 support zone.
- Gold price rallied above the $1,750 resistance zone.
EUR/USD Technical Analysis
The Euro formed a base above the 0.9740 level against the US Dollar. EUR/USD remained well bid and started a strong increase above the 0.9920 resistance.
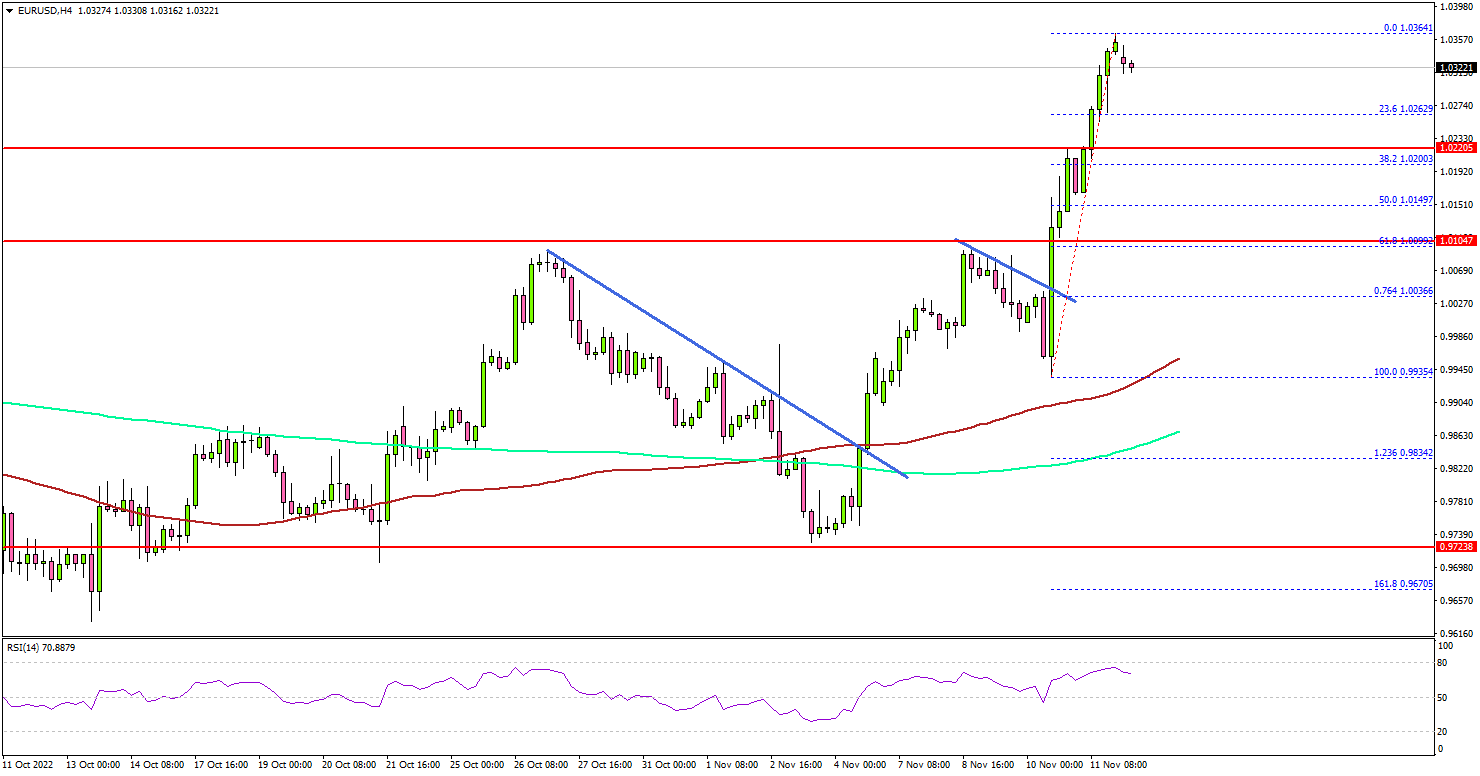
Looking at the 4-hours chart, the pair gained bullish momentum after the US CPI release. There was a strong upward move above the 1.0000 and 1.0080 levels. The pair even settled above the 1.0150 resistance level, the 100 simple moving average (red, 4-hours) plus the 200 simple moving average (green, 4-hours).
The US Dollar saw a strong bearish wave, resulting in a drop in USD/JPY and rise in GBP/USD and gold. EUR/USD was finally able to clear the 1.0250 barrier.
It is now consolidating gains, with an immediate resistance near 1.0380 level. The next major resistance may perhaps be near 1.0420. Any more gains could set the pace for a move towards the 1.0500 level, above which it could even test 1.0650.
An initial support is near the 1.0265 level. The next major support is near the 1.0220 zone. The main support sits at 1.0120. A close below the 1.0120 level might start another strong decline. In the stated case, EUR/USD could decline towards the 1.0000 support.
Looking at gold price, there was a strong upward move above the $1,750 level and it seems like the price might even climb above the $1,770 level.
Economic Releases
- Euro Zone Industrial Production for Sep 2022 (MoM) - Forecast +0.3%, versus +1.5% previous.
USDCAD Perfect Reaction from Blue Box Area
Good day Traders and Investors. In today’s article, we will look at the past performance of 4 Hour Elliottwave chart of the Canadian Dollar ($USDCAD). The rally from 08.11.2021 low has unfolded as 5 swings and reacted lower but the rally from 01.06.2021 low is showing 3 swings so still missing one more leg higher. Therefore, we knew that the structure in $USDCAD is incomplete to the upside & should see more strength in 3 or 7 swings against 01.06.2021 low. So, we advised members to buy the bounces in 3, 7, or 11 swings at the blue box area. We will explain the structure & forecast below:
USDCAD 4H Elliottwave Chart 10.24.2022:
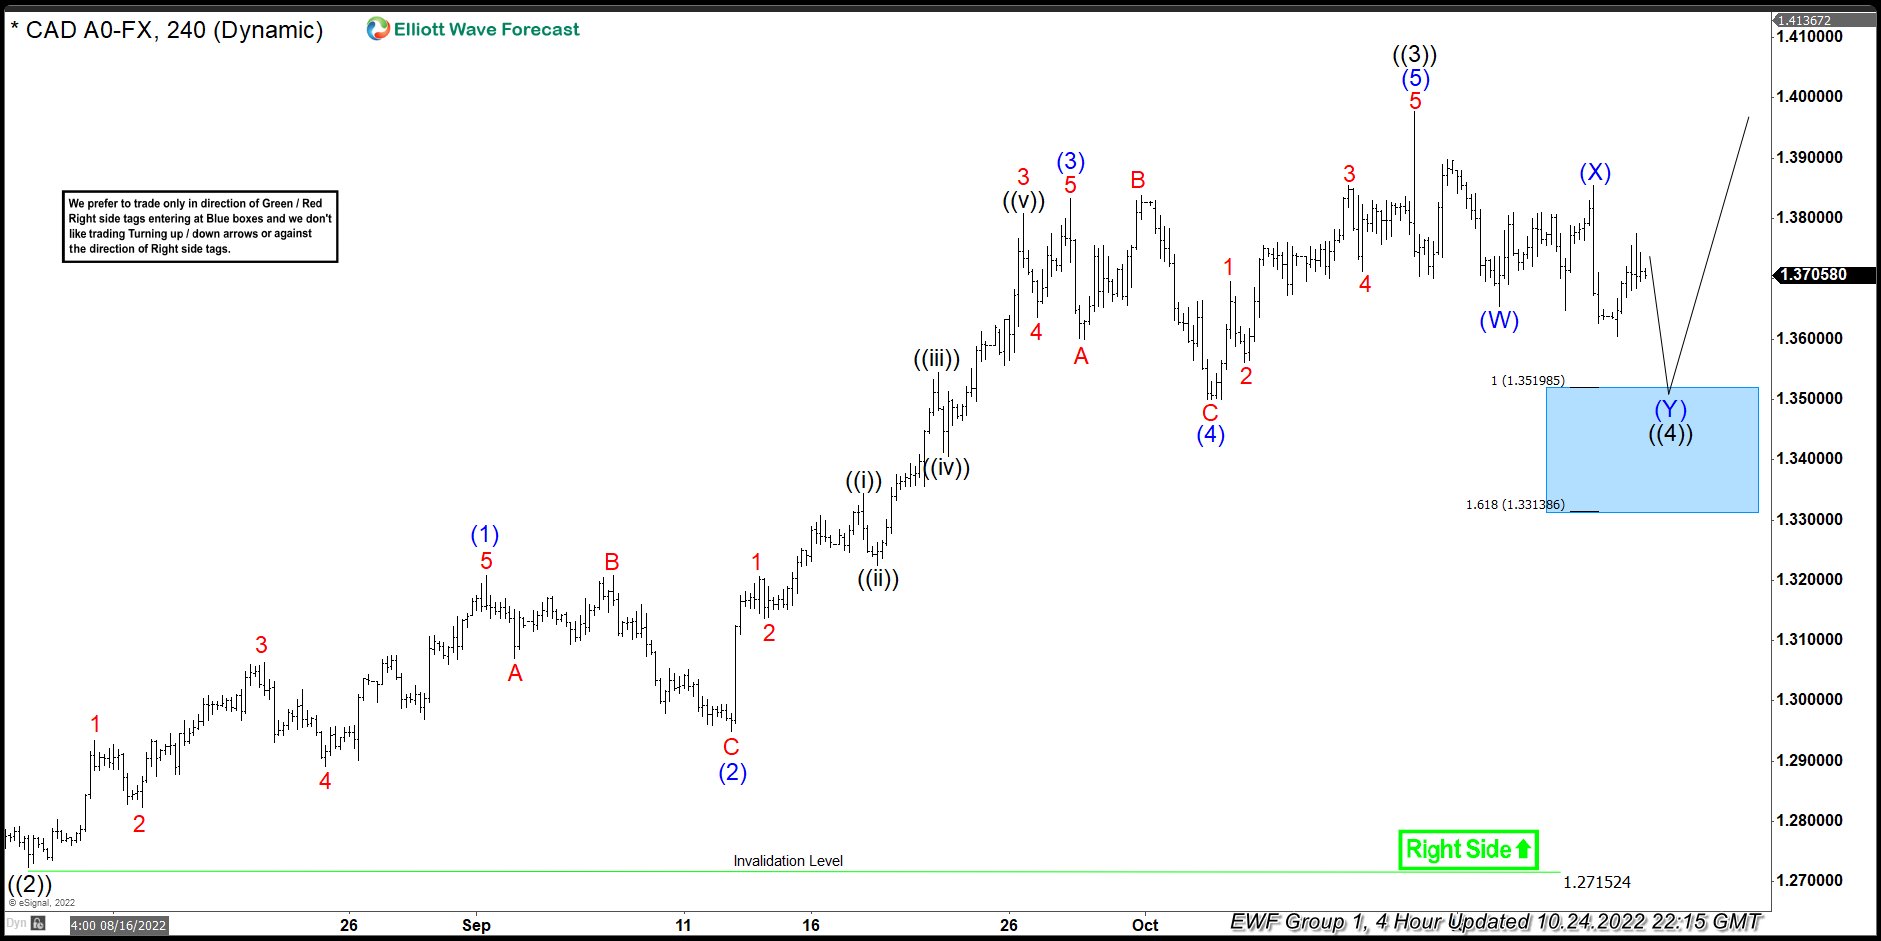
Here is the 4H Elliottwave count from 10.24.2022. The rally from 08.11.2021 low has unfolded as 5 swings and reacted lower but the rally from 01.06.2021 low is showing 3 swings which created a bullish sequence. We were calling for the pullback to find buyers in 7 swings at blue (Y) of ((4)) where we like to buy it at the equal legs at $1.352 with a stop at $1.332.
USDCAD 4H Elliottwave Chart 11.03.2022:
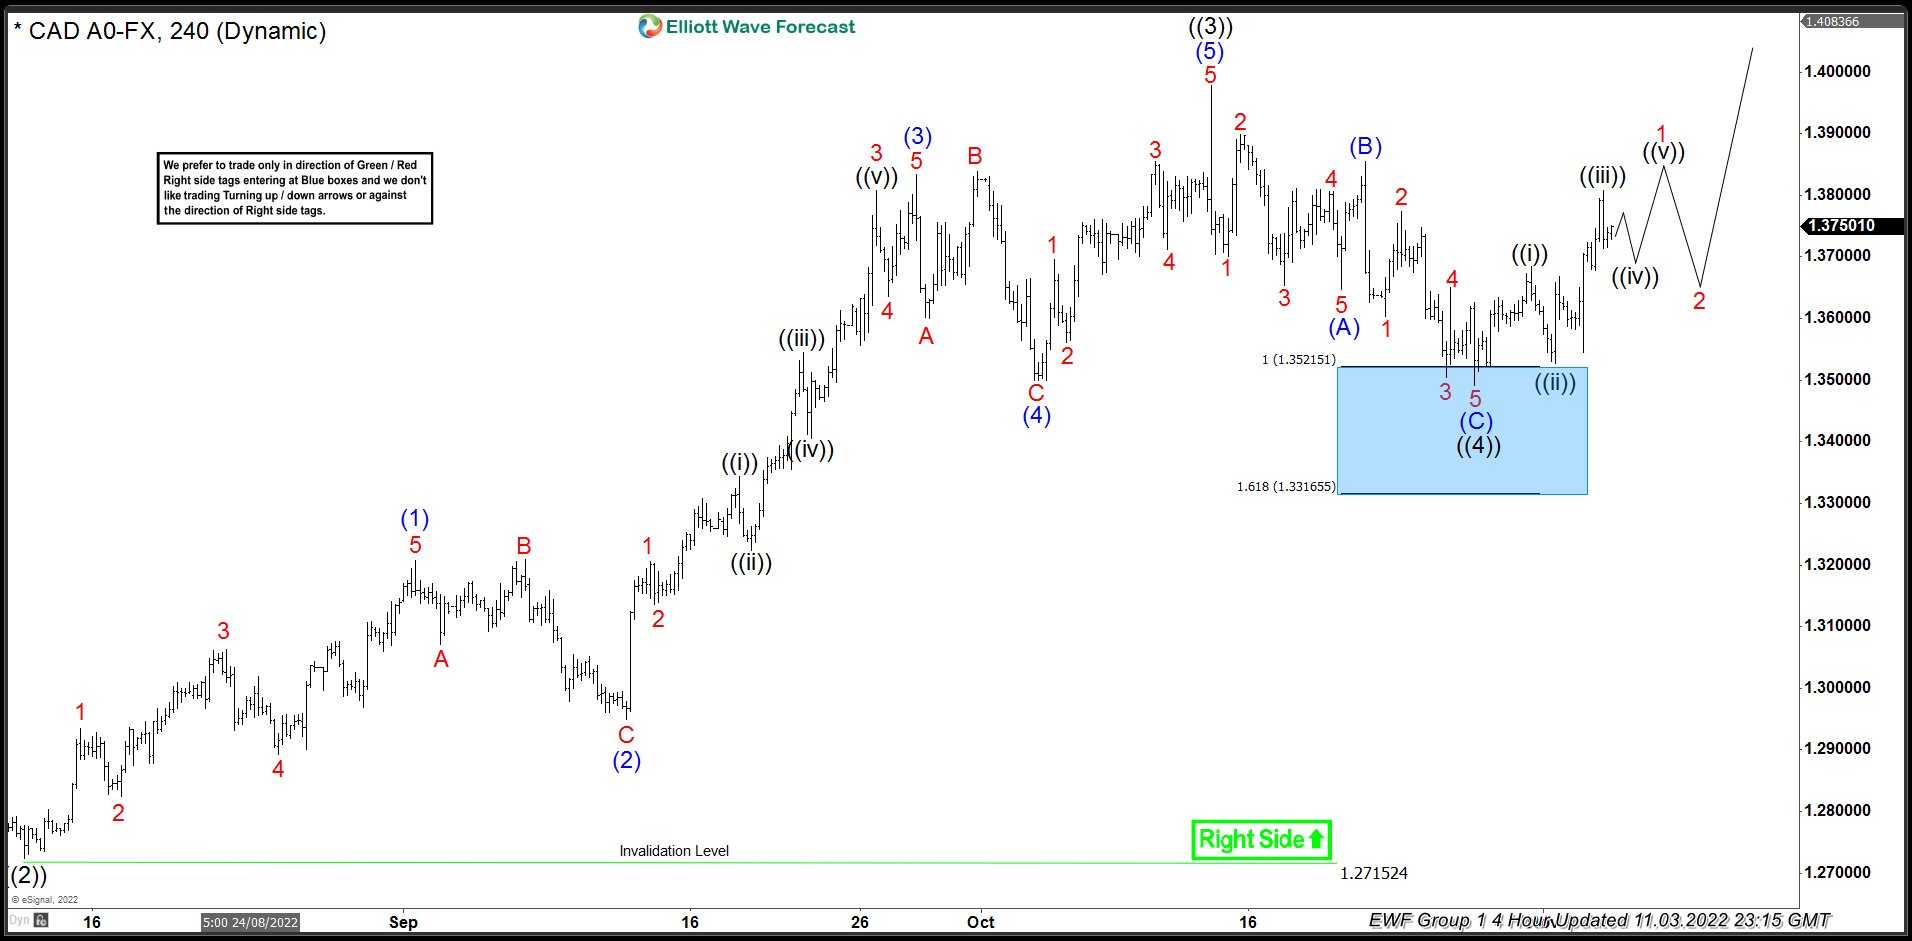
Here is the 11.03.2022 4H update showing the move taking place as expected. The currency has reacted higher from the blue box to reach the 50% back from black ((3)) allowing any longs to get risk free shortly after taking the position.
Dollar Started Medium Term Correction, But Selling Might Start to Slow Soon
The set of lower than expected consumer inflation data from the US was music of joy for investors. Stocks surged while treasury yield tumbled, on expectation that Fed is ready to start slowing down tightening pace in December. Risk-on sentiment was broad-based with NASDAQ starting to realign with DOW, despite crypto rout.
Dollar suffered steep, broad-based selloff as medium term correction is confirmed. While deeper decline is expected, it's too early to call for reversal. Selling could start to slow in the coming weeks. Yen surged most against others, with help from falling yields and lesser divergence between BoJ and Fed.
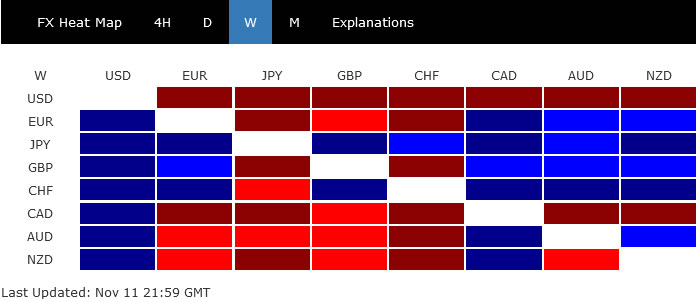
Meanwhile, European majors are the next winners, with Swiss Franc outperforming Euro and Sterling. Surprisingly, commodity currencies were just mixed, considering the strong rise in China and Hong Kong markets too. Still, Australian Dollar appeared to be the stronger one, comparing to Kiwi and Loonie.
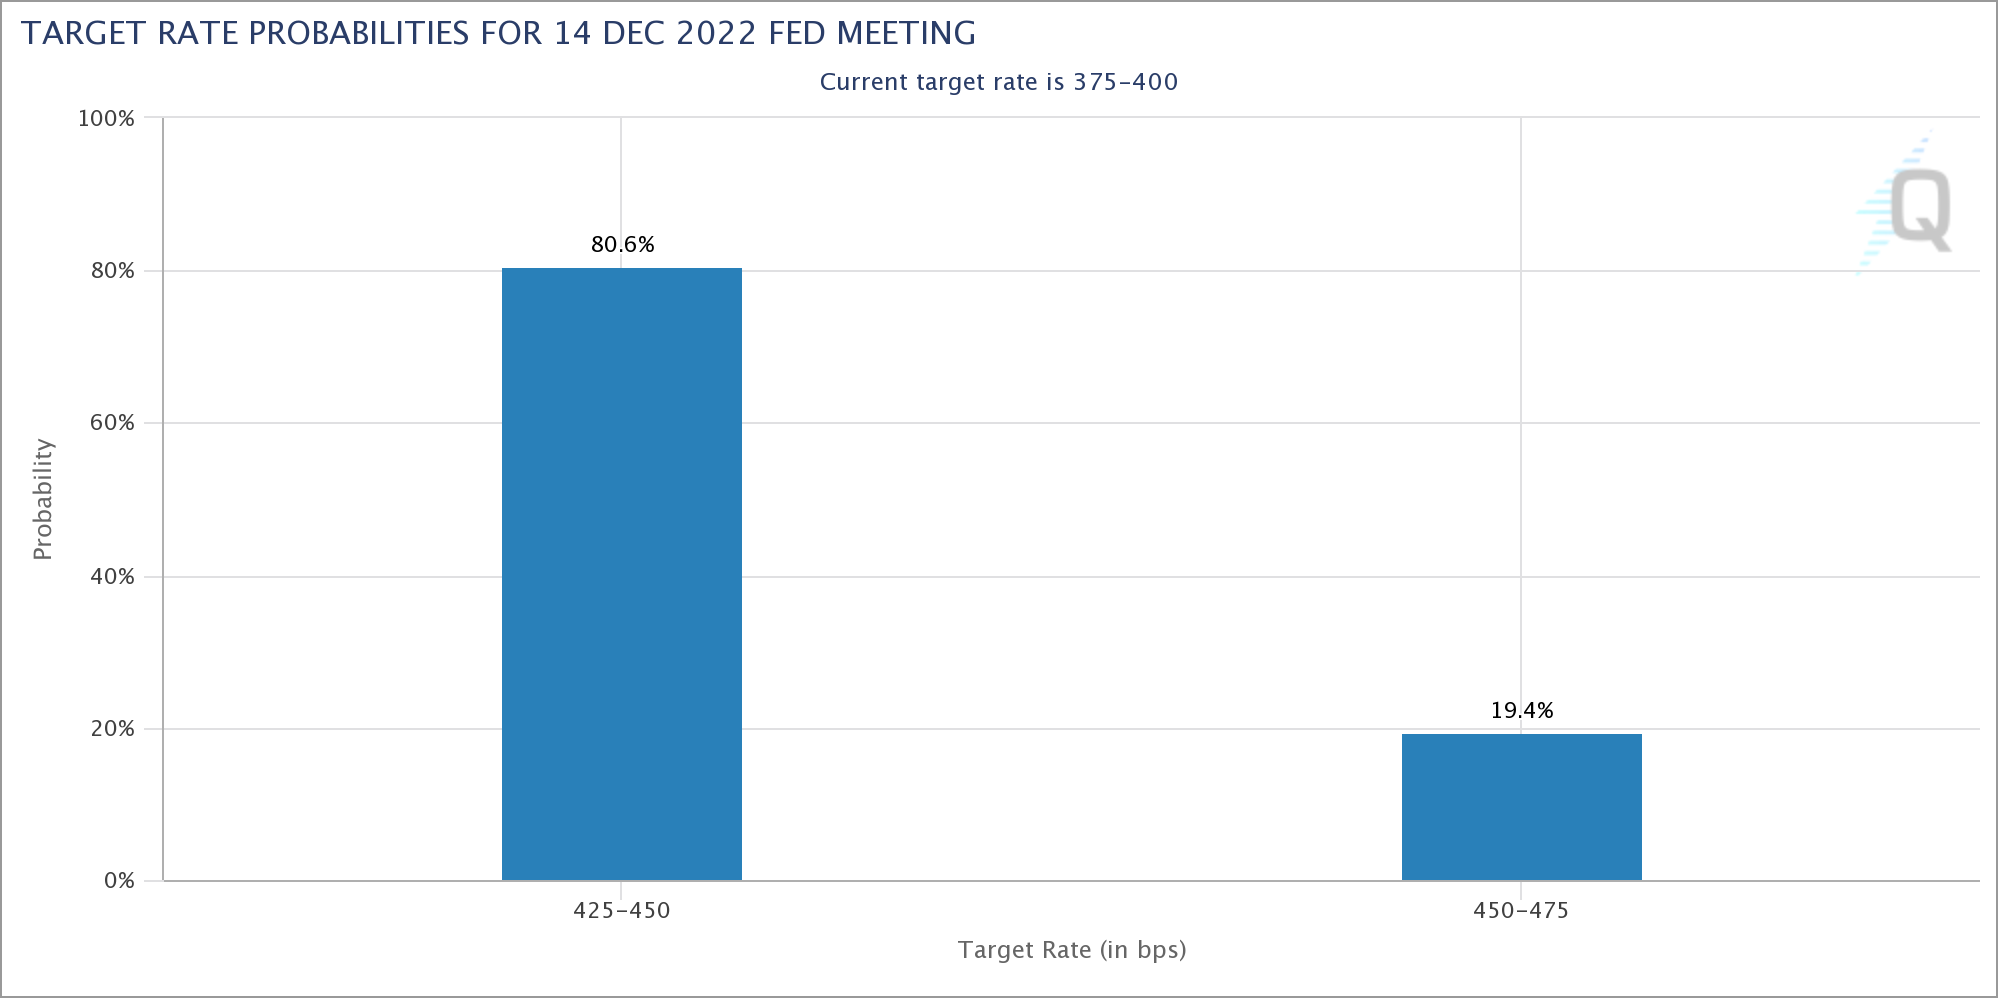
Markets see 80% chance of 50bps Fed hike in Dec
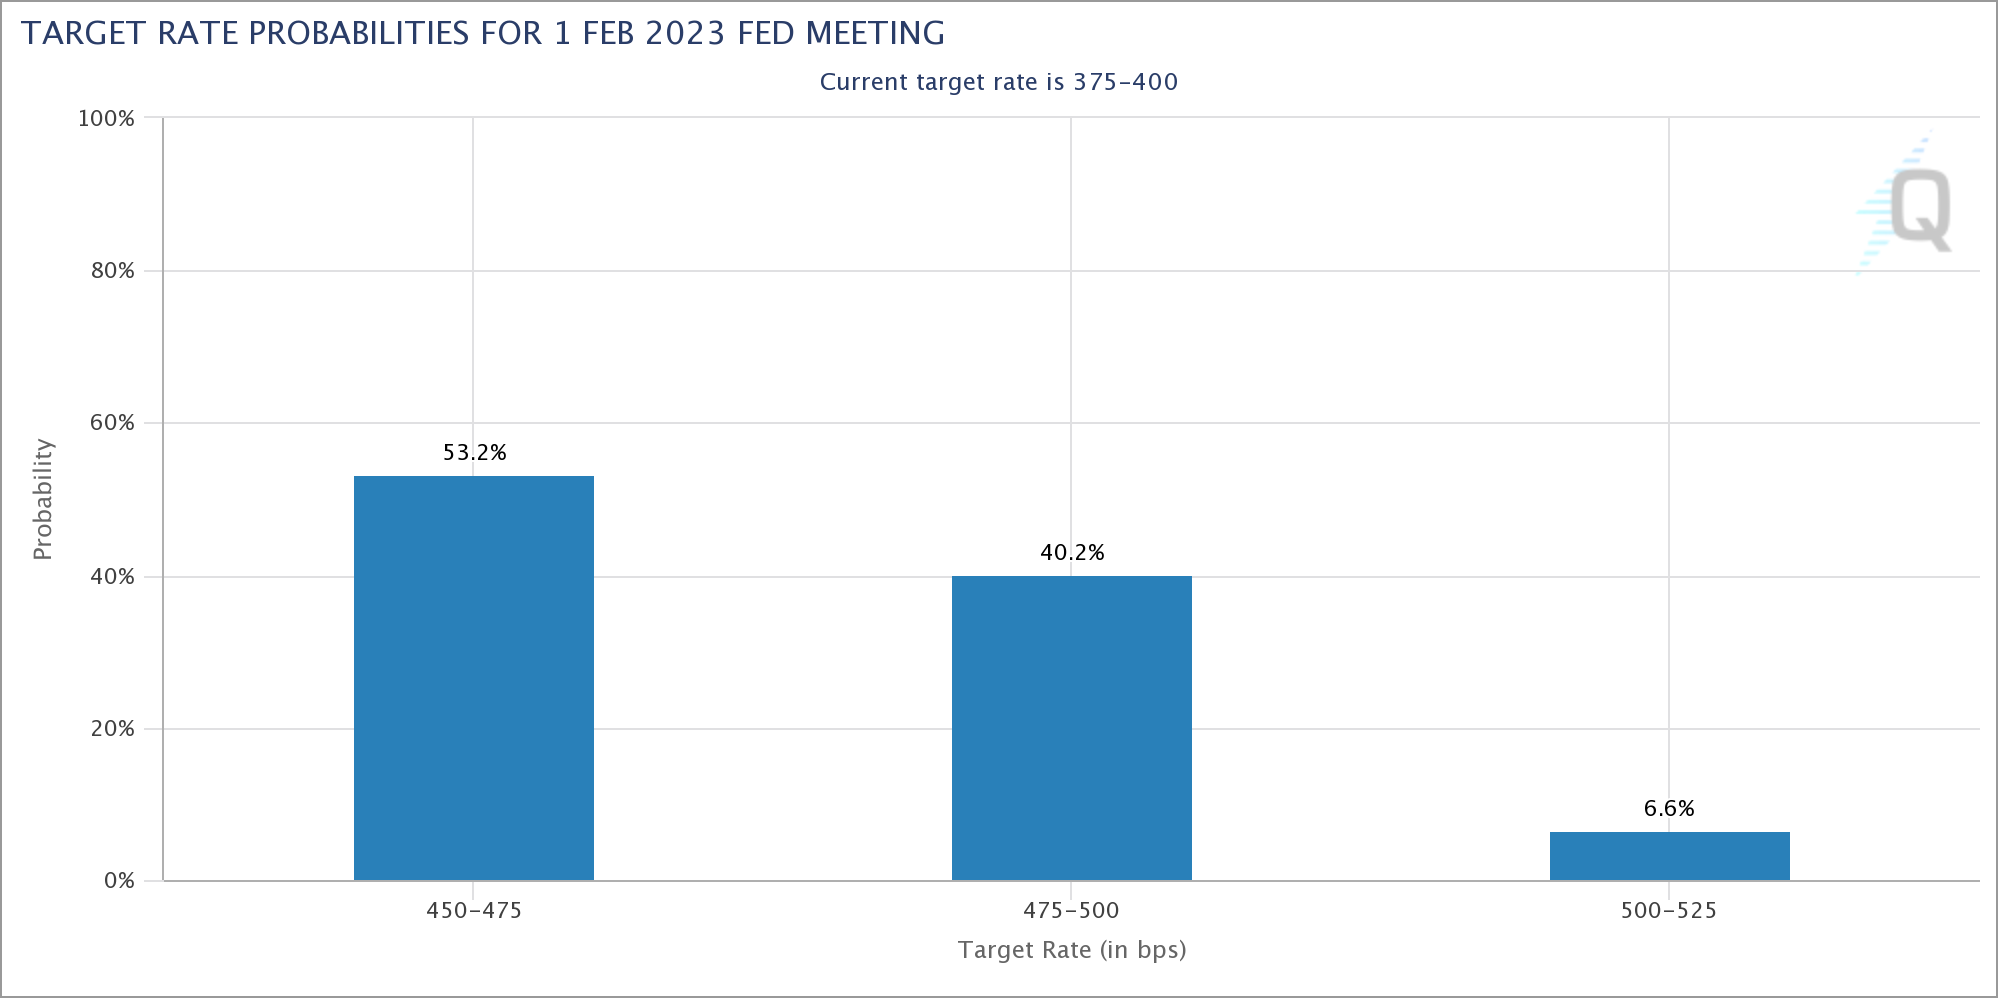
Weaker than expected CPI data from the US gave risk sentiment a strong boost. Traders were also quick to reprice Fed's policy path. Now, there is more than 80% chance of a 50bps hike at December 14 meeting to 4.25-4.50%.
Regarding February meeting, markets are pricing in over 53% chance of a 25bps hike to 4.50-4.75%.
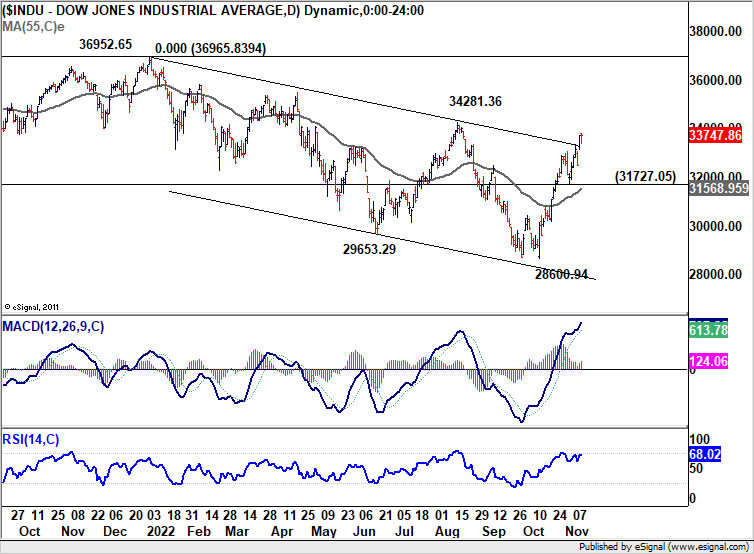
DOW surged, NASDAQ finally re-aligning
DOW had another strong rally last week and the break of the trend line resistance affirms the case that whole corrective fall from 36952.65 has completed with three waves down to 28600.94. It's still early to determine if rise from 28600.94 is the second leg of a long term consolidation pattern, or the start of an up trend. But in either case, further rally is expected as long as 31727.05 support holds. Break of 34281.36 resistance will pave the way to retest 36952.56 high.
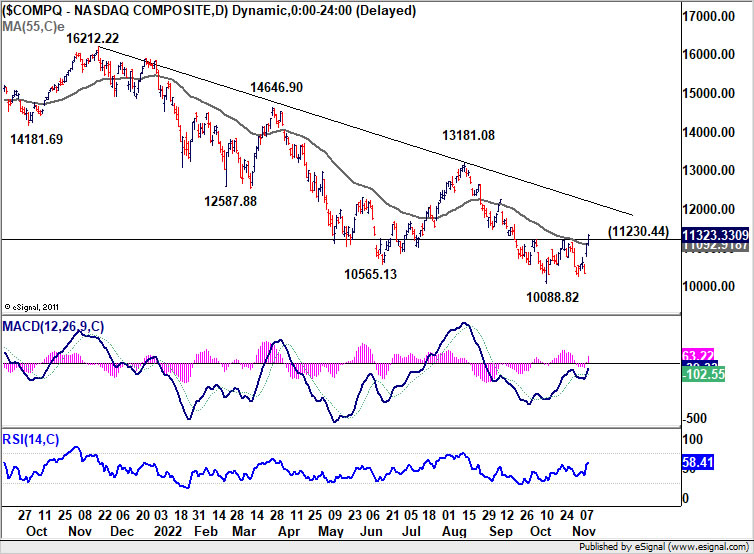
A more important development was, perhaps, that NADAQ also broke through 11230.44 resistance to resume the rebound from 10088.82. The break above 55 day EMA also affirms near term bullishness, at least. Further rise is now in favor to trend line resistance at 12220. Firm break there will re-align the outlook with DOW. That is, whole correction from 16212.22 has completed and further rise would be seen to 13181.08 resistance next.
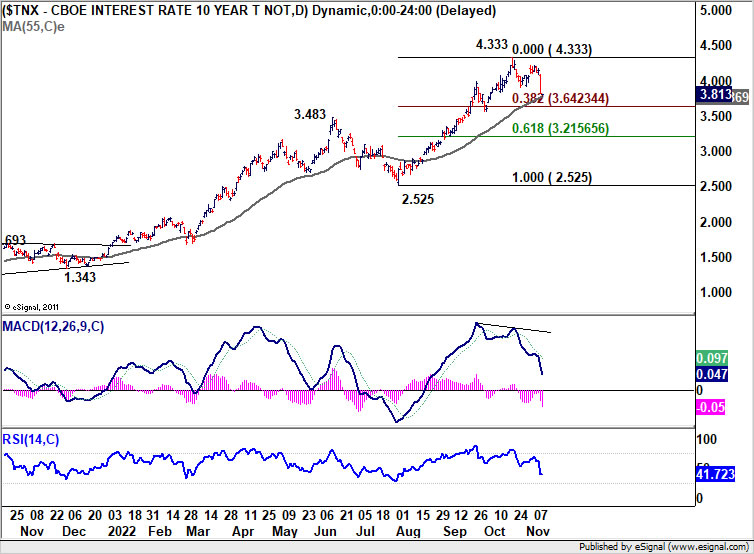
10-yield yield dived but 3.64 should be the floor
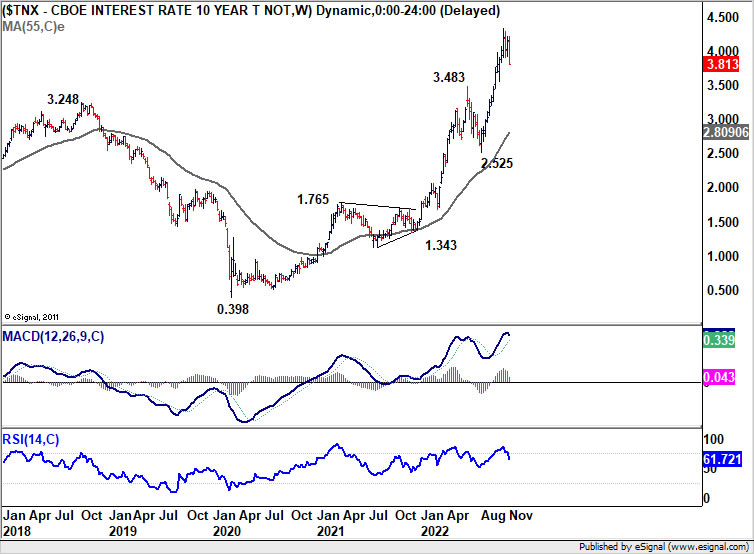
10-year yield dropped sharply to close at 3.813, as correction from 4.333 extended with a third leg. For now, TNX is seen as in correction to the rise from 2.525 only. Strong support is expected around 38.2% retracement of 2.525 to 4.333 at 3.642 to bring rebound, to extend the corrective pattern. Such development will keep the downside in USD/JPY, and other Yen crosses somewhat floored, to keep then in consolidations.
However, in the unlikely case that TNX breaks through 3.483 resistance turned support decisively, that could be a signal that it's in correction to a larger up trend. That could be accompanied by steep medium term decline in Yen pairs in general.
Dollar in medium term correction, but 103/105 should contain downside
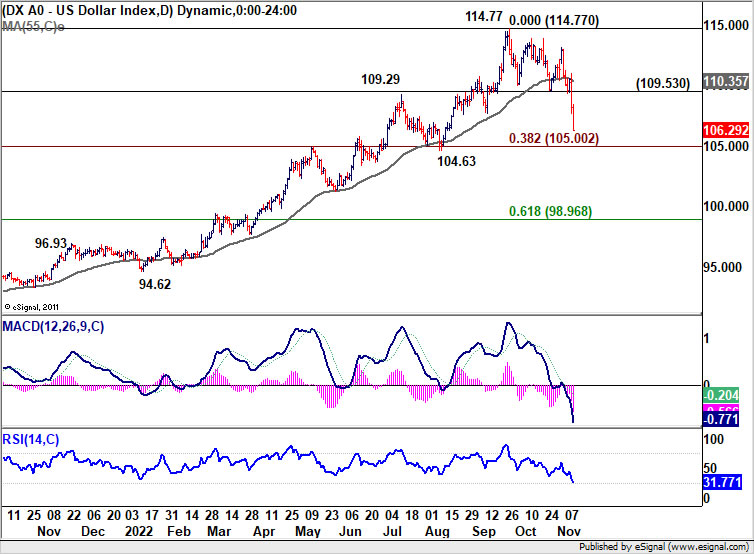
Dollar index dived last week on the back on Fed expectations, falling yields, and rising stocks. The development indicates that it's already in correction to whole up trend from 89.20. Deeper decline is expected as long as 109.53 support turned resistance holds. Next target is cluster support zone at 104.63/105.00 (38.2% retracement of 89.20 to 114.77 at 105.00).
Such cluster support at 104.63/105.00 could be breached. But DXY will then face another zone between 102.99, 103.82, as well as 55 week EMA (now at 103.80). Hence, downside potential below 104.63 should be very limited, and a bottom should be formed anywhere between 103/105 to bring rebound.
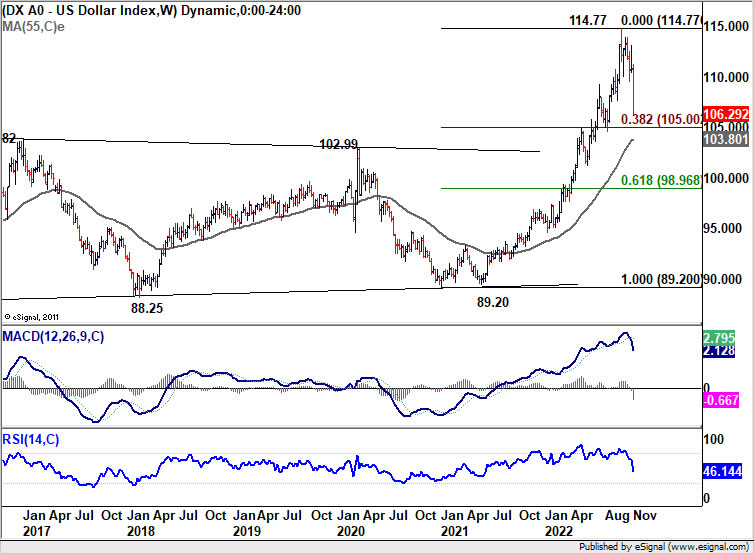
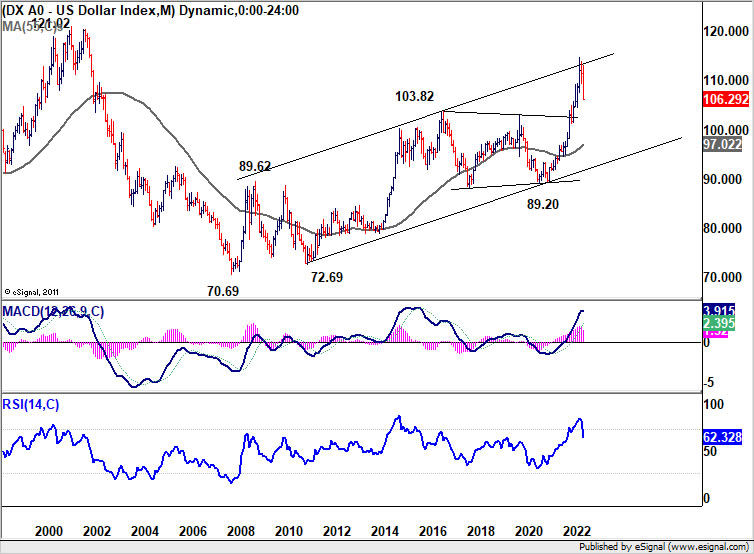
But of course, sustained break of 102.99 will argue that something more substantial is happening and would open up deeper fall back to 55 month EMA at 97.02, which is rather unlikely from current perspective.
Swiss Franc and Aussie have the potential to outperform
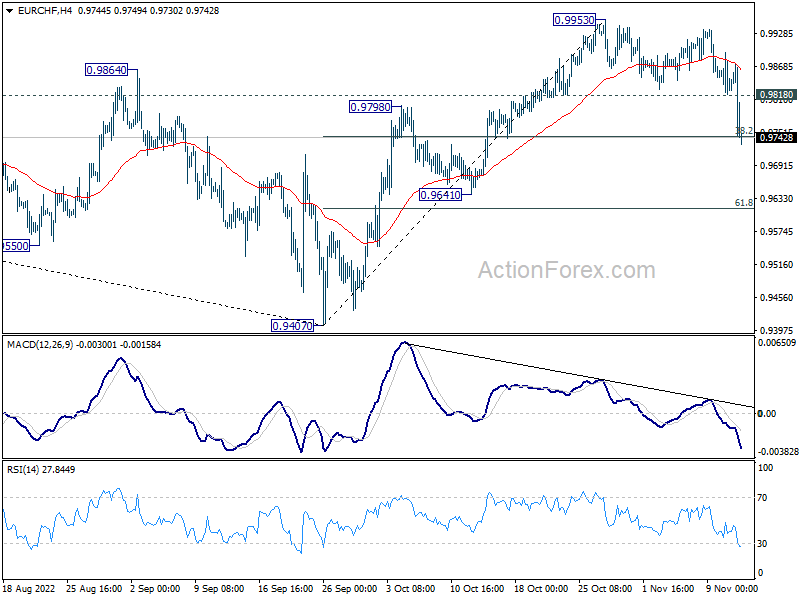
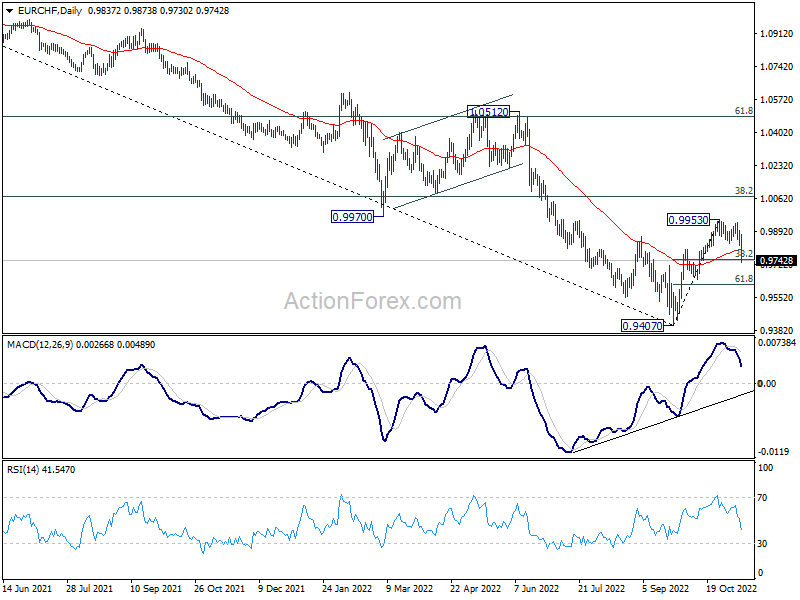
Among European majors, Swiss Franc has the potential to continue to outperform in the near term. GBP/CHF has already completed a head and should top pattern. Meanwhile EUR/CHF has also broken 0.9798 resistance turned support. The development in EUR/CHF indicate that rise from 0.9407 has completed at 0.9953, ahead of 0.9970 support turned resistance. It's now at least in correction to rise from 0.9407.
Further decline is expected now as long as 0.9818 support turned resistance holds. Sustained trading below 38.2% retracement of 0.8407 to 0.9953 will pave the way to 61.8% retracement a 0.9616, and possibly below.
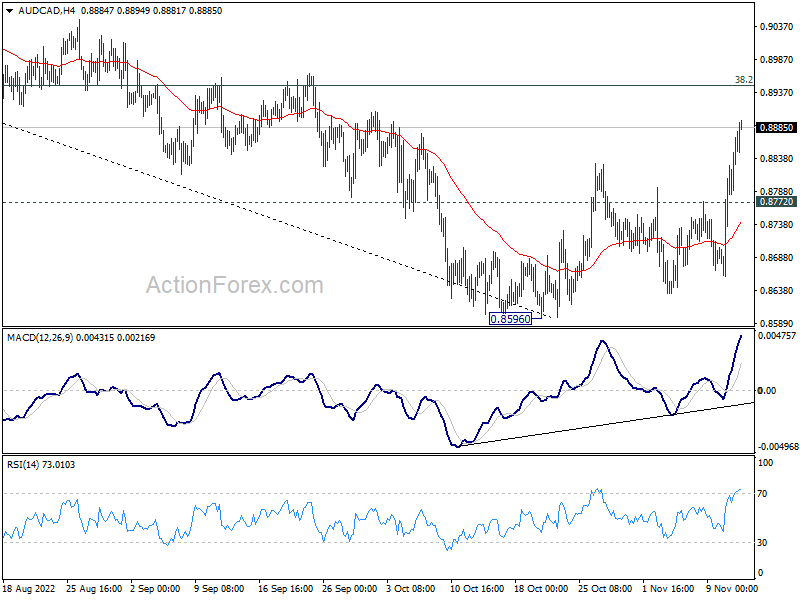
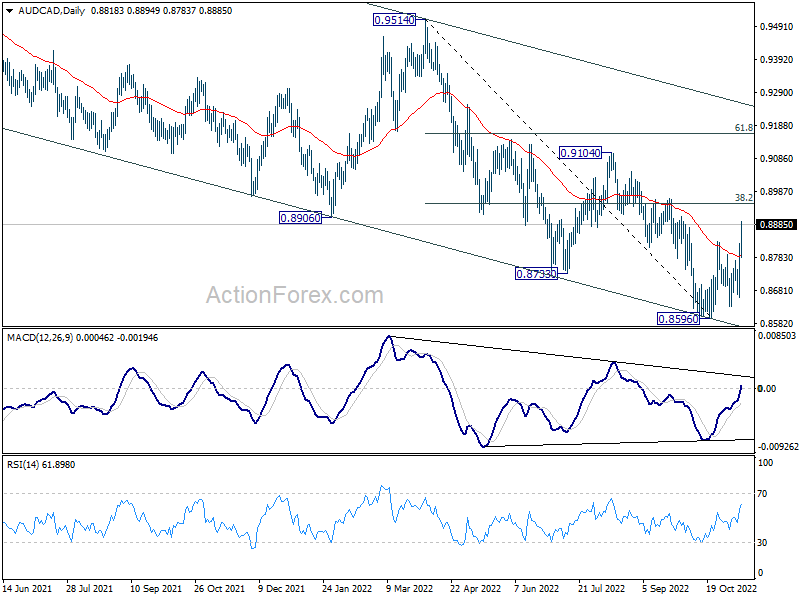
At the same time, AUD/CAD's strong rally suggests that Aussie has the potential to outperform. 0.8596 is at least a short term bottoming, as supported by medium term channel. Further rally is expected as long as 0.8772 minor support holds, to 38.2% retracement of 0.9514 to 0.8596 at 0.8947. Decisive break there will raise the chance of larger reversal, and target 61.8% retracement at 0.9163, and possibly further to channel resistance at around 0.9260.
USD/JPY Weekly Outlook
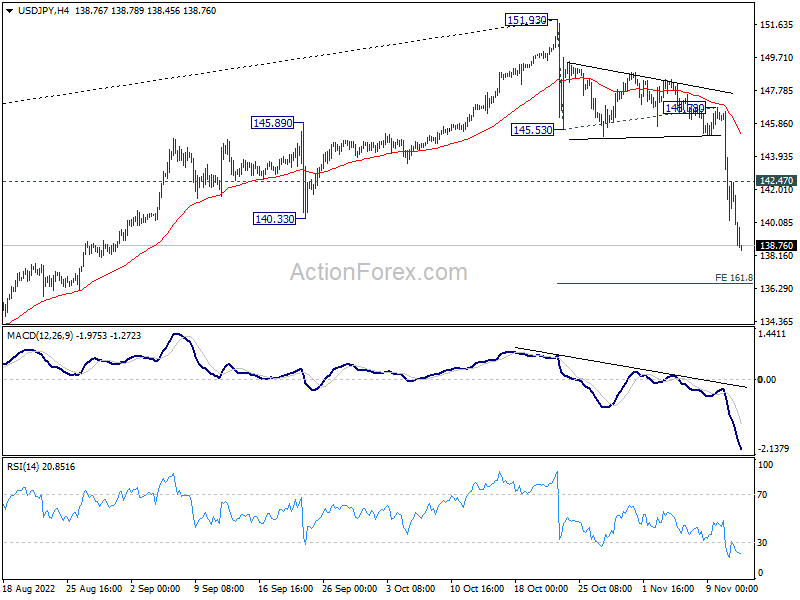
USD/JPY's decline accelerated to as low as 138.76 last week. The development suggests that it's already in correction to whole up trend from 102.58. Initial bias stays on the downside this week for 161.8% projection of 151.93 to 145.53 from 146.78 at 136.42. On the upside, above 142.47 minor resistance will turn intraday bias neutral first. But risk will remain on the downside as long as 145.53 support turned resistance holds.
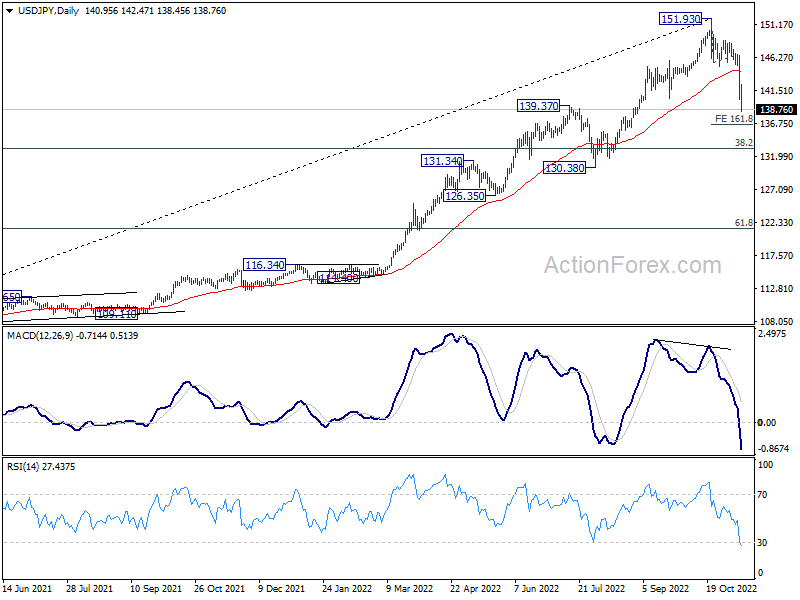
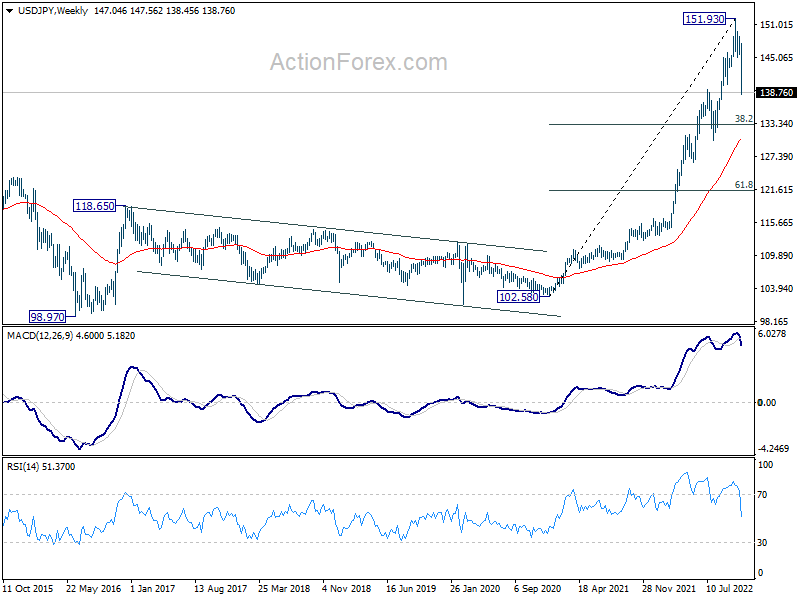
In the bigger picture, a medium term top should be formed at 151.93. Fall from there is correcting larger up trend from 102.58. It's too early to call for bearish trend reversal. But even as a corrective move, such decline should target 38.2% retracement of 102.58 to 151.93 at 133.07, or further to 55 week EMA (now at 130.73).
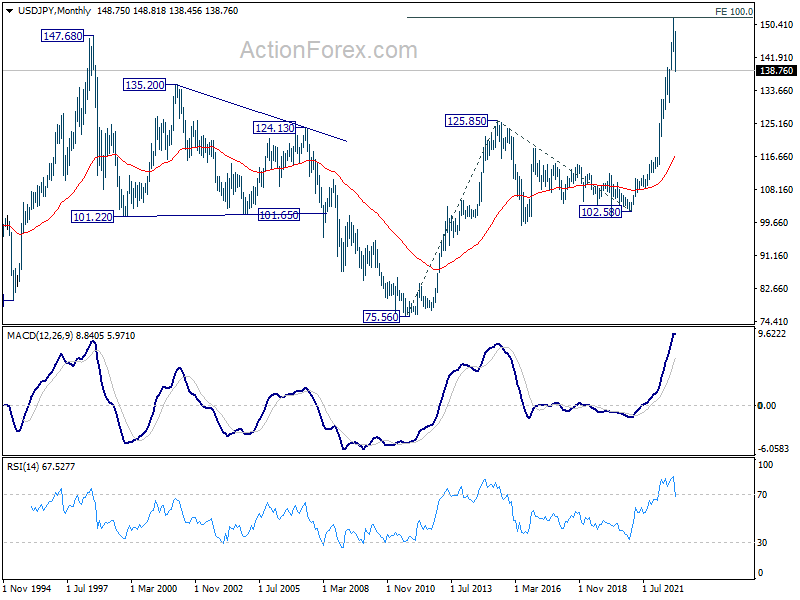
In the long term picture, rise from 102.58, as part of the up trend from 75.56 (2011 low) was put to a halt at 151.93, just ahead of 100% projection of 75.56 to 125.85 from 102.58 at 152.87. There is no clear sign of long term reversal yet. Such up trend is expected to resume at a later stage, as long as 125.85 resistance turned support holds.
EUR/USD Weekly Outlook
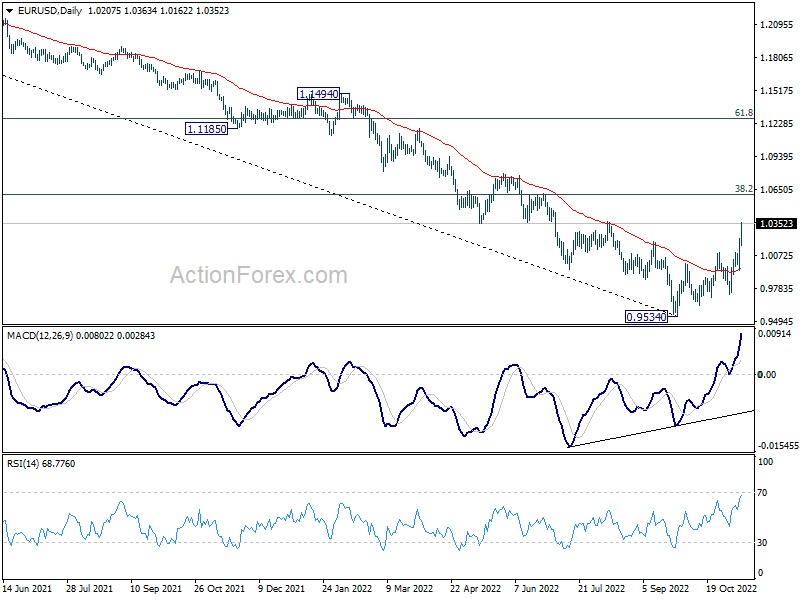
EUR/USD's rise from 0.9534 resumed last week and surged to as high as 1.0363. Initial bias stays on the upside this week for 1.0609 fibonacci level next. On the downside, below 1.0221 minor support will turn intraday bias neutral and bring consolidations first, before staging another rally.
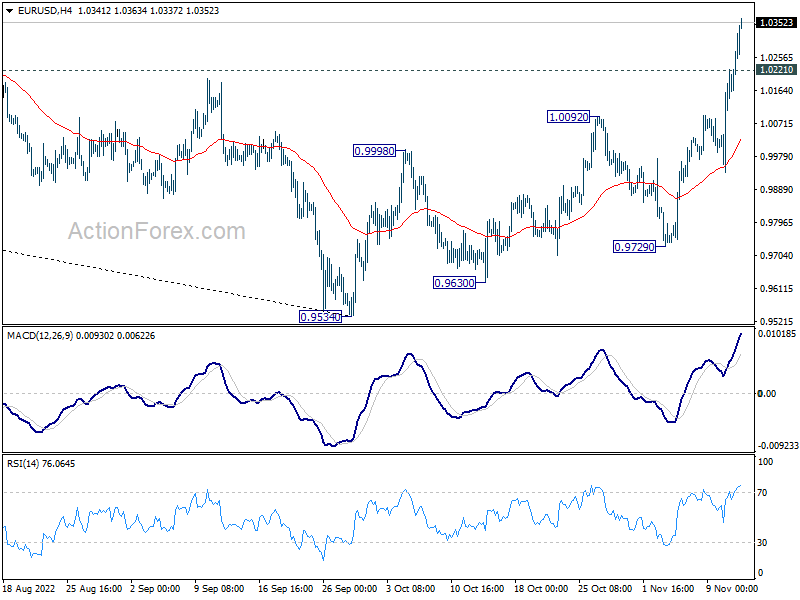
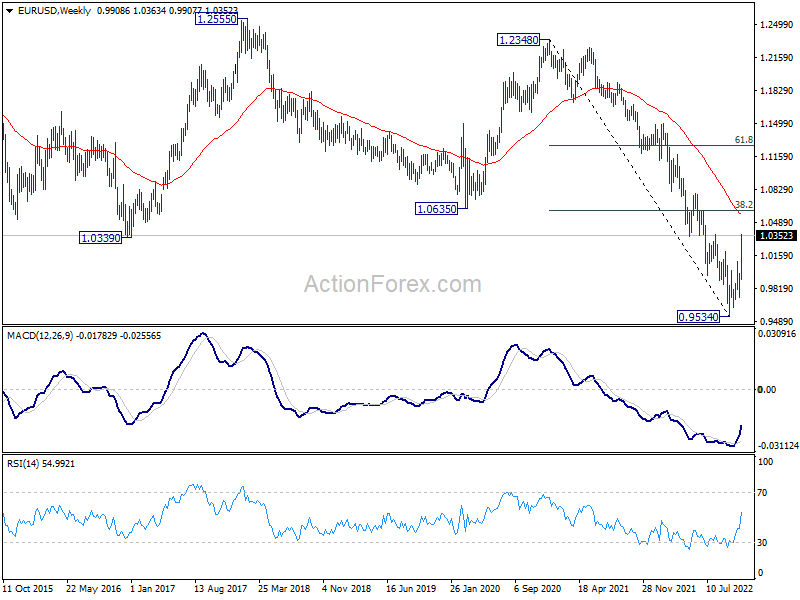
In the bigger picture, a medium term bottom was in place at 0.9534, on bullish convergence condition in daily MACD. Even as a corrective rise, rally from 0.9534 should target 38.2% retracement of 1.2348 (2021 high) to 0.9534 at 1.0609. Sustained trading above 55 week EMA (now at 1.0575) will raise the chance of trend reversal and target 61.8% retracement at 1.1273. This will now remain the favored case as long as 1.0092 resistance turned support holds.
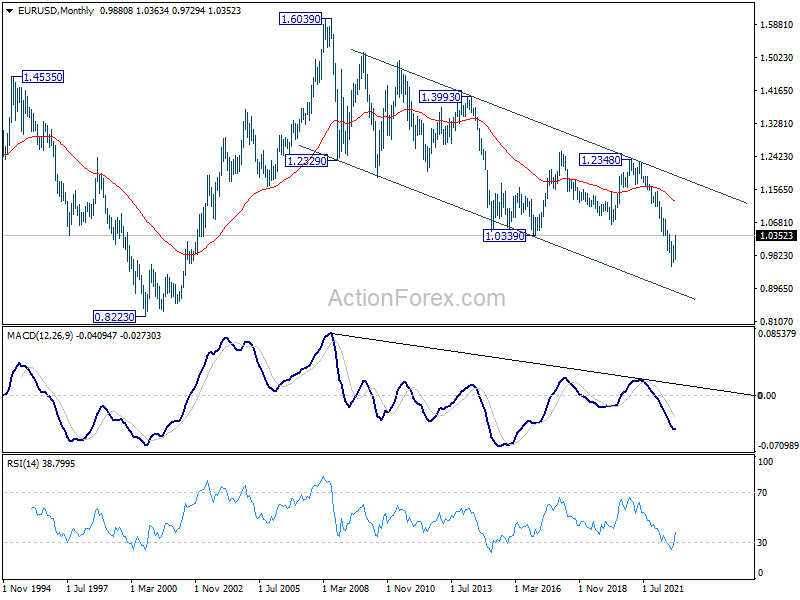
In the long term picture, as long as 1.0635 support turned resistance holds (2020 low), long term down trend from 1.6039 (2008) could still extend through 0.9534 at a later stage. However, sustained break of 1.0635 will confirm bottoming and at least turn long term outlook neutral.
USD/JPY Weekly Outlook
USD/JPY's decline accelerated to as low as 138.76 last week. The development suggests that it's already in correction to whole up trend from 102.58. Initial bias stays on the downside this week for 161.8% projection of 151.93 to 145.53 from 146.78 at 136.42. On the upside, above 142.47 minor resistance will turn intraday bias neutral first. But risk will remain on the downside as long as 145.53 support turned resistance holds.
In the bigger picture, a medium term top should be formed at 151.93. Fall from there is correcting larger up trend from 102.58. It's too early to call for bearish trend reversal. But even as a corrective move, such decline should target 38.2% retracement of 102.58 to 151.93 at 133.07, or further to 55 week EMA (now at 130.73).
In the long term picture, rise from 102.58, as part of the up trend from 75.56 (2011 low) was put to a halt at 151.93, just ahead of 100% projection of 75.56 to 125.85 from 102.58 at 152.87. There is no clear sign of long term reversal yet. Such up trend is expected to resume at a later stage, as long as 125.85 resistance turned support holds.
GBP/USD Weekly Outlook
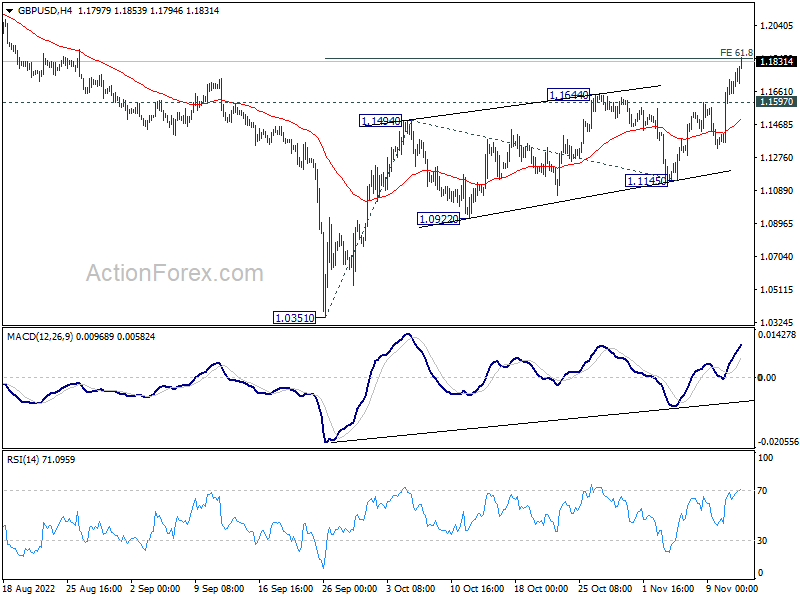
GBP/USD's rise from 1.0351 last week and the break of 1.1759 support turned resistance carries larger bullish implications. Initial bias remains on the upside this week. Firm break of 61.8% projection of 1.0351 to 1.1494 from 1.1145 at 1.1851 will pave the way to 100% projection at 1.2288. On the downside, below 1.1597 minor support will turn intraday bias neutral and bring consolidation first.
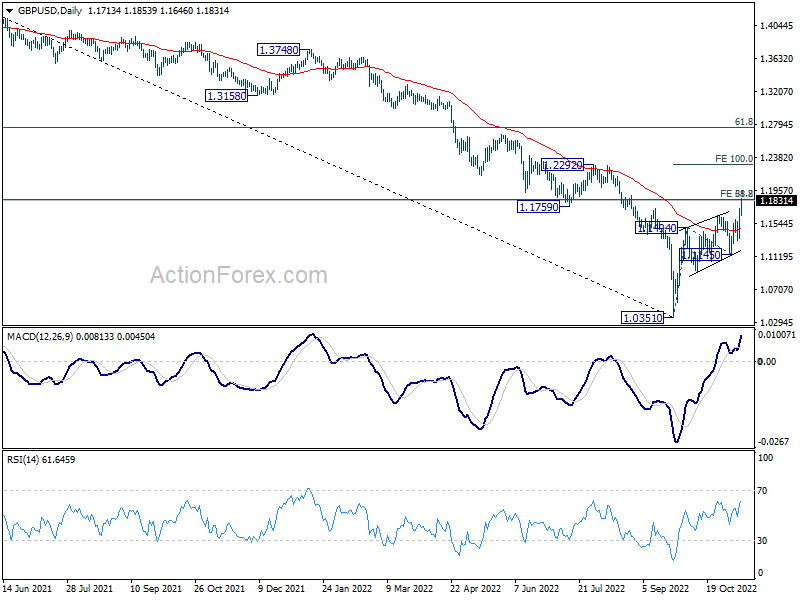
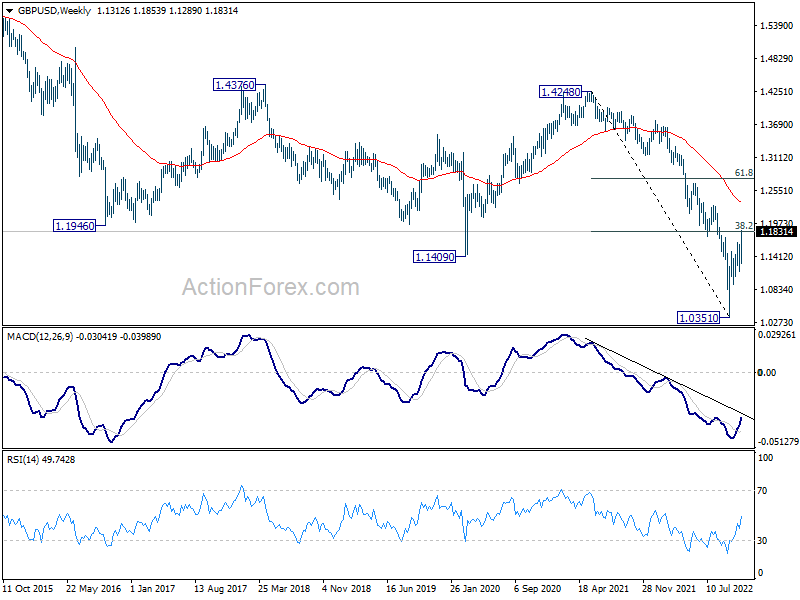
In the bigger picture, current development suggests that rise from 1.0351 is a medium term bottom. Rise from there is at least correcting whole down trend from 1.4248 (2021 high). Further rise is expected as long as 1.1145 support holds. Sustained break of 38.2% retracement of 1.4248 to 1.0351 at 1.1840 will pave the way to 61.8% retracement at 1.2759 and possibly above.
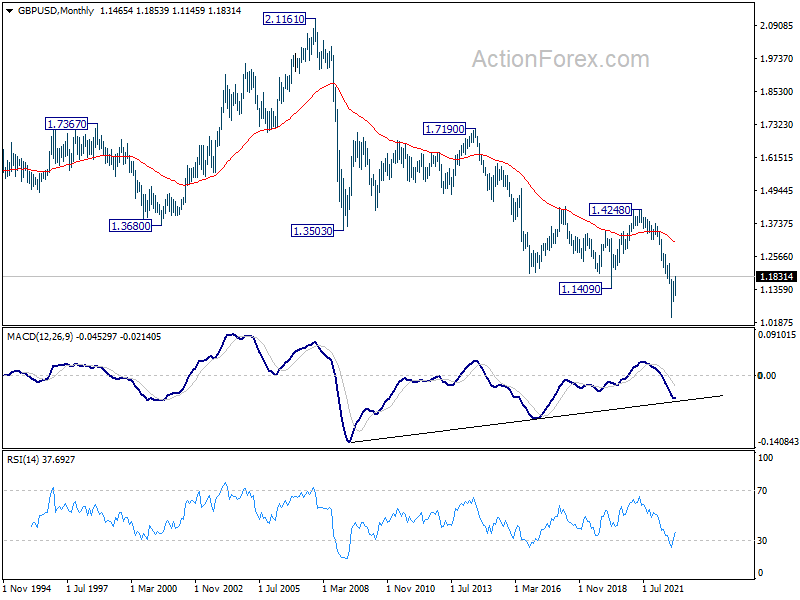
In the longer term picture, as long as 1.4248 resistance holds (2021 high), long term outlook will remain neutral at best. Down trend from 2.1161 (2007) could still resume for another low through 1.0351 at a later stage.
USD/CHF Weekly Outlook
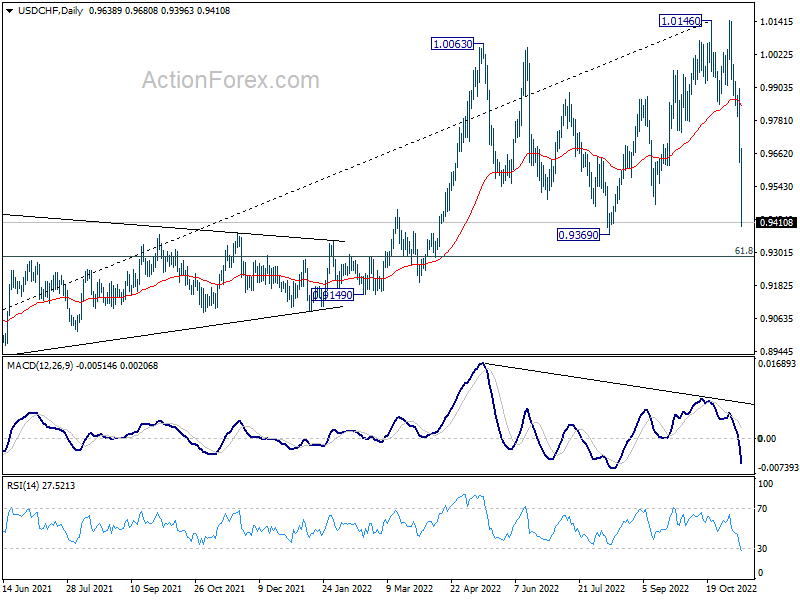
USD/CHF fell sharply last week after completing a double top and hit as low as 0.9363. The strong down trend momentum suggests that larger trend has reversed. Initial bias stays on the downside this week for 0.9369 support, and then 0.9287 fibonacci level. On the upside, break of 0.9544 minor resistance will turn intraday bias neutral first and bring consolidation, before staging another decline.
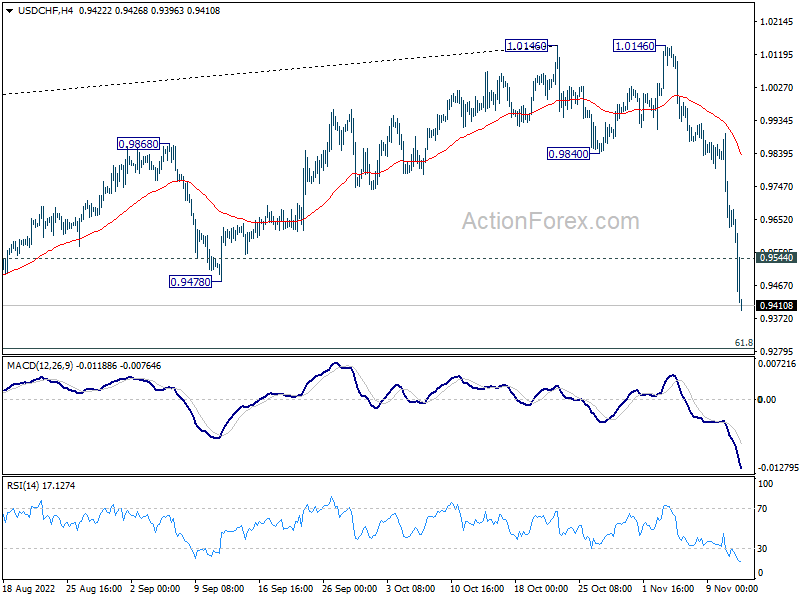
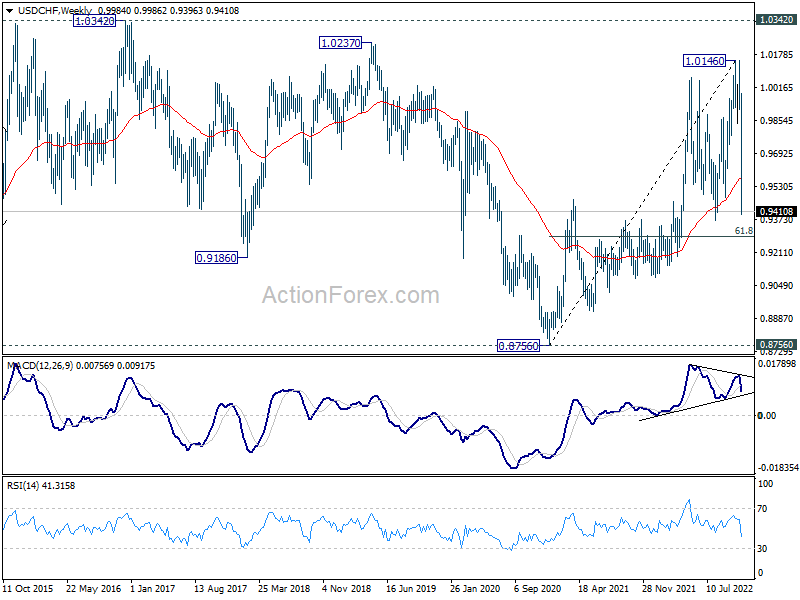
In the bigger picture, rise from 0.8756 (2021 low) has completed at 1.0146, well ahead of 1.0342 long term resistance (2016 high). Based on current downside momentum, fall form 1.0146 might be a medium term down trend itself. Break of 61.8% retracement of 0.8756 to 1.0146 at 0.9287 will pave the way to 0.8756. In any case, risk will stay on the downside as long as 55 day EMA (now at 0.9834) holds.
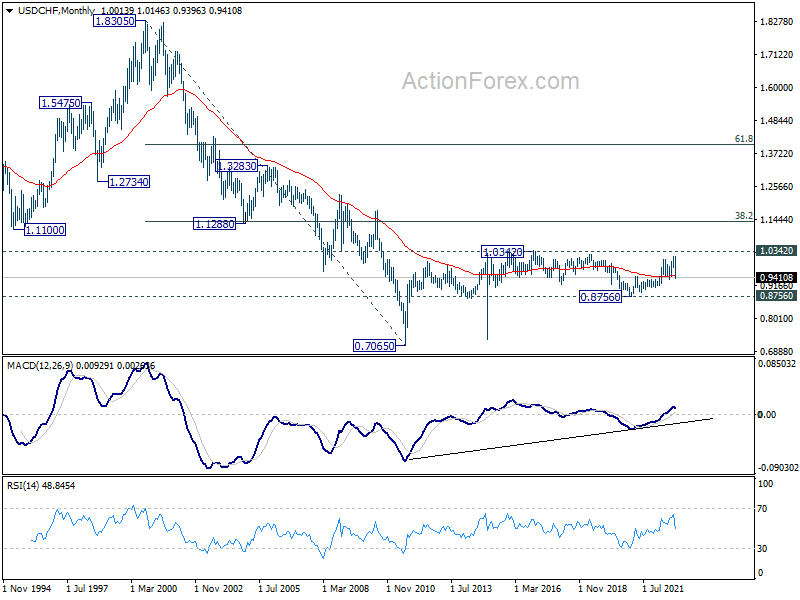
In the long term picture, long term sideway pattern from 1.0342 (2016 high) is extending and it's probably in another medium term down leg. Downside will likely be contained by 0.8756 support in case of deeper fall. Overall, range trading should continue until further development.
AUD/USD Weekly Outlook
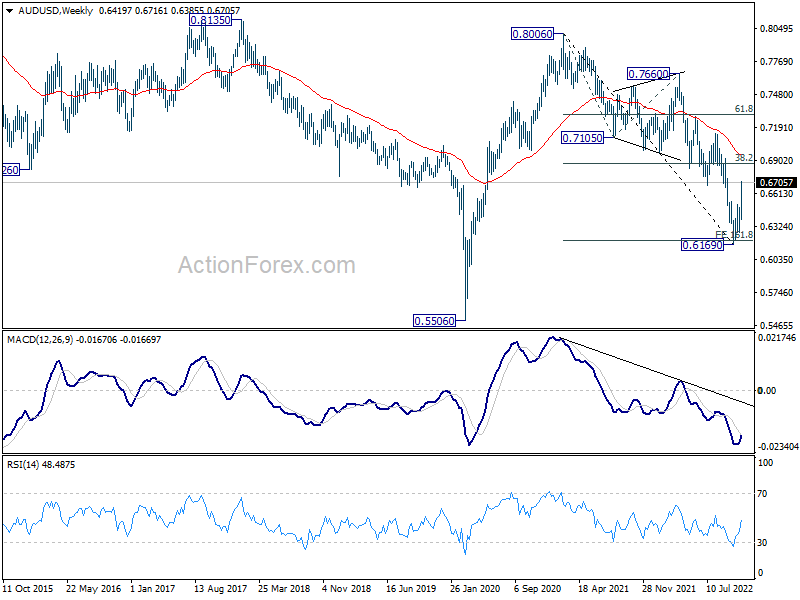
AUD/USD's rebound from 0.6169 resumed and accelerated higher last week. The break of 0.6680 support turned resistance carries larger bullish implication. Initial bias stays on the upside for 161.8% projection of 0.6169 to 0.6521 from 0.6271 at 0.6841. On the downside, below 0.6576 minor support will turn intraday bias neutral and bring consolidations, before staging another rally.
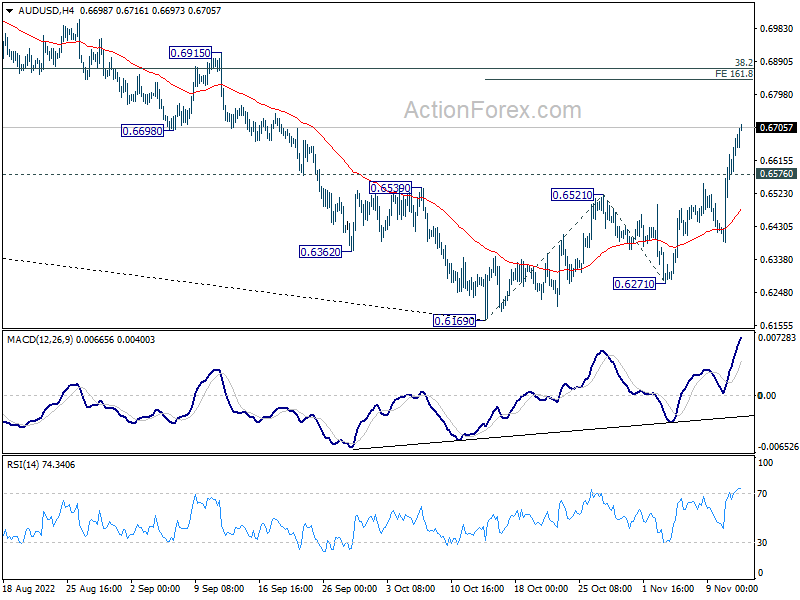
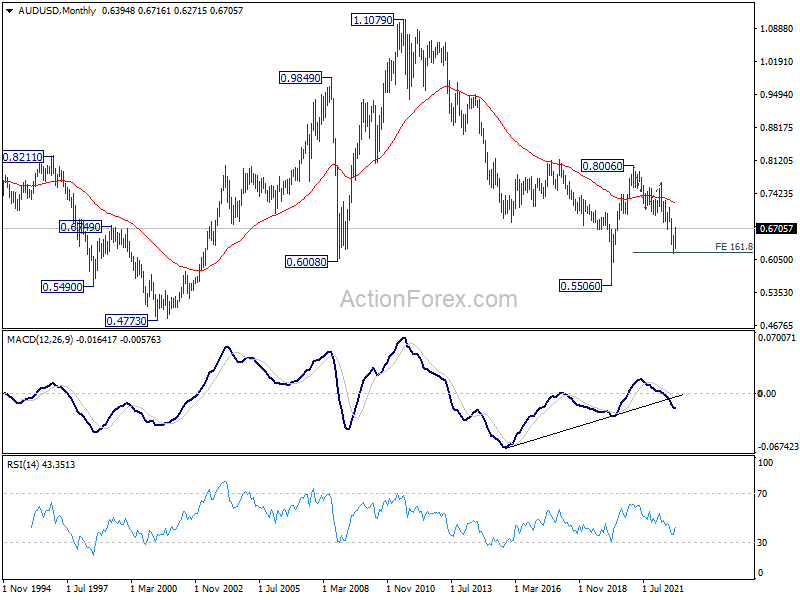
In the bigger picture, the break of 0.6680 support confirms medium term bottoming at 0.6169. It's too early to call for trend reversal. But even as a corrective move, rise from 0.6169 should target 38.2% retracement of 0.8006 to 0.6169 at 0.6871. Sustained trading above 55 week EMA (now at 6934) will raise the chance of the start of a bullish up trend. This week now remain the favored case as long as 0.6521 resistance turned support holds.
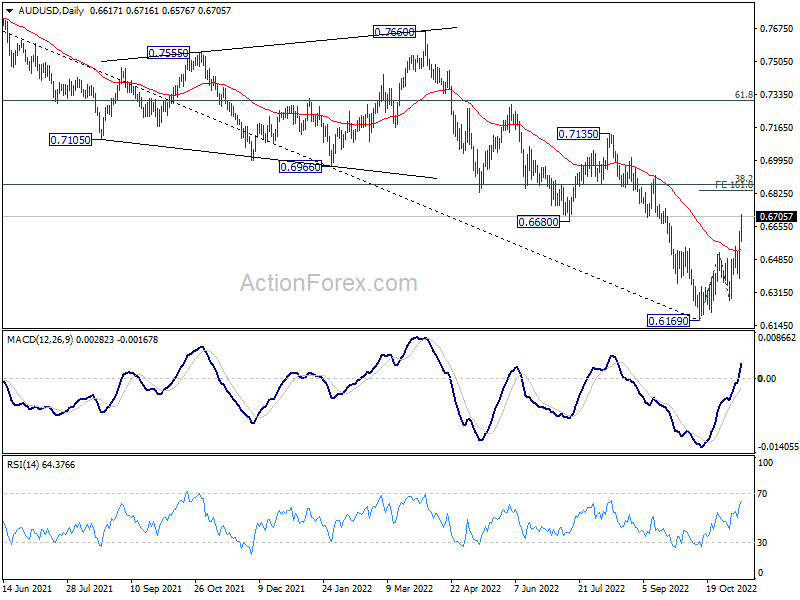
In the long term picture, the down trend from 0.8006 could still be seen as a corrective move, considering that it failed to break through 161.8% projection of 0.8006 to 0.7105 from 0.7660 at 0.6202 decisively. Strong rebound from current level will keep long term outlook neutral first. However, sustained break of 0.6202 will open up deep fall to retest 0.5506.