

Sample Category Title
USD/CHF Daily Outlook
Daily Pivots: (S1) 0.9313; (P) 0.9497; (R1) 0.9597; More...
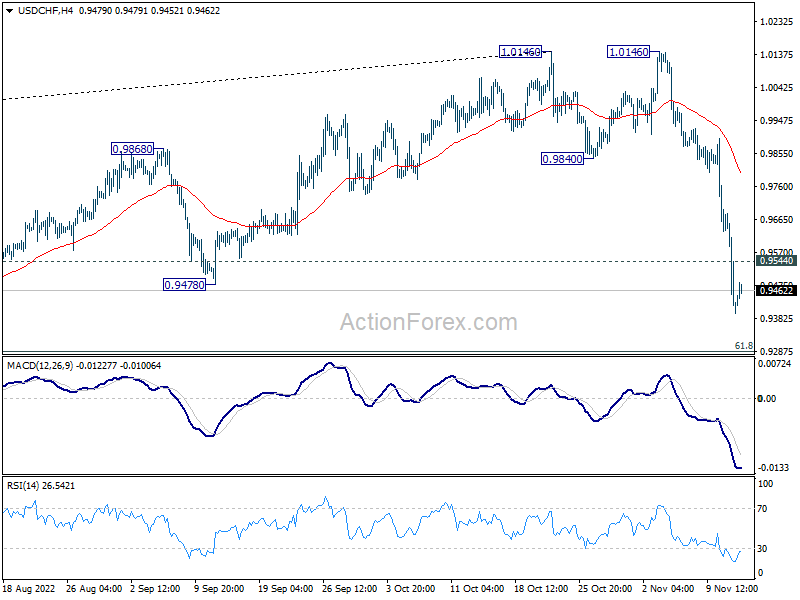
Intraday bias in USD/CHF stays on the downside at this point. Further fall should be seen to 0.9369 support, and then 0.9287 fibonacci level. On the upside, break of 0.9544 minor resistance will turn intraday bias neutral first and bring consolidation, before staging another decline.
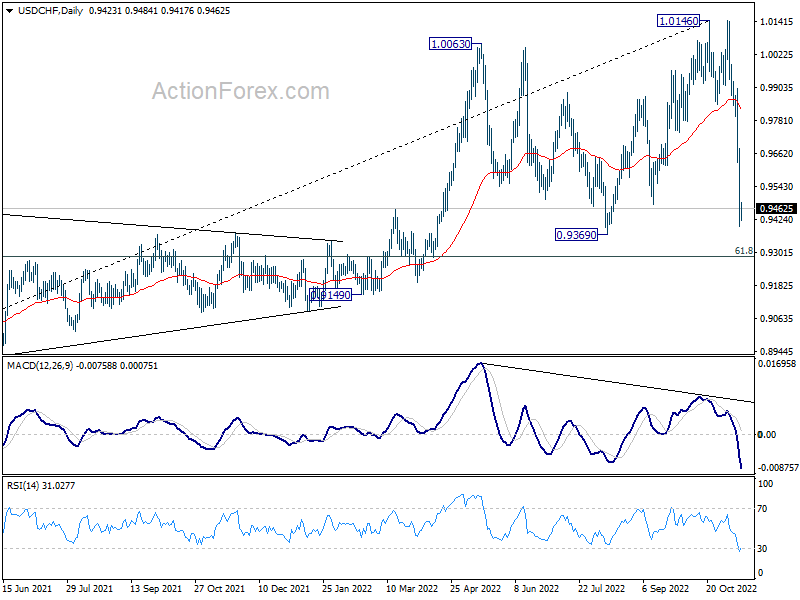
In the bigger picture, rise from 0.8756 (2021 low) has completed at 1.0146, well ahead of 1.0342 long term resistance (2016 high). Based on current downside momentum, fall from 1.0146 might be a medium term down trend itself. Break of 61.8% retracement of 0.8756 to 1.0146 at 0.9287 will pave the way to 0.8756. In any case, risk will stay on the downside as long as 55 day EMA (now at 0.9821) holds.
USD/JPY Daily Outlook
Daily Pivots: (S1) 137.34; (P) 139.91; (R1) 141.35; More...
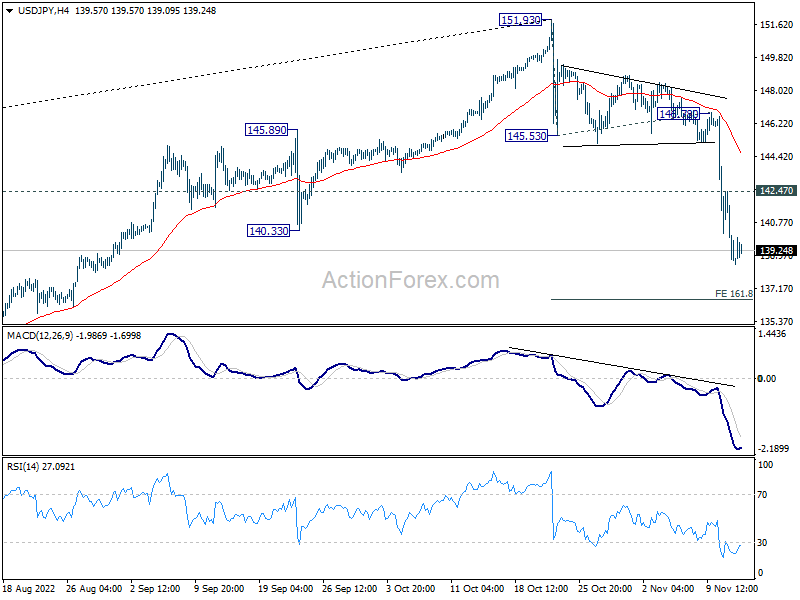
Intraday bias in USD/JPY stays on the downside at this point. Deeper fall would be seen to 161.8% projection of 151.93 to 145.53 from 146.78 at 136.42 next On the upside, above 142.47 minor resistance will turn intraday bias neutral first. But risk will remain on the downside as long as 145.53 support turned resistance holds.
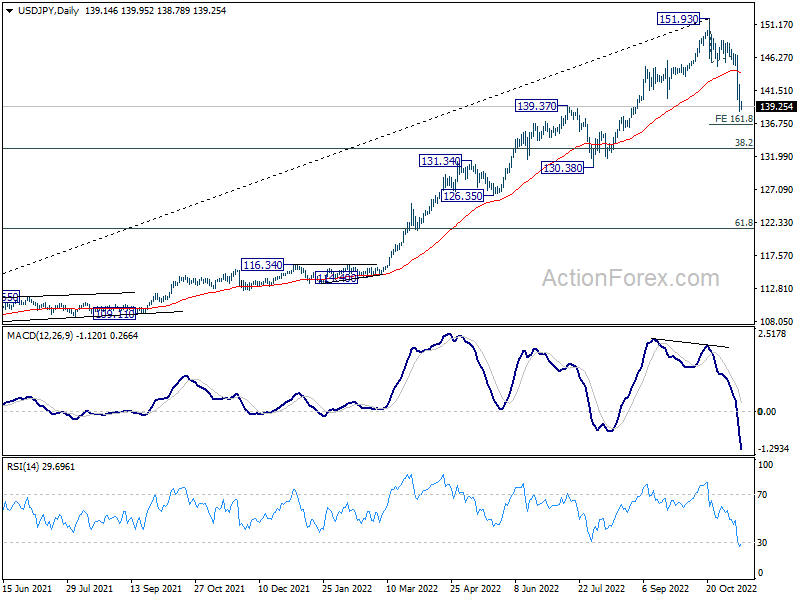
In the bigger picture, a medium term top should be formed at 151.93. Fall from there is correcting larger up trend from 102.58. It's too early to call for bearish trend reversal. But even as a corrective move, such decline should target 38.2% retracement of 102.58 to 151.93 at 133.07, or further to 55 week EMA (now at 130.58).
USD/CAD Daily Outlook
Daily Pivots: (S1) 1.3206; (P) 1.3283; (R1) 1.3331; More....
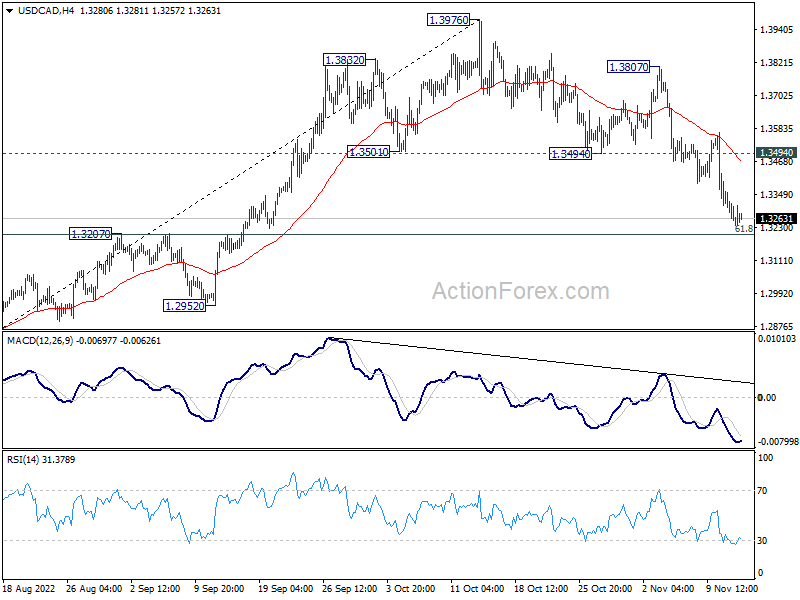
Intraday bias in USD/CAD stays on the downside as fall form 1.3976 is in progress. Strong support should be seen from 1.3207 cluster support (61.8% retracement of 1.2726 to 1.3976 at 1.3204) to bring rebound. Break of 1.3494 support turned resistance will turn bias back to the upside. However, sustained break of 1.3204/7 will carry larger bearish implication and target 1.2952 support next.
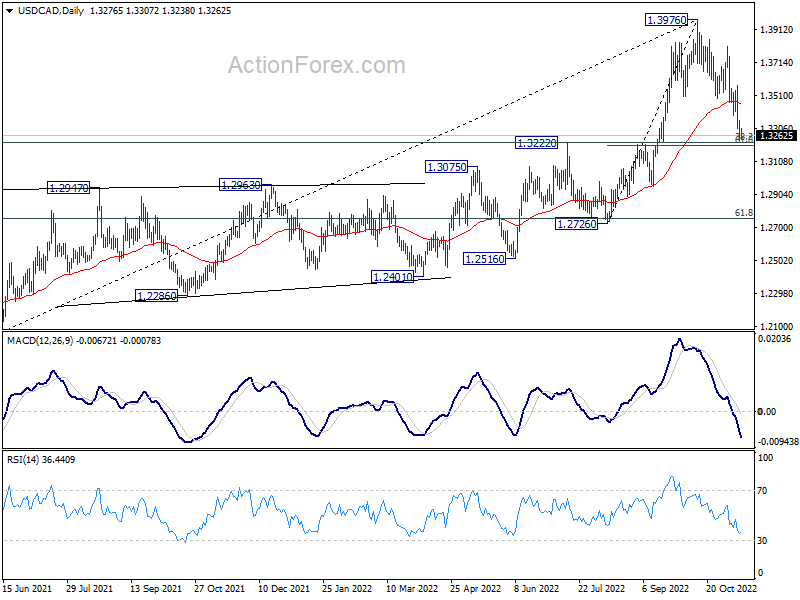
In the bigger picture, as long as 1.3222 cluster support (38.2% retracement of 1.2005 to 1.3976 at 1.3223) holds, larger up trend from 1.2005 (2021 low) is still expected to resume through 1.3976 high at a later stage. . However, firm break of 1.3222/3 will indicate that the trend might have reversed. Deeper fall would be seen to next cluster support at 1.2726 (61.8% retracement at 1.2758).
All I Want for Xmas is Lower Inflation, and Softer ChinesePolicies
It has been an ugly weekend for cryptocurrencies, even though the selloff remained relatively contained in the sector giants like Bitcoin, compared to the size of the bad news that flew in last Friday.
On Friday, FTX filed for Chapter 11. Even FTX’s US leg – that many hoped could come unharmed went under. The FTX collapse pulled some 130 entities down with it.
For now, traders prefer cutting exposure to cryptocurrencies.
Who to blame?
For the latest crypto debacle, some blame the lack of regulation, others say that it’s just a financial fraud like any other. And some even compare it to Enron, which was one of the biggest accounting scandals in the history of modern finance.
FTX held $900 million in liquid assets the day before it went down, compared to $9 billion in liabilities. This is something that could’ve never happened in a traditional, regulated financial institute.
As such begins the hunt for crypto-exchange balance sheets.
What will probably happen from now is, people will do what regulators failed to do: controlling the balance sheets of the crypto exchanges.
And although they are not regulated, and they don’t have to reveal their balance sheets, many crypto exchanges will HAVE to give in, and become more transparent, if they don’t want their users.
So, we may not be done with the cryptocurrency exchanges accounting crisis, just yet.
But one thing is important, the fact that cryptocurrency exchanges haven’t proved to be solid doesn’t make the cryptocurrencies, and their blockchains less valuable.
And if regulators fail to do their jobs, and if people could do it for them, then we will enter a new phase in decentralized finance.
US inflation falls, China eases Covid, property measures. What can we ask more for Xmas?
Market mood outside crypto is extremely joyful after last week’s inflation data surprised investors to the downside and China announced to relax Covid measures, and boost its shattered property sector.
Although the US inflation remains relatively high to contain a perhaps premature bull run on dovish Fed expectations, news from China could help keeping the mood nice and sweet.
We will yet discover if the latest news will be enough to get international investors back on board of a Chinese dream that has been shot to the ground by the very Xi Jinping. Nasdaq’s Golden Dragon China index recovered 40% since its October dip, but is still more than 3.5 times below the levels it was trading in February 2021.
Joe Biden and Xi Jinping will talk today on the sidelines of the G20 summit in Bali. Talks could go either way; they could either boost, or hit risk appetite in Chinese, and global assets.
Xi and Biden to Meet Today
Market movers today
Ahead of the G20 leaders' summit tomorrow, President Xi and Biden are set to meet for their first face-to face meeting today. Securing 'guardrails' on the Taiwan issue could be the most important topic, while we also look out for comments from Xi about his opposition to using nuclear weapons.
Fed's Brainard and Williams will have opportunity to give markets their perspectives on last week's US inflation downside surprise. We argue that a Fed 'pivot' is premature amid lingering inflation risks from various fronts.
Later this week, the UK updates markets on its fiscal plans and US retail sales for October will reveal more about the state of the US consumer.
The 60 second overview
China. Friday's risk appetite was supported by the repercussions of the US CPI as well as easing of quarantine restrictions in China for travellers entering the country. a) the quarantine for incoming travellers were changed to 5+3 (5 days in quarantine hotel or government facility followed by 3 days at home) from 7+3, b) the same shorter quarantine applies to close contacts and c) close contacts of close contacts will no longer be identified, d) a system that penalizes airlines for bringing in virus cases will be scrapped. However, there are no signs of any material change to the policy apart from tweaks to try to ease the pain of the policy. China also changed rules to support the failing property market.
US: Over the weekend, the Democratic party's Catherine Cortez Masto was projected to win the Nevada senate election, which means that Democrats will maintain at least the 50-50 majority in the Senate irrespective of the result of the Georgia runoff election. While the result is a positive surprise for the Democrats, it should not have a strong impact on the markets as Republicans are still the favorites to win control of the House, which would end up with a divided Congress. This week markets will continue to digest last week's CPI print with special focus on the October Retail sales on Wednesday, which will provide some light on whether the easing price pressures truly reflected lower demand as Fed would hope. We continue to see risks of inflation turning out more persistent than expected, read our take from: Research US - Inflation risks are not over yet, 11 November.
Fed: Overnight Fed's Waller downplayed the significance of a single US CPI figure, while acknowledging the development is good news. He continued his hawkish views saying there are 'Ways to Go' before being done on rate hikes.
EC forecast: The new EU Commission autumn economic projections foresee a short euro area recession during Q4 22 and Q1 23 as their baseline, with 2023 GDP growth revised down to 0.3%. Germany and Sweden will be hardest hit by the recession. Euro area inflation is projected to average 8.5% this year and 6.1% in 2023, before declining to 2.6% in 2024. This also ups the pressures on ECB to have a recession in their baseline scenario for the December forecasting round and we have already heard a number of GC members this week hinting that the recession view is gaining ground (although in contrast to the Fed, with no slackening of the hiking pace yet in sight).
Equities: What a week for equities. What started as mild optimism turned into an outright rally. Tech - our preferred cyclical sector - rebounded by 10% in the US. Our growth and quality preference was even more absurd in the Nordics where real estate returned a massive 20%. Interesting to see this rally resulting in only a small move lover in VIX and gold having a very strong performance alongside the equity rally. This underscores how sensitive equity investors have been to inflation, central banks and yields. This will probably continue for some time. However, the bad news being good news cannot take equities much higher from here on. In US, equities ending just off best levels on Friday with Dow +0.1%, S&P 500 +0.9%, Nasdaq +1.9% and Russell 2000 +0.8%. Asian markets are mixed this morning with Chinese stocks higher on renewed hope for the property sector while most other markets are lower. US futures in red this morning while European futures are higher.
FI: Friday's price actions were mostly a reversal of the bond market rally after the US CPI on Thursday. The 12bp sell-off in the 10y German Bund leaves the Bund 1bp lower than the pre-US CPI level at 2.16%. Unsurprisingly, the belly of the curve underperformed the most. Bund ASW tightened 5bp to stand at 79bp, which is the tightest since July.
FX: Thursday's US CPI report had a major impact in FX markets, triggering a sharp sell-off in the USD which has pushed EUR/USD above 1.03 for the first time since August. Scandies were among the winners within G10, where notably the SEK might have found extra support in SEK positive M&A flows, which could continue into the start of this week. Note that we will publish our latest FX Forecast Update later today.
Credit: Credit markets saw further tightening on Friday as iTraxx Main was tighter by 1.7bp and Crossover by 4.8bp, with the indices ending the week tighter by 11.8bp and 52.2bp, respectively (at 97.6bp and 481.9bp).
Technical Outlook and Review
USD/JPY:
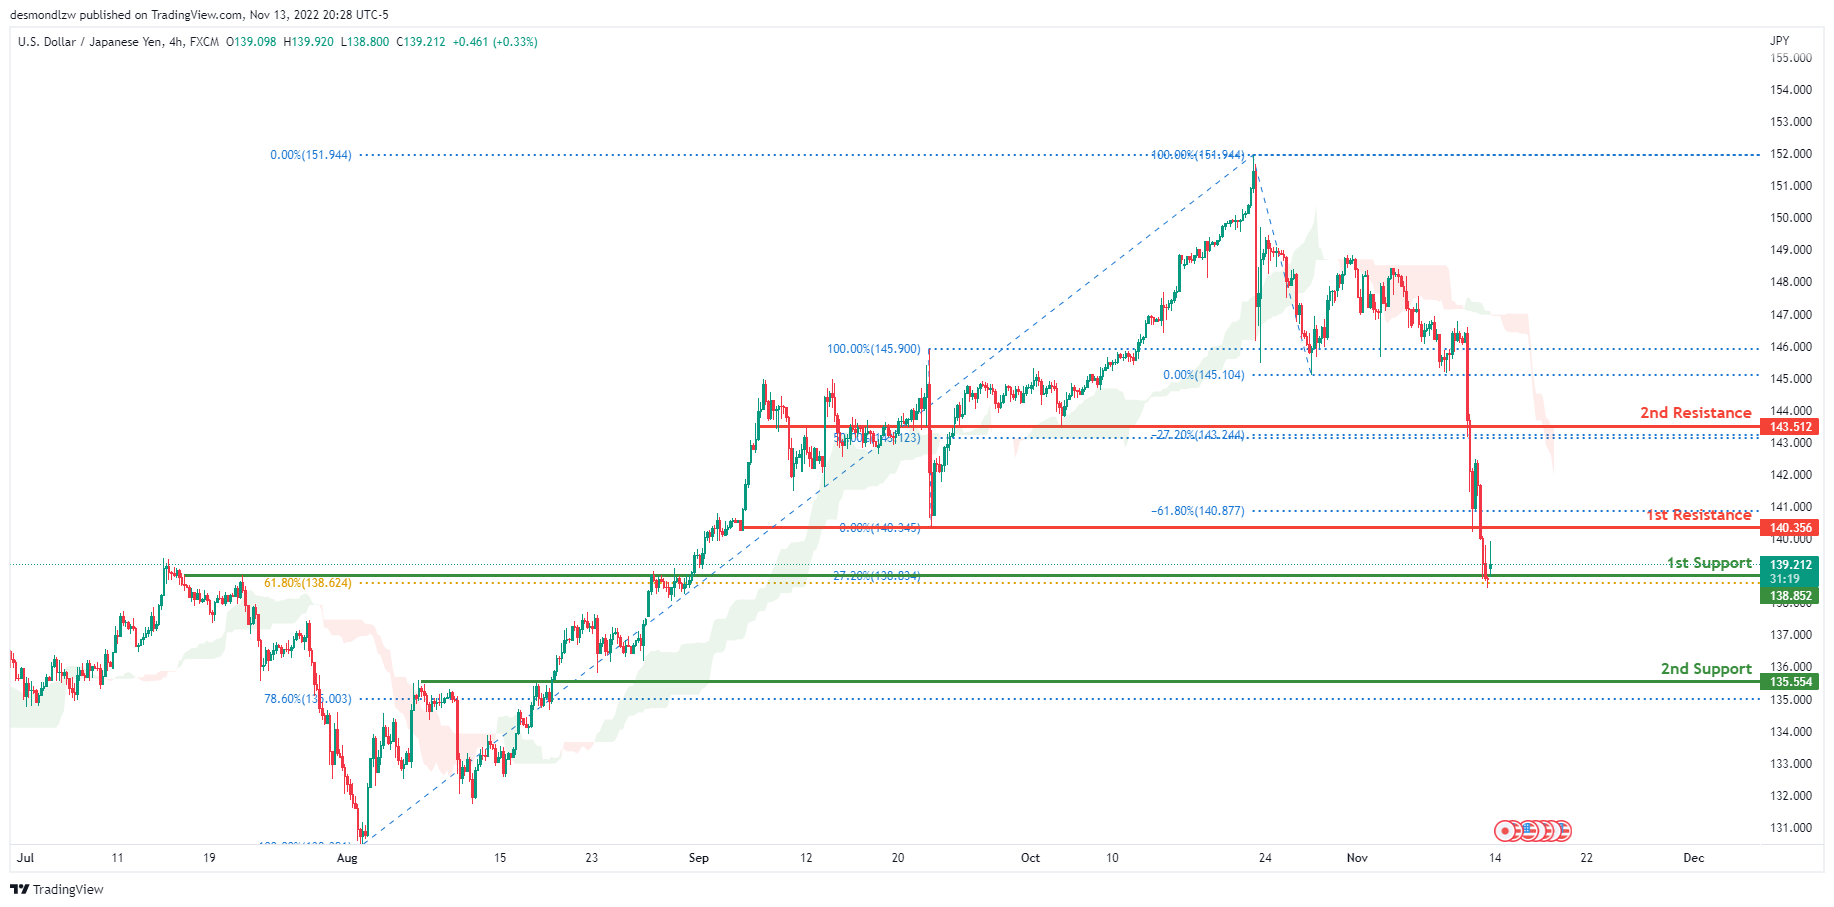
The current general bias for USDJPY on the H4 chart is bearish. To add confluence to this, the price is below the Ichimoku cloud which indicates a bearish market. Towards the end of last week, USDJPY had huge bearish momentum due to the release of the US CPI being worse than last month and expected. Price is currently trading at 139.184 at time of writing. If the bearish momentum continues, expect USDJPY to break the 1st support line at 138.852 where the -27.2% Fibonacci expansion line is located and head towards the 2nd support line at 135.554 where the 78.6% Fibonacci line is located. In an alternative scenario, price could go back up to retest the 1st resistance at 140.356, where the -61.8% Fibonacci expansion line and previous low are located.
Areas of consideration:
- H4 time frame, 1st resistance at 140.356
- H4 time frame, 1st support at 138.852
- H4 time frame, 2nd support at 135.554
DXY:
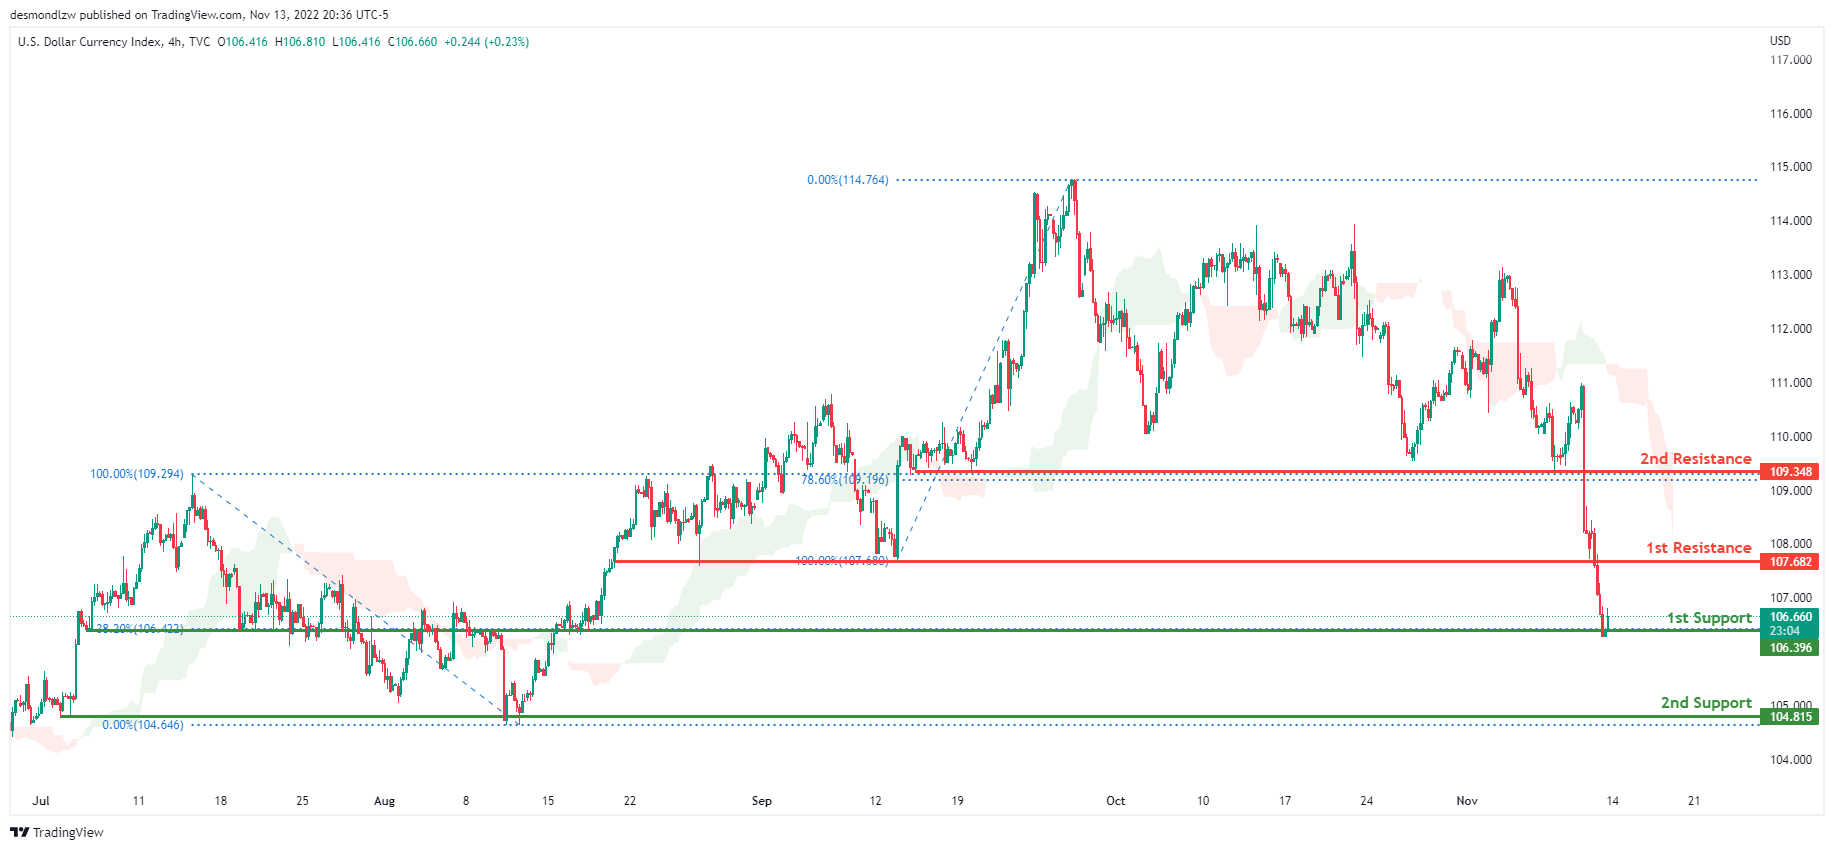
On the H4 chart, the overall bias for DXY is bearish. To add confluence to this, the price is below the Ichimoku cloud which indicates a bearish market. Towards the end of last week, price had huge bearish momentum due to the release of the US CPI being worse than last month and expected. The price is currently trading at 106.694 at the time of writing. If this bearish momentum continues, price could break the 1st support line at 106.396 where the 38.2% fibonacci line is located, before heading towards the 2nd support at 104.815 where the previous low and the 0% Fibonacci line are located. In an alternative scenario, price could head back up and retest the 1st resistance line at 107.682, where the previous low and 100% Fibonacci line are located.
Areas of consideration:
- H4 time frame, 1st resistance at 107.682
- H4 time frame, 1st support at 106.396
- H4 time frame, 2nd support at 104.815
EUR/USD:
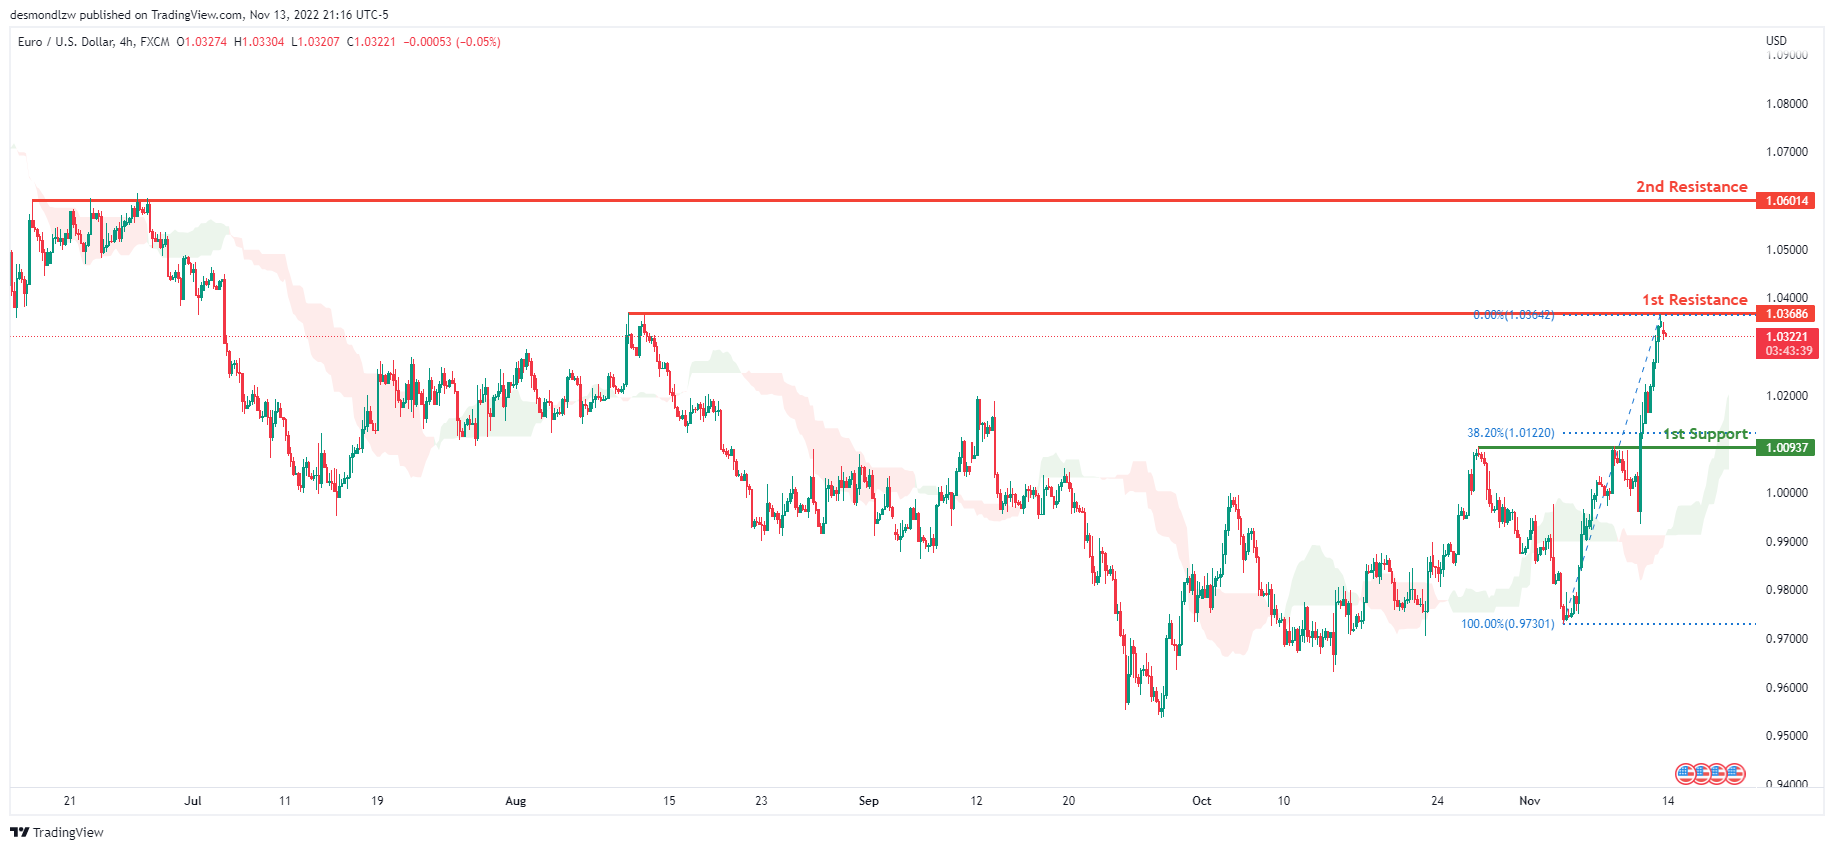
On H4, with the price moving above the ichimoku cloud, we have a bullish bias that the price may rise to the 1st resistance at 1.03686, which is in line with the swing high and 0% fibonacci extension. If the 1st resistance is broken, the 2nd resistance is at 1.06014, where the previous swing high is. Alternatively, the price may drop to the 1st support at 1.00937, which is in line with the 38.2% fibonacci retracement.
Areas of consideration :
- H4 1st resistance at 1.03686
- H4 1st support at 1.00937
GBP/USD:
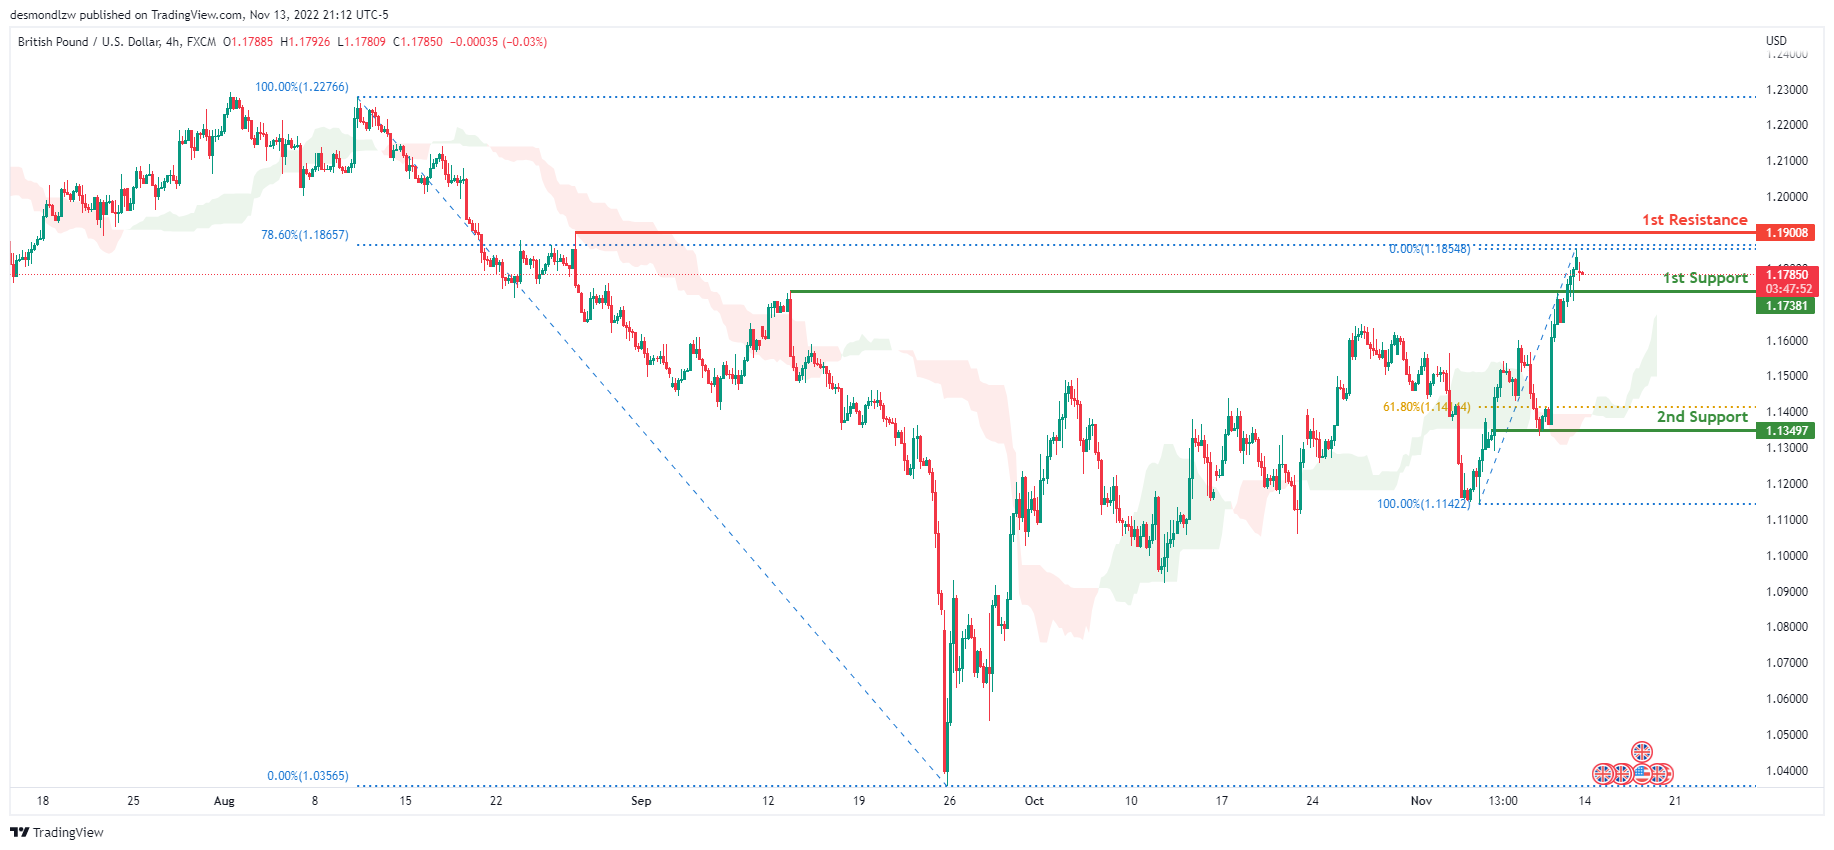
On the H4, price is moving above ichimoku cloud, we have a bullish bias that the price may rise to the 1st resistance at 1.19008, which is in line with the 78.6% fibonacci and the previous swing high. Alternatively, the price may drop to retest the 1st support at 1.17381, where the previous swing high is.
Areas of consideration:
- H4 1st resistance at 1.19008
- H4 1st support at 1.17381
USD/CHF:
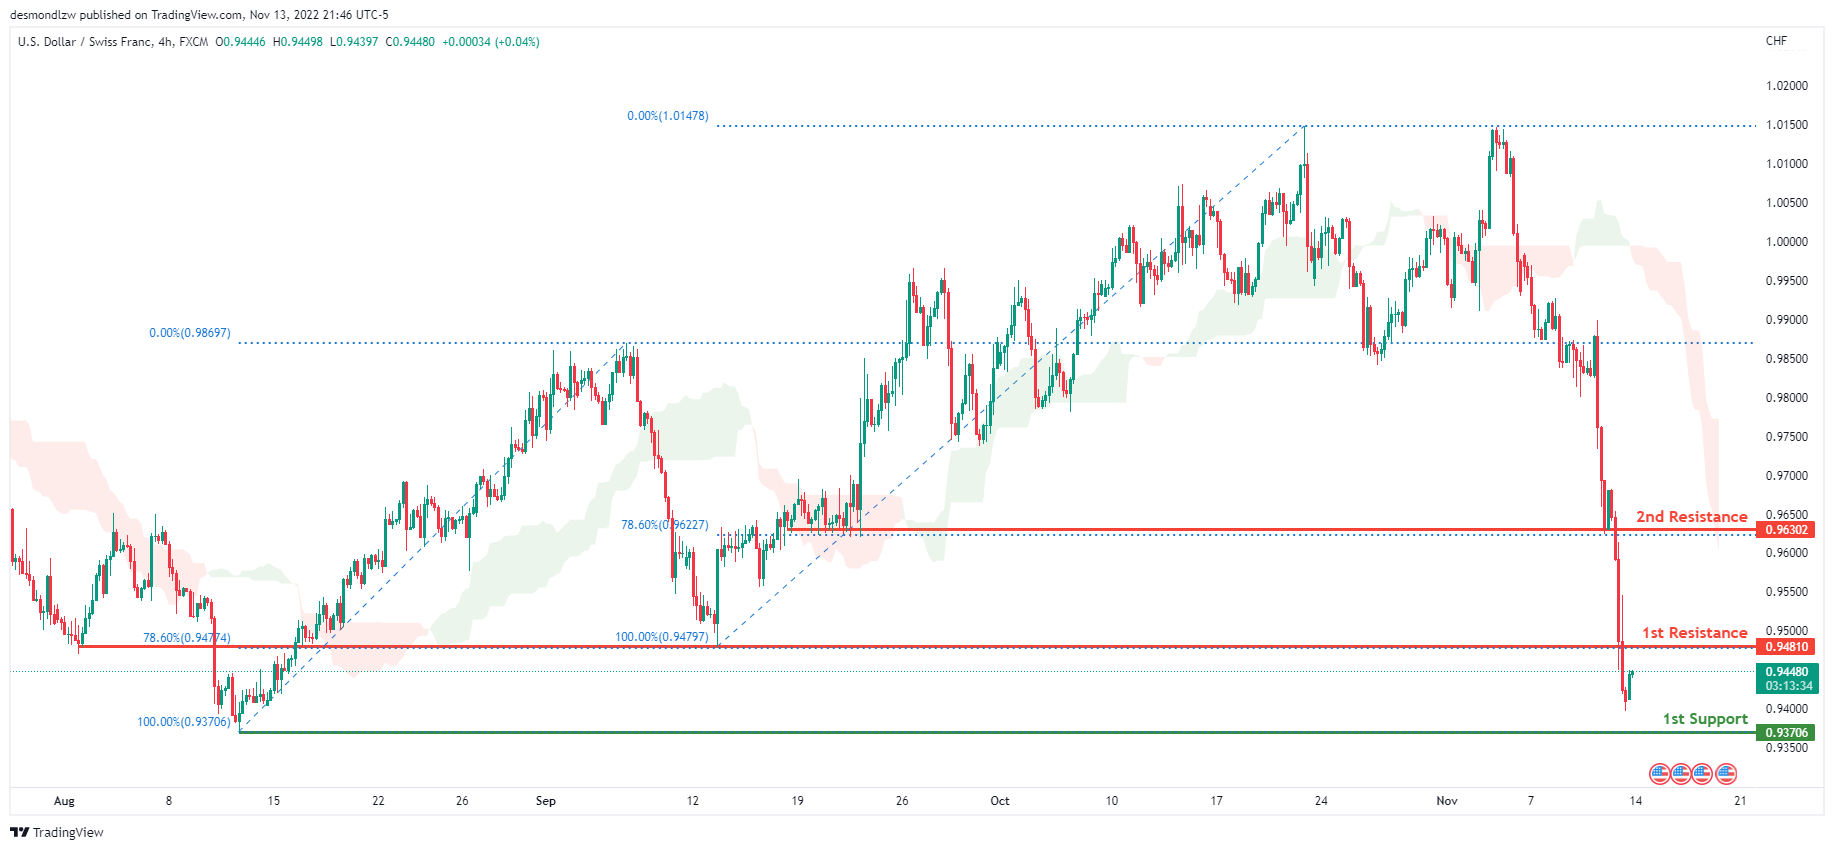
On the H4 chart, the overall bias for USDCHF is bearish. To add confluence to this, the price is below the Ichimoku cloud which indicates a bearish market. If this bearish momentum continues, expect price to head towards the 1st support line at 0.93706, where the previous low is located. In an alternative scenario, price could head back up to retest the 1st resistance line at 0.94810, where the 78.6% Fibonacci line is located. If the 1st resistance line is broken, the 2nd resistance line is located at 0.96302, where the 78.6% Fibonacci line is.
Areas of consideration
- H4 1st support at 0.93706
- H4 1st resistance at 0.94810
- H4 2nd resistance at 0.96302
XAU/USD (GOLD):
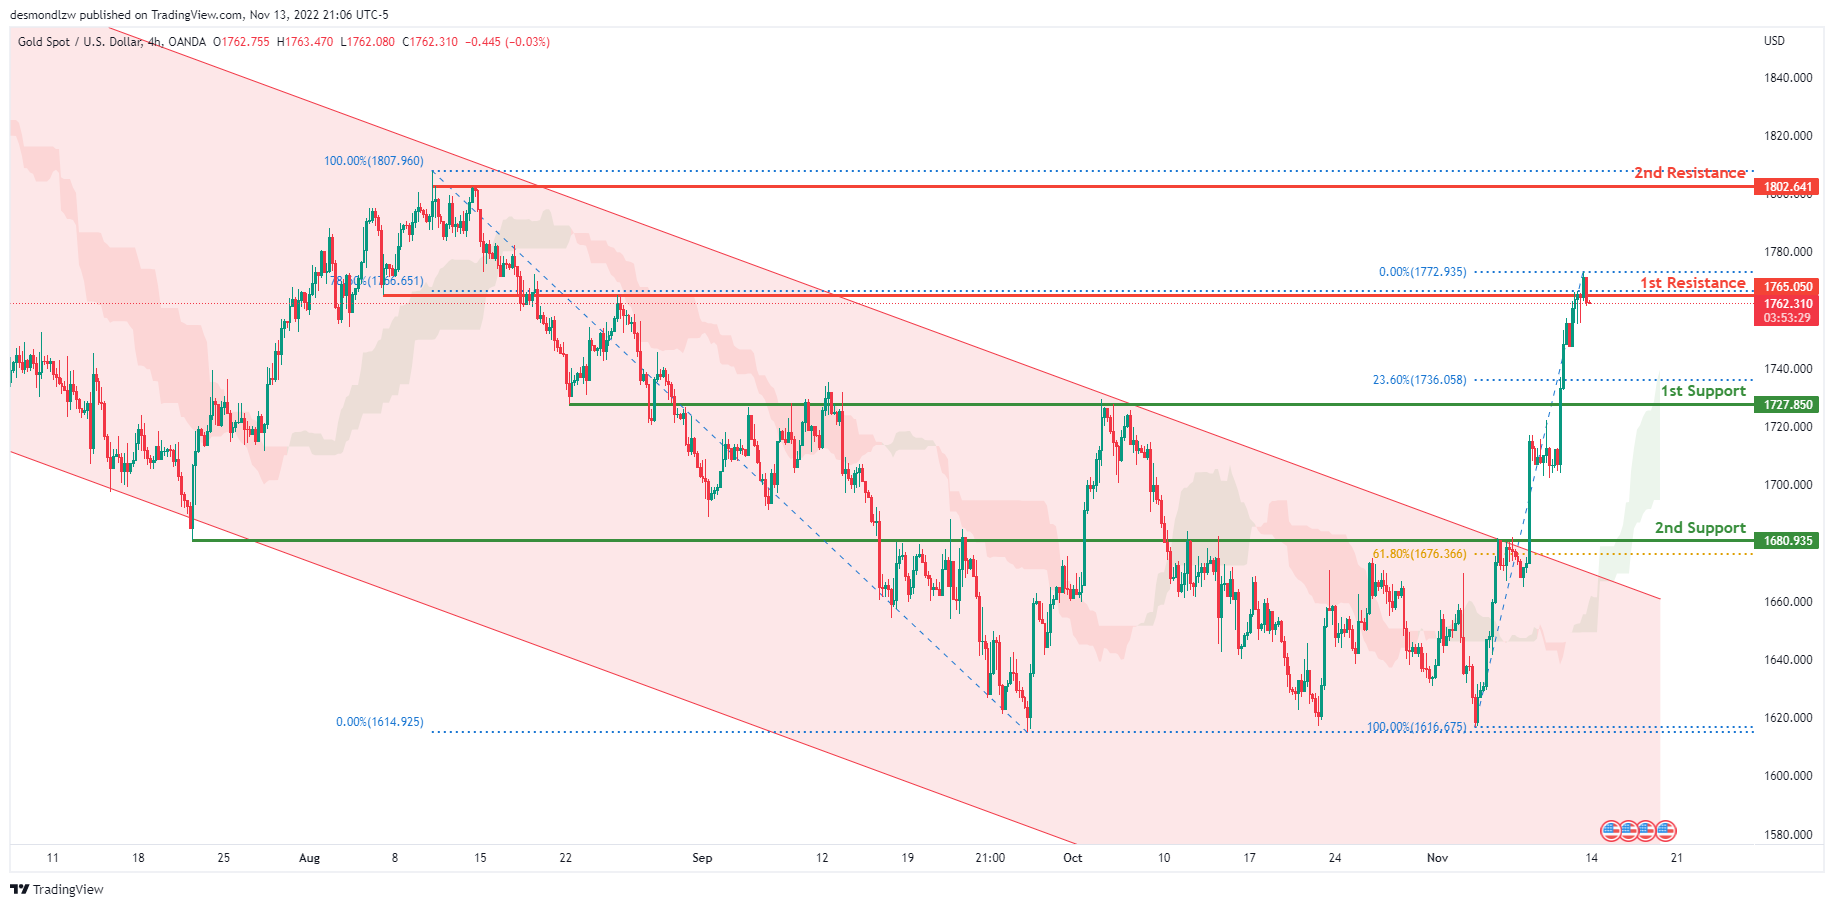
On H4, with the price breaking the descending channel and above the ichimoku cloud, we can expect the price rise break the 1st resistance at 1765.050, which is in line with the previous swing high and 78.6% fibonacci retracement, if the 1st resistance is broken, the 2nd resistance is at 1802.641, where the previous swing high is. Alternatively, the price may drop to the 1st support at 1727.850, where the 23.6% fibonacci retracement is.
Areas of consideration:
- H4 time frame, 1st resistance at 1765.483
- H4 time frame, 1st support at 1727.850
AUD/USD:
On the H4, with the price moving above the ichimoku cloud, we have a bullish bias that the price may rise to the 1st resistance at 0.67711, which is in line with the 161.8% fibonacci line. If the 1st resistance is broken, the 2nd resistance should be at 0.69161, where the previous swing high is. Alternatively, the price may drop to the 1st support at 0.65398, where the 38.2% Fibonacci line is located.
Areas of consideration
- H4, 1st resistance at 0.67711
- H4, 1st support at 0.65398
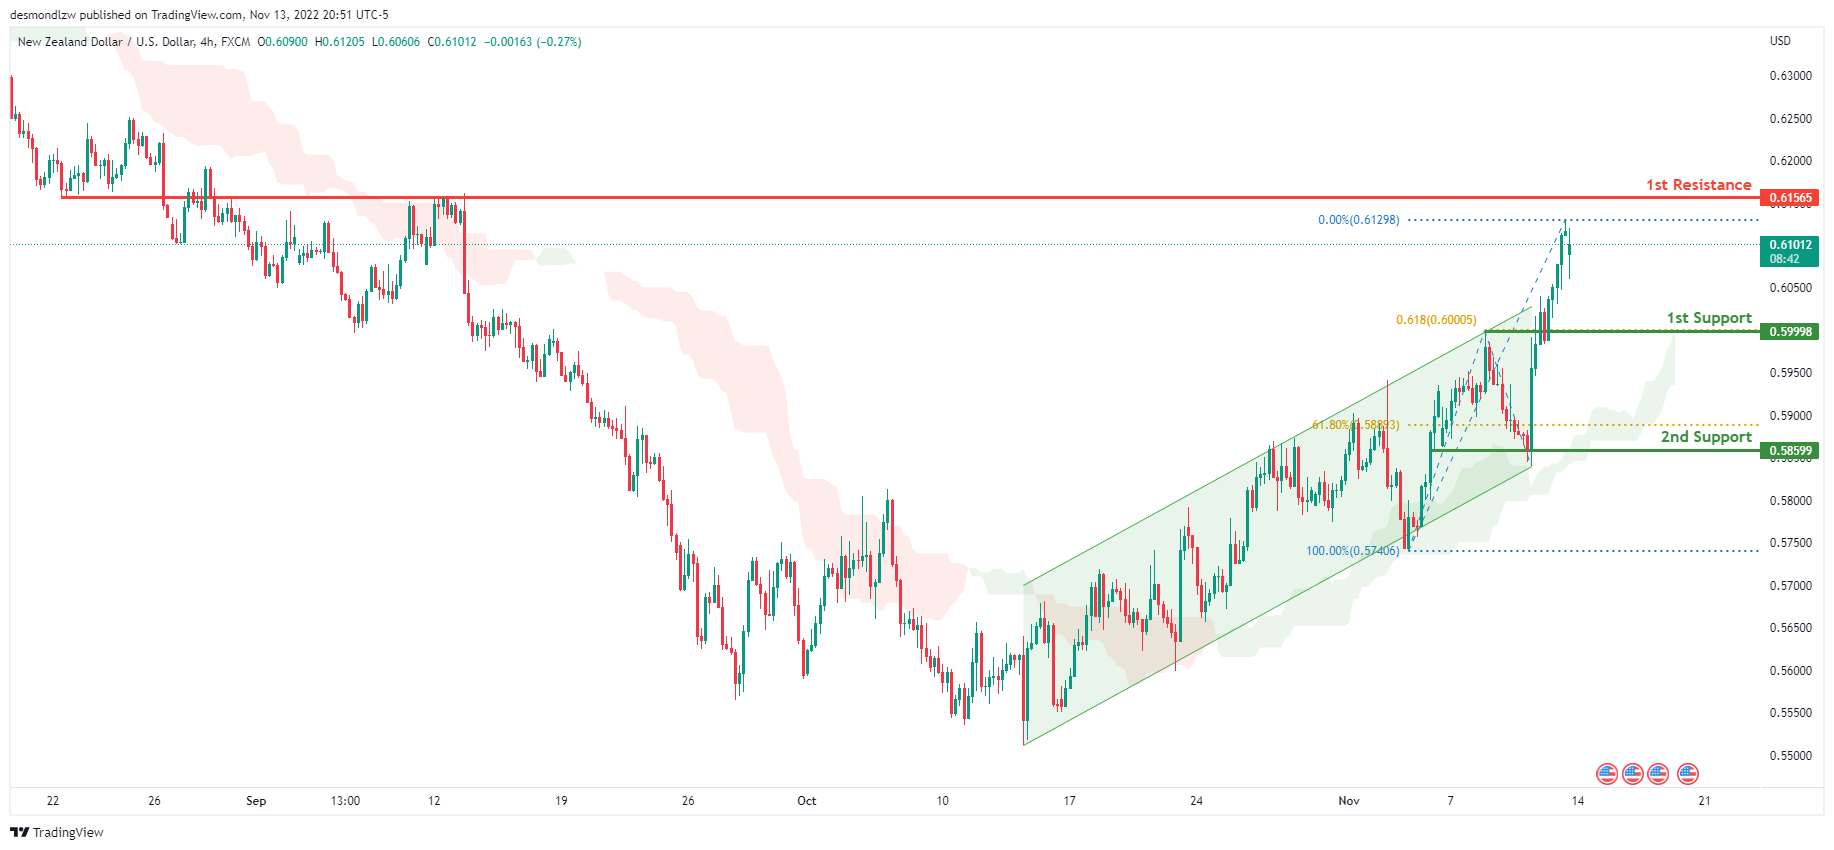
NZD/USD:
On the H4 chart, the price is moving above the Ichimoku cloud and has broken out of the ascending channel. Towards the end of last week, price had bullish momentum due to the release of the US CPI being worse than last month and expected. The price is currently trading at 0.60982 at the time of writing. If this bullish momentum continues, the price may head towards the 1st resistance at 0.61565, which is in line with the previous swing high and 0% fibonacci line. Alternatively, the price may head back towards the 1st support at 0.59998, where the 61.8% Fibonacci projection line is located.
Areas of consideration:
- H4 time frame, 1st resistance at 0.61565
- H4 time frame, 1st support at 0.59998
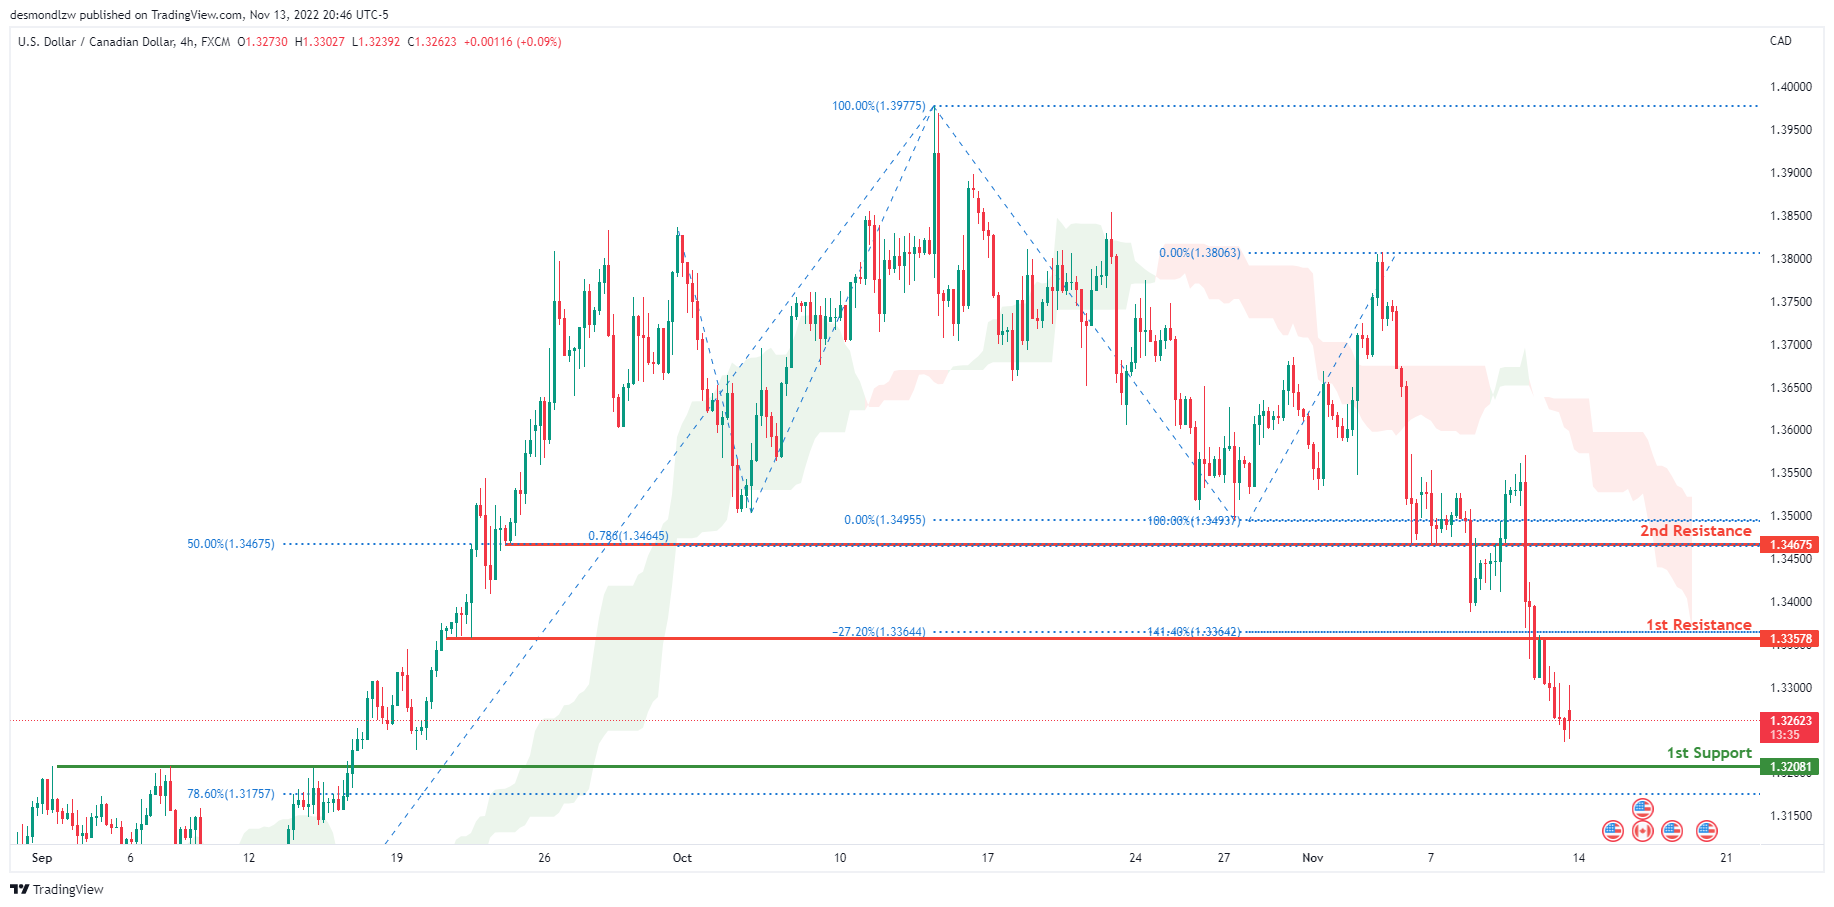
USD/CAD:
On the H4 chart, the overall bias for USDCAD is bearish. To add confluence to this, the price is below the Ichimoku cloud which indicates a bearish market. Towards the end of last week, price had huge bearish momentum due to the release of the US CPI being worse than last month and expected. The price is currently trading at 1.32624 at the time of writing. If this bearish momentum continues, expect the price to head down towards the 1st support line at 1.32081, where the 78.6% Fibonacci line is located.. In an alternative scenario, price could head back up breaking the 1st resistance line at 1.33578, where the -27.2% Fibonacci expansion line and 141.4% Fibonacci line are located.
Areas of consideration:
- H4 time frame, 1st resistance at 1.33578
- H4 time frame, 1st support at 1.32081
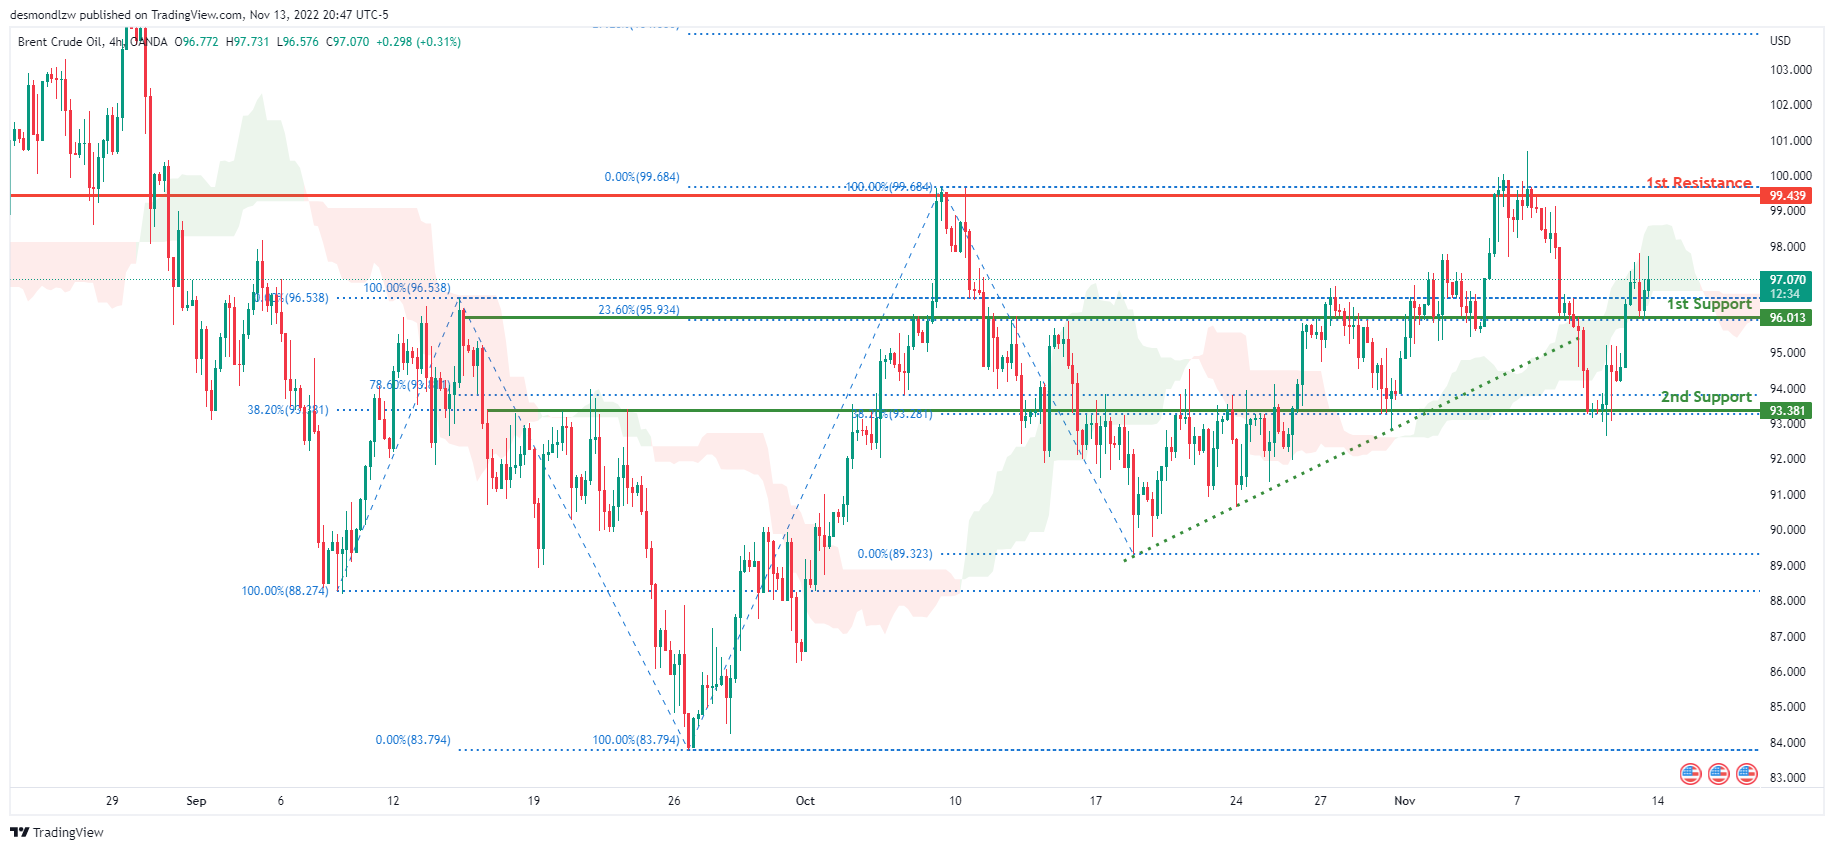
OIL:
Looking at the H4 chart, the current overall bias for Oil is bearish. To add confluence to this, the price is below the Ichimoku cloud which indicates a bearish market. Towards the end of last week, price had bullish momentum due to the release of the US CPI being worse than last month and expected. The price is currently trading at 97.080 at the time of writing. If this bearish momentum continues, expect price to retest the 1st support level at 96.013 where the 23.6% and 0% Fibonacci lines are located. In an alternative scenario, price could head towards the 1st resistance level at 99.439 where the 100% Fibonacci line and previous high are located.
Areas of consideration:
- H4 time frame, 1st resistance at 99.439
- H4 time frame, 1st support at 96.013
- H4 time frame, 2nd support at 93.381
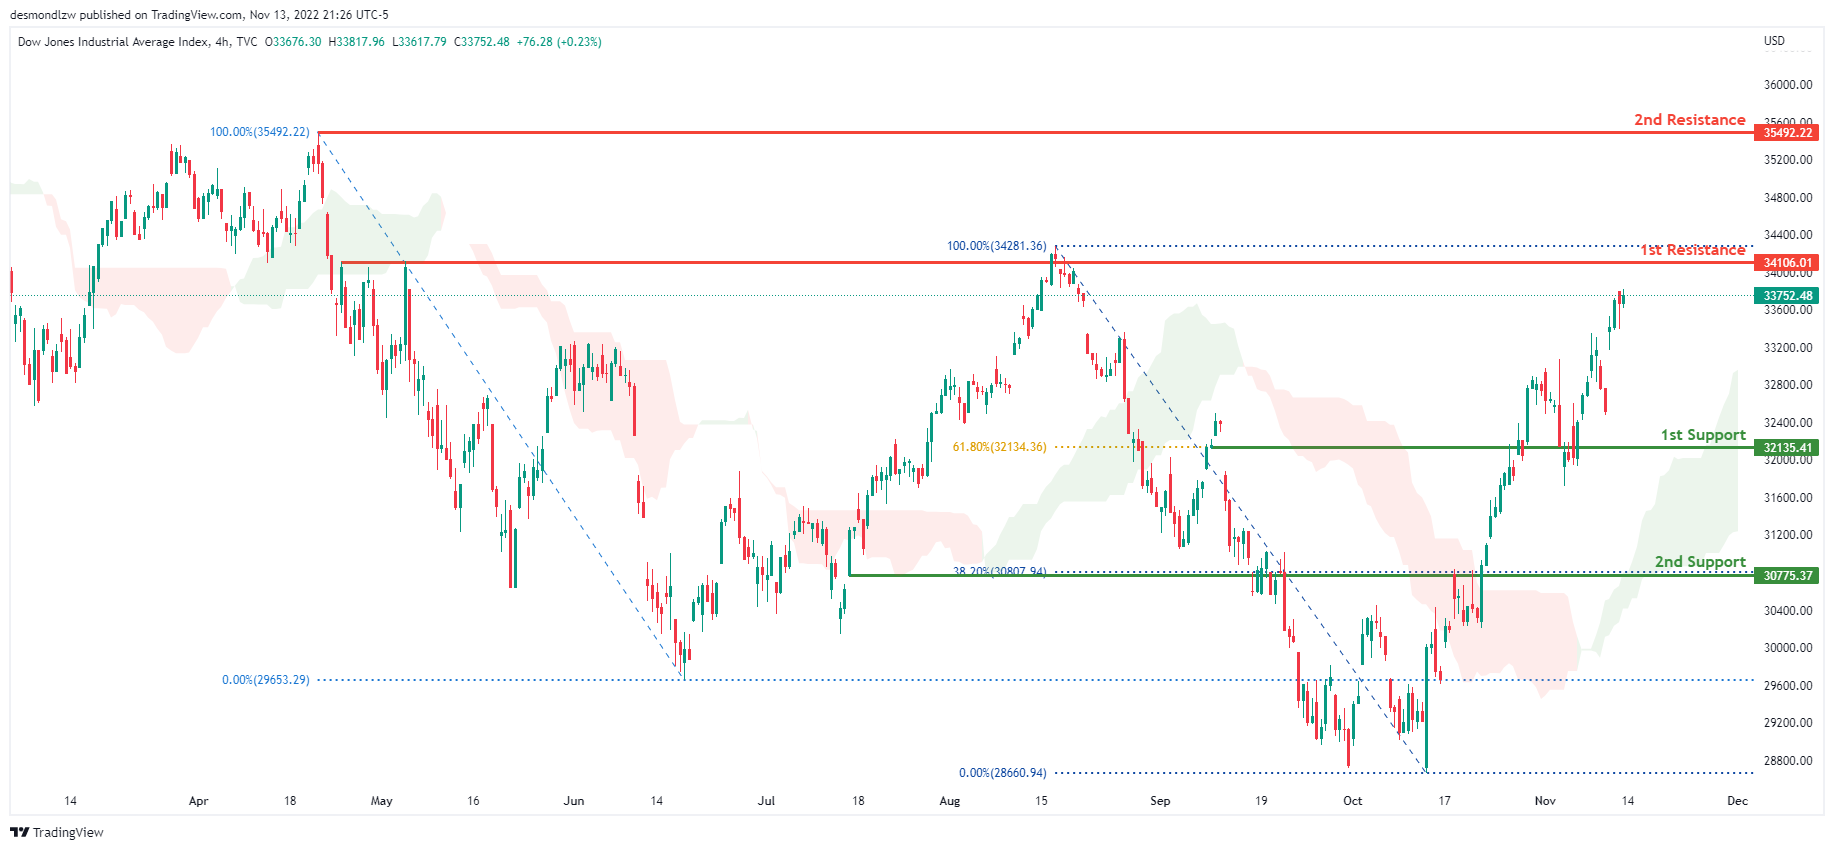
Dow Jones Industrial Average:
On the H4 chart, the overall bias for DJI is bullish. To add confluence to this, the price is above the Ichimoku cloud which indicates a bullish market. If this bullish momentum continues, expect the price to possibly head towards the 1st resistance at 34106.01 where the previous high and 100% Fibonacci line is located. In an alternative scenario, price could head towards the 1st support line at 32135.41, where the 61.8% Fibonacci line is located.
Areas of consideration:
- H4 time frame, 1st support at 32135.41
- H4 time frame, 1st Resistance at 34106.01
DAX:
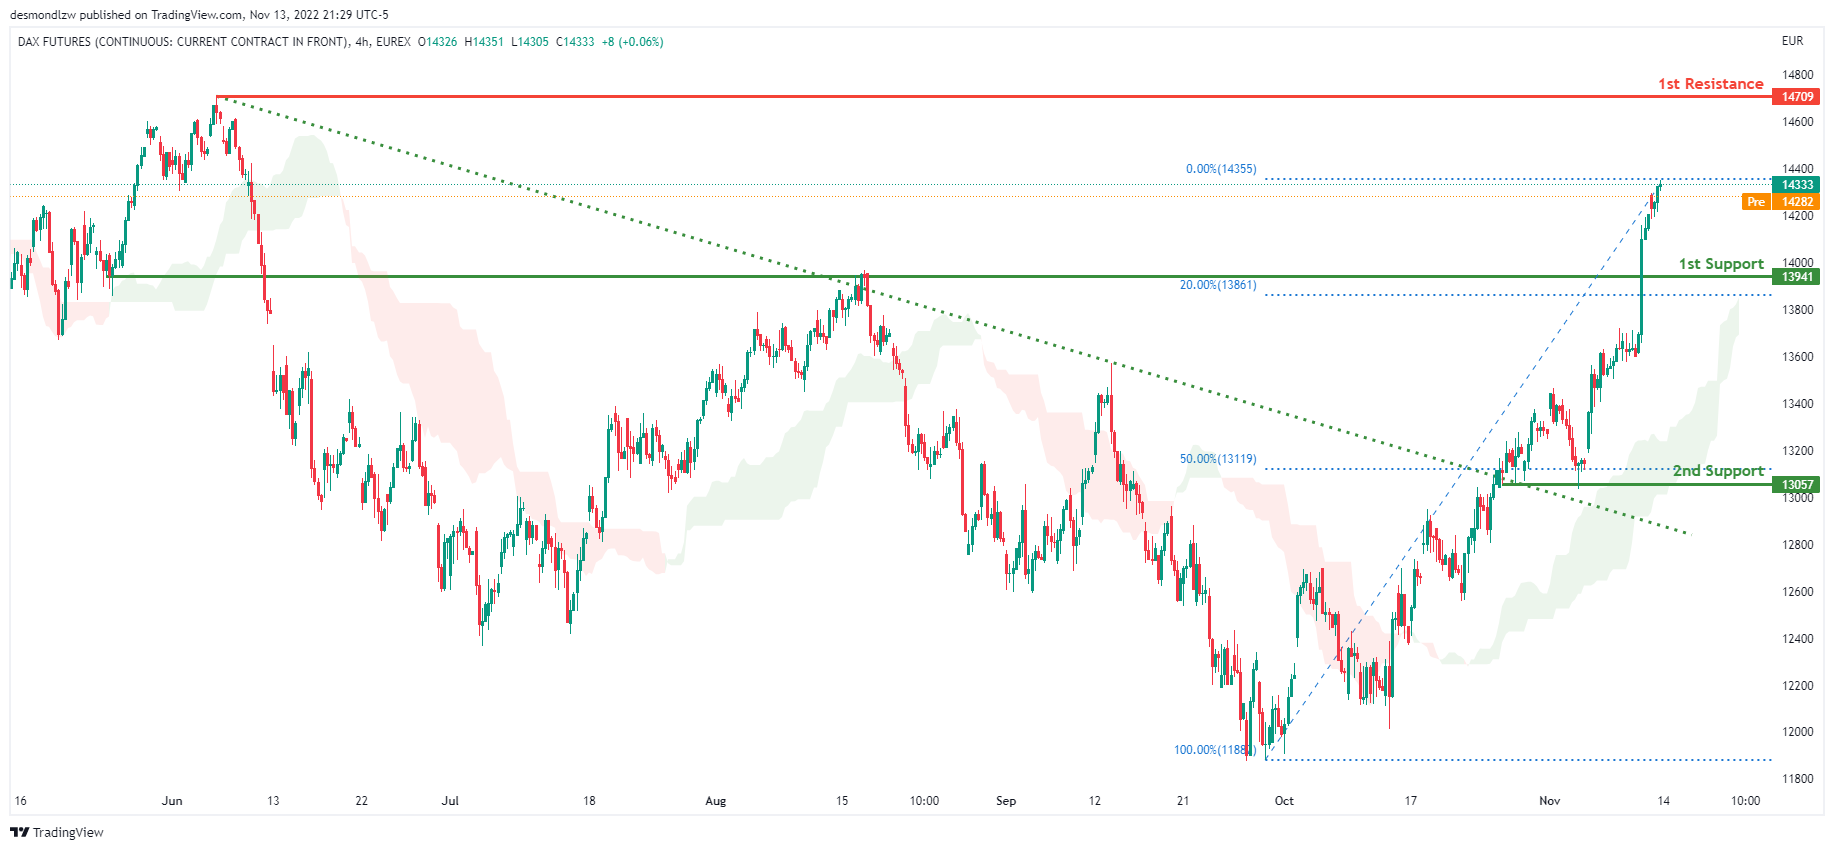
On the H4 chart, the price has broken the descending trendline. Expecting price to possibly continue this bullish momentum and rise to the 1st resistance is at 14709, where previous swing high sits. Alternatively, the price may drop to the 1st support at 13941, which is in line with the 20% Fibonacci line.
Areas of consideration:
- H4 time frame, 1st resistance is at 14709
- H4 time frame, 1st support is at 13941
ETHUSD:
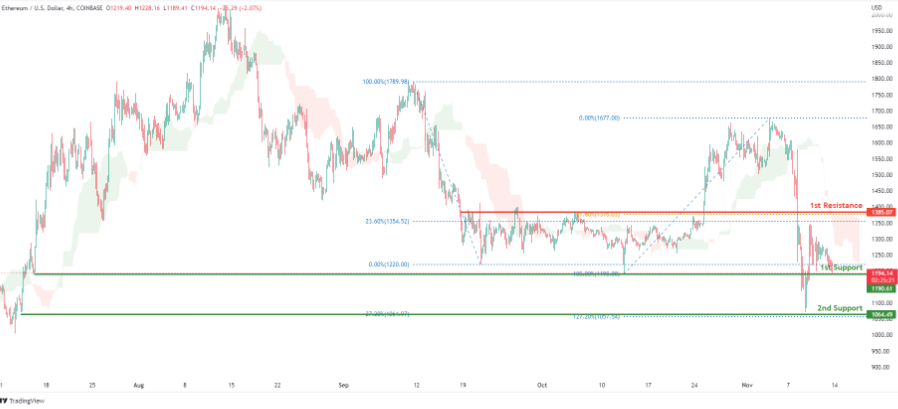
Looking at the H4 chart, the current overall bias for ETHUSD is bearish, with price currently under the Ichimoku cloud indicating a bearish market. Towards the end of last week, the price had huge bullish momentum due to the release of the US CPI being worse than last month and expected. The price is currently trading at 1192.53 at the time of writing. If this bearish momentum continues, expect the price to break the 1st support line at 1190.61 where the previous low and 100% Fibonacci line was located and head towards the 2nd support at 1064.49 where the -27.2% Fibonacci expansion line and 127.2% Fibonacci extension line are located. In an alternative scenario, price could head back up to retest the 1st resistance line at 1385.07, where the 23.6% and 61.8% Fibonacci lines are located.
Areas of consideration:
- H4 time frame, 1st resistance of 1385.07
- H4 time frame, 1st support at 1190.61
- H4 time frame, 2nd support at 1064.49
BTCUSD:
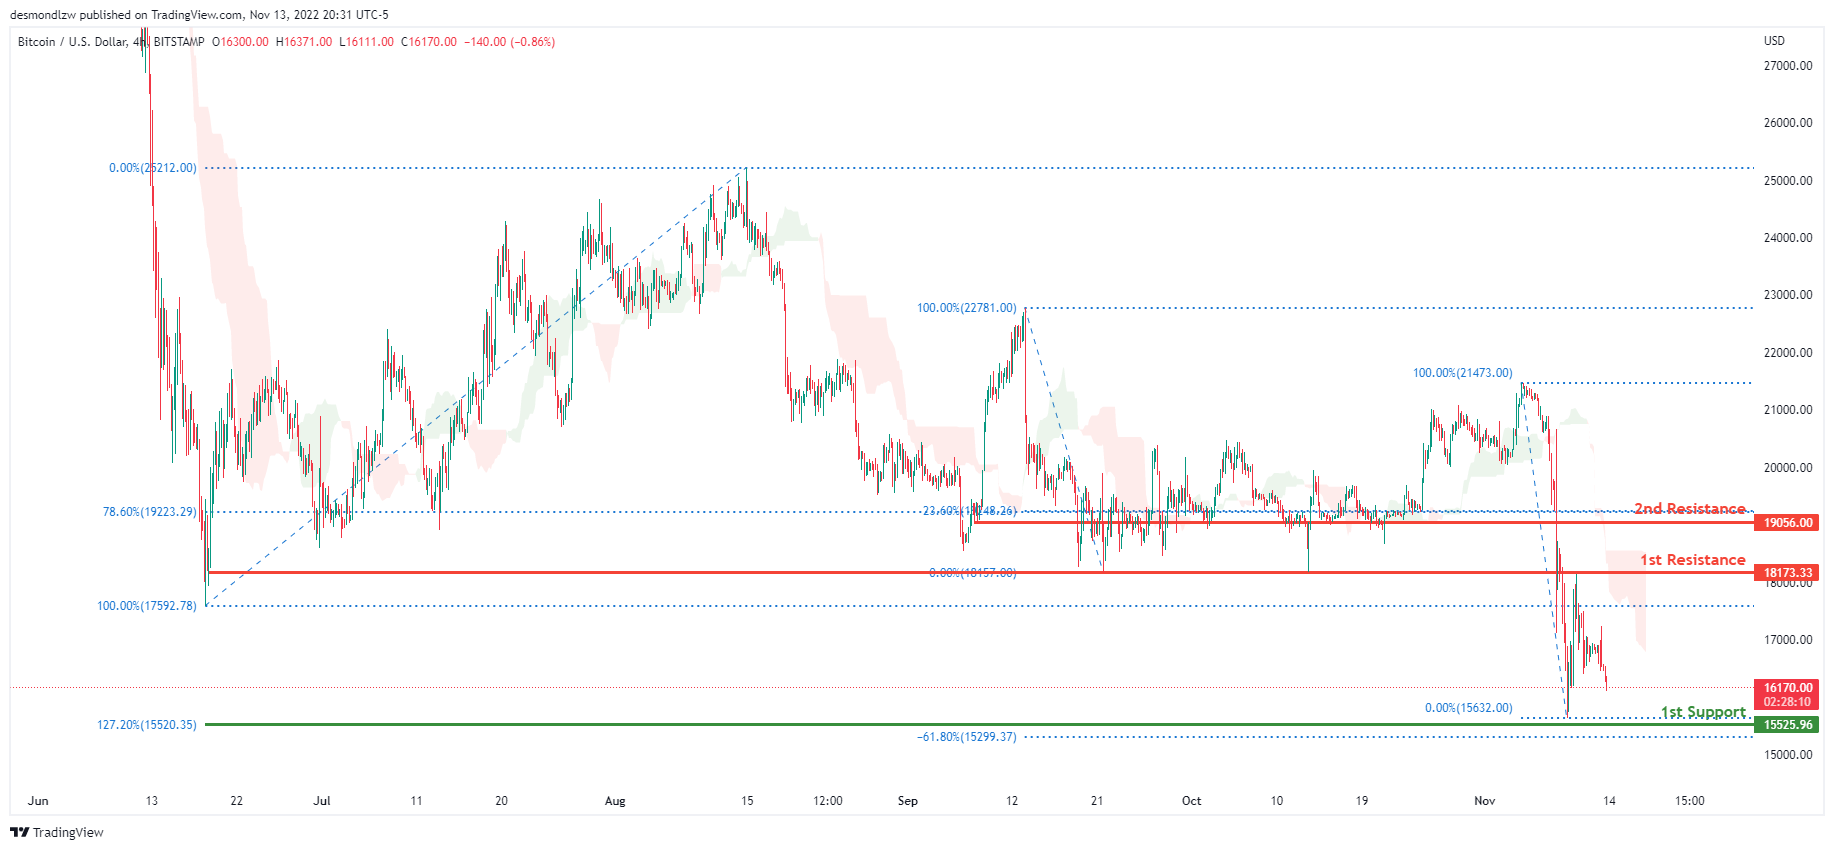
On the H4 chart, the overall bias for BTCUSD is bearish. To add confluence to this, the price is below the Ichimoku cloud which indicates a bearish market. Towards the end of last week,price had huge bullish momentum due to the release of the US CPI being worse than last month and expected with price currently under the 1st resistance line at 18173.33, where the previous low and 0% Fibonacci line is located. Price is currently trading at 16139.00 at time of writing. If this bearish momentum continues, expect the price to head towards the 1st support line at 15525.96, where the 127.2% Fibonacci extension line and -61.8% Fibonacci expansion line is located. In an alternative scenario, price could head back up to retest the 1st resistance line.
Areas of consideration:
- H4 time frame, 1st resistance 18173.33
- H4 time frame, 1st support at 15525.96
S&P 500:
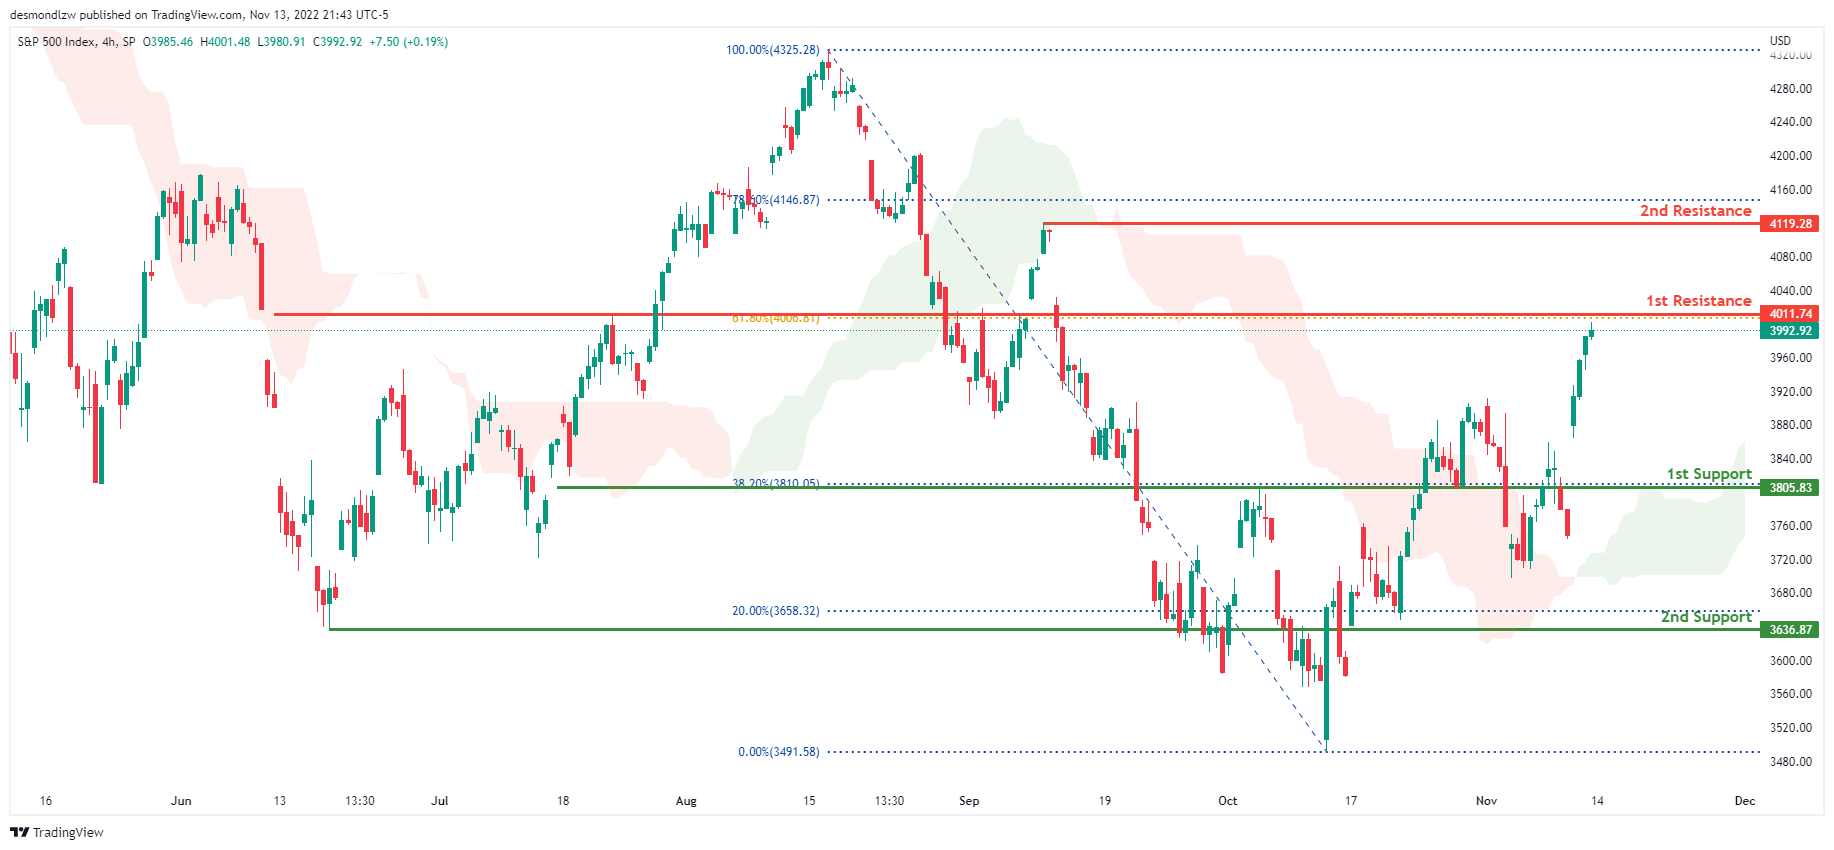
On the H4 chart, the overall bias for S&P500 is bullish with price above the Ichimoku cloud. If bullish momentum continues, expect the price to head up towards the 1st resistance line at 4011.74 where the 61.8% Fibonacci line is located. If this 1st resistance line is broken, the 2nd resistance line is at 4119.28, where the previous swing high and 78.6% Fibonacci line is located. In an alternative scenario, price could possibly head back down towards the 1st support line at 3805.83 where the 38.2% Fibonacci line is located.
Areas of consideration:
- H4 time frame, 1st support at 3805.83
- H4 time frame, 1st resistance at 4011.74
- H4 time frame, 2nd resistance at 4119.28
AUD/USD Daily Report
Daily Pivots: (S1) 0.6618; (P) 0.6667; (R1) 0.6757; More...
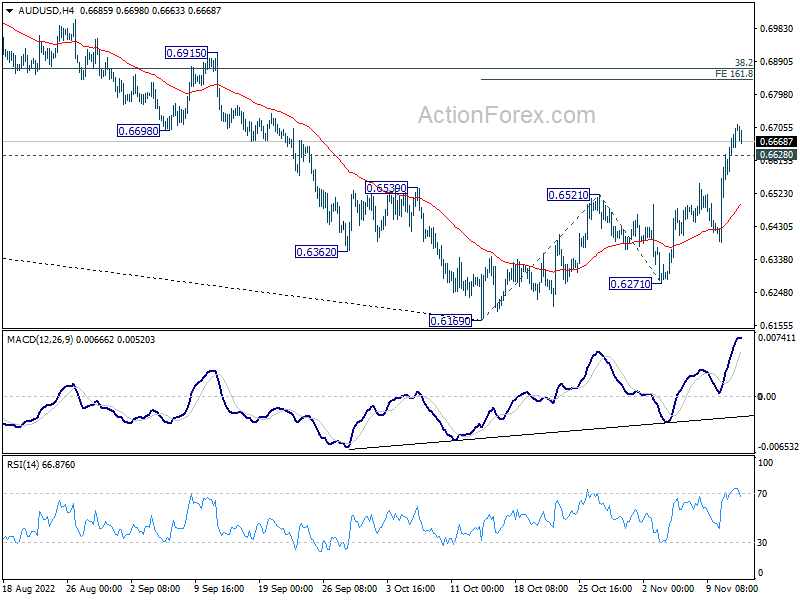
AUD/USD retreats mildly today, but intraday bias stays on the upside. Current rise from 0.6169 would target 161.8% projection of 0.6169 to 0.6521 from 0.6271 at 0.6841. On the downside, below 0.6628 minor support will turn intraday bias neutral and bring consolidations, before staging another rally.
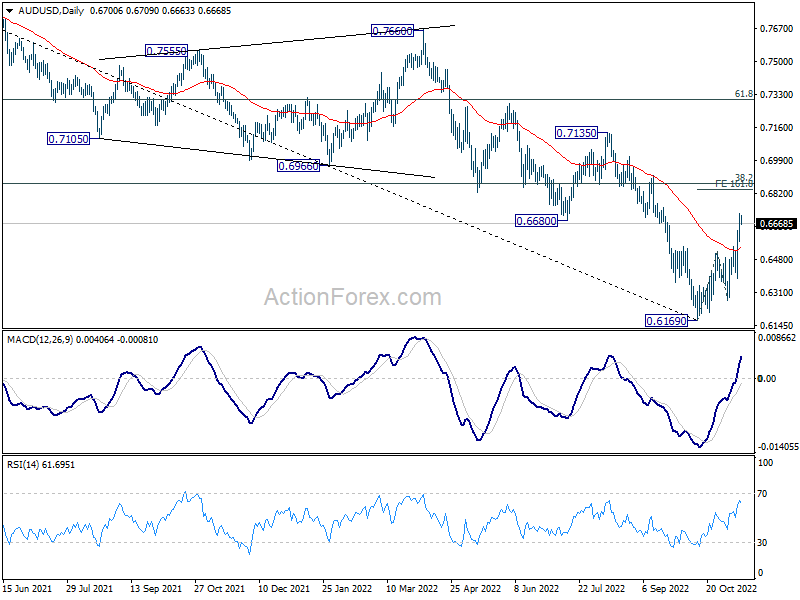
In the bigger picture, the break of 0.6680 support turned resistance confirms medium term bottoming at 0.6169. It's too early to call for trend reversal. But even as a corrective move, rise from 0.6169 should target 38.2% retracement of 0.8006 to 0.6169 at 0.6871. Sustained trading above 55 week EMA (now at 0.6934) will raise the chance of the start of a bullish up trend. This week now remain the favored case as long as 0.6521 resistance turned support holds.
Dollar Licking Wounds in Quiet Trading, EUR/GBP a Focus of the Week
Dollar recovers mildly in quiet trading in Asia, digesting some of last week's losses. Yen and Canadian Dollar are following the greenback, while Swiss Franc leads Europeans lower. But overall, major pairs and crosses are bounded inside Friday's range, suggesting lack of activity. The economic calendar is light today and trading could remain subdued. But lots of important economic data are scheduled for the week, including inflation, retail sales and employment, which are worth attention.
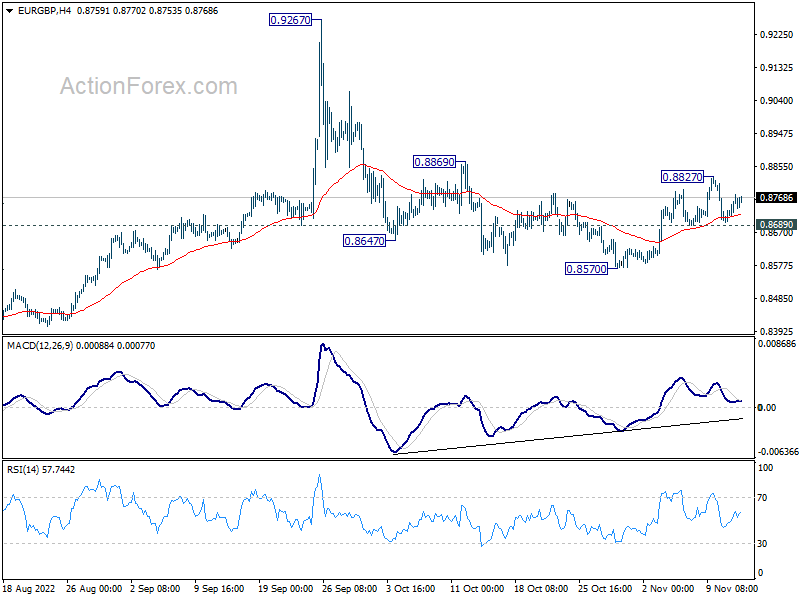
EUR/GBP is a pair to watch this week, considering the the UK government will finally announce a new budget plan on Thursday. Additionally, UK will release a batch of economic data. Technically, the correction form 0.9267 could be considered finalized with three waves down to 0.8570. Break of 0.8827 resistance will affirm this case. Further break of 0.8869 will open up stronger rally back towards 0.9267 high. Yet, break of 0.8689 support will probably extend the correction through 0.8570 instead.
In Asia, at the time of writing, Nikkei is down -0.78%. Hong Kong HSI is up 2.63%. China Shanghai SSE is up 0.47%. Singapore Strait Times is up 1.51%. Japan 10-year JGB yield is up 0.146 at 0.246.
BoJ Kuroda: Should continue with monetary easing
BoJ Governor Haruhiko Kuroda said in a speech that Japan's situation "differs" from both the US and the Eurozone. The country is still "on its way to recovery". Output gap has "remained in negative territory", but projected to "turn positive" as some point in H2 of this fiscal year. Inflation rate "has not risen from the demand side". Current rise in inflation was "led by rise in import prices", and the rate is projected to decline back to below 2% from fiscal 2023.
He reiterated that BoJ "deems that it should continue with monetary easing and thereby firmly support economic activity". By doing so, "it aims to provide a favorable environment for firms to raise wages and to achieve the price stability target in a sustainable and stable manner, accompanied by wage increases."
Regarding exchange rates, Kuroda said the "abnormally one-sided, sharp yen weakening appears to have paused, thanks partly to government's FX intervention." He emphasized it is "important for forex rates to move stably reflecting economic fundamentals".
Fed Waller: Start paying attention to the endpoint, not the pace
Fed Governor Christopher Waller said over the weekend, "we're at a point we can start thinking maybe of going to a slower pace," but "we're not softening".
"Quit paying attention to the pace and start paying attention to where the endpoint is going to be," he urged. "Until we get inflation down, that endpoint is still a ways out there."
Last week's CPI report was "good, finally, that we saw some evidence of inflation starting to come down, but I just cannot stress [enough] this is one data point. We're going to need to see a continued run of this kind of behavior and inflation slowly starting to come down, before we really start thinking about taking our foot off the brakes here," he said.
Inflation, retail sales and job data to watch
More inflation data will be featured this week, including CPI from UK, Canada and Japan, as well ass PPI from US, UK and New Zealand. Additionally, retail sales data from China, US, and UK will be featured. Job data will be released from UK, and Australia. Additionally, RBA will release meeting minutes.
Here are some highlights for the week:
- Monday: Swiss PPI; Eurozone industrial production.
- Tuesday: Japan GDP; RBA minutes; China industrial production, retail sales, fixed asset investment; UK job data; Germany ZEW economic sentiment; Eurozone GDP, employment, trade balance; Canada manufacturing sales, wholesales; US PPI, Empire State manufacturing.
- Wednesday: Japan machine orders, tertiary industry index; Australia wage price index; UK CPI, PPI; Canada housing starts, CPI; US retail sales, industrial production, business inventories, NAHB housing index.
- Thursday: New Zealand PPI; Japan trade balance; Australia employment; Swiss Trade balance; Eurozone CPI final; US jobless claims, Philly Fed survey, building permits and housing starts.
- Friday: Japan CPI; UK Gfk consumer confidence, retail sales; Canada IPPI and RMPI; US existing home sales.
AUD/USD Daily Report
Daily Pivots: (S1) 0.6618; (P) 0.6667; (R1) 0.6757; More...
AUD/USD retreats mildly today, but intraday bias stays on the upside. Current rise from 0.6169 would target 161.8% projection of 0.6169 to 0.6521 from 0.6271 at 0.6841. On the downside, below 0.6628 minor support will turn intraday bias neutral and bring consolidations, before staging another rally.
In the bigger picture, the break of 0.6680 support turned resistance confirms medium term bottoming at 0.6169. It's too early to call for trend reversal. But even as a corrective move, rise from 0.6169 should target 38.2% retracement of 0.8006 to 0.6169 at 0.6871. Sustained trading above 55 week EMA (now at 0.6934) will raise the chance of the start of a bullish up trend. This week now remain the favored case as long as 0.6521 resistance turned support holds.
Economic Indicators Update
| GMT | Ccy | Events | Actual | Forecast | Previous | Revised |
|---|---|---|---|---|---|---|
| 07:30 | CHF | Producer and Import Prices M/M Oct | 0.20% | 0.20% | ||
| 10:00 | EUR | Eurozone Industrial Production M/M Sep | 0.10% | 1.50% |
Fed Waller: Start paying attention to the endpoint, not the pace
Fed Governor Christopher Waller said over the weekend, "we're at a point we can start thinking maybe of going to a slower pace," but "we're not softening".
"Quit paying attention to the pace and start paying attention to where the endpoint is going to be," he urged. "Until we get inflation down, that endpoint is still a ways out there."
Last week's CPI report was "good, finally, that we saw some evidence of inflation starting to come down, but I just cannot stress [enough] this is one data point. We're going to need to see a continued run of this kind of behavior and inflation slowly starting to come down, before we really start thinking about taking our foot off the brakes here," he said.
BoJ Kuroda: Should continue with monetary easing
BoJ Governor Haruhiko Kuroda said in a speech that Japan's situation "differs" from both the US and the Eurozone. The country is still "on its way to recovery". Output gap has "remained in negative territory", but projected to "turn positive" as some point in H2 of this fiscal year. Inflation rate "has not risen from the demand side". Current rise in inflation was "led by rise in import prices", and the rate is projected to decline back to below 2% from fiscal 2023.
He reiterated that BoJ "deems that it should continue with monetary easing and thereby firmly support economic activity". By doing so, "it aims to provide a favorable environment for firms to raise wages and to achieve the price stability target in a sustainable and stable manner, accompanied by wage increases."
Regarding exchange rates, Kuroda said the "abnormally one-sided, sharp yen weakening appears to have paused, thanks partly to government's FX intervention." He emphasized it is "important for forex rates to move stably reflecting economic fundamentals".