Sample Category Title
Gold Inches Below Key Resistance, But Still Shines
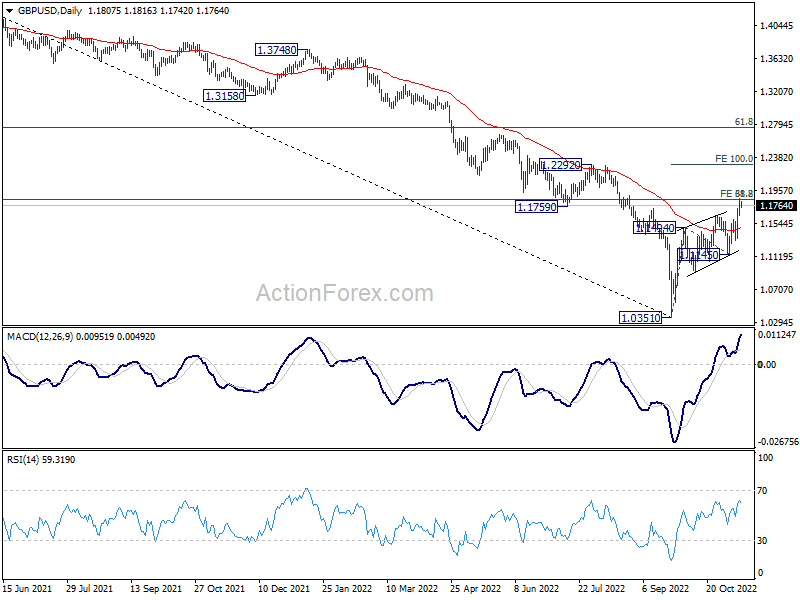
Gold opened with a small negative gap on Monday, pulling back below the August 25 high of 1,765 after stretching its extraordinary rally to a two-and-a-half month high of 1,772 last Friday.
The latest impressive ascent confirmed a triple bottom structure around the 29-month low of 1,614, flagging a bullish trend reversal. Yet, some easing cannot be ruled out in the near term as the RSI and the stochastics seem to be losing momentum near oversold levels.
Should the price reverse lower, Friday’s base of 1,747 could immediately provide some footing. A step below that floor would shift the spotlight to the key 1,730-1,722 area once again, where the 23.6% Fibonacci retracement of the 2,070-1,614 downleg is positioned. Additional declines from here could re-challenge the 1,700 psychological mark ahead of the 20- and 50-day simple moving averages (SMAs) and the important barrier of 1,670.
If the rally resumes above 1,765, the next target could be the 1,788-1,800 zone, formed by the 38.2% Fibonacci level and the 200-day SMA. This is also where the price peaked in August. Therefore, a violation at this point could further power the bullish wave, bringing the 50% Fibonacci of 1,842 next into view.
In summary, gold has the potential for more upside, though the bulls may take a breather after last week’s swift upturn before they continue higher. A break below 1,730-1,722 could raise negative risks.
EURUSD Skyrockets to 3-Month High; Bullish Bias in Near Term
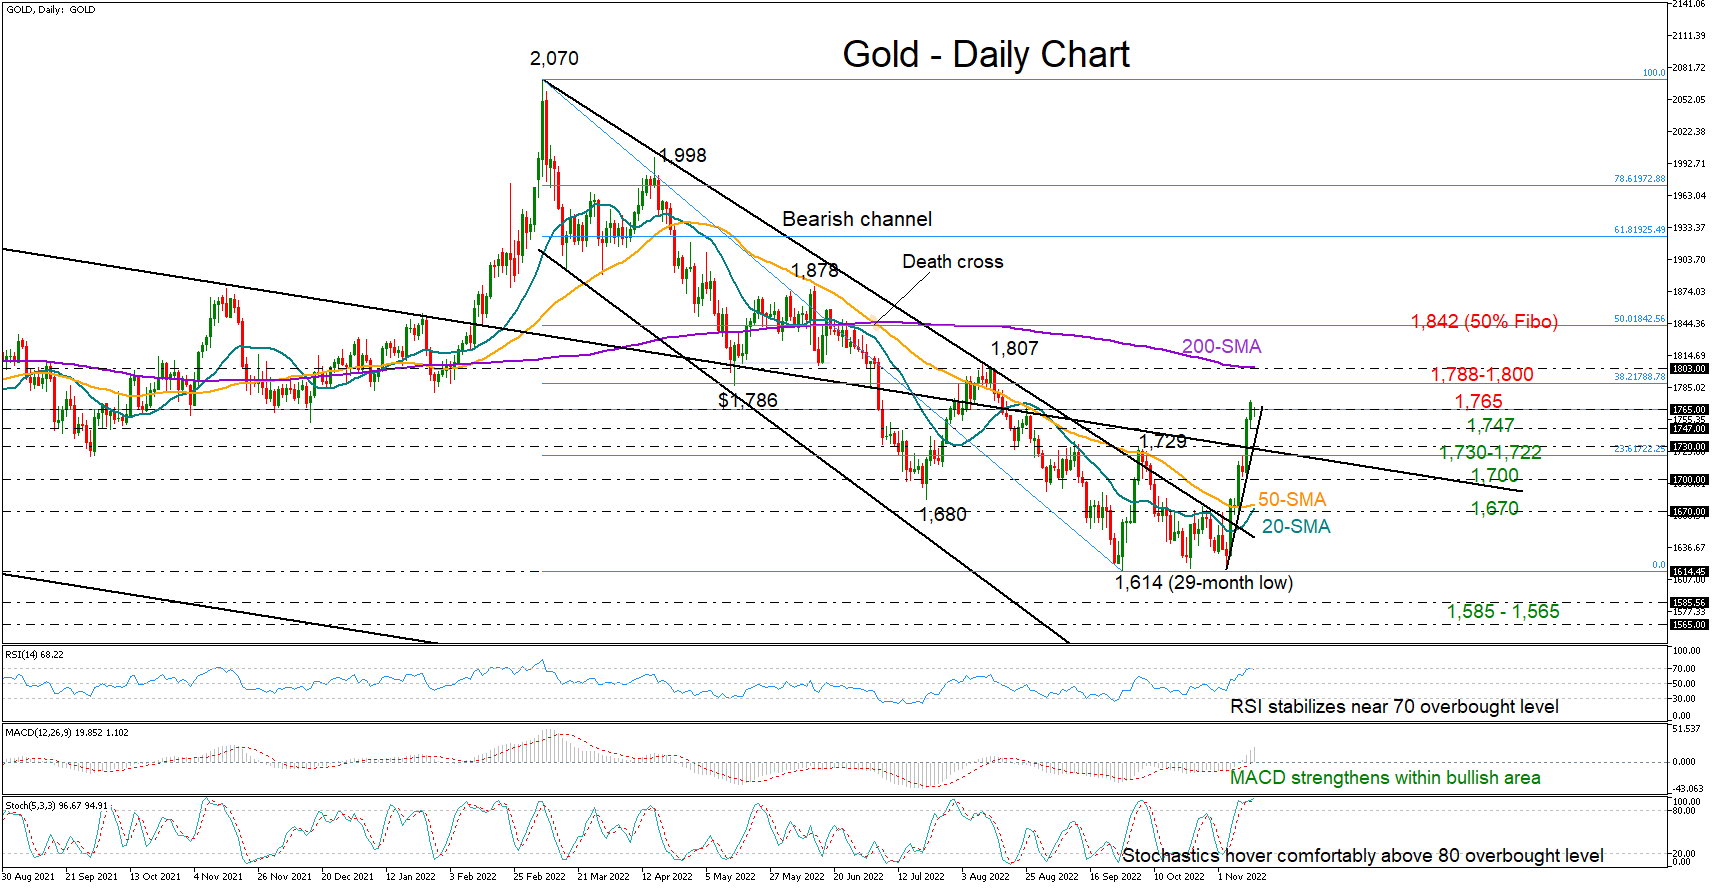
EURUSD advanced sharply to a new three-month high of 1.0363 on Friday, continuing the bullish extension from Thursday’s session following the rebound off the parity level.
The pair has jumped above the long-term descending channel, that was drawn since February, and is moving towards the 200-day simple moving average (SMA). If the market successfully surpassed the aforementioned line, then it may suggest a positive correction in the bigger outlook as well. However, the price is currently retreating with weak momentum, indicating a potential minor bearish move in the near term.
Regarding the technical oscillators, the MACD is strengthening its upside movement above its trigger and zero lines; however, the Relative Strength Index (RSI) touched the 70 region and is ticking slightly lower, suggesting an overbought market and a possible bearish move in the short-term timeframe.
More upside actions could hit the 200-day SMA at 1.0420 ahead of the 1.0620 resistance level, registered back on June 27. Edging higher, the bulls may meet the next resistance hurdles such as 1.0780 and 1.0900, taken from the high on May 30 and the lows on March 14, correspondingly.
On the other hand, a downside reversal may take the price towards the 1.0200 inside swing high from August 17 before meeting the 1.0100 barrier and the 1.0000 psychological mark. A drop lower again could turn the bias back to negative and attract traders’ attention to hit the bullish crossover within the 20- and 50-day SMAs at 0.9875 ahead of the short-term ascending trend line near 0.9820. Breaking this obstacle too, then the pair may re-touch the lows at 0.9630.
All in all, EURUSD is posting an aggressive bullish structure in the near-term and any moves beyond the next key line of the 200-day SMA could endorse this outlook, switching the picture to bullish in the bigger view.
Post-CPI Market Reaction Calls an End to Very Strong Market Trends
Markets
Last Thursday’s US October CPI release still dominates the debates. The relative small downward surprise (headline 0.4% M/M & 7.7% Y/Y; core 0.3% M/M & 6.3% Y/Y) triggered an outsized market reaction. They flipped odds for the outcome of the December Fed policy meeting completely towards 50 bps where FOMC Chair Powell after the November policy meeting still left the door open for a continuation at the 75 bps rhythm. A lot of Fed governors welcomed the inflation number, effectively using the opportunity to slow things down. However, each and every one of them stressed that slowing isn’t the same as stopping. There’s a strong consensus that the policy rate peak in the US will be higher than the 4.5% suggested in the September dot plot.
US Treasuries rallied significantly on Thursday with bond markets closed on Friday for Veteran’s Day. The US 2-yr yield approached the neckline of a double top formation at 4.25%, but a real test didn’t occur. The US 10-yr yield closed the week below a similar technical reference at 3.9%, but is trying to regain this level this morning. US stock markets in a two-day rally gained as much as 9.5% for Nasdaq. The tech index managed to close above the neckline of a triple bottom formation at 4404. The S&P 500 won 7% with the move above the multiple bottom formation at 3908 suggesting that this year’s downtrend could morph into more sideways action going forward. The dollar fell off a cliff. The trade-weighted dollar (DXY) lost the support zone around 109-110, dropping out of this year’s upward trend channel to currently change hands at 106.85. The key and next reference is 104.64. The same pattern is visible in EUR/USD with the pair in no time leapfrogging all intermediate resistance to arrive at the big one: 1.0341 (2017 bottom/1.0350 (May low)/1.0368 (August high). Recall that the pair traded around 0.9950 ahead of the CPI release.
The post-CPI market reaction calls an end to very strong market trends (firmer USD, weaker stocks, weaker bonds) with more choppy action ahead. The narrative changed in the sense that the call for ever faster and ever more in the tightening cycle is over. The bigger risk is to overinterpret it as a sudden stop. From a momentum point of view, lack of important US eco data ahead of the key December releases, the confirmed Democratic Senate victory and the illiquid Thanksgiving weekend suggest markets could hold on to their corrective stance for a while. Today’s eco calendar in any case is empty apart from outdated EMU production numbers and speeches by some ECB governors. We retain from weekend comments that ECB governing council member de Cos made an opening to start running down the APP portfolio already in December rather than early 2023.
News Headlines
Bloomberg reports on a notice from the People’s Bank of China (PBOC) and Chinese financial regulators about a 16-point plan to support the real estate market. The plan contains a wide range of measures to support liquidity and financing for the sector, including debt extensions and easing of down-payment rules for home buyers. The headlines on the real estate support plan are supporting Chinese equity markets this morning.
In his weekly column published in the Mlada Fronta Dnes Newspaper, Czech central bank governor Michl said that nominal growth in Czech salaries should be capped at 5% next year to avoid a price wage spiral. The CNB governor also reiterated that in order to slow inflation, lower budget deficits and stable rates are necessary.
UK Q3 GDP growth came in at -0.2% Q/Q and 2.4% Y/Y last Friday. It was the first negative quarterly reading for UK growth since the first quarter of 2021. The contraction was due to a quarterly decline in private consumption (-0.5% Q/Q). Gross fixed capital formation (2.5% Q/Q), government spending (1.3%) and net-exports still supported global demand. The quarterly figure was slightly better than expected, but an unexpected sharp decline of the monthly figure of September (-0.6%) suggests further headwinds for the UK economy in the final quarter of the year.
GBP/JPY Daily Outlook
Daily Pivots: (S1) 162.82; (P) 164.46; (R1) 165.86; More...
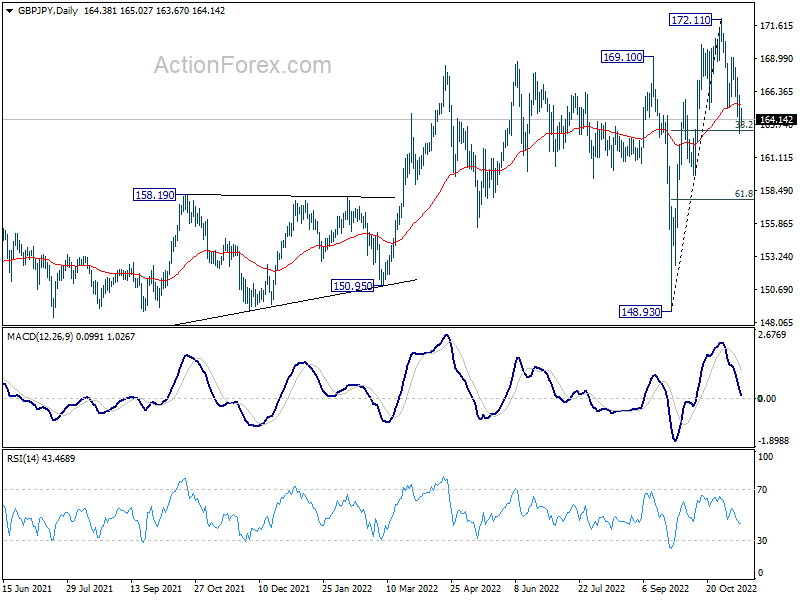
Intraday bias in GBP/JPY remains neutral first. Strong rebound from current level, followed by break of 166.06 minor support will turn bias back to the upside for retesting 172.11 high. However, sustained trading below 38.2% retracement of 148.93 to 172.11 at 163.25 will bring deeper decline to 61.8% retracement at 157.78 and possibly below.
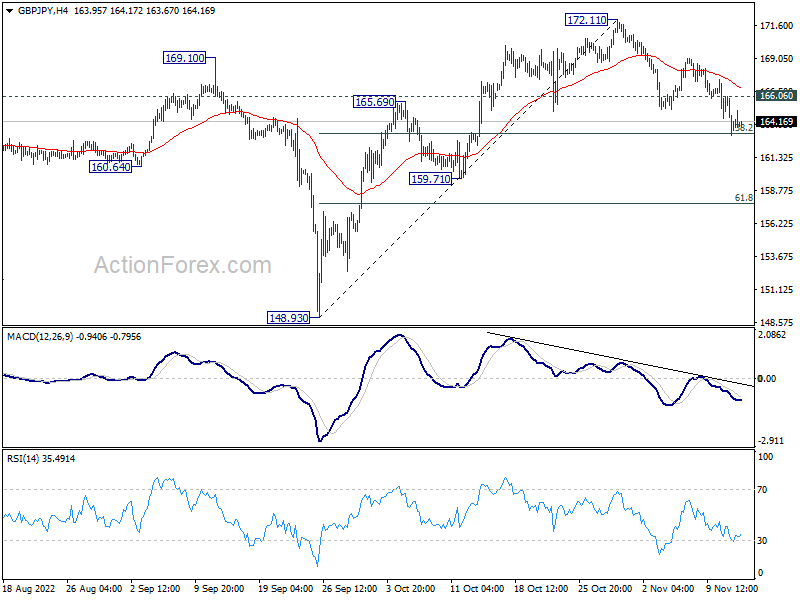
In the bigger picture, there is no clear sign of medium term topping yet. Up trend from 123.94 (2020 low) could still resume through 172.11 high at a later stage. However, firm break of 159.71 support will argue that it's already in correction to the up trend from 123.94, and deeper decline would be seen back towards 148.93 support.
EUR/JPY Daily Outlook
Daily Pivots: (S1) 142.50; (P) 143.76; (R1) 144.96; More....
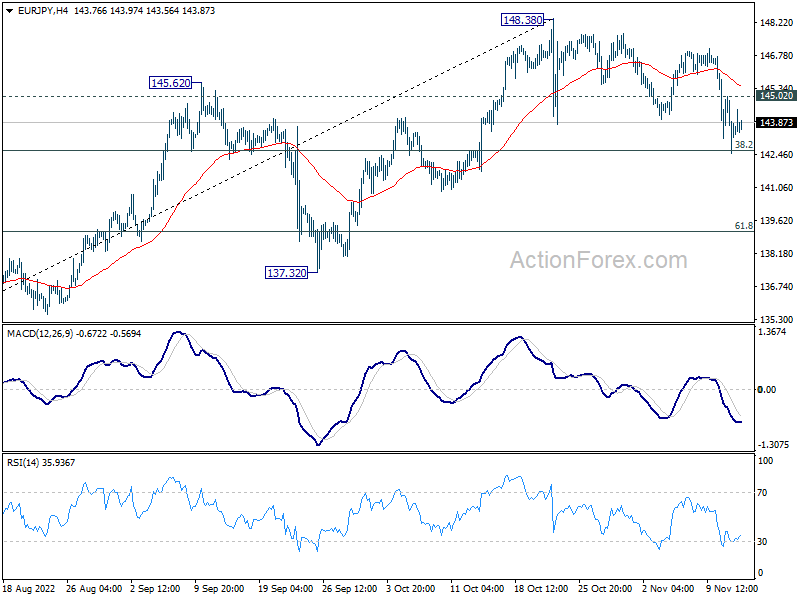
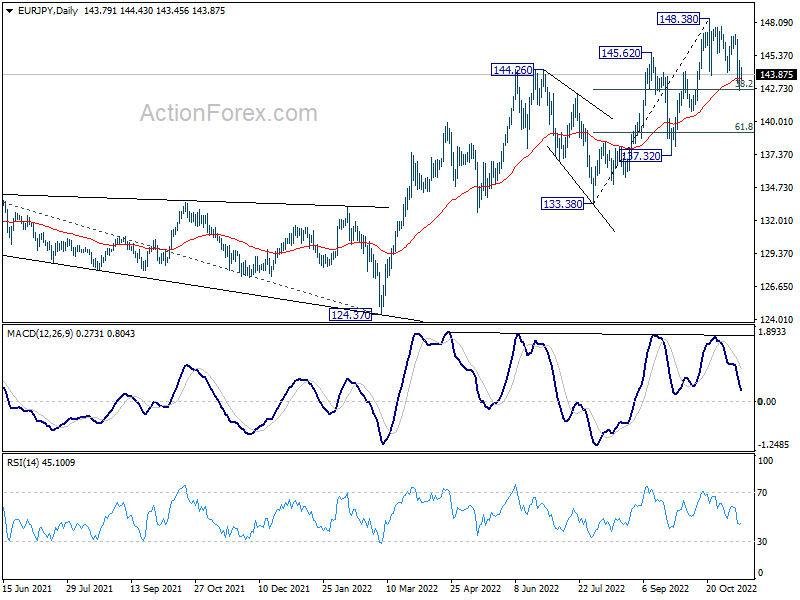
Intraday bias in EUR/JPY remains neutral first, as it's drawing support from 55 day EMA (now at 143.55). Strong rebound from current level, followed by break of 145.02 minor resistance will turn intraday bias back to the upside for retesting 148.38 high. However, sustained break of 38.2% retracement of 133.38 to 148.38 at 142.65 will bring deeper fall to 61.8% retracement at 139.11 and possibly below.
In the bigger picture, there is no clear sign of medium term topping yet. Up trend from 114.42 (2020 low) could still resume through1 48.38 to 149.76 (2014 high). However, break of 137.32 support argue that a medium term correction has already started to correct the whole up trend from 144.42.
EUR/GBP Daily Outlook
Daily Pivots: (S1) 0.8711; (P) 0.8744; (R1) 0.8784; More...
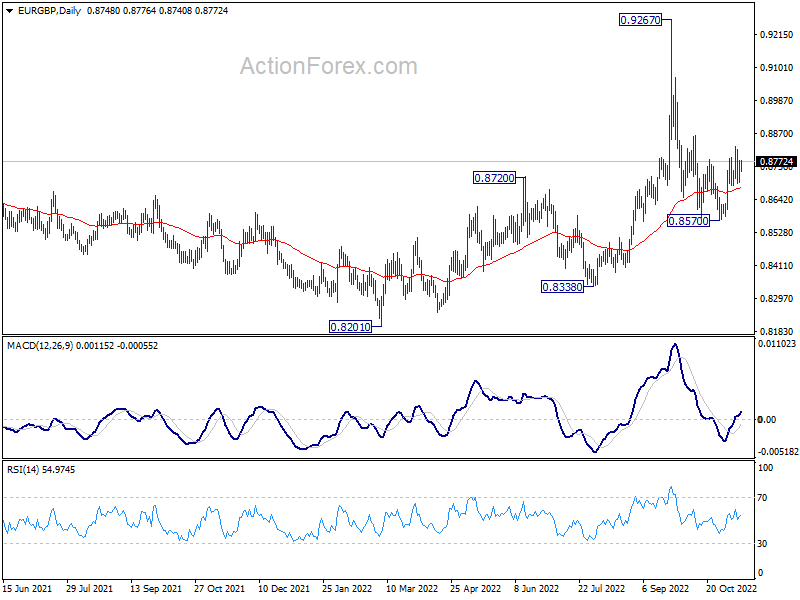
Intraday bias in EUR/GBP remains neutral for the moment. On the upside, break of 0.8827 will resume the rise from 0.8570 to 0.8869. Sustained break there will pave the way back to retest 0.9267 high. On the downside, below 0.8689 minor support will turn bias back to the downside for 0.8570 instead.
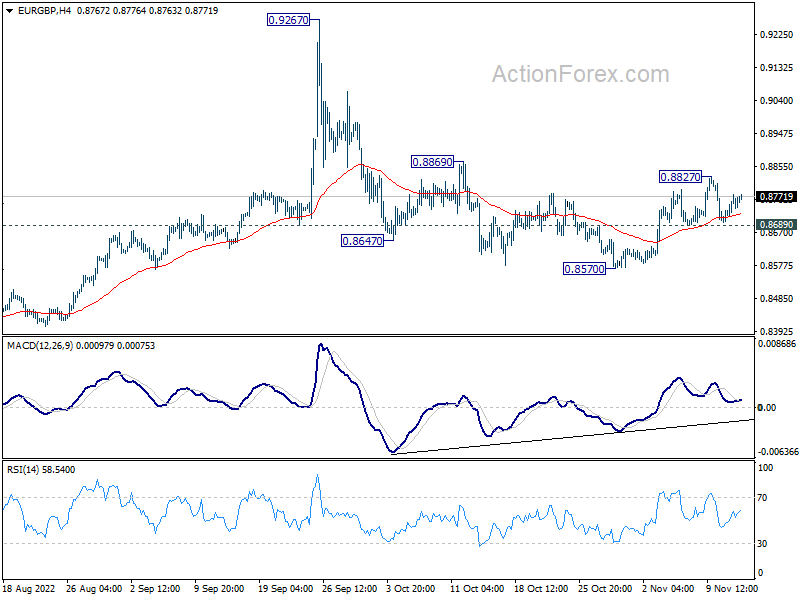
In the bigger picture, current development suggests that fall from 0.9267 is a down leg inside long term range pattern. Deeper fall could be seen towards 0.8201/8338 support zone. But strong support should be seen there to bring reversal. Nevertheless, firm break of 0.8869 resistance will turn favor to the case that such decline is merely a correction in the up trend from 0.8201. That is, further rally would be seen at a later stage through 0.9267.
EUR/AUD Daily Outlook
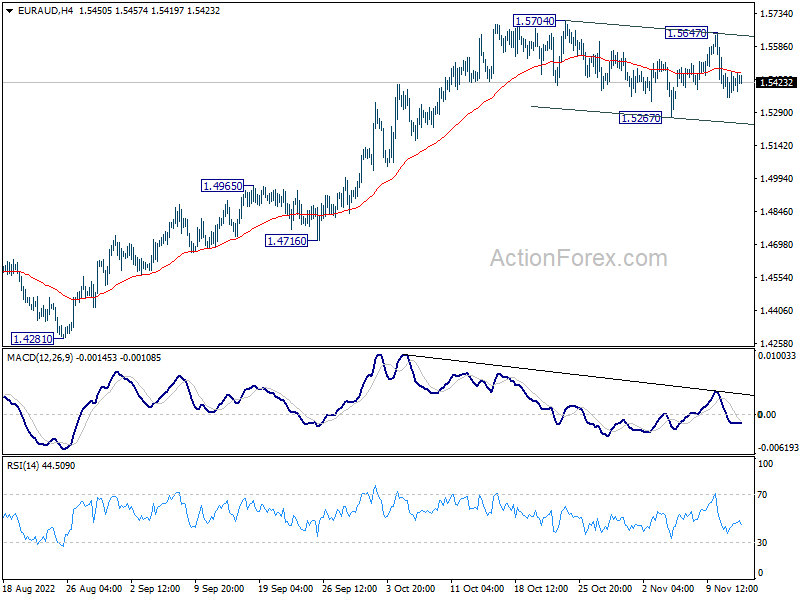
Daily Pivots: (S1) 1.5373; (P) 1.5425; (R1) 1.5489; More...
EUR/AUD is staying in consolidation from 1.5704 and intraday bias remains neutral. In case of deeper retreat, downside should be contained by 55 day EMA (now at 1.5244) to bring rebound. On the upside, break of 1.5704 will resume larger rise from 1.4281. However, sustained trading below 55 day EMA will bring deeper correction towards 1.4965 resistance turned support.
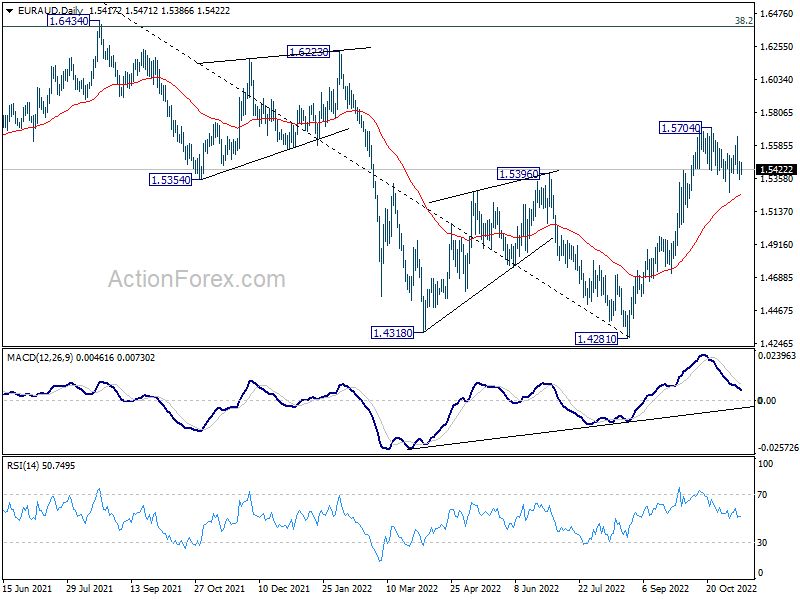
In the bigger picture, a medium term bottom should be in place at 1.4281, on bullish convergence condition in daily MACD. Further rise would be seen back to 1.6434 key resistance next. Break of 1.4965 resistance turned support is needed to indicate reversal. Otherwise, further rally will remain in favor.
EUR/CHF Daily Outlook
Daily Pivots: (S1) 0.9693; (P) 0.9784; (R1) 0.9836; More....
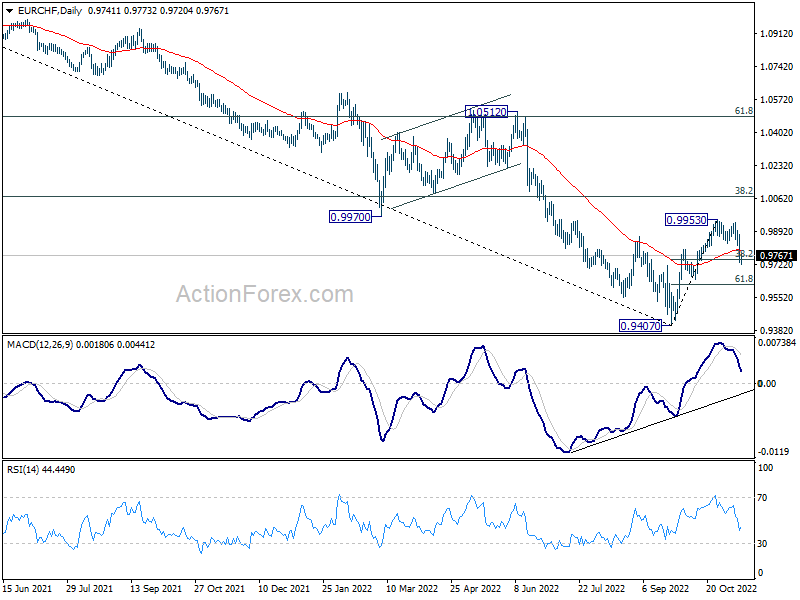
Intraday bias in EUR/CHF remains on the downside for the moment. Sustained break of 38.2% retracement of 0.8407 to 0.9953 will pave the way to 61.8% retracement a 0.9616, and possibly below. On the upside, though, above 0.9818 support turned resistance will turn intraday bias neutral first.
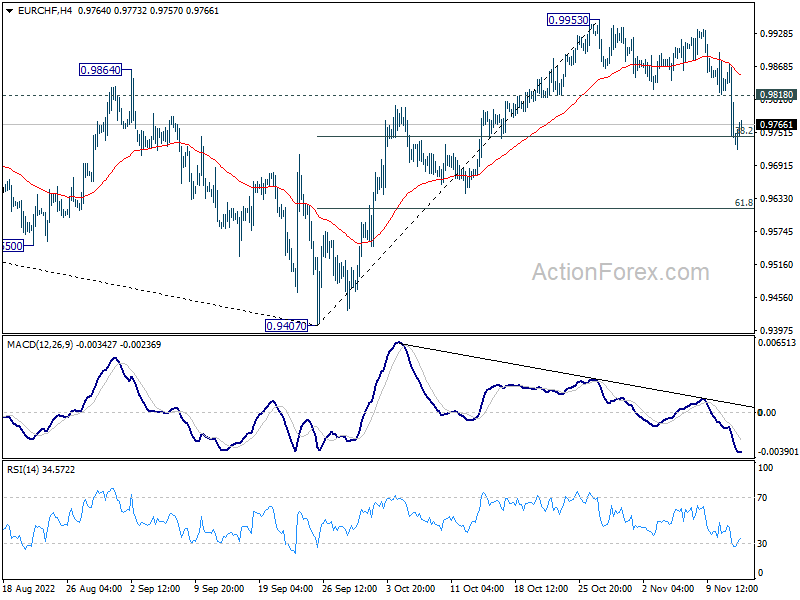
In the bigger picture, rejection by 0.9970 support turned resistance retains medium term bearishness. That is, while 0.9407 is a medium term bottom, price actions from there would develope into a corrective pattern rather than a reversal. That is, down trend resumption through 0.9407 is favored at a later stage. This will remain the favored case now, as long 38.2% retracement of 1.1149 to 0.9407 at 1.0072 holds.
EUR/USD Daily Outlook
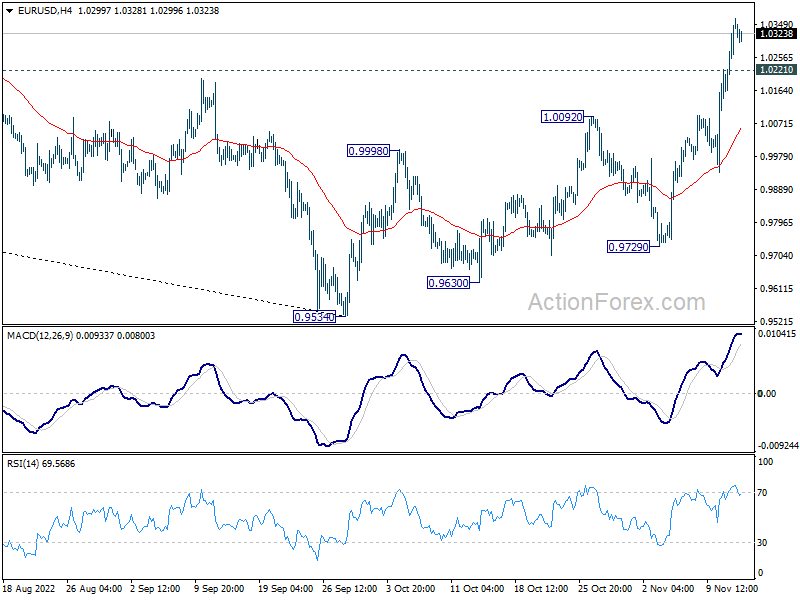
Daily Pivots: (S1) 1.0224; (P) 1.0294; (R1) 1.0425; More...
Intraday bias in EUR/USD remains on the upside at this point. Current rally should target 1.0609 fibonacci level next. On the downside, below 1.0221 minor support will turn intraday bias neutral and bring consolidations first, before staging another rally.
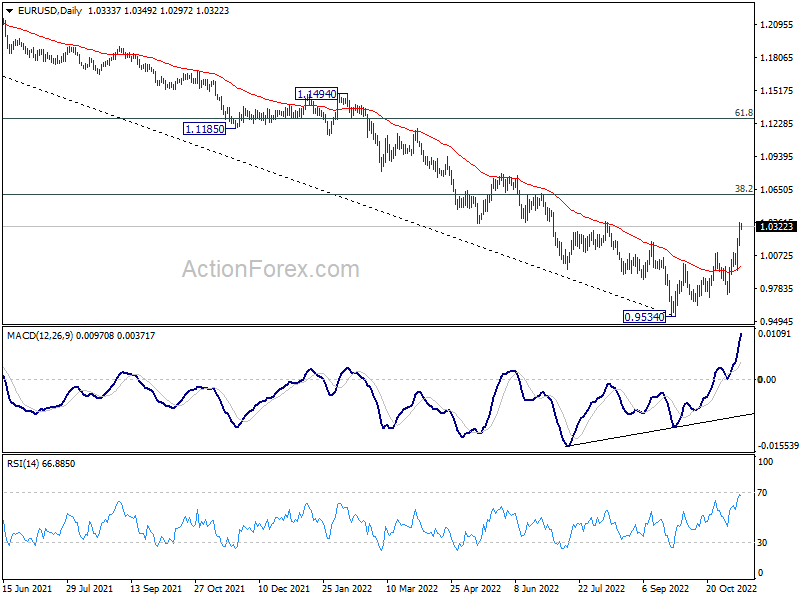
In the bigger picture, a medium term bottom was in place at 0.9534, on bullish convergence condition in daily MACD. Even as a corrective rise, rally from 0.9534 should target 38.2% retracement of 1.2348 (2021 high) to 0.9534 at 1.0609. Sustained trading above 55 week EMA (now at 1.0566) will raise the chance of trend reversal and target 61.8% retracement at 1.1273. This will now remain the favored case as long as 1.0092 resistance turned support holds.
GBP/USD Daily Outlook
Daily Pivots: (S1) 1.1703; (P) 1.1779; (R1) 1.1911; More...
Intraday bias in GBP/USD stays on the upside at this point. Firm break of 61.8% projection of 1.0351 to 1.1494 from 1.1145 at 1.1851 will pave the way to 100% projection at 1.2288. On the downside, below 1.1646 minor support will turn intraday bias neutral and bring consolidation first.
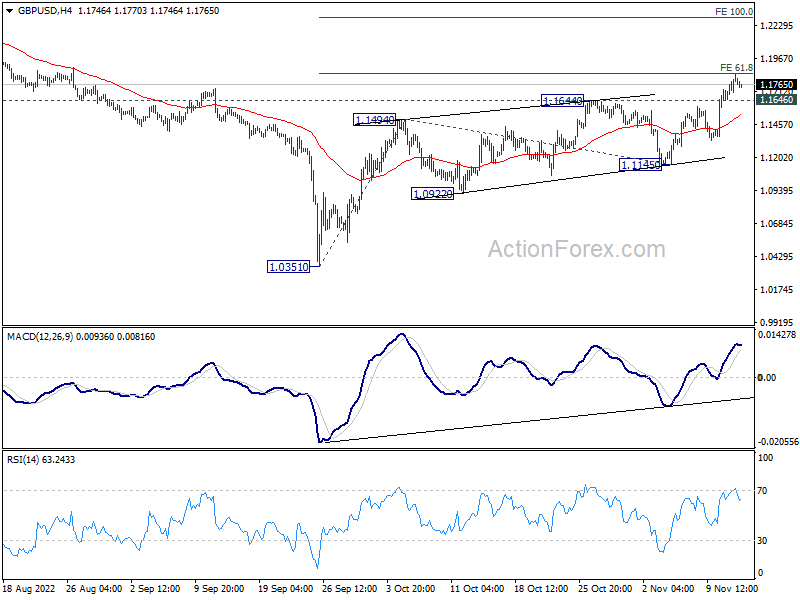
In the bigger picture, current development suggests that rise from 1.0351 is a medium term bottom. Rise from there is at least correcting whole down trend from 1.4248 (2021 high). Further rise is expected as long as 1.1145 support holds. Sustained break of 38.2% retracement of 1.4248 to 1.0351 at 1.1840 will pave the way to 61.8% retracement at 1.2759 and possibly above.