Sample Category Title
USDCAD Confirms Bearish Trend Reversal
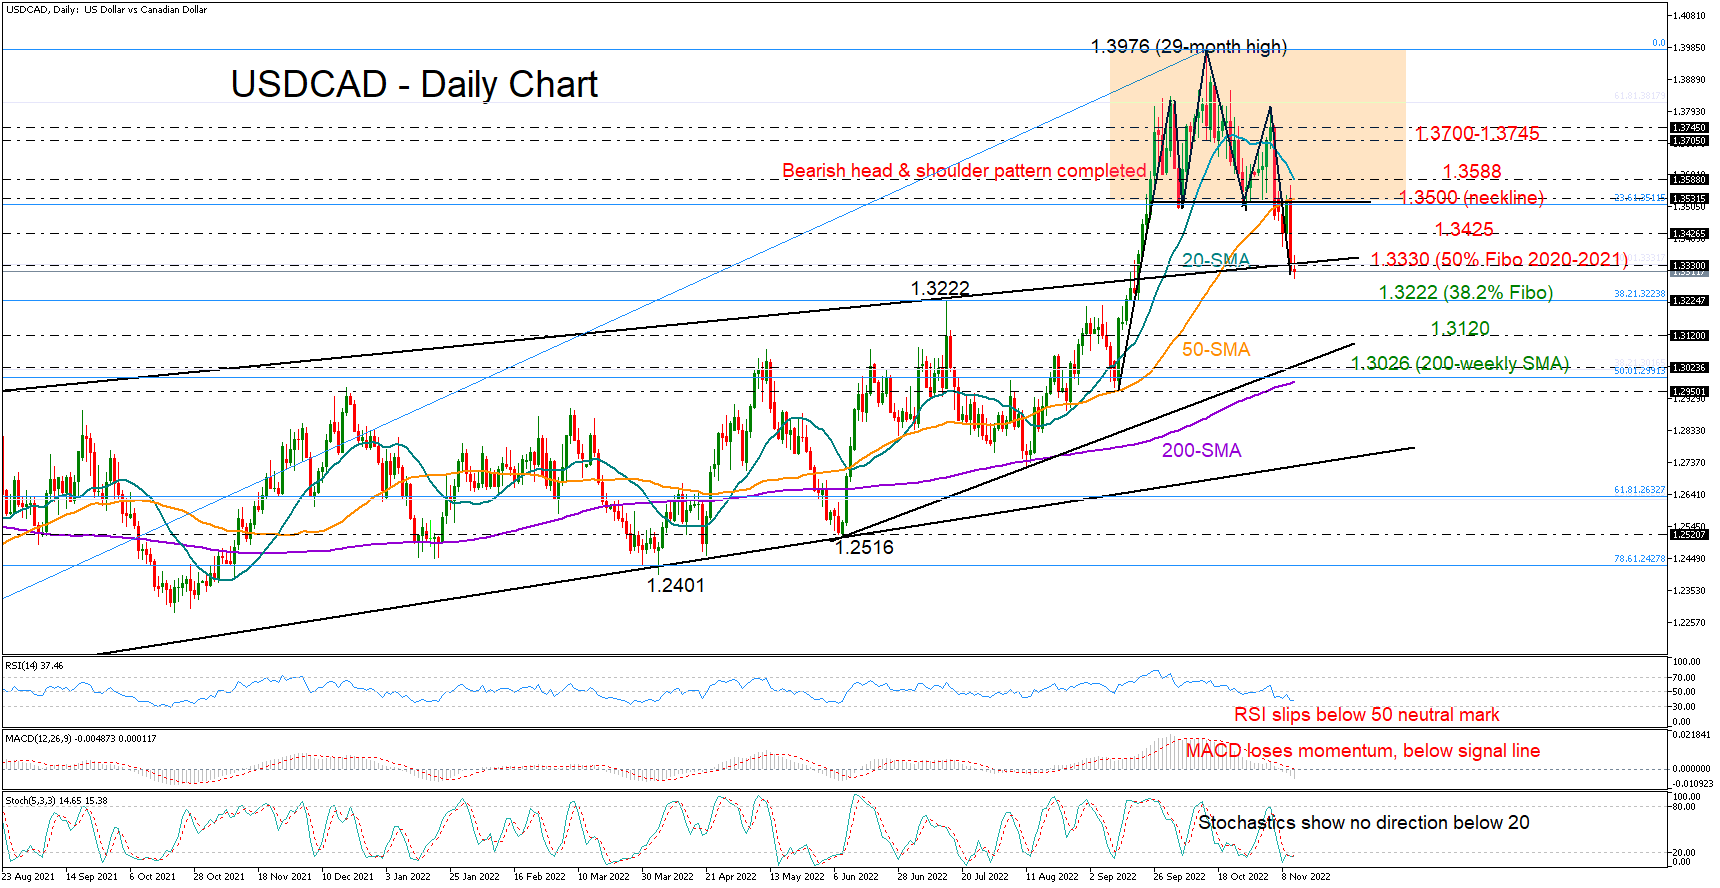
USDCAD completed a bearish head and shoulders structure following the rejection near the 50-day simple moving average (SMA) and the crash below the 1.3500 neckline on Thursday.
The price marked a new two-month low of 1.3291 on Friday, stretching its losses below the crucial long-term resistance line and the 50% Fibonacci retracement of the 2020-2021 steep downtrend at 1.3330.
Despite the freefall, the technical oscillators signal that the sell-off is not over yet. Particularly, with the MACD gaining extra negative momentum within the bearish area and the RSI pointing downwards below its 50 neutral mark, the odds are favouring the bears. Also, the latter has yet to reach its 30 oversold level, while the stochastics, although below 20, show no clear trajectory.
If the bearish scenario unveils, the next stop could be around the 1.3222 level, where July’s and September’s bullish actions peaked. The 38.2% Fibonacci retracement of the 1.2006–1.3976 uptrend is positioned in the same location. Crossing below that base, the price may seek shelter near the 1.3120 barrier before testing the key 1.3026–1.3000 region. The latter may attract extra attention as the tentative support trendline from June, the 50% Fibonacci, and the 200-weekly SMA all align here. Note that the 200-day SMA is also approaching that zone.
In case the dollar rebounds back above 1.3330, it may aggressively drive towards the 1.3500 neckline and the 50-day SMA, unless the 1.3425 support turns resistance. A decisive close above the 20-day SMA at 1.3588 may produce another bullish extension to 1.3700–1.3745.
All in all, USDCAD is in a bearish situation, flagging a downward trend reversal and more losses ahead. Another negative extension and, more importantly, a break below 1.3222 would downgrade the bullish medium-term outlook to neutral.
USDJPY: Consolidation after Strong Fall on Thursday Likely to Precede Further Weakness
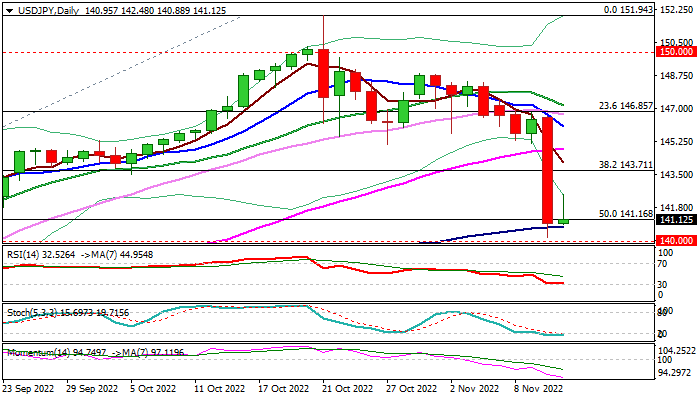
The USDJPY is consolidating in early Friday after suffering heavy losses on Thursday, when the pair was down 550 pips (3.8%) in the biggest one day drop since 1998.
The dollar was hit strongly by cooler than expected US Oct CPI data which suggest that inflation may have peaked, and the Fed could start easing its aggressive policy tightening.
Additional pressure on greenback could be expected from decision of Chinese health authorities to ease some of tough Covid restrictions, which would improve the risk sentiment.
Thursday’s strong bearish acceleration further weakened near-term structure on dip below 50% retracement of 130.39/151.94 upleg and penetration deep into thick daily cloud (spanned between 143.30 and 138.14).
Bears faced headwinds on approach to psychological 140 support and were contained by 100DMA (140.78), with a breather at this zone likely to precede fresh push lower and upticks on a partial profit-taking to provide better levels to re-enter bearish market.
Daily studies in negative configuration (rising bearish momentum / multiple bear-crosses of 5,10,20,30 DMA’s) support the action, as bears look for repeated close below 50% retracement (141.16) to confirm break and open way for attack at psychological 140 support, loss of which would unmask next key levels at 138.62/14 (Fibo 61.8% of 130.39/151.94 / daily cloud base).
Thursday’s massive bearish daily candle weighs heavily, along with large weekly candle (the pair is on track for a weekly drop of around 4%).
Daily cloud top (143.30) should ideally cap the action, with extended upticks to stay under broken daily Tenkan-sen (144.51) to keep bears intact.
Res: 142.48; 143.30; 144.51; 145.31.
Sup: 140.78; 140.00; 138.62; 138.14.
GBP/JPY Daily Outlook
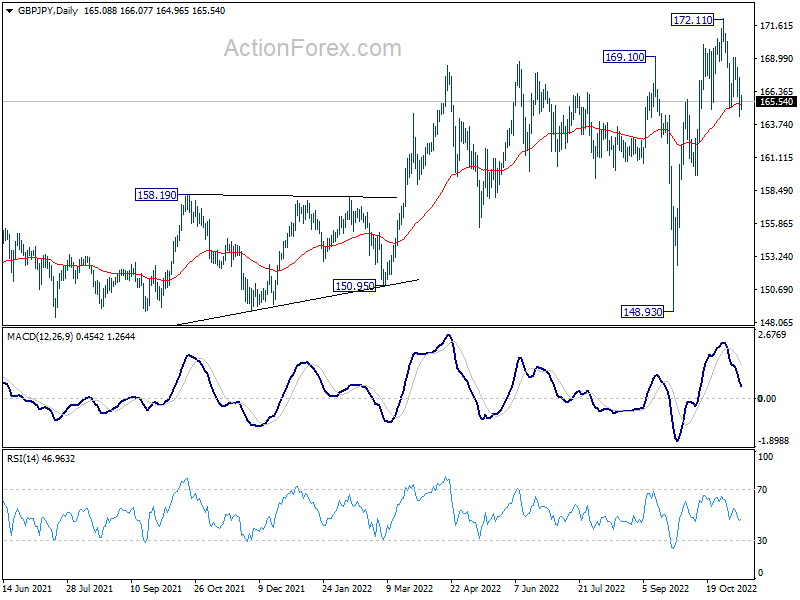
Daily Pivots: (S1) 163.87; (P) 165.66; (R1) 166.94; More...
Intraday bias in GBP/JPY stays neutral first. Strong rebound from 55 day EMA (now at 165.37) will retain near term bullishness. Break of 169.06 minor resistance will bring retest of 172.11 high first. However, sustained break of 55 day EMA will raise the chance of larger scale correction, and target 159.71 support and below.
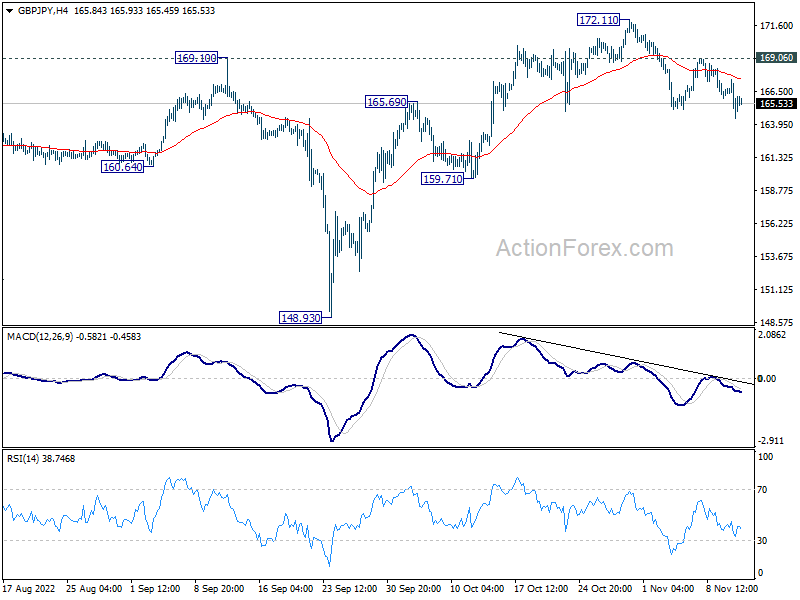
In the bigger picture, up trend from 123.94 (2020 low), as part of the trend from 122.75 (2016 low) is still in progress. Further rise would be seen to 161.8% projection of 122.75 to 156.59 (2018 high) from 123.94 at 178.69. This will now remain the favored case as long as 159.71 support holds.
EUR/JPY Daily Outlook
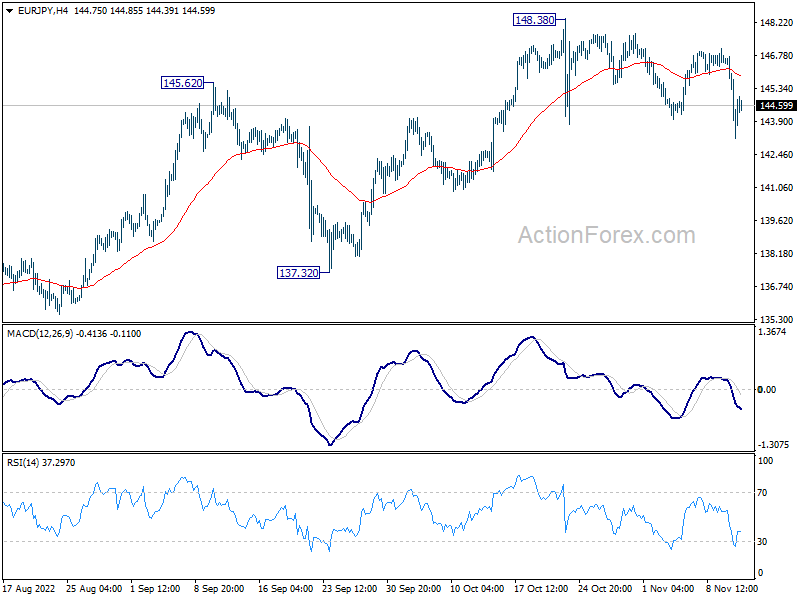
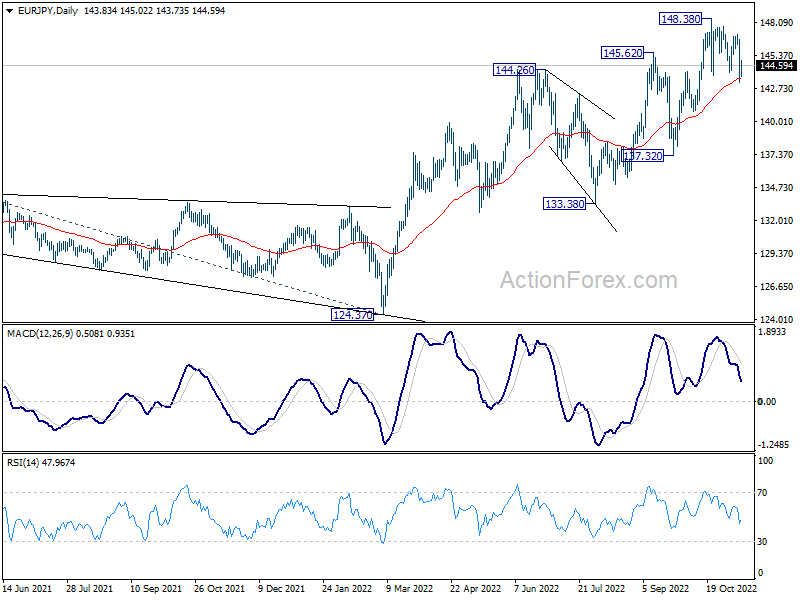
Daily Pivots: (S1) 142.47; (P) 144.61; (R1) 146.01; More....
Intraday bias in EUR/JPY remains neutral at this point. Strong support from 55 day EMA (now at 143.53), and rebound from current level will retain near term bullishness. Break of 148.38 will resume larger rise to 149.76 long term resistance. However, sustained trading below 55 day EMA will argue that larger scale correction is underlying, and target 137.32 support.
In the bigger picture, the up trend from 114.42 (2020 low) is still in progress for 149.76 (2014 high). Decisive break there will pave the way to 161.8% projection of 114.42 to 134.11 from 124.37 at 156.22. This will now remain the favored case as long as 137.32 support holds.
EUR/GBP Daily Outlook
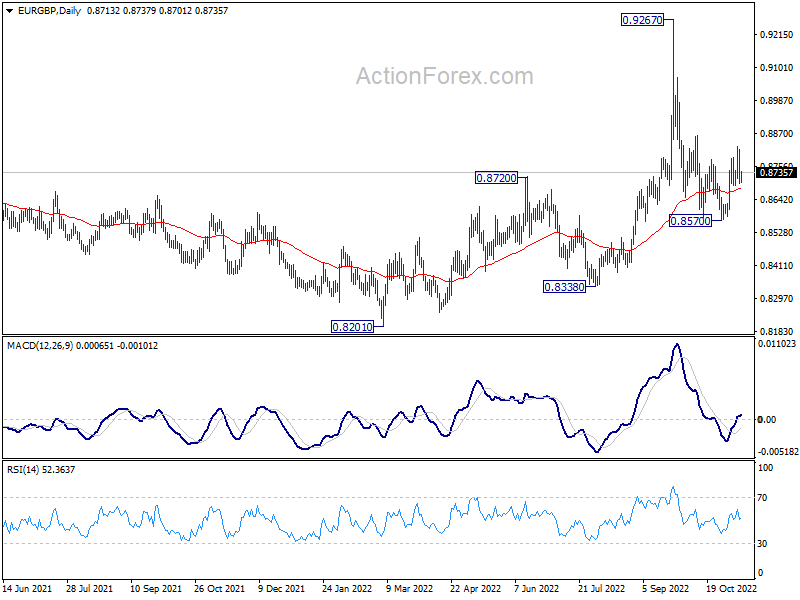
Daily Pivots: (S1) 0.8668; (P) 0.8743; (R1) 0.8785; More...
Intraday bias in EUR/GBP is turned neutral against with current retreat. On the upside, break of 0.8827 will resume the rise from 0.8570 to 0.8869. Sustained break there will pave the way back to retest 0.9267 high. On the downside, below 0.8689 minor support will turn bias back to the downside for 0.8570 instead.
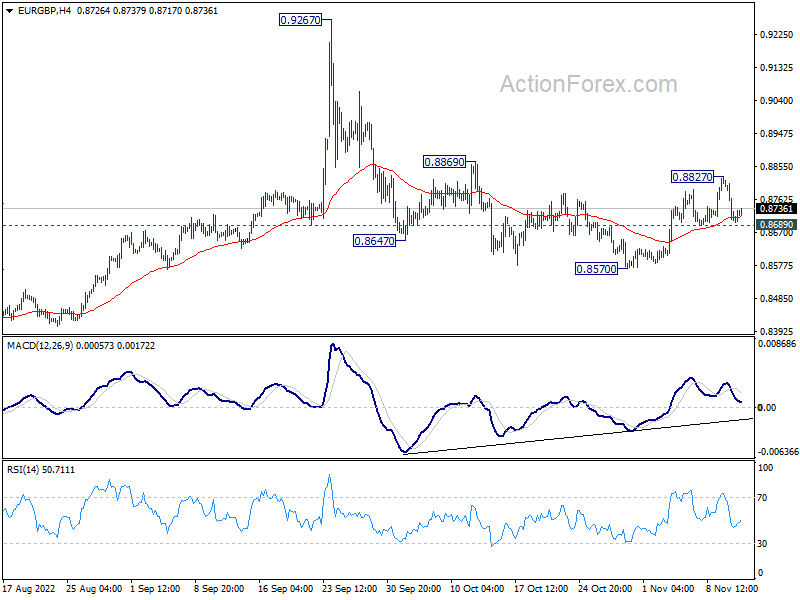
In the bigger picture, current development suggests that fall from 0.9267 is a down leg inside long term range pattern. Deeper fall could be seen towards 0.8201/8338 support zone. But strong support should be seen there to bring reversal. Nevertheless, firm break of 0.8869 resistance will turn favor to the case that such decline is merely a correction in the up trend from 0.8201. That is, further rally would be seen at a later stage through 0.9267.
EUR/AUD Daily Outlook
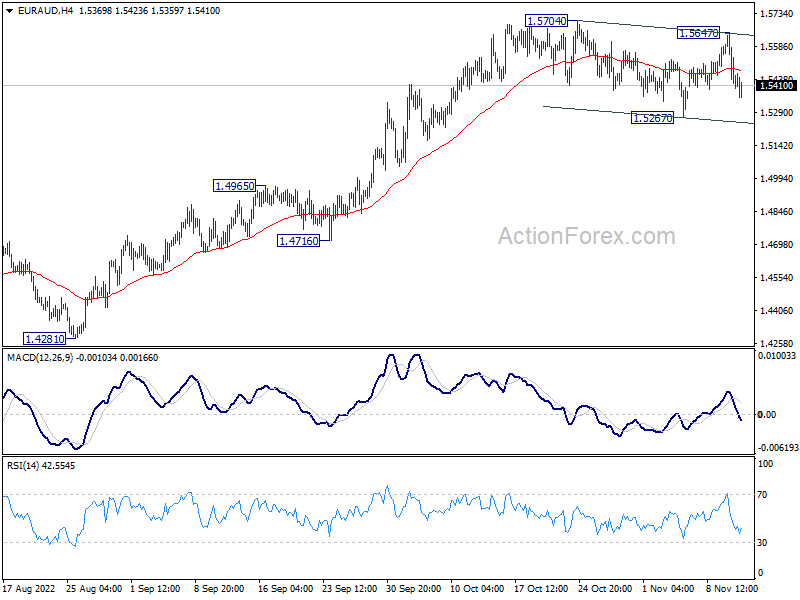
Daily Pivots: (S1) 1.5326; (P) 1.5489; (R1) 1.5577; More...
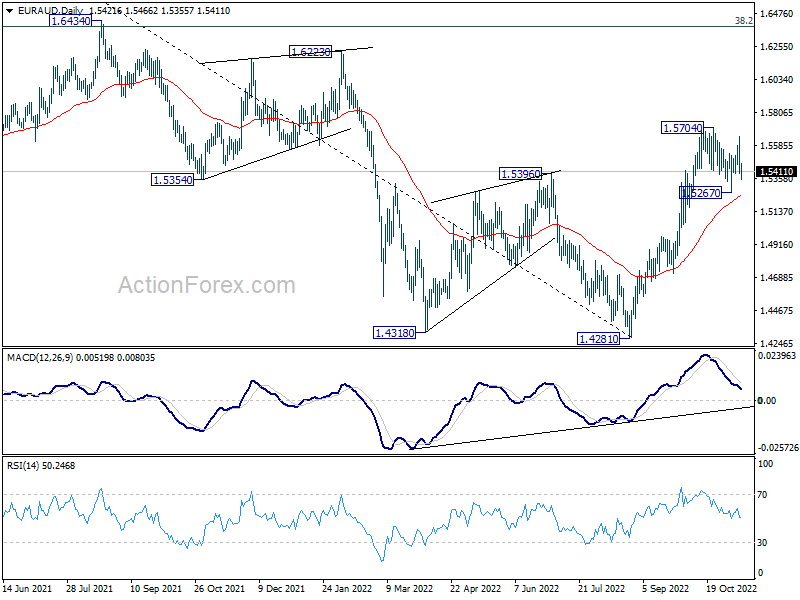
EUR/AUD's consolidation pattern from 1.5704 extends with another falling leg. Intraday bias stays neutral first. Downside is expected to be contained by 55 day EMA (now at 1.5245) to bring rebound. Break of 1.5704 will resume larger rise from 1.4281. However, sustained trading below 55 day EMA will bring deeper correction towards 1.4965 resistance turned support.
In the bigger picture, a medium term bottom should be in place at 1.4281, on bullish convergence condition in daily MACD. Further rise would be seen back to 1.6434 key resistance next. Break of 1.4965 resistance turned support is needed to indicate reversal. Otherwise, further rally will remain in favor.
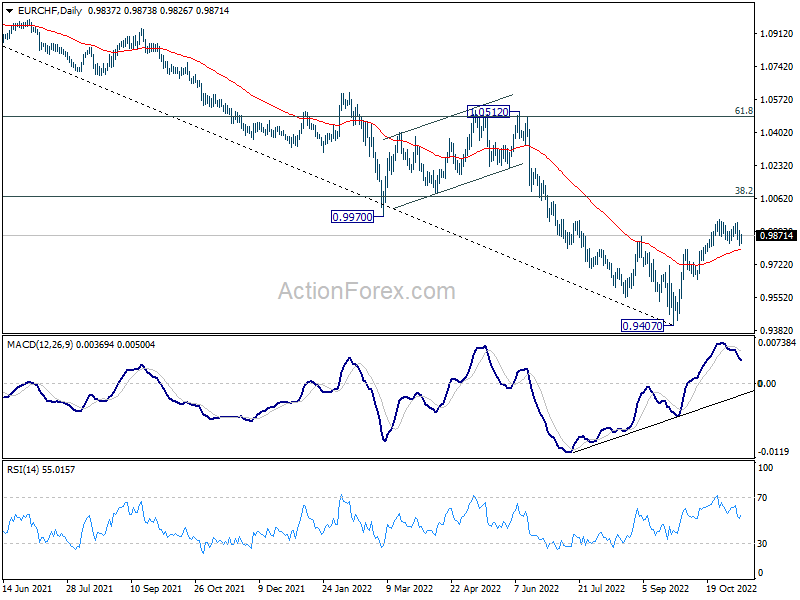
EUR/CHF Daily Outlook
Daily Pivots: (S1) 0.9806; (P) 0.9851; (R1) 0.9882; More....
Intraday bias in EUR/CHF stays neutral as consolidation from 0.9953 is in progress. Downside of retreat should be contained by 0.9798 resistance turned support to bring rebound. On the upside, break of 0.9953 will resume the rise from 0.9407 to 1.0072 fibonacci level.
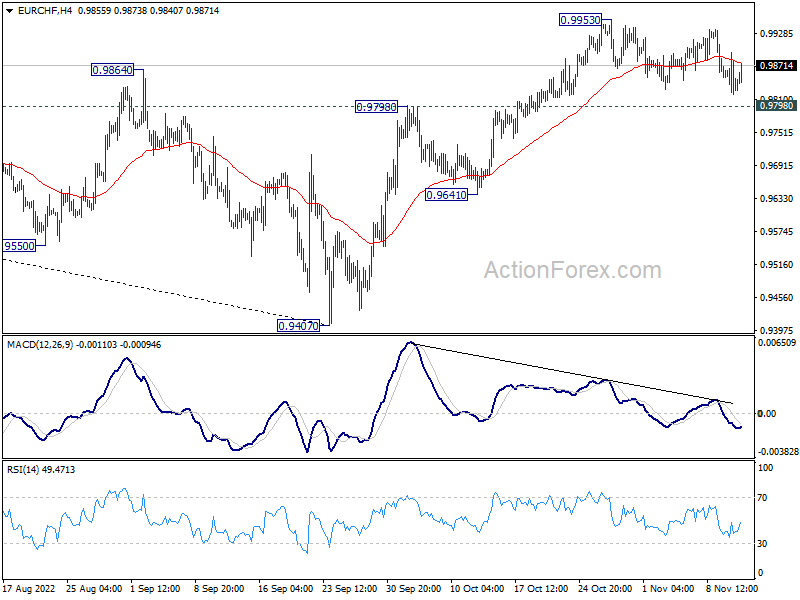
In the bigger picture, a medium term bottom should be in place at 0.9407. Further rally is expected as long as 0.9641 support holds, even as a corrective rebound. Next target 38.2% retracement of 1.1149 to 0.9407 at 1.0072. Reaction from there, as well as 55 week EMA (now at 1.0121) will reveal whether the trend is reversing.
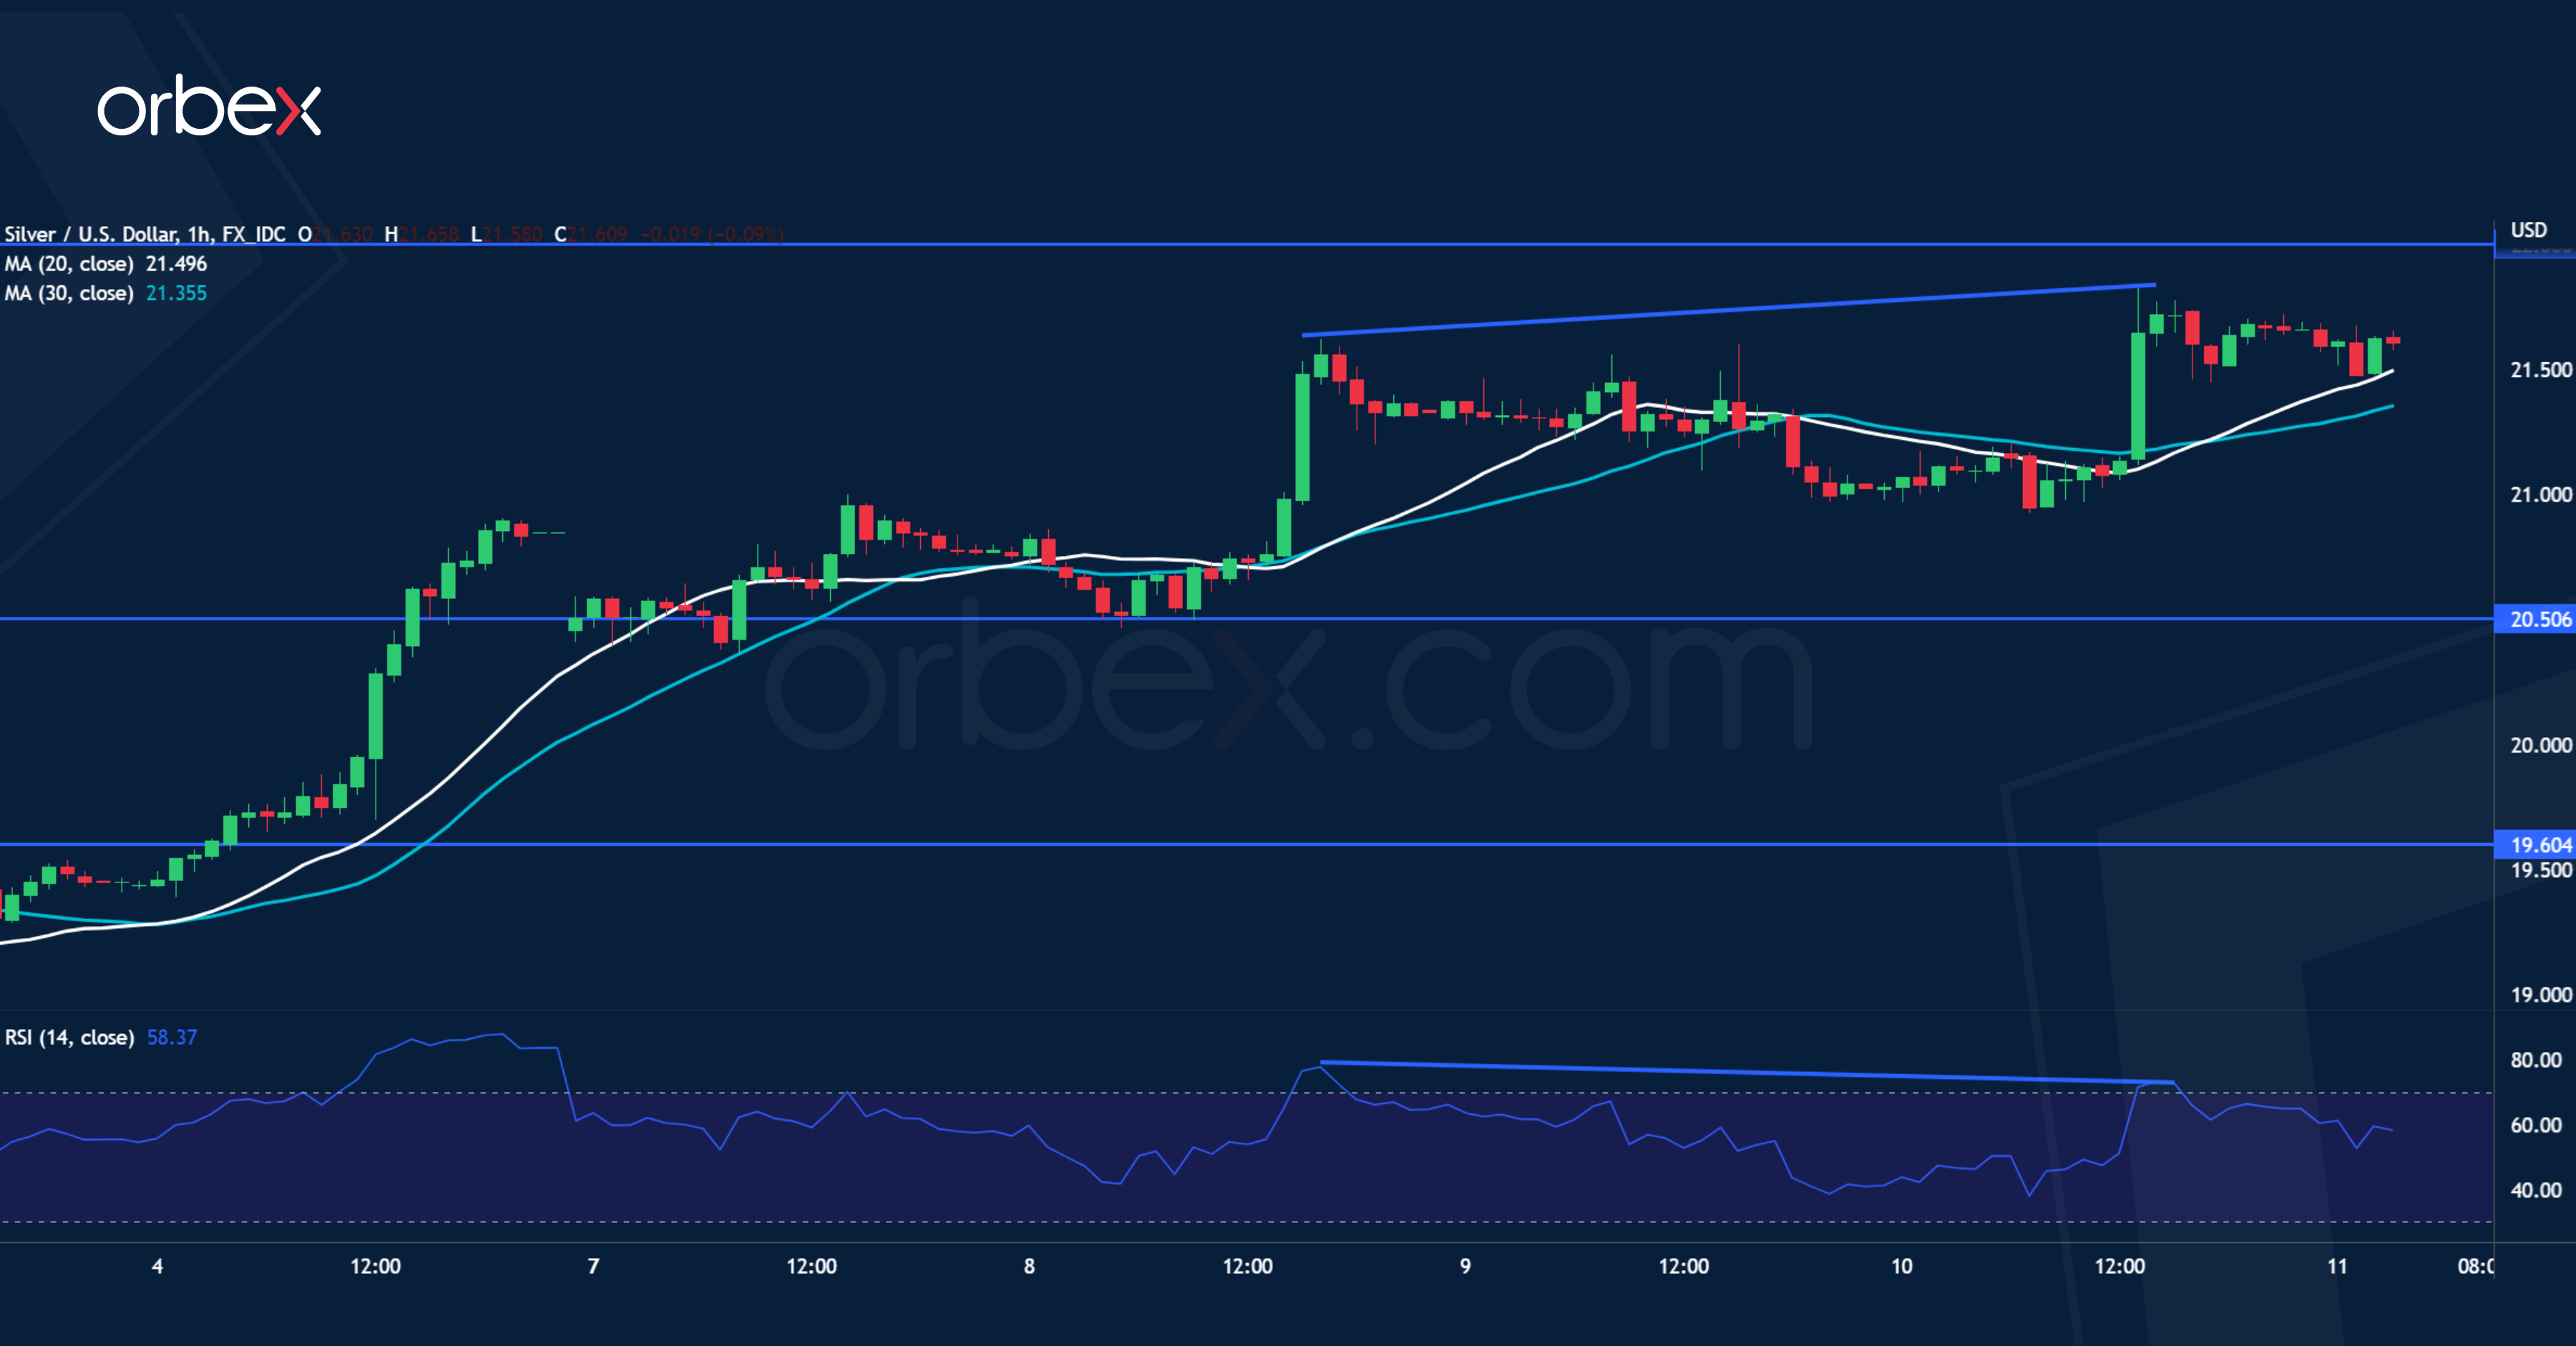
XAGUSD Tests Major Resistance
Silver climbs as the US dollar retreats across the board. A rally above October’s high of 21.20 may have put the precious metal back on track. The psychological level of 22.00 at the start of a sell-off last summer is a major hurdle ahead. A bullish breakout could lay the groundwork for a reversal in the medium-term. However, a bearish RSI divergence indicates a potential loss of momentum as the price grinds the supply zone, where profit-taking could weigh on short-term direction. 20.50 would be the first support.
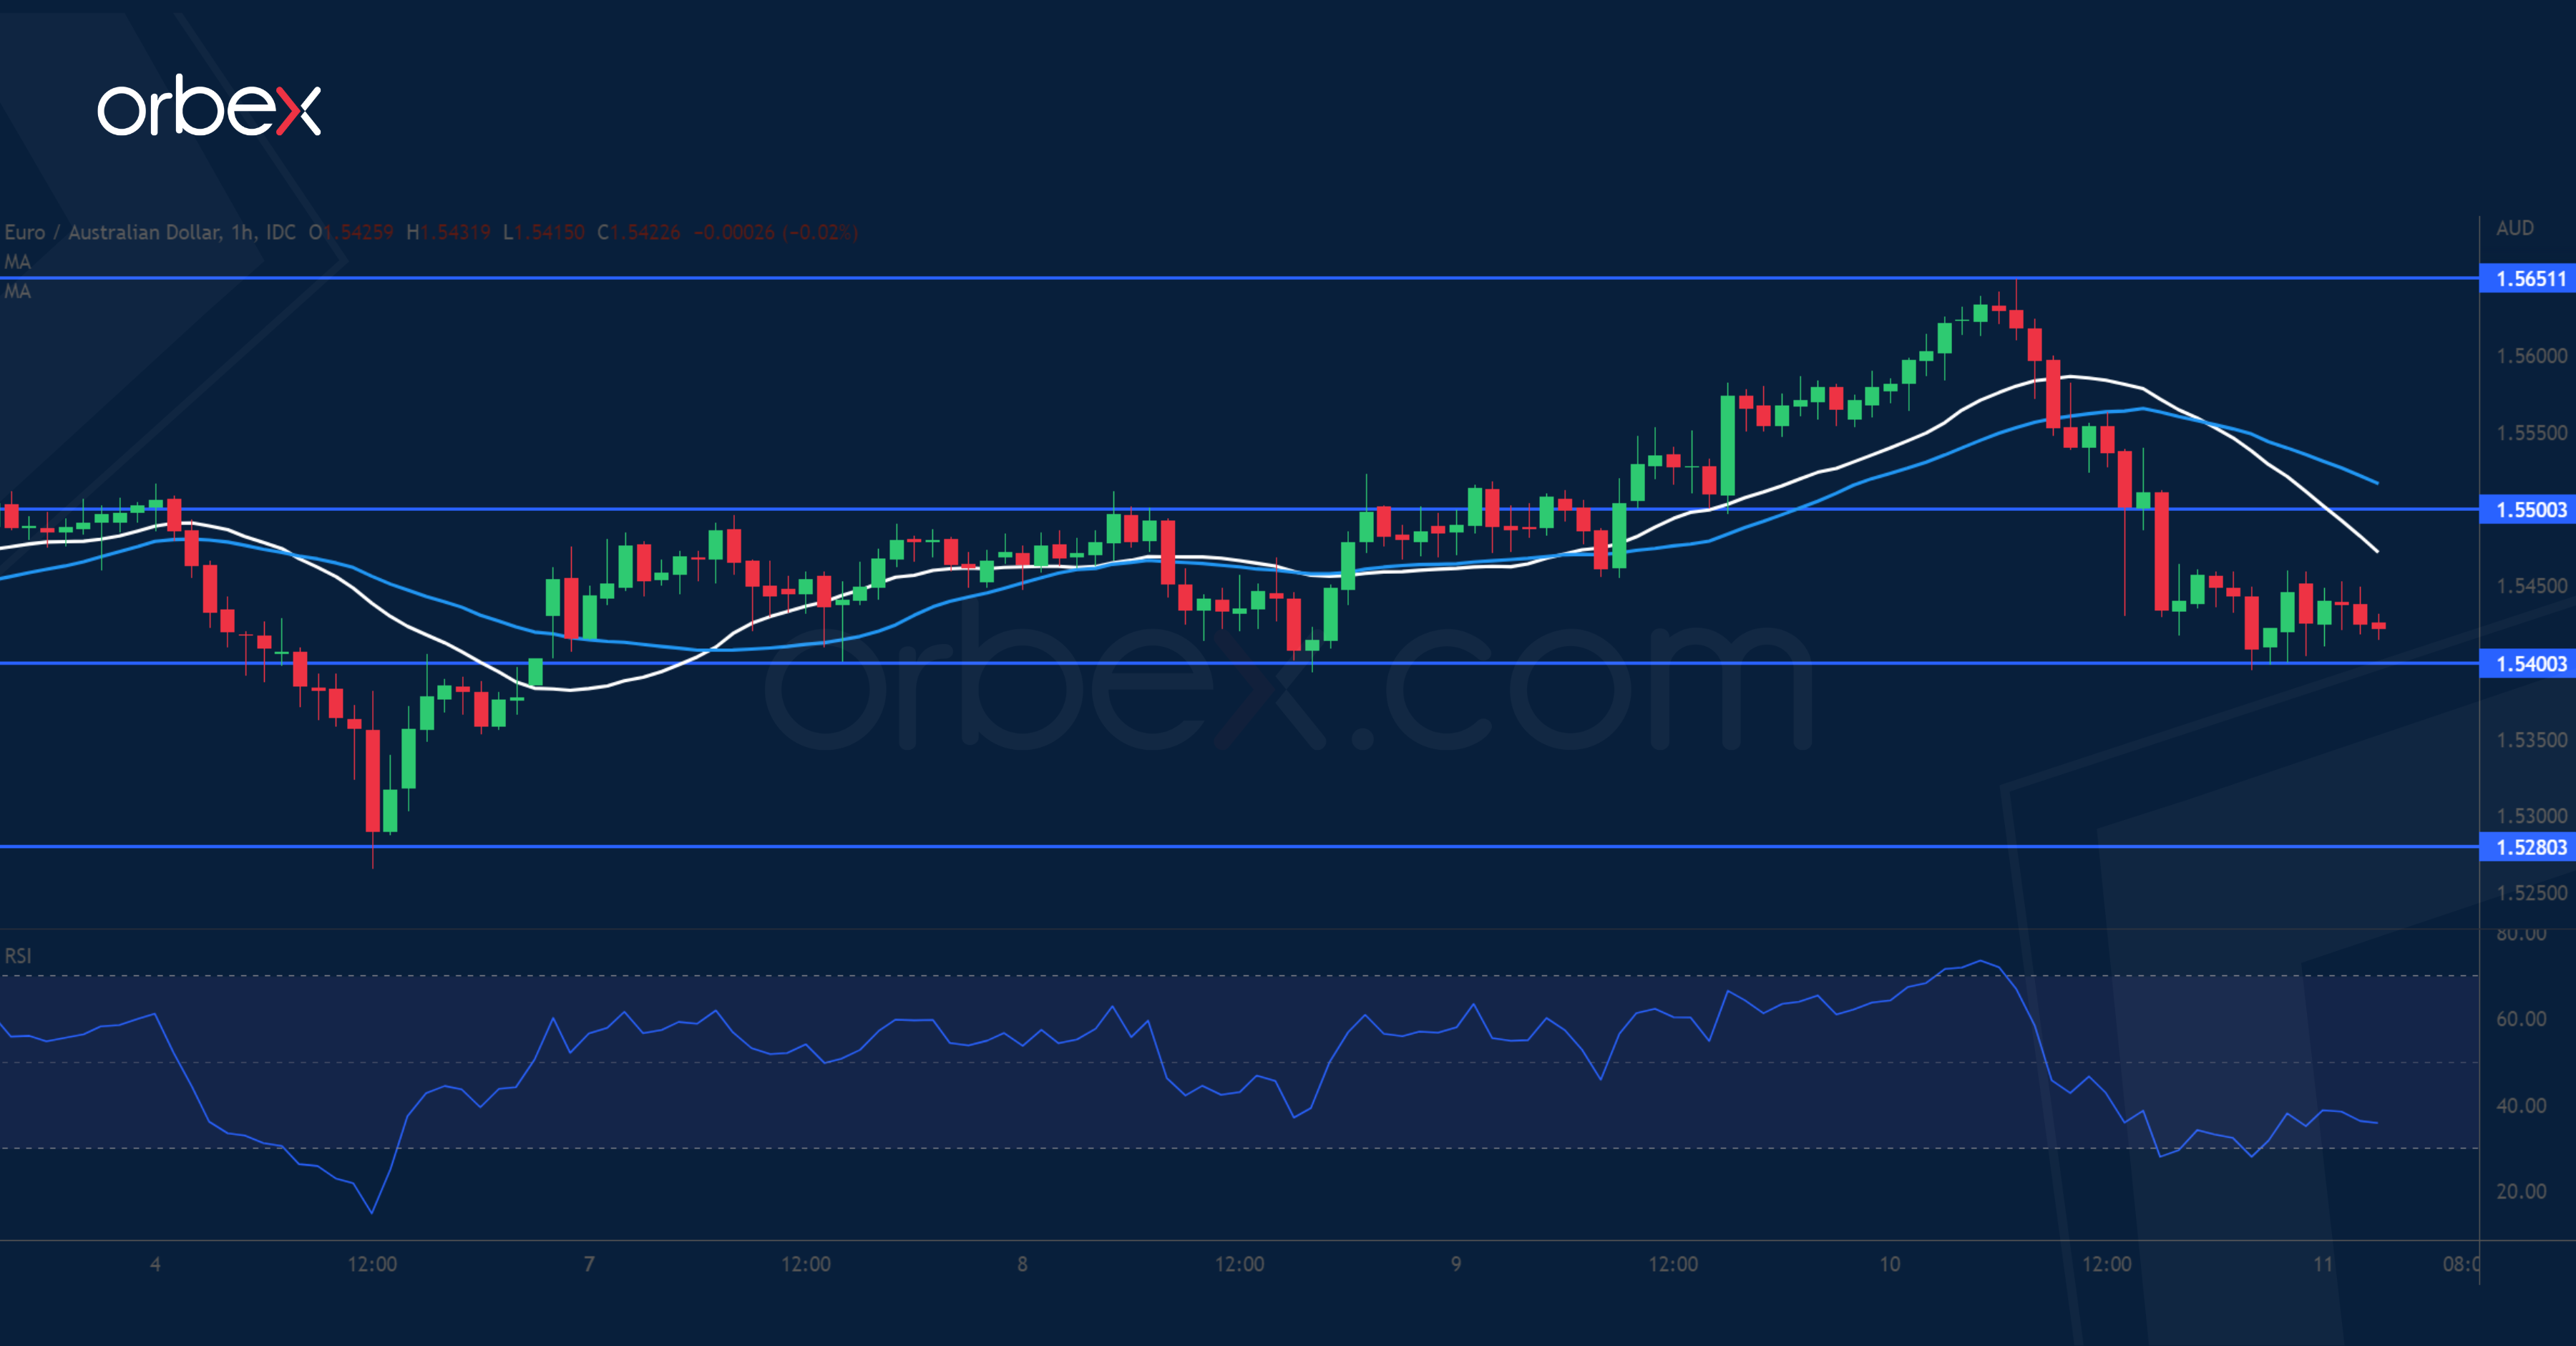
EURAUD Capped by Recent High
The Australian dollar rallied as risk appetite made its way back. The pair has been looking to consolidate its gains after it broke July’s high at 1.5400. The new demand zone above 1.5280 and over the 30-day moving average has seen a resurgence of buying interests. However, a bounce above 1.5520 was short-lived and now the ball is in the buyers’ court. 1.5400 is an important line to keep the current rebound valid. Its breach would lead to a retest of 1.5280. 1.5500 is a fresh hurdle before the single currency could bounce back.
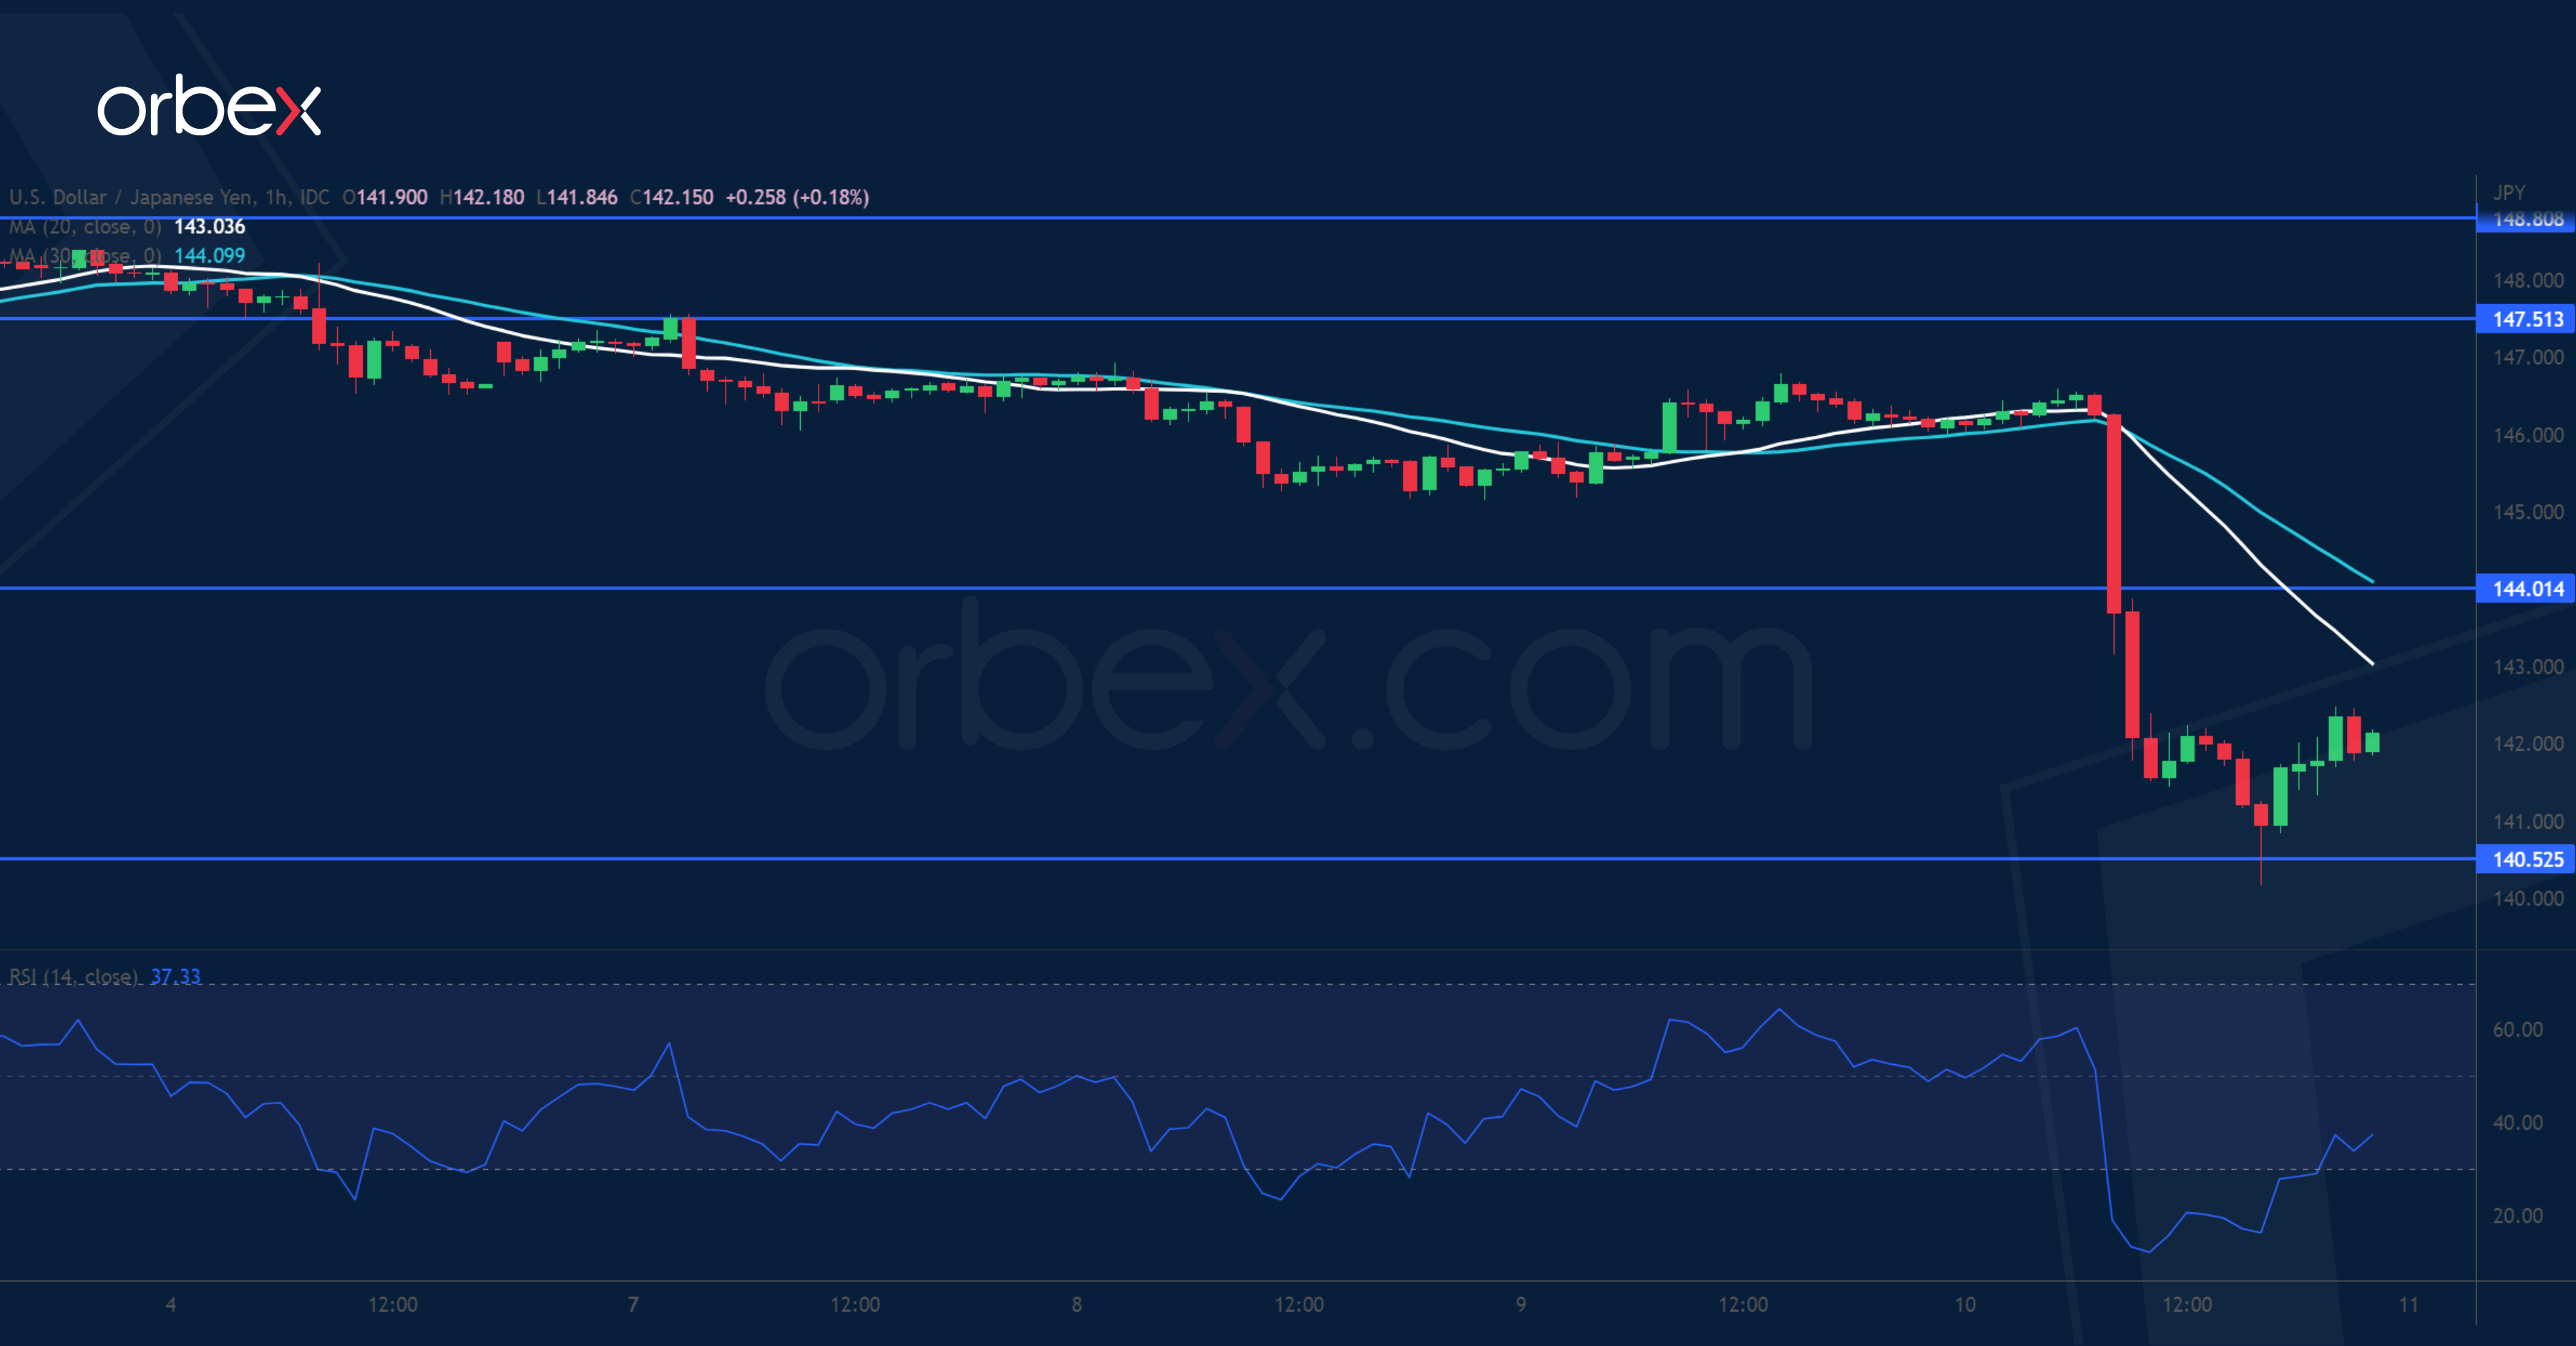
USDJPY Breaks Key Support
The US dollar crumbled after data showed a deceleration in last month’s inflation. Its recent vertical ascent might just need more breathing room. After hovering above 145.10, a sharp fall suggests a mass liquidation from a crowded long trade. As the RSI sank deeply into oversold territory, the price is testing the trough at 140.50 from late September. A valid breakout would put the greenback on a correction course in the medium-term with 138.00 as the target. 144.00 is the first resistance should the price action stabilises.