Sample Category Title
GBP/JPY Daily Outlook
Daily Pivots: (S1) 167.32; (P) 168.20; (R1) 169.09; More...
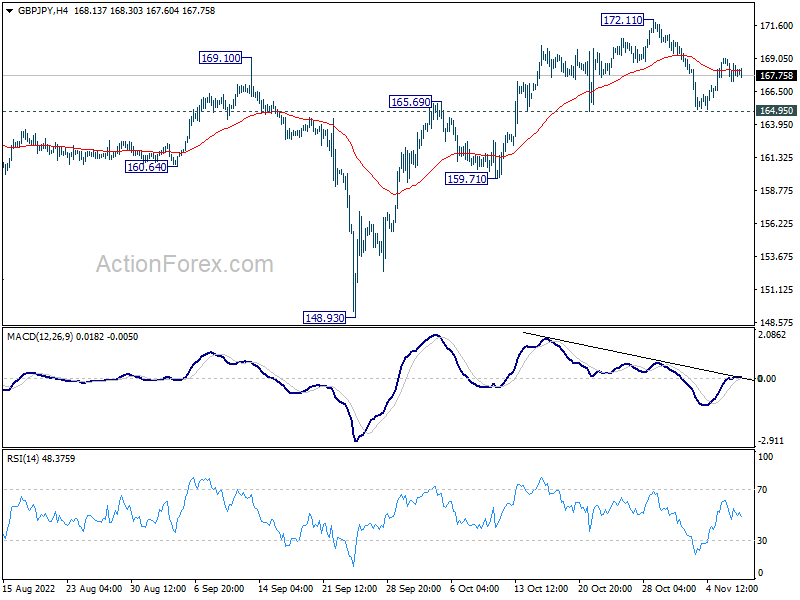
Intraday bias in GBP/JPY remains neutral and consolidation pattern from 172.11 could extend. Overall, further rally is mildly in favor with 164.95 support intact. On the upside, break of 172.11 will resume larger up trend. However, break of 164.95 will bring deeper pull back to 159.71 support and below.
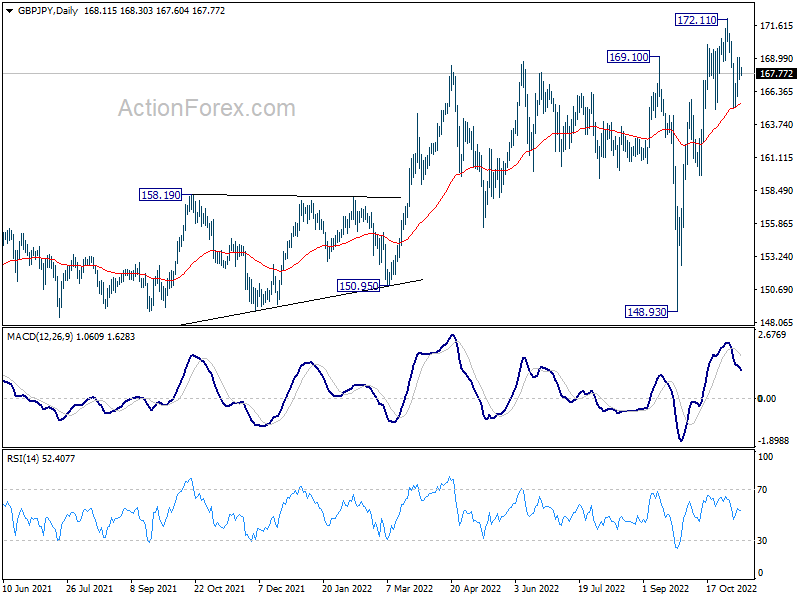
In the bigger picture, up trend from 123.94 (2020 low), as part of the trend from 122.75 (2016 low) is still in progress. Further rise would be seen to 161.8% projection of 122.75 to 156.59 (2018 high) from 123.94 at 178.69. This will now remain the favored case as long as 148.93 support holds.
EUR/JPY Daily Outlook
Daily Pivots: (S1) 146.16; (P) 146.58; (R1) 147.17; More....
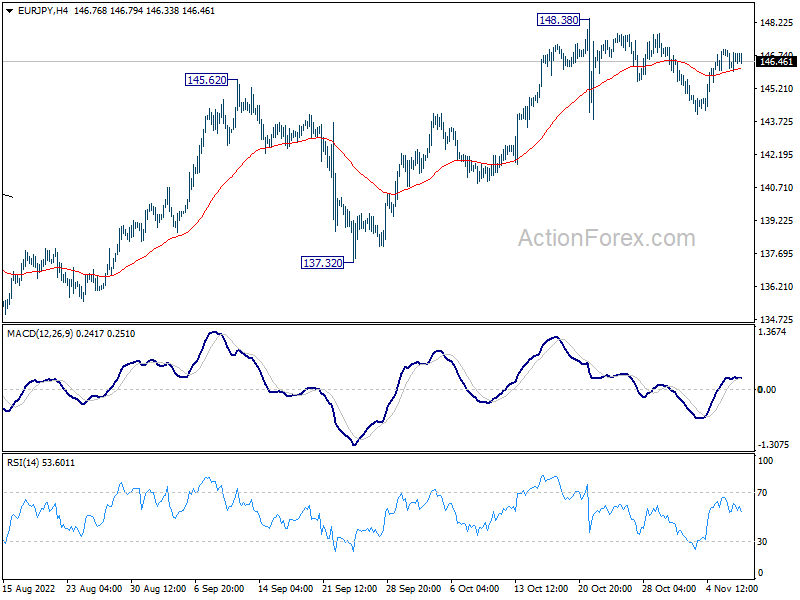
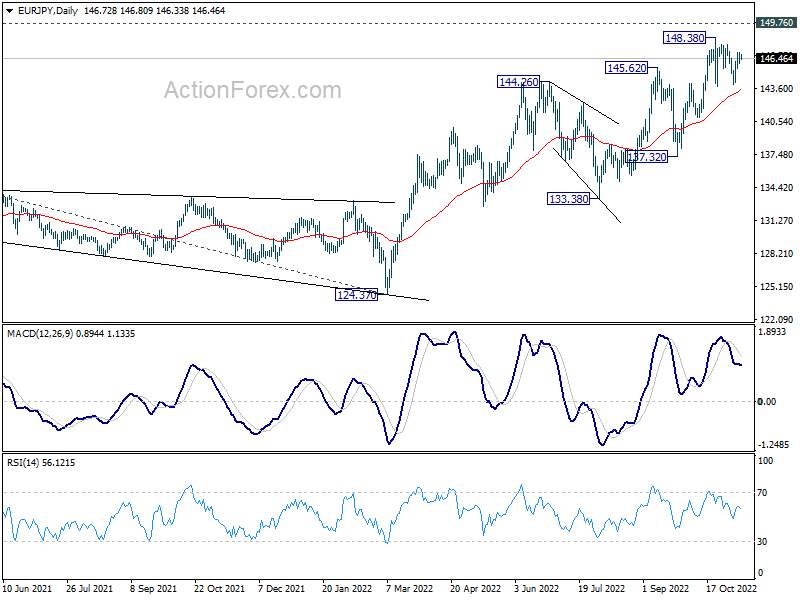
Intraday bias in EUR/JPY stays neutral and consolidation from 148.38 could extend further. In case of another fall, downside should be contained by 55 day EMA (now at 143.52) to bring rise resumption. On the upside, break of 148.38 will resume larger up trend to 149.76 long term resistance next.
In the bigger picture, the up trend from 114.42 (2020 low) is still in progress for 149.76 (2014 high). Decisive break there will pave the way to 161.8% projection of 114.42 to 134.11 from 124.37 at 156.22. This will now remain the favored case as long as 137.32 support holds.
EUR/GBP Daily Outlook
Daily Pivots: (S1) 0.8697; (P) 0.8720; (R1) 0.0.8749; More...
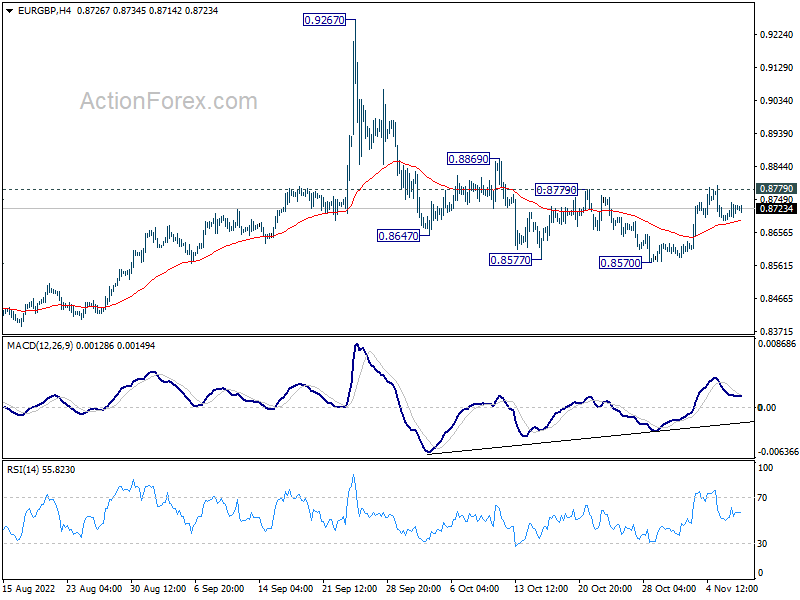
Intraday bias in EUR/GBP remains neutral for the moment. On the upside, firm break of 0.8779 will argue that corrective fall from 0.9267 has completed at 0.8570. Intraday bias will be back on the upside for 0.8869 first. Break there will bring retest of 0.9267 high. On the downside, break of 0.8570 will resume the fall from 0.9267 and target 0.8201/8388 support zone.
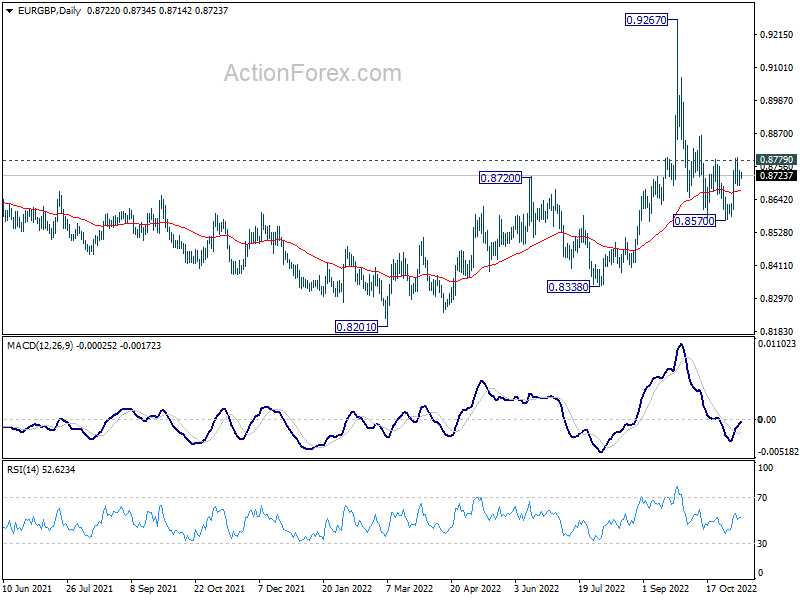
In the bigger picture, current development suggests that fall from 0.9267 is a down leg inside long term range pattern. Deeper fall could be seen towards 0.8201/8338 support zone. But strong support should be seen there to bring reversal.
EUR/AUD Daily Outlook
Daily Pivots: (S1) 1.5416; (P) 1.5469; (R1) 1.5541; More...
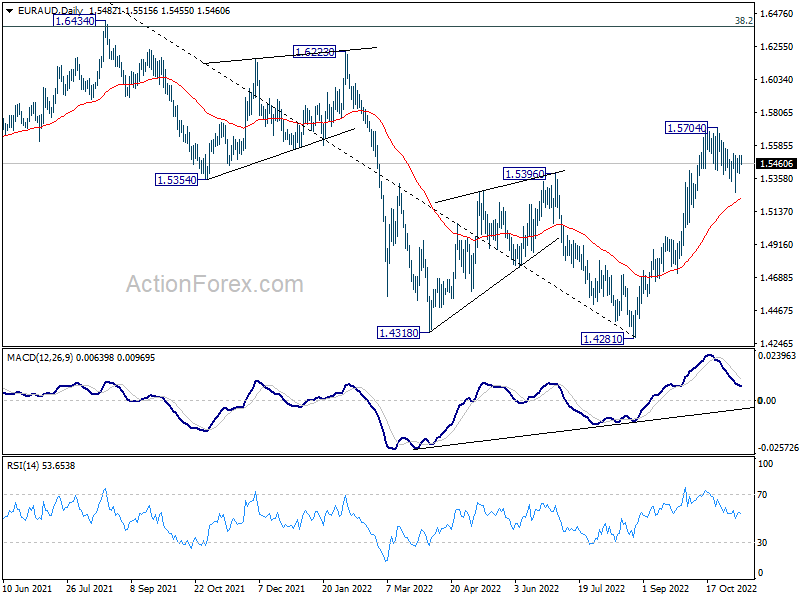
EUR/AUD is extending the corrective pattern from 1.5074. Intraday bias stays neutral at this point. Deeper fall could be seen but downside should contained by 55 day EMA (now at 1.5227) to bring rebound. On the upside, break of 1.5704 will resume the rally from 1.4281.
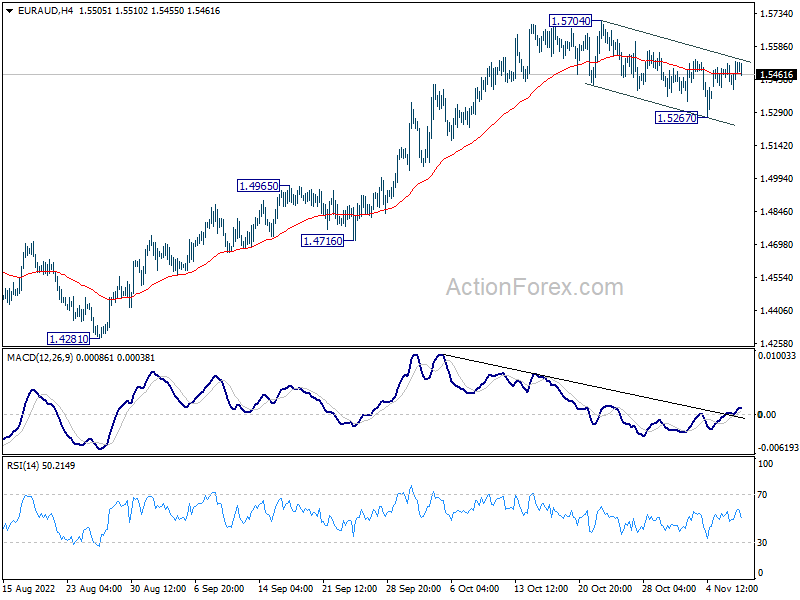
In the bigger picture, a medium term bottom should be in place at 1.4281, on bullish convergence condition in daily MACD. Further rise would be seen back to 1.6434 key resistance next. Break of 1.4965 resistance turned support is needed to indicate reversal. Otherwise, further rally will remain in favor.
EUR/CHF Daily Outlook
Daily Pivots: (S1) 0.9896; (P) 0.9916; (R1) 0.9951; More....
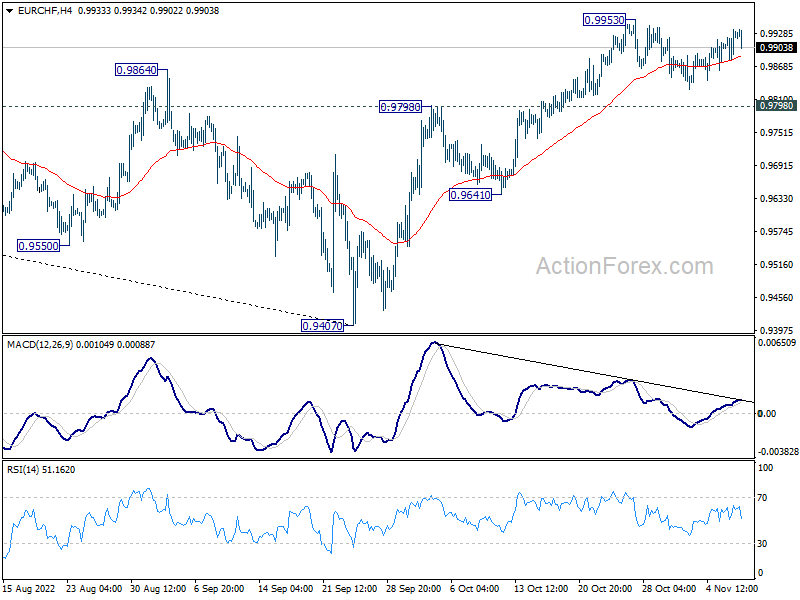
Intraday bias in EUR/CHF stays neutral as consolidation from 0.9953 is extending. Another fall cannot be ruled out, but downside should be contained by 0.9798 resistance turned support to bring rebound. On the upside, break of 0.9953 will resume the rise from 0.9407 to 1.0072 fibonacci level.
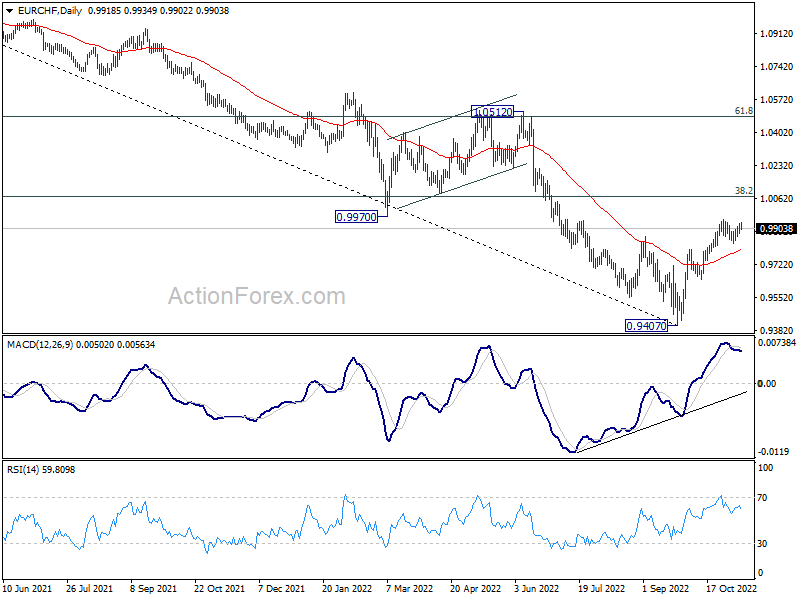
In the bigger picture, a medium term bottom should be in place at 0.9407. Further rally is expected as long as 0.9641 support holds, even as a corrective rebound. Next target 38.2% retracement of 1.1149 to 0.9407 at 1.0072. Reaction from there, as well as 55 week EMA (now at 1.0121) will reveal whether the trend is reversing.
NZDUSD Extends Recovery after Bouncing Off 30-Month Lows
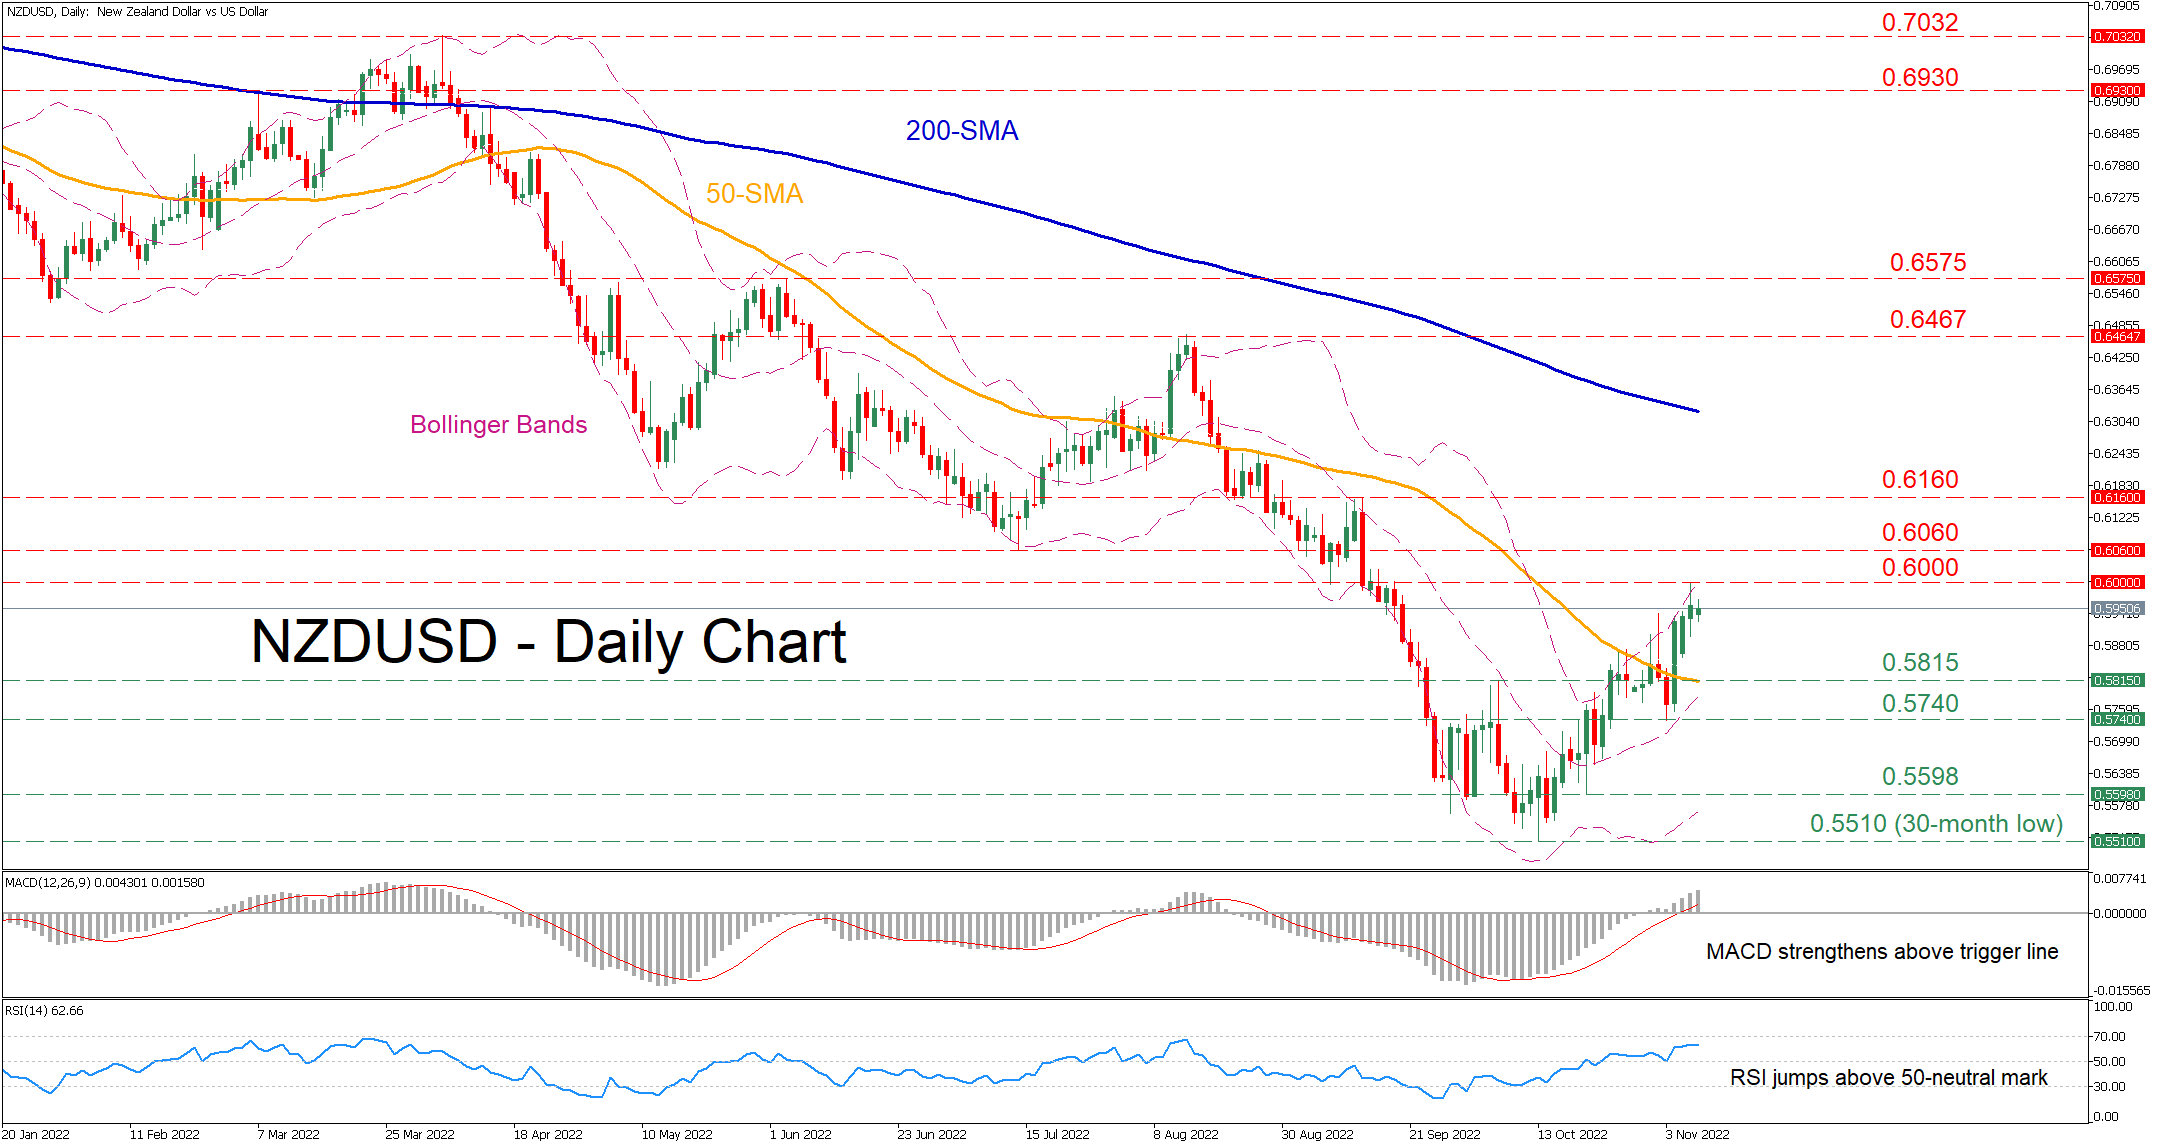
NZDUSD has been trending lower since March, generating a profound structure of lower highs and lower lows. Nevertheless, the pair has posted a moderate recovery and has jumped above its 50-day simple moving average (SMA) after finding its feet at the 30-month low of 0.5510.
The momentum indicators are endorsing a positive near-term tone. Specifically, the MACD histogram is strengthening above both zero and its red signal line, while the RSI has crossed above its 50-neutral mark.
To the upside, bullish actions could send the price to test the 0.6000 psychological mark, which temporarily curbed the pair’s recent rebound. Conquering this barricade, the price might ascend towards the July low of 0.6060 or higher to test the 0.6160 barrier. A break above the latter may turn the spotlight to the August peak of 0.6467.
Alternatively, any declines could meet initial support at the inside swing high of 0.5815, which overlaps with the 50-day SMA. Sliding beneath that floor, the bears could target the November low of 0.5740 before the 0.5598 hurdle appears on the radar. Violating this zone, the price might retreat towards the 30-month low of 0.5510.
Overall, NZDUSD has managed to erase a substantial part of its steep decline as positive momentum appears to be strengthening. However, a break above the 0.6160 ceiling is needed to shift the medium-term outlook back to neutral.
Gold Dives from 1-Month High after Aggressive Bullish Rally
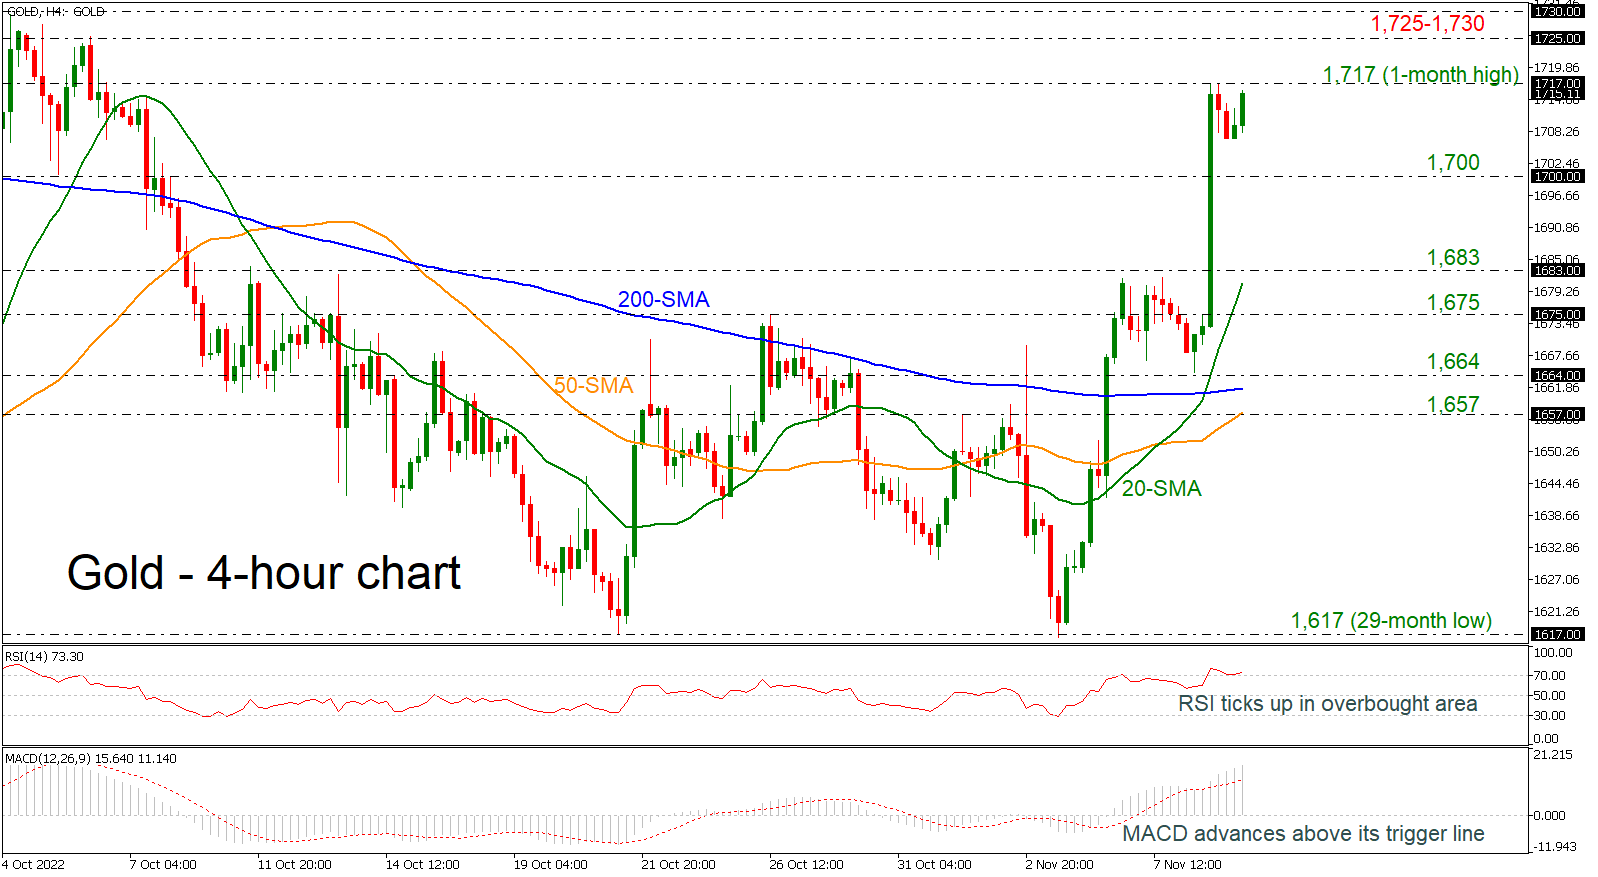
Gold prices gained significant buying traction on Tuesday – the largest 4-hour increase of the year –, with the price peaking at a fresh one-month high near 1,717. The positive slope in the RSI and the growing MACD are endorsing the current bullish momentum in the price, though with the former above its 70 overbought level, the bears could be around the corner.
A decisive close above the aforementioned new high could reduce negative risks, producing another bullish extension towards the key area of 1,725-1,730. Beyond that, traders will target the high from August at 1,745.
Otherwise, if sellers take the lead, the pair may pull back to test the nearby support of 1,700. Falling lower, the 1,683 inside swing high may attempt to add some footing ahead of the 1,675 barrier. Slightly lower, the 20-period simple moving average (SMA) at 1,669 and the 200-period SMA at 1,660 could block the way lower.
In brief, the yellow metal is strengthening its bullish trend in the short-term picture, but some caution is warranted as the technical oscillators are holding in the overbought territories.
EUR/USD Daily Outlook
Daily Pivots: (S1) 0.9999; (P) 0.9987; (R1) 1.0122; More...
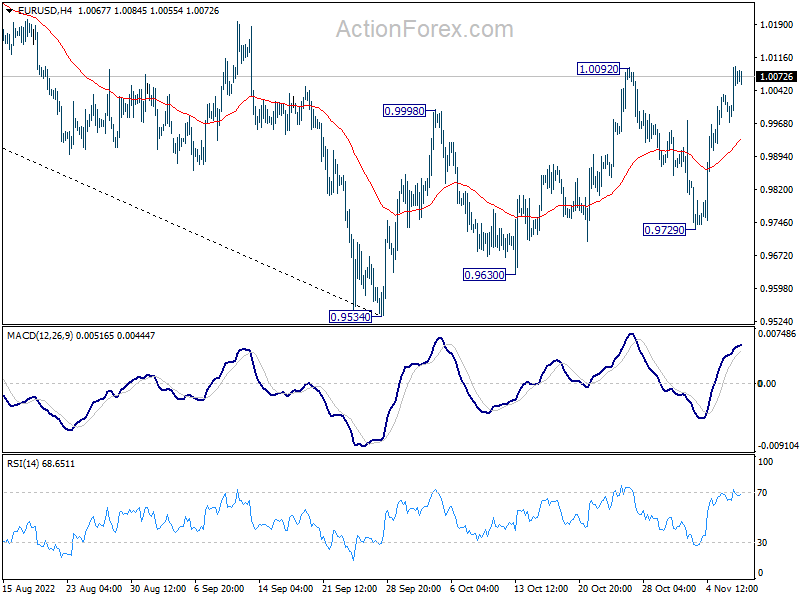
Immediate focus is now on 1.0092 resistance in EUR/USD. Firm break there will resume the whole rise from 0.9534. Further rally should then be seen to 38.2% retracement of 1.1494 to 0.9534 at 1.0283, even as a corrective rise. On the downside, break of 0.9729 support will turn bias back to the downside for retesting 0.9534 low instead.
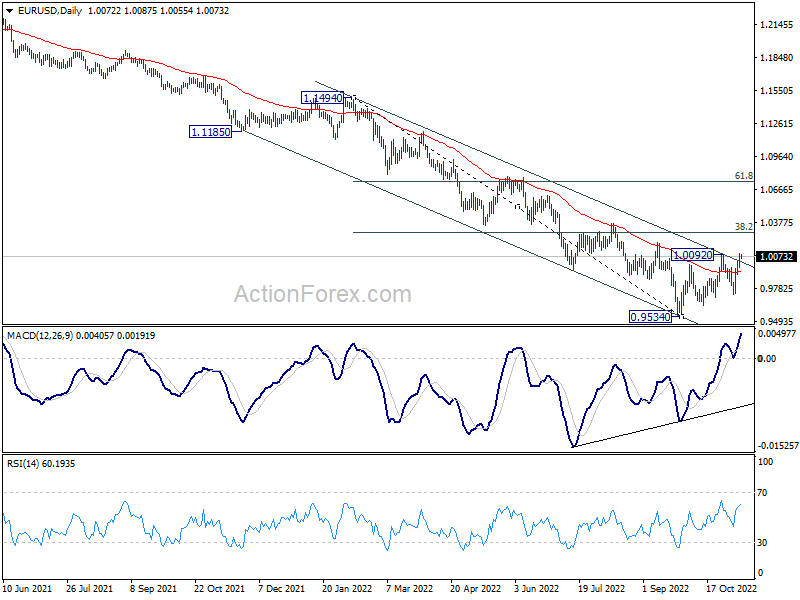
In the bigger picture, medium term outlook stays bearish with trading inside the falling channel. That is larger down trend from 1.2348 (2021 high) is still in progress. Firm break of 0.9534 low will confirm this bearish case. However, break of 1.0092 will add to the case of medium term bottoming, on bullish convergence condition in daily MACD, and bring further rally towards 55 week EMA (now at 1.0583).
GBP/USD Daily Outlook
Daily Pivots: (S1) 1.1452; (P) 1.1525; (R1) 1.1621; More...
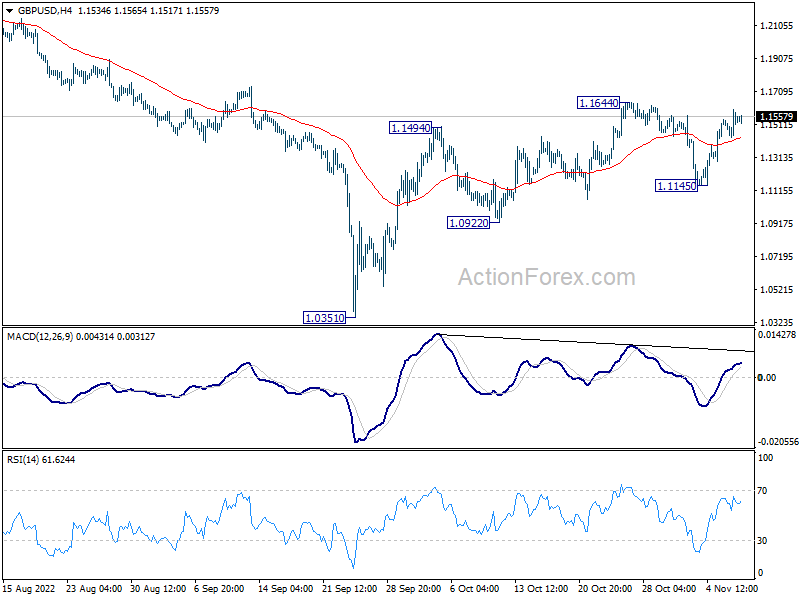
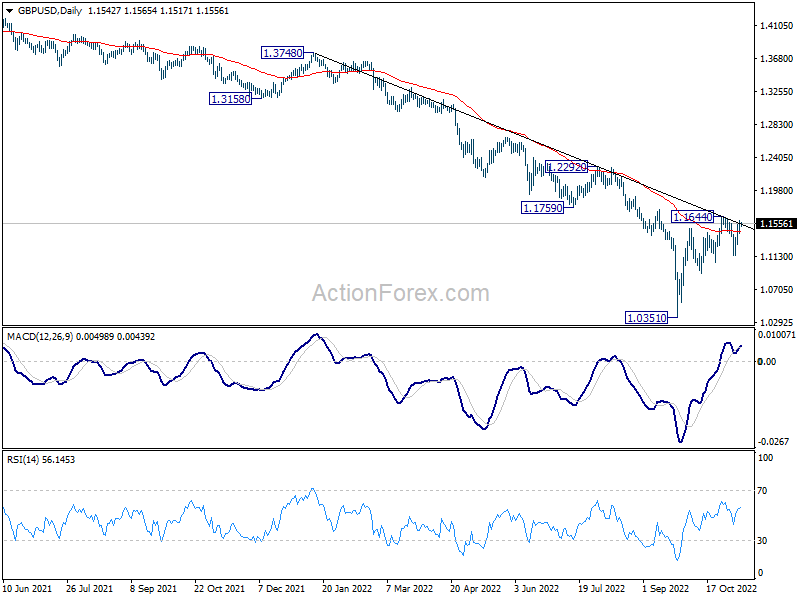
GBP/USD is still bounded in range of 1.1145/1.1644 and intraday bias remains neutral first. On the upside, break of 1.1644 will resume the whole rise from 1.0351 and target 1.1759/2292 resistance zone. On the downside, break of 1.1145 will reaffirm the case that corrective rise from 1.0351 has completed at 1.1644. Deeper fall would then be seen back to 1.0922 support and below.
In the bigger picture, fall from 1.4248 (2018 high) is part of the long term down trend from 2.1161 (2007 high). Outlook will stay bearish as long as 1.1759 support turned resistance holds. Parity would be the next target on resumption. Nevertheless, firm break of 1.1759 will confirm medium term bottoming, and open up stronger rise back to 55 week EMA (now at 1.2357).
USD/CHF Daily Outlook
Daily Pivots: (S1) 0.9822; (P) 0.9874; (R1) 0.9912; More...
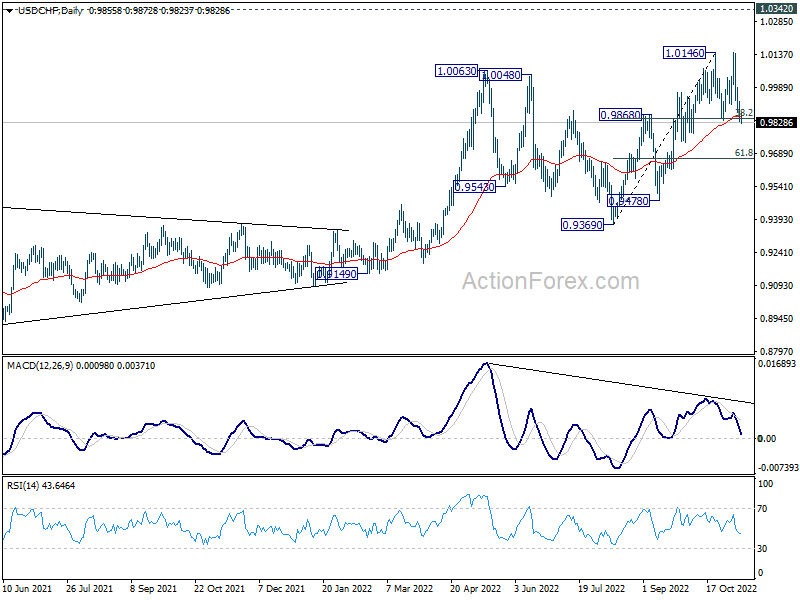
USD/CHF's break of 0.9840 support suggests that a double top pattern was completed. (1.0146, 1.0146). The break of 55 day EMA is also a near term bearish sign. Intraday bias is back on the downside for 61.8% retracement of 0.9369 to 1.0146 at 0.9666. On the upside, above 0.9925 minor resistance will turn intraday bias neutral first.
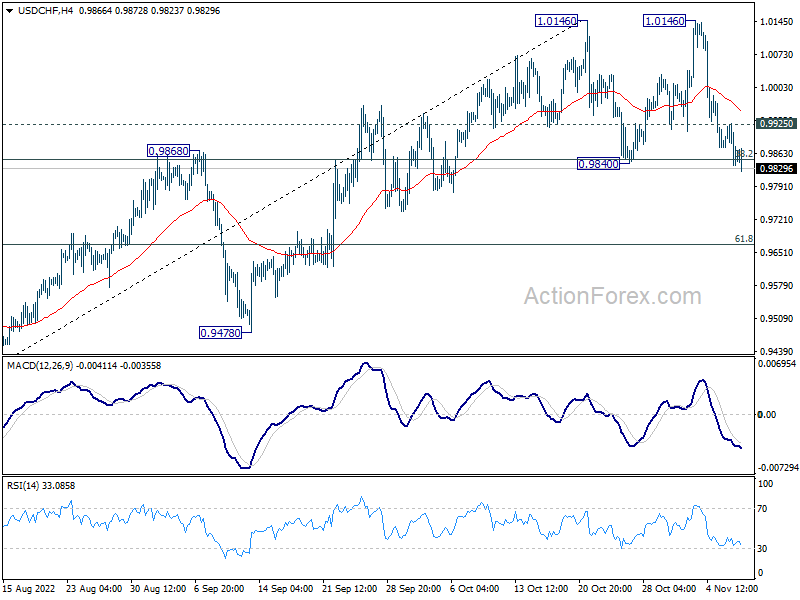
In the bigger picture, upside momentum is diminishing as seen in daily MACD. But up trend from 0.8756 (2021 low) is still in favor to resume as long as 0.9799 support holds. Break of 1.0146 will target 1.0342 (2016 high). However, sustained break of 0.9779 will suggest that a large scale correction, at least, is underway.