

Sample Category Title
All Eyes on the US CPI
Market movers today
Today, all eyes will be on US October CPI print. We are looking for another high print at +0.7% m/m / +8.0% y/y.
October inflation data is also due in Norway and Denmark. We expect a decline in Danish CPI inflation in October to 9.2% from 10.0% in September. Electricity and natural gas prices have declined significantly, and fuel prices will likely pull inflation down as well. In Norway, inflation surprised to the upside once again in September. We reckon that inflationary pressures are still relatively strong as the economy continues to run above potential and firms are passing on large parts of their cost increases to customers.
On the central bank front, we have a bunch of policymakers both from the ECB and the Fed on the wires.
The 60 second overview
US politics: President Biden is said to announce his candidacy for the 2024 presidential election early next year. At the time of writing, the US mid-term elections are still undecided. The republicans have 206 seats of 218 needed for a majority in the House and leads for another 14. As regards the Senate, it's a very close call as well. Both parties need to win two of three key states to win the majority.
Ukraine: Russian defence minister Shoigu ordered Russian troops to retreat from the Kherson city back to the Dnipro river, as the supply routes to the troops were difficult to sustain. This is yet an important milestone for the Ukrainians who have seen solid advancements since September.
EU fiscal: The EU Commission published a first proposal for overhauling the EU's fiscal rules, which have over the years become ever more complex, poorly understood and patchily enforced. The overarching idea of the reform proposal is to allow countries to agree on more realistic debt-reduction paths with Brussels, while creating extra space for public investment, but also tighten enforcement of the rules. In detail the blueprint foresees: (1) a 4-year individual debt reduction plan for each country (2) EU countries can request a more gradual adjustment path lasting up to 7-years if needed for investments and reforms (3) countries would need to stick to annual ceilings for net primary public expenditure or face penalties; (4) fines would be set at more realistic levels and 'reputational' sanctions enhanced; (5) if countries fail to cure excessive deficits, their EU funding could be withheld.
Equities: Equities retreated lower on Tuesday. US equities sold off sharply throughout the session: S&P500 -2.1%, Dow -2%, Nasdaq -2.5% and Russell 2000 -2.7%. Huge sector dispersion with energy underperforming utilities by 4p.p. Growth cyclicals led the declines, but note that value cyclicals sold off sharply too. In other words, it was a risk-off session and not just positioning ahead of the CPI figure. VIX broke the downward decline and rose for a second day. US futures are slightly higher today.
FI: European rates staged a significant rally late in the afternoon amid geopolitical headlines of Russia leaving the Kherson region. While it is difficult to see such headline explaining the entire move there was no other market moving headlines that initialled the 10y German yield's gradual decline of 10bp into the close. Spreads were virtually unchanged on the day, in a bullish flattening move. After the European close, the 10y US supply was not well received and 10y UST jumped 5bp. ECB market pricing now points to more likelihood of a 75bp rate hike in December.
FX: The setback to risk and not least the sharp drop in energy prices took its toll on NOK in yesterday's session with EUR/NOK spiking back above 10.40. Some commentators indicate the large reversal in US equities (SPX -2% on the day) was also affected by a major sell-off in cryptocurrencies.
Credit: Credit markets were a little soft yesterday following two positive trading days. iTraxx Main was 2bp wider to 107.2bp while iTraxx Crossover was 7.5bp wider to 523.1bp. The new issue activity across the Eurobond market is still high, underpinned by Credit Suisse raising EUR3bn of new debt that was heavily oversubscribed.
Nordic macro
In Norway, inflation surprised to the upside once again in September, and we reckon that inflationary pressures are still relatively strong. The economy is still running above potential, and firms are passing on large parts of their cost increases to customers, as is being seen in supermarkets. Much of the remaining retail trade, on the other hand, is battling with much weaker demand and abnormally high stock levels. We reckon that core inflation will rise to 5.4% y/y, well below consensus of 5.6 %.
AUD/USD Daily Report
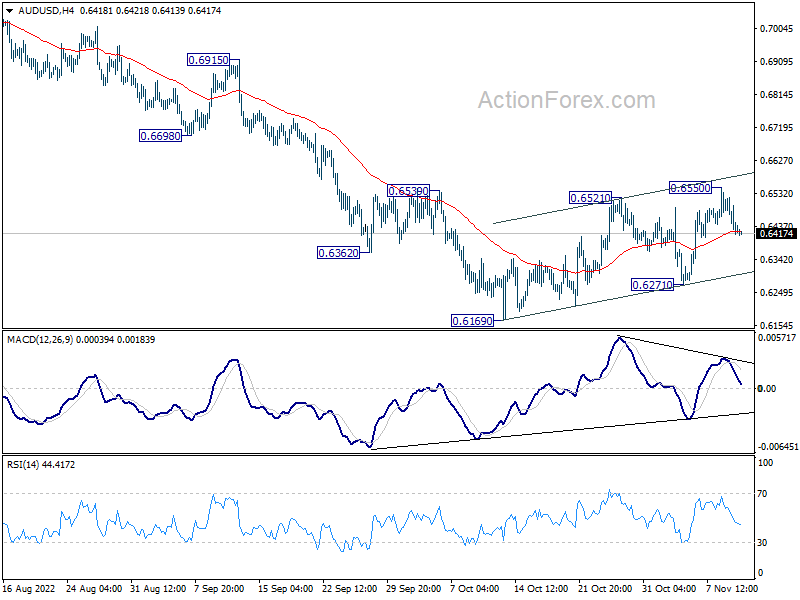
Daily Pivots: (S1) 0.6390; (P) 0.6456; (R1) 0.6497; More...
AUD/USD is retreating further away from 0.6550 and intraday bias stays neutral first. Above 0.6550 will resume the corrective rise from 0.6169 towards 0.6680 support turned resistance. On the downside, though, break of 0.6271 support will indicate that the corrective rise has completed, after rejection by 55 day EMA. Intraday bias will be back on the downside through 0.6169 low to resume larger down trend.
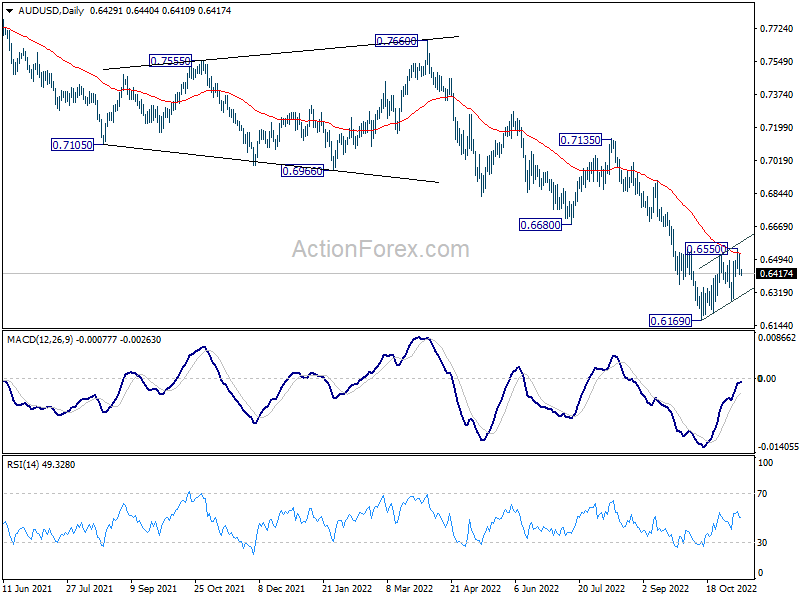
In the bigger picture, down trend from 0.8006 (2021 high) is expected to continue as long as 0.6680 support turned resistance holds. Medium term momentum remains strong and retest of 0.5506 (2020 low) cannot be ruled out. But firm break of 0.6680 will be the first sign of reversal, and bring stronger rebound back to 0.7135 resistance.
Sentiment Turned Sour, Dollar Awaits US CPI
The selloff in cryptocurrencies spread to global stocks. Commodity currencies tumbled broadly following risk-off sentiment. Swiss Franc and Euro are currently the biggest winner from market sentiment, while Sterling softened notably against European peers. Dollar and Yen are mixed for now. Focuses will turn to US inflation today, which has the potential to trigger further selloff in risk markets, and help the greenback.
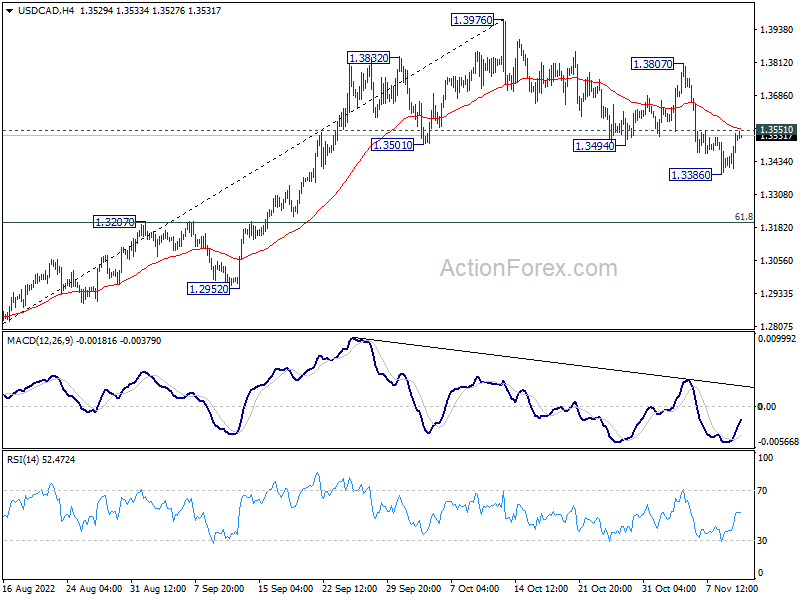
Technically, the decline in USD/CAD didn't really take off and it recovered after dipping to 1.3386. Sustained break of 4 hour 55 EMA (now at 1.3559) will argue that it's a failed head and shoulder top pattern. More importantly, that would suggest that correction from 1.3976 has completed, and stronger rally would be seen back to 1.3807 and above. We'll know how it goes very soon.
In Asia, Nikkei dropped -0.98%. Hong Kong HSI is down -2.17%. China Shanghai SSE is down -0.54%. Singapore Strait Times is up 0.35%. Japan 10-year JGB yield is down -0.0037 at 0.255. Overnight, DOW dropped -1.95%. S&P 500 dropped -2.08%. NASDAQ dropped -2.48%. 10-year yield rose 0.025 to 4.151.
Fed Kashkari: Any talk of a pivot is entirely premature
Minneapolis Federal Reserve Bank President Neel Kashkari said, "at the next meeting, which is mid-December, I don't know what we are going to do."
"There's a lot of talk in the public about might we raise rates by 50 basis points, might we raise rates by 75 basis points - those are certainly going to be on the table, but could it be something beyond that? It's possible too," he added.
Fed's dual mandate, price stability and maximum employment could come into tension at a certain point. However, Kashkari said, "we are a long, long, long way away from that right now, so that's why any talk of a pivot is entirely premature."
Fed Evans: There's benefits to adjusting tightening pace soon
Chicago Fed President Charles Evans said yesterday, "there's benefits to adjusting the pace (of tightening) as soon as we can."
"I'm hopeful that we're getting to a point where the dynamics for inflation turning over and returning towards our 2% objective will be put in place, if not very soon, soon, and we'll actually see it in inflation," he said.
"If you don't begin to think about adjusting the pace, taking account of lags, and you just keep increasing rates by a large amount every time you get a disappointing report," then "next thing you know, you're at a very high federal funds rate."
"I'm going to continue to be nervous that, as we go higher than that, it could be that the economy is going to face more challenges, and that that could present risks on the 'real' side, the full employment mandate," he said. "It's a risk."
BoJ Kuroda: Premature to lay out details of exit strategy
BoJ Governor Haruhiko Kuroda told the parliament, "it's premature to lay out details of an exit strategy. But one major factor of debate will be the pace of increase in the BoJ's short-term policy rate, now set at -0.1%."
"Another factor would be how to adjust its balance sheet," he said, noting that other major central banks adopted the sequence of interest rate hike first, then shrinking balance sheet.
"It's extremely important for the BOJ to underpin the economy with ultra-loose monetary policy and ensure the necessary environment is falling into place for companies to hike wages," Kuroda emphasized.
Looking ahead
ECB will publish monthly economic bulletin. But main focus will be on US CPI, while jobless claims will also be released.
AUD/USD Daily Report
Daily Pivots: (S1) 0.6390; (P) 0.6456; (R1) 0.6497; More...
AUD/USD is retreating further away from 0.6550 and intraday bias stays neutral first. Above 0.6550 will resume the corrective rise from 0.6169 towards 0.6680 support turned resistance. On the downside, though, break of 0.6271 support will indicate that the corrective rise has completed, after rejection by 55 day EMA. Intraday bias will be back on the downside through 0.6169 low to resume larger down trend.
In the bigger picture, down trend from 0.8006 (2021 high) is expected to continue as long as 0.6680 support turned resistance holds. Medium term momentum remains strong and retest of 0.5506 (2020 low) cannot be ruled out. But firm break of 0.6680 will be the first sign of reversal, and bring stronger rebound back to 0.7135 resistance.
Economic Indicators Update
| GMT | Ccy | Events | Actual | Forecast | Previous | Revised |
|---|---|---|---|---|---|---|
| 23:50 | JPY | Money Supply M2+CD Y/Y Oct | 3.10% | 3.40% | 3.30% | |
| 00:00 | AUD | Consumer Inflation Expectations Nov | 6.00% | 5.40% | ||
| 00:01 | GBP | RICS Housing Price Balance Oct | -2% | 28% | 32% | |
| 09:00 | EUR | Italy Industrial Output M/M Sep | 1.70% | 2.30% | ||
| 09:00 | EUR | ECB Economic Bulletin | ||||
| 12:30 | USD | Initial Jobless Claims (Nov 4) | 221K | 217K | ||
| 12:30 | USD | CPI M/M Oct | 0.70% | 0.40% | ||
| 12:30 | USD | CPI Y/Y Oct | 8.00% | 8.20% | ||
| 12:30 | USD | CPI Core M/M Oct | 0.50% | 0.60% | ||
| 12:30 | USD | CPI Core Y/Y Oct | 6.50% | 6.60% | ||
| 15:30 | USD | Natural Gas Storage | 92B | 107B |
Elliott Wave View: AUDUSD Looking to Rally in Double Correction
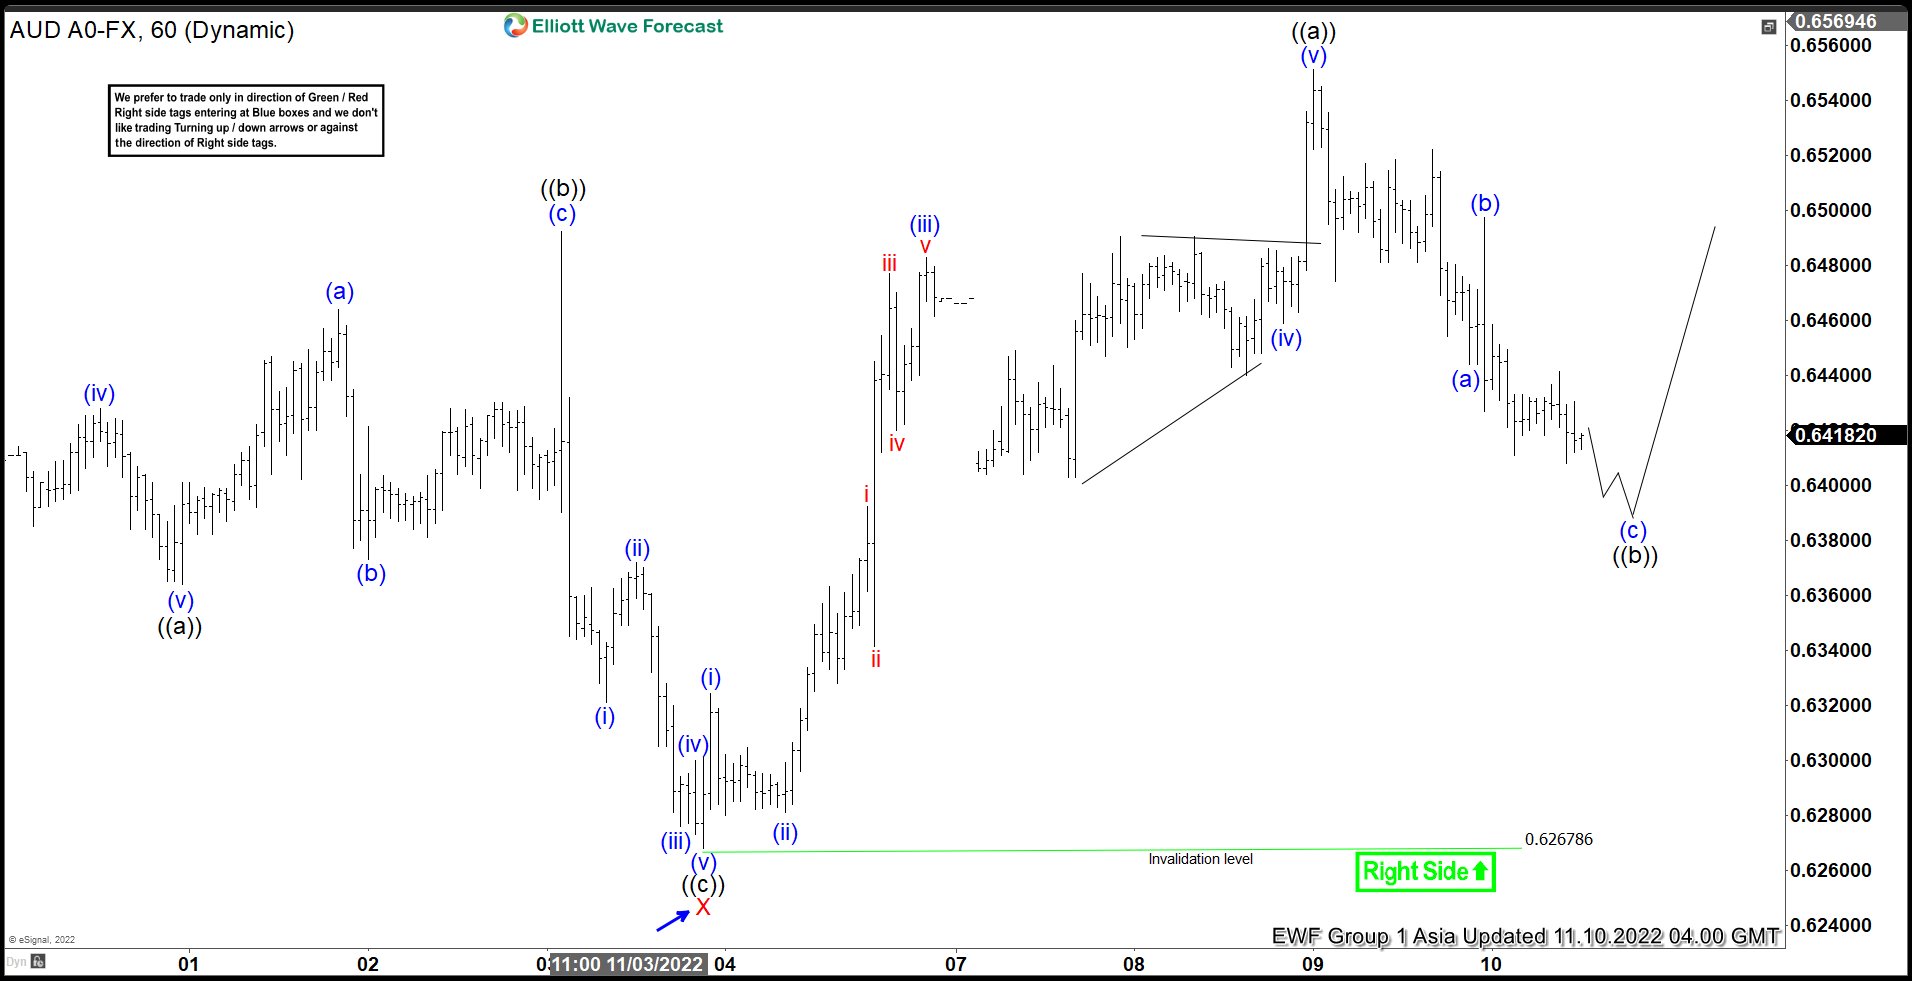
Short term Elliott Wave view in AUDUSD shows an incomplete bullish sequence from 10.13.2022 low favoring more upside. Rally from 10.13.2022 low is unfolding as a double three Elliott Wave structure. Up from 10.13.2022 low, wave W ended at 0.6522 and pullback in wave X ended at 0.6267. Pair resumes higher in wave Y with subdivision as a zigzag structure. Up from wave X low at 0.6267, wave (i) ended at 0.6324 and pullback in wave (ii) ended at 0.6281.
Pair resumes higher in wave (iii) towards 0.6483, and wave (iv) ended at 0.6459. Final leg higher wave (v) ended at 0.655 and this completed wave ((a)) in higher degree. Wave ((b)) pullback is currently in progress to correct cycle from 11.3.2022 low before the rally resumes in wave ((c)). Down from wave ((a)), wave (a) ended at 0.6444 and wave (b) ended at 0.6497. Expect wave (c) of ((b)) to end soon and pair to turn higher.
Near term, as far as pivot at 0.6267 low stays intact, expect pullback to find support in 3, 7, or 11 swing for further upside. Potential target higher is 100% – 161.8% Fibonacci extension from 10.13.2022 low. This area comes at 0.6627 – 0.684.
AUDUSD 60 Minutes Elliott Wave Chart
Technical Outlook and Review
USD/JPY:
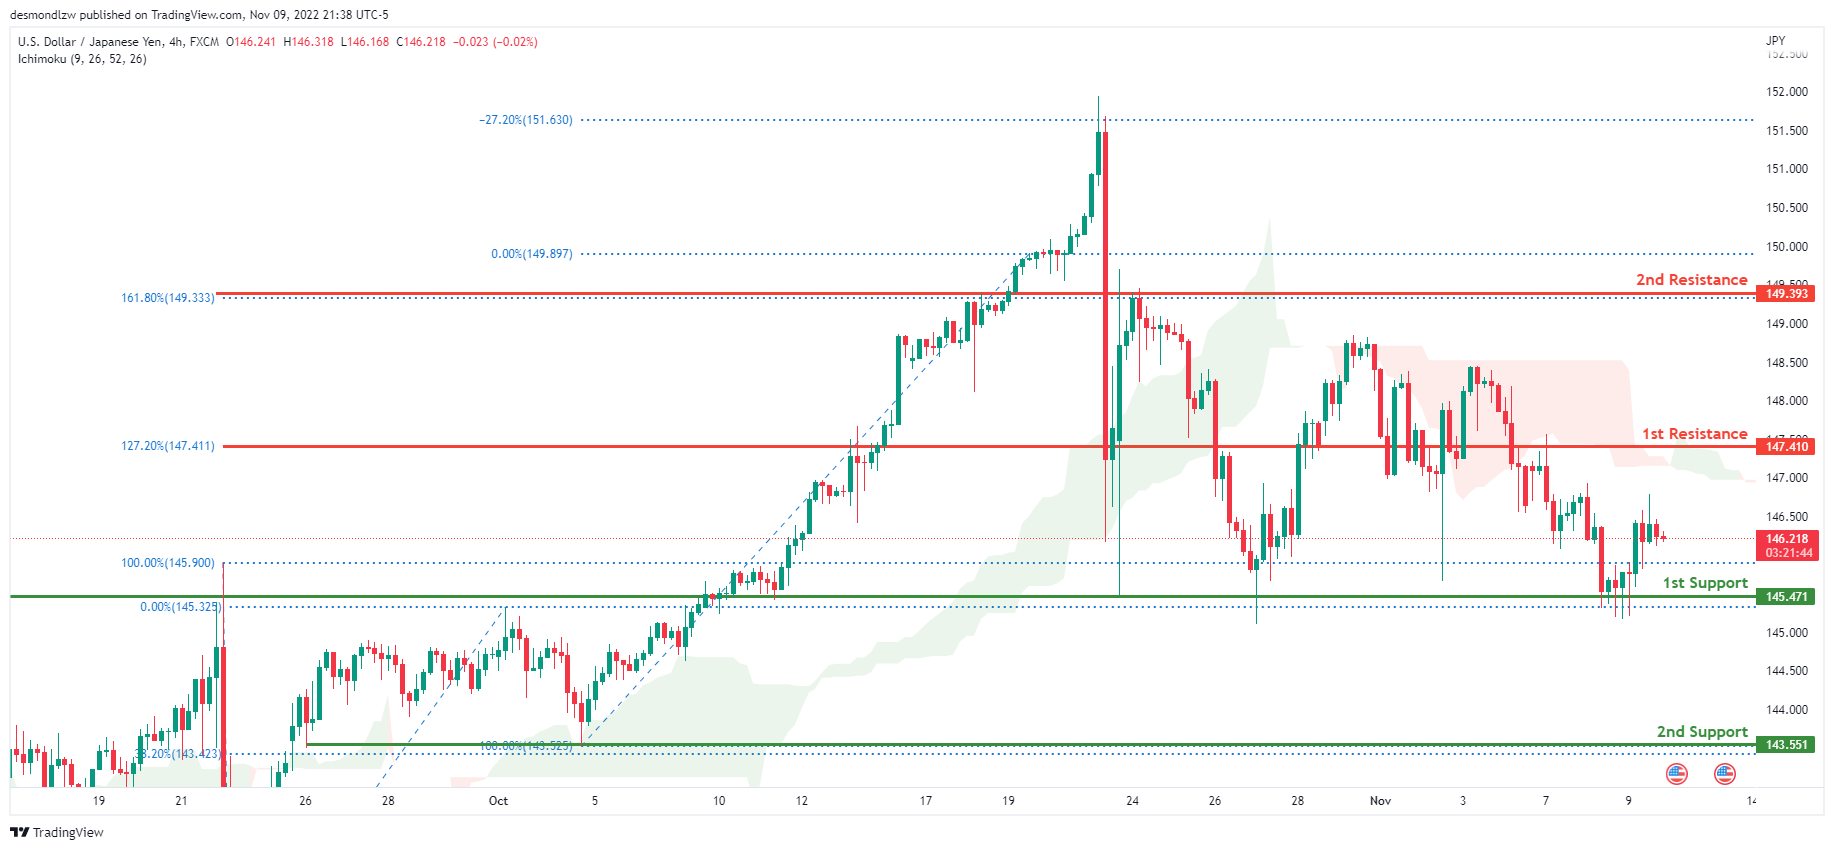
The current general bias for USDJPY on the H4 chart is bearish. To add confluence to this, the price is below the Ichimoku cloud which indicates a bearish market. Overnight, USDJPY had some bullish momentum with price heading upwards away from the 1st support line. Price is currently trading at 146.253 at time of writing. If the bearish momentum continues, expect USDJPY to break the 1st support line at 145.471, where the 100% and 0% Fibonacci lines are located and head towards the 2nd support line at 143.551 where the 38.2% and 100% Fibonacci lines are located. In an alternative scenario, price could break above the 1st resistance and head towards the 2nd resistance at 149.393 where the 161.8% and 0% Fibonacci lines are located.
Areas of consideration:
- H4 time frame, 1st resistance at 147.410
- H4 time frame, 1st resistance at 149.393
- H4 time frame, 1st support at 145.471
DXY:
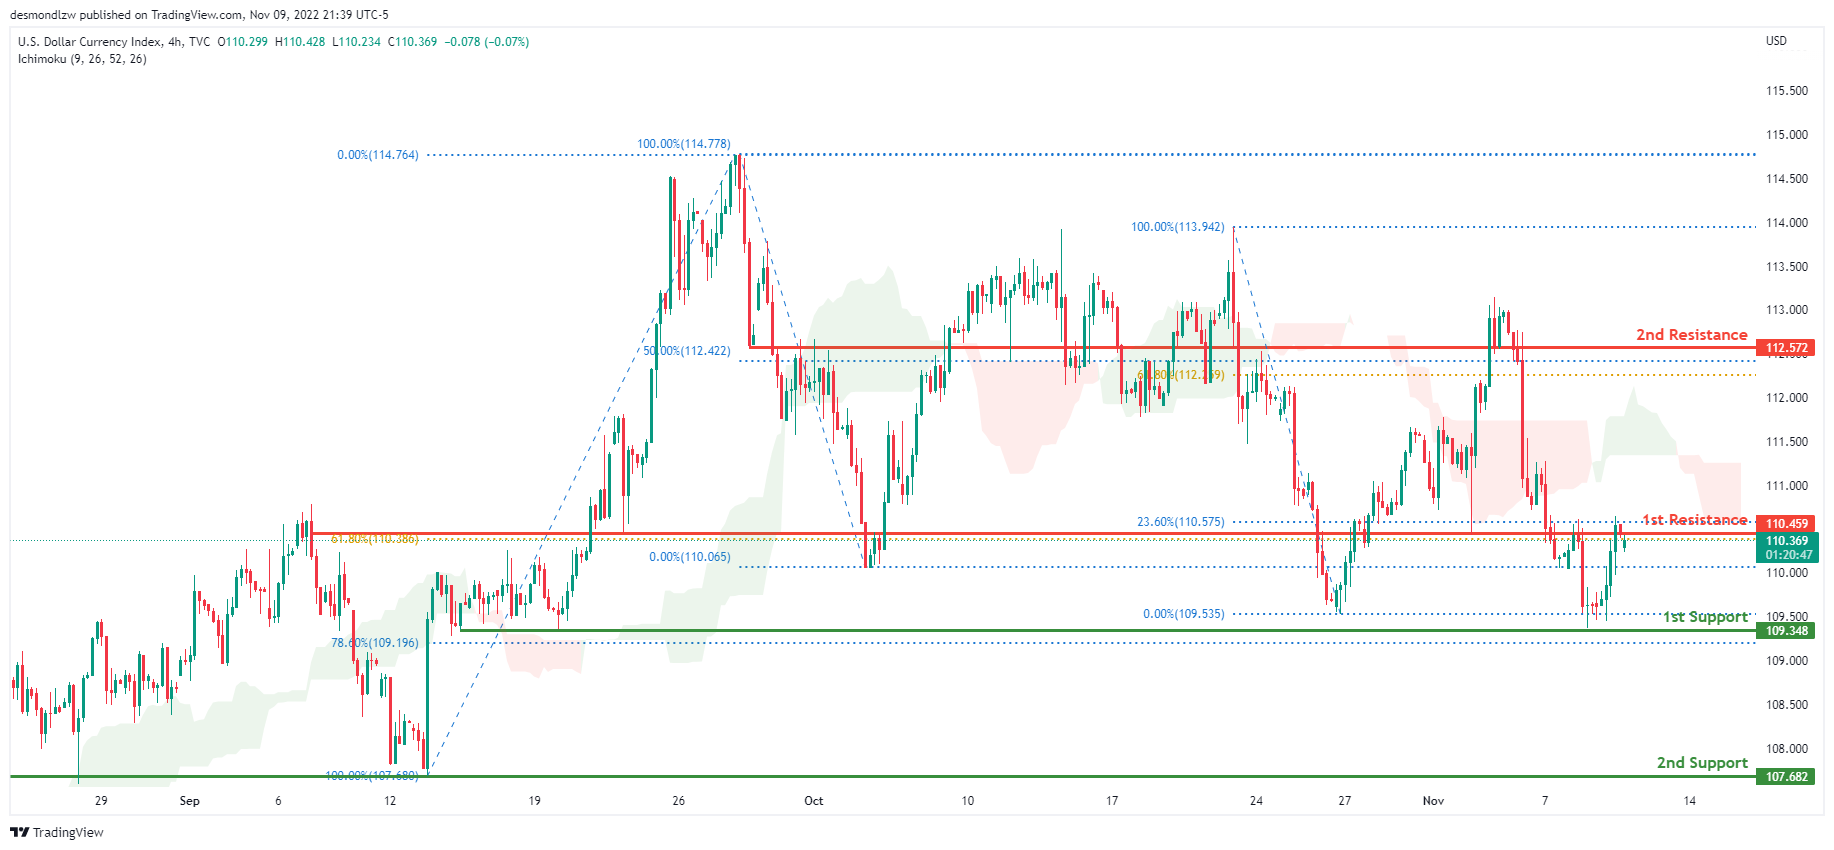
On the H4 chart, the overall bias for DXY is bearish. To add confluence to this, the price is below the Ichimoku cloud which indicates a bearish market. Overnight, price had bullish momentum upwards with the price closing just under the 1st resistance at 110.459 where the 61.8% and 23.6% Fibonacci lines are located. The price is currently trading at 110.335 at the time of writing. If this bearish momentum continues, price could head towards the 1st support line at 109.348 where the 78.6% Fibonacci line and previous low are located. In an alternative scenario, price could head back up and break the 1st resistance line before heading towards the 2nd resistance line at 112.572 where the 50% and 61.8% Fibonacci lines are located.
Areas of consideration:
- H4 time frame, 1st resistance at 110.459
- H4 time frame, 2nd resistance at 112.572
- H4 time frame, 1st support at 109.348
EUR/USD:
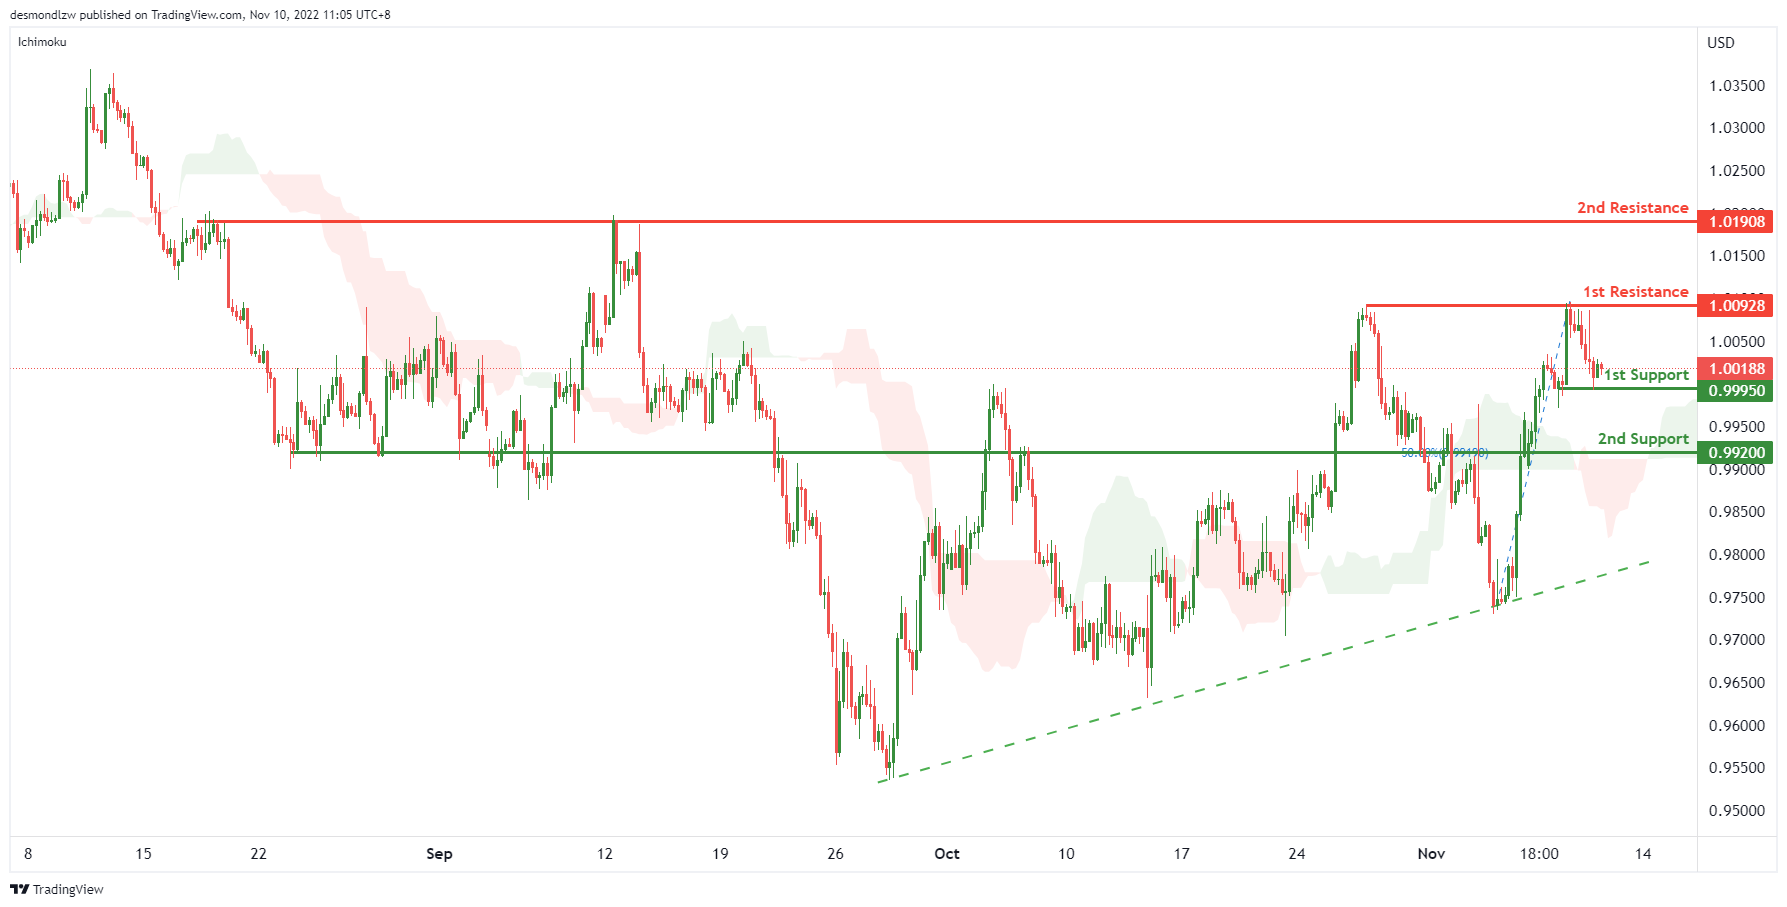
On H4, with the price moving above the ichimoku cloud and ascending trendline, we have a bullish bias that the price may rise to the 1st resistance at 1.00928, which is in line with the swing highs. If the 1st resistance is broken, the 2nd resistance is at 1.01908, where the previous swing highs are. Alternatively, the price may drop to the 1st support at 0.99950, where the previous swing low is. If the 1st support is broken, the 2nd support is at 0.99200, where the 50% fibonacci retracement sits.
Areas of consideration :
- H4 1st resistance at 1.00928
- H4 1st support at 0.99950
GBP/USD:
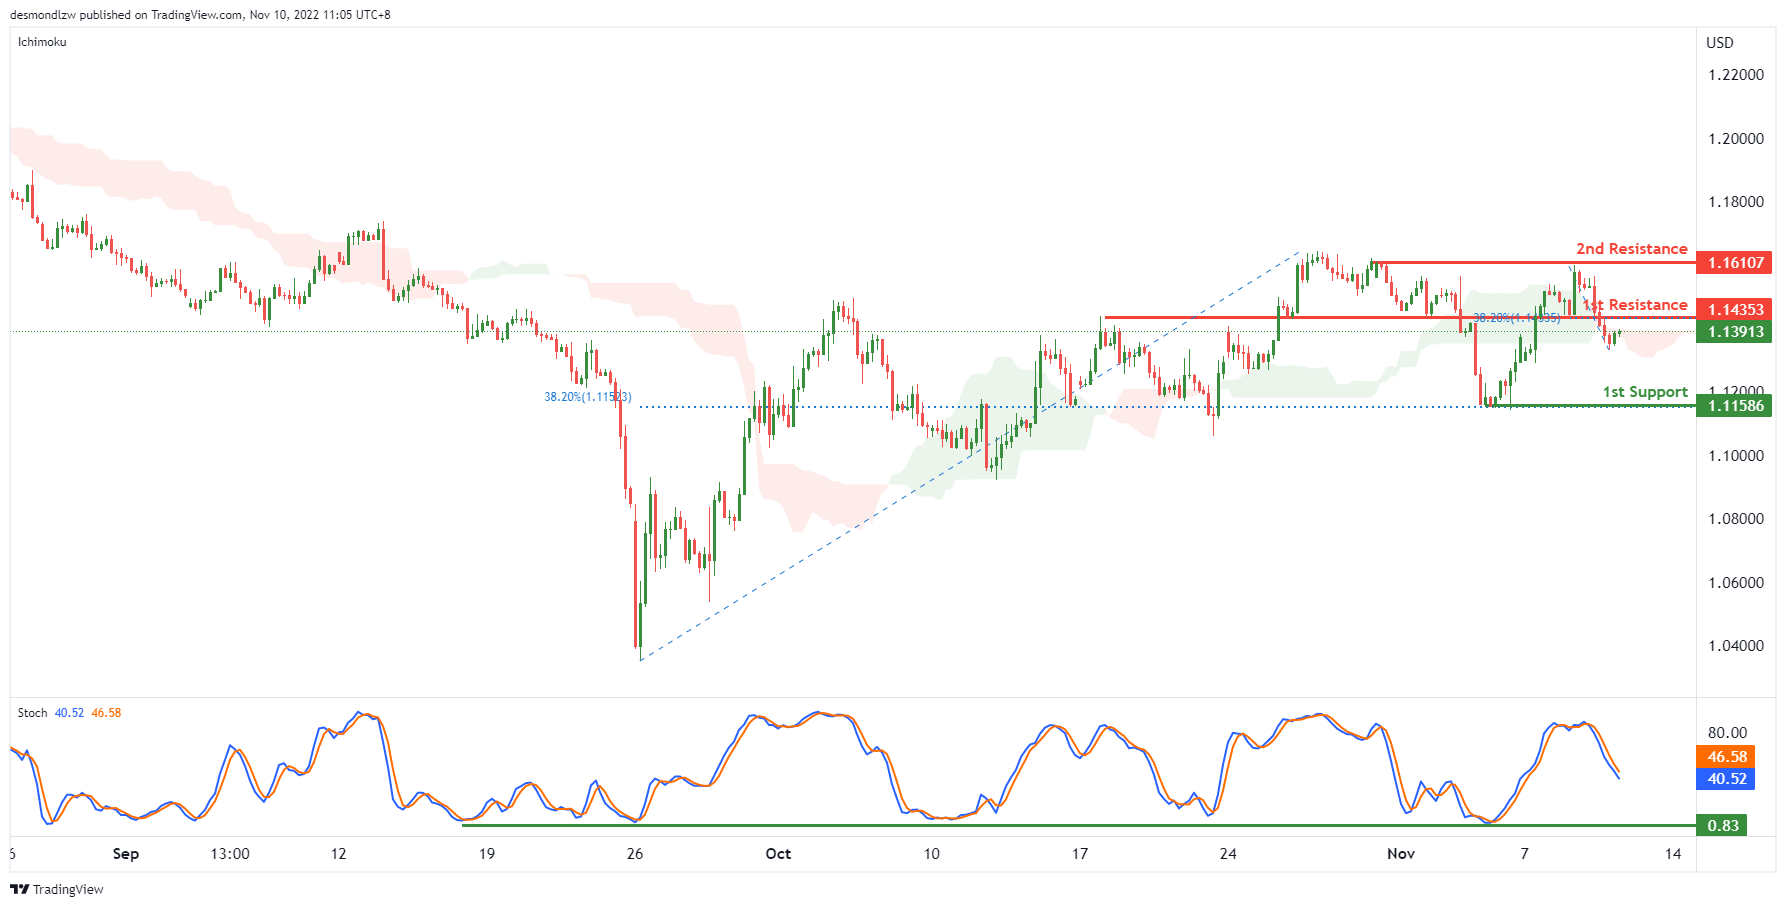
On the H4, price is crossing the ichimoku cloud and Stoch is dropping to the support level, we have a bearish bias that the price may drop from the 1st resistance at 1.14353, which is in line with the 38.2% fibonacci retracement and overlap resistance to the 1st support at 1.1586, where the previous swing low and 38.2% fibonacci retracement are. Alternatively, the price may rise to the 2nd resistance at 1.16107, where the previous swing high is.
Areas of consideration:
- H4 1st resistance at 1.14353
- H4 1st support at 1.1586
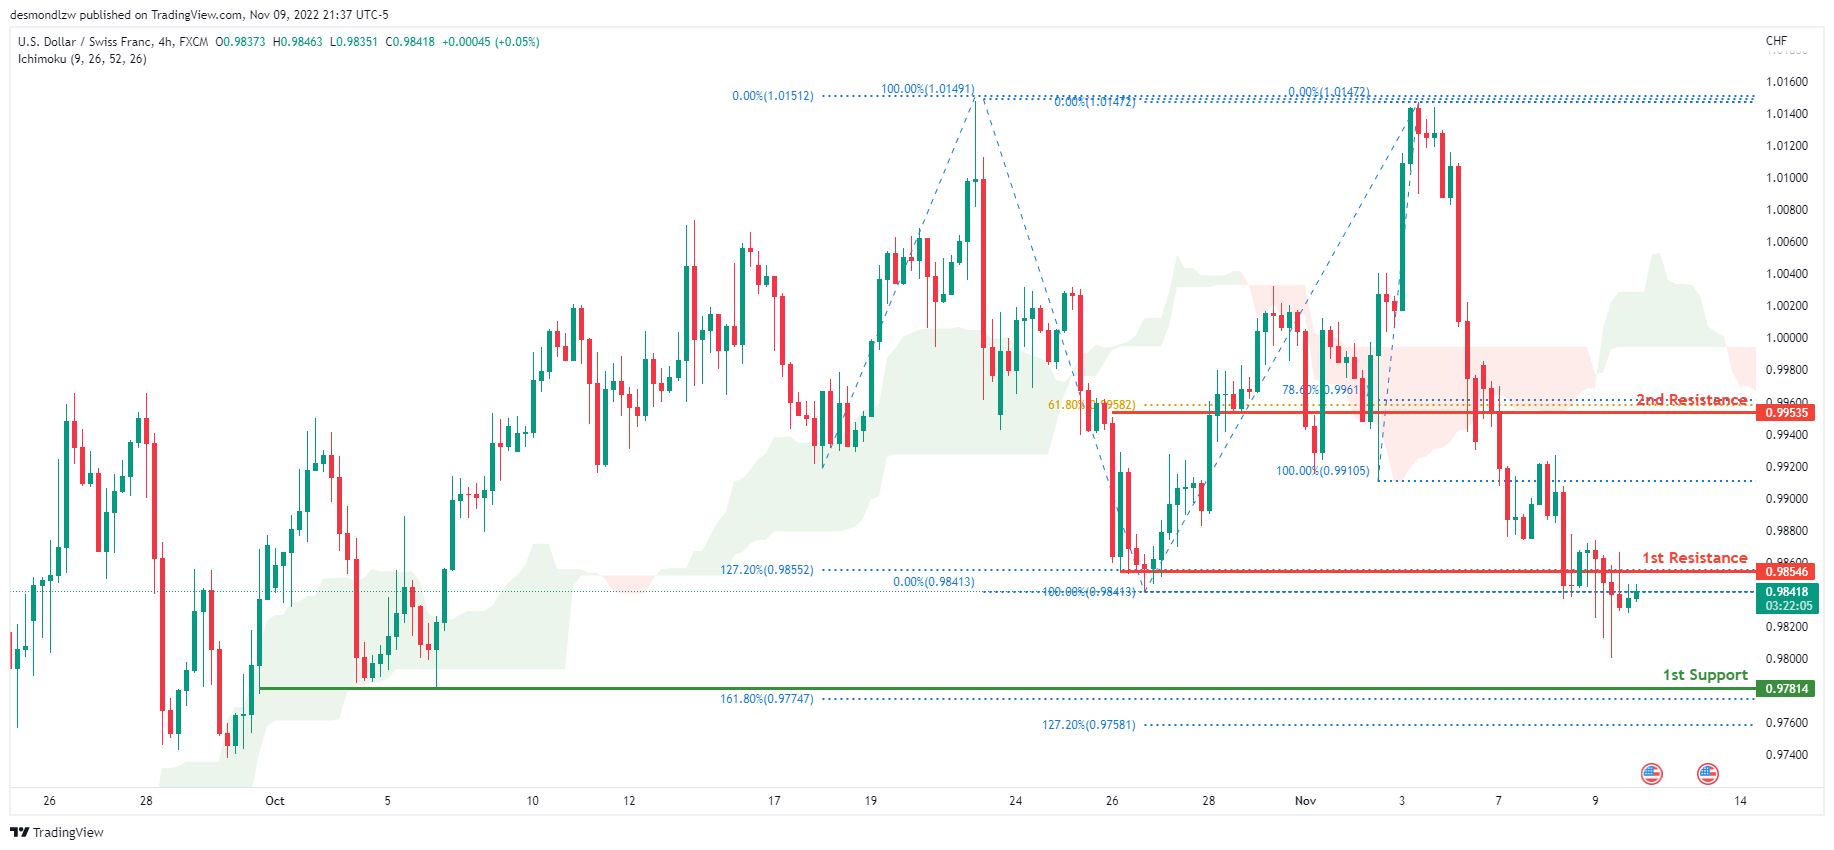
USD/CHF:
On the H4 chart, the overall bias for USDCHF is bearish. To add confluence to this, the price is below the Ichimoku cloud which indicates a bearish market. Overnight, price continued its bearish momentum downwards with price resting just below the 1st resistance line at 0.98546, where the 127.2% Fibonacci extension line, 100% Fibonacci line and previous swing low are located. The price is currently trading at 0.98396 at the time of writing. If this bearish momentum continues, expect price to head towards the 1st support line at 0.97814, where the 127.2% and 161.8% Fibonacci extension lines are located. In an alternative scenario, price could head back up to retest the 1st resistance line.
Areas of consideration
- H4 1st support at 0.97814
- H4 1st resistance at 0.98546
XAU/USD (GOLD):
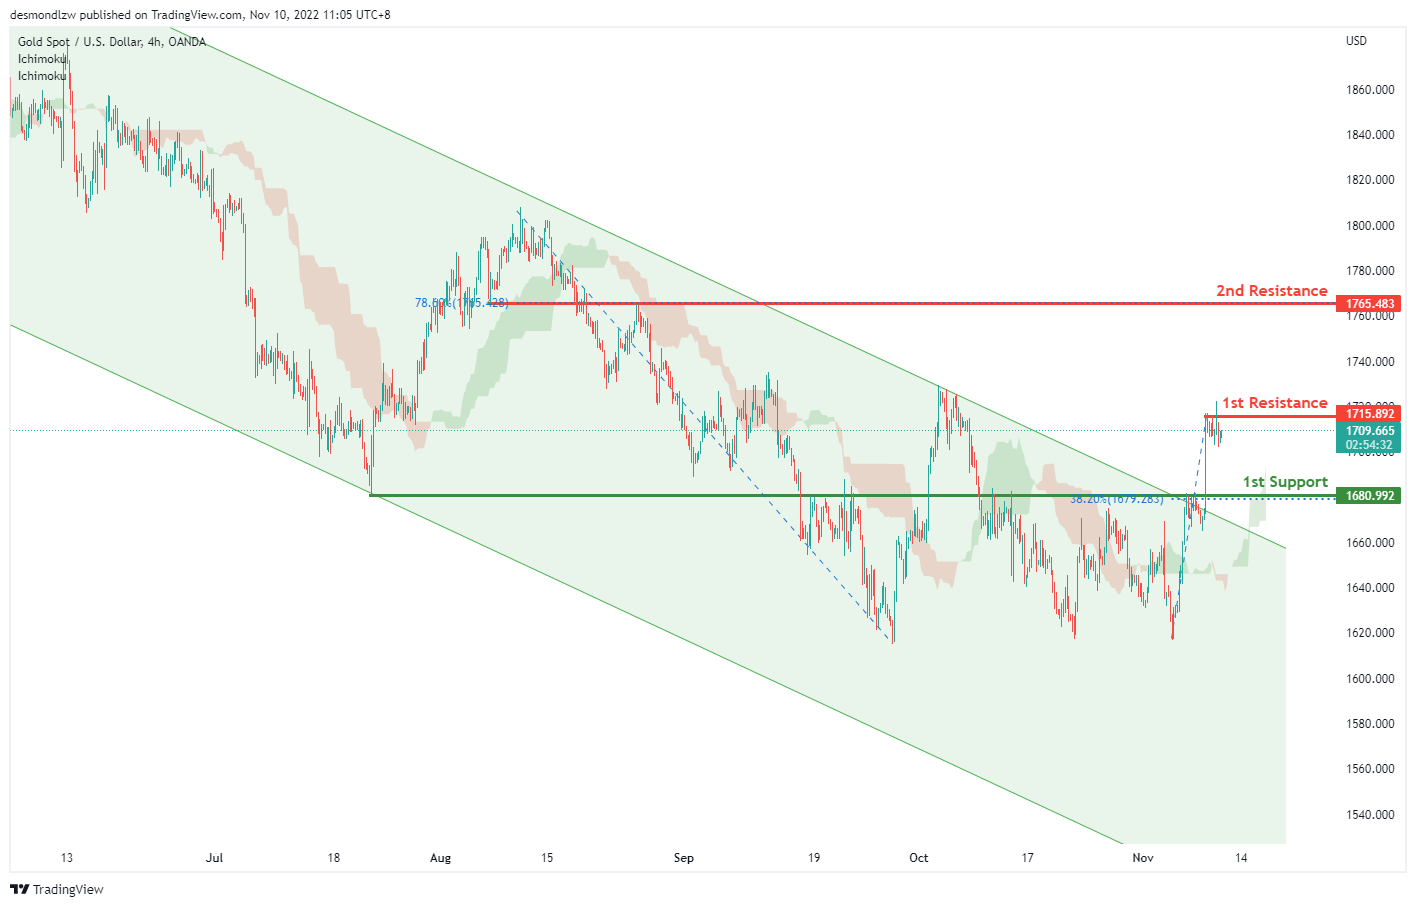
On H4, with the price breaking the descending channel and above the ichimoku cloud, we can expect the price rise to the 1st resistance at 1715.892, which is in line with the previous swing high, if the 1st resistance is broken, the 2nd resistance is at 1765.483, where the 78.6% fibonacci retracement is. Alternatively, the price may drop to the 1st support at 1680.992, where the 38.2% fibonacci retracement is.
Areas of consideration:
- H4 time frame, 1st resistance at 1715.892
- H4 time frame, 2nd resistance is at 1765.483
AUD/USD:
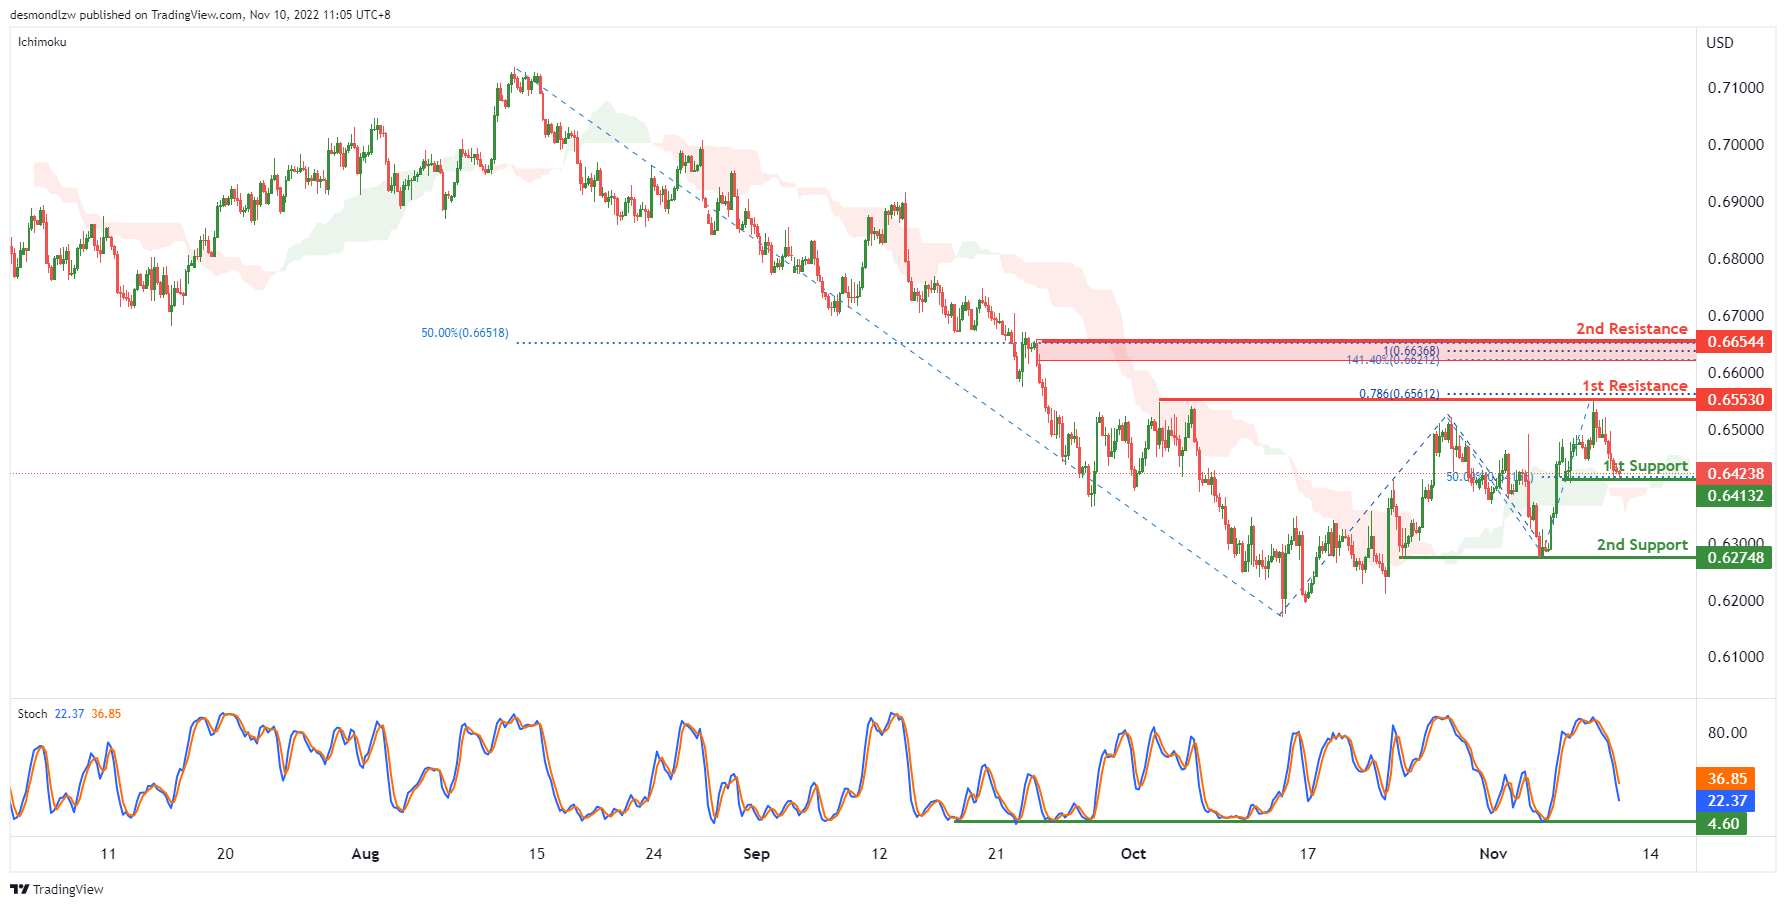
On the H4, with the stoch dropping to test the support level, we can expect the price break the 1st support at 0.64132, which is in line with the 50% fibonacci retracement and drop to the 2nd support at 0.62748, where the previous swing low is. Alternatively, the price may rise to the 1st resistance at 0.65530, where the swing highs are and 78.6% fibonacci projection are. If the 1st resistance is broken, the 2nd resistance is at 0.66544, where the 100% fibonacci projection, 50% fibonacci retracement and 141.4% fibonacci extension are.
Areas of consideration
- H4, 1st support at 0.64132
- H4, 2nd support at 0.62748,
NZD/USD:
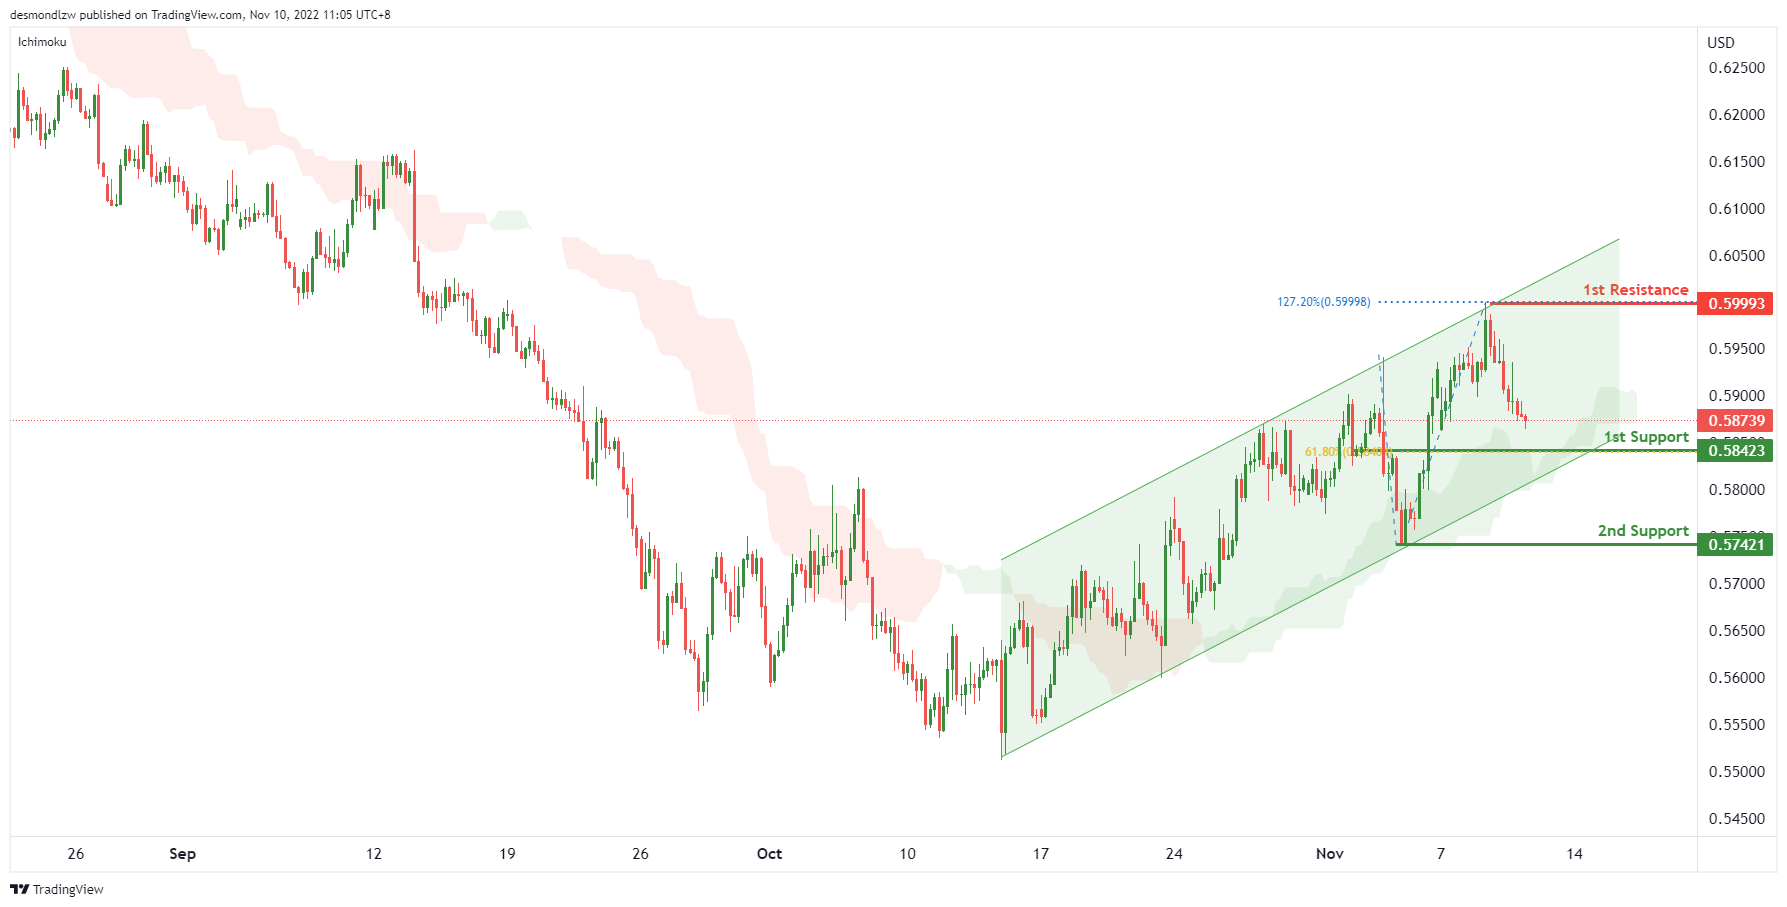
On the H4 chart, as the price is moving above ichimoku cloud and ascending channel, the price may drop to the 1st support at 0.58423, where the 61.8% fibonacci retracement is and rise to the 1st resistance at 0.59993, where the swing high and 127.2% fibonacci extension are. Alternatively, the price may drop to the 2nd support at 0.57421, which is in line with the previous swing low.
Areas of consideration:
- H4 time frame, 1st support at 0.58423
- H4 time frame, 1st resistance at 0.59993
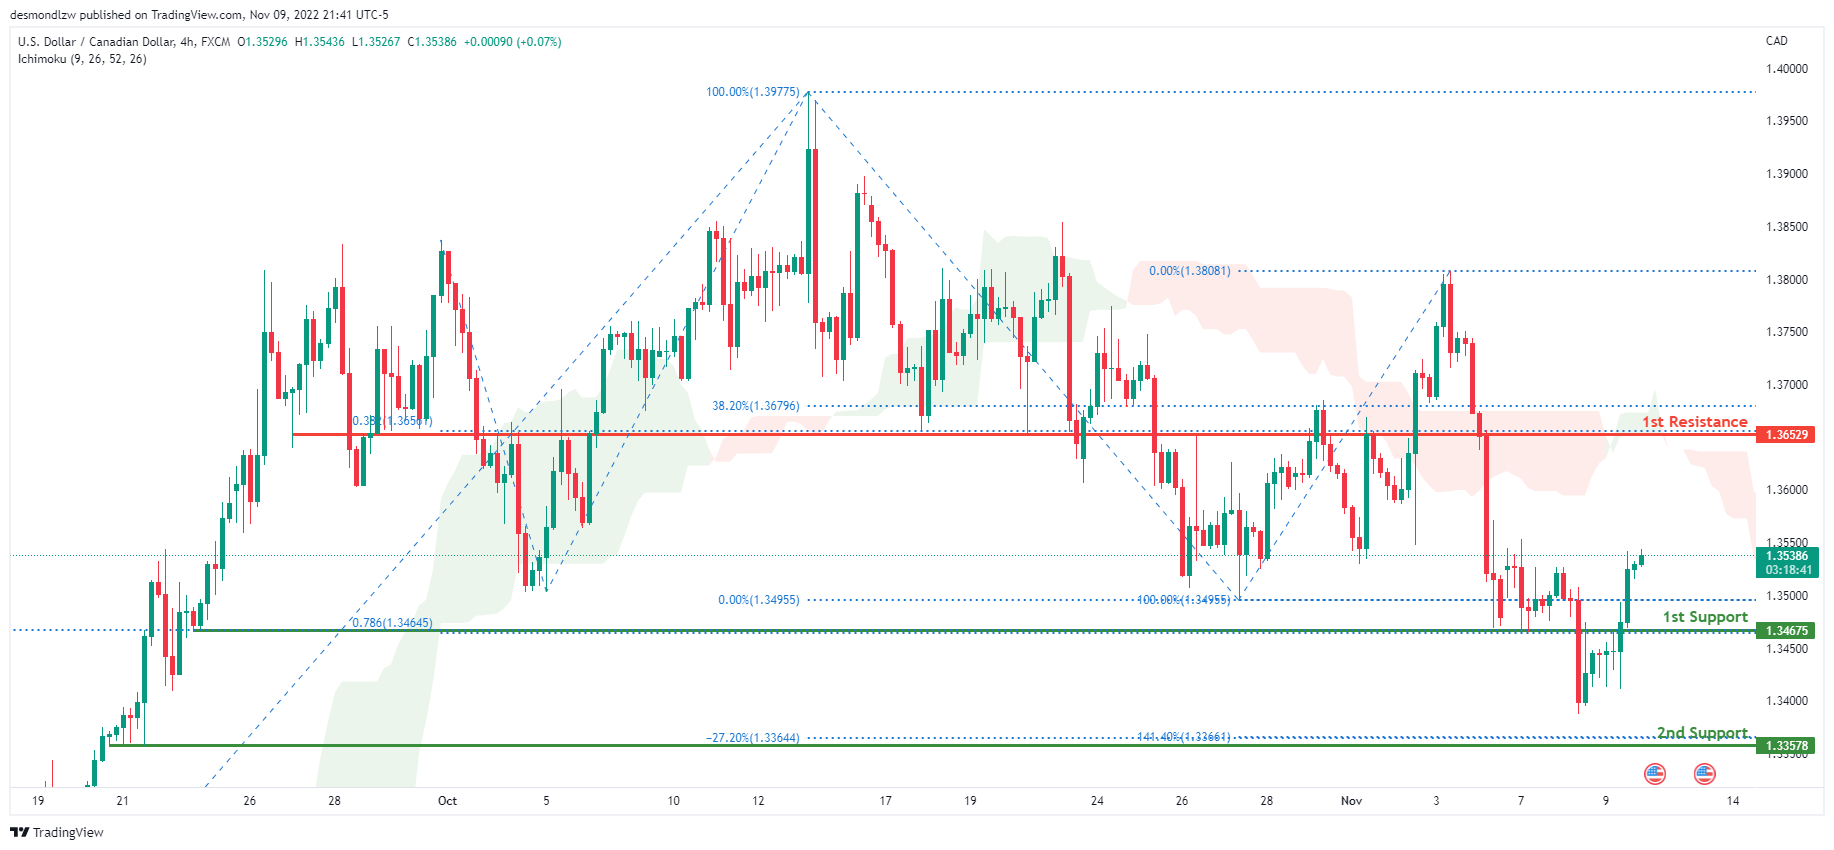
USD/CAD:
On the H4 chart, the overall bias for USDCAD is bearish. To add confluence to this, the price is below the Ichimoku cloud which indicates a bearish market. Overnight, the price had bullish momentum upwards with the price closing above the 1st support line at 1.34675 where the 78.6% Fibonacci projection line and previous low is located. The price is currently trading at 1.35395 at the time of writing. If this bearish momentum continues, expect the price to head back down towards the 1st support line. In an alternative scenario, price could head back up towards the 1st resistance line at 1.36529, where the 38.2% Fibonacci line and 38.2% Fibonacci projection line is located.
Areas of consideration:
- H4 time frame, 1st resistance at 1.36529
- H4 time frame, 1st support at 1.34675
OIL:
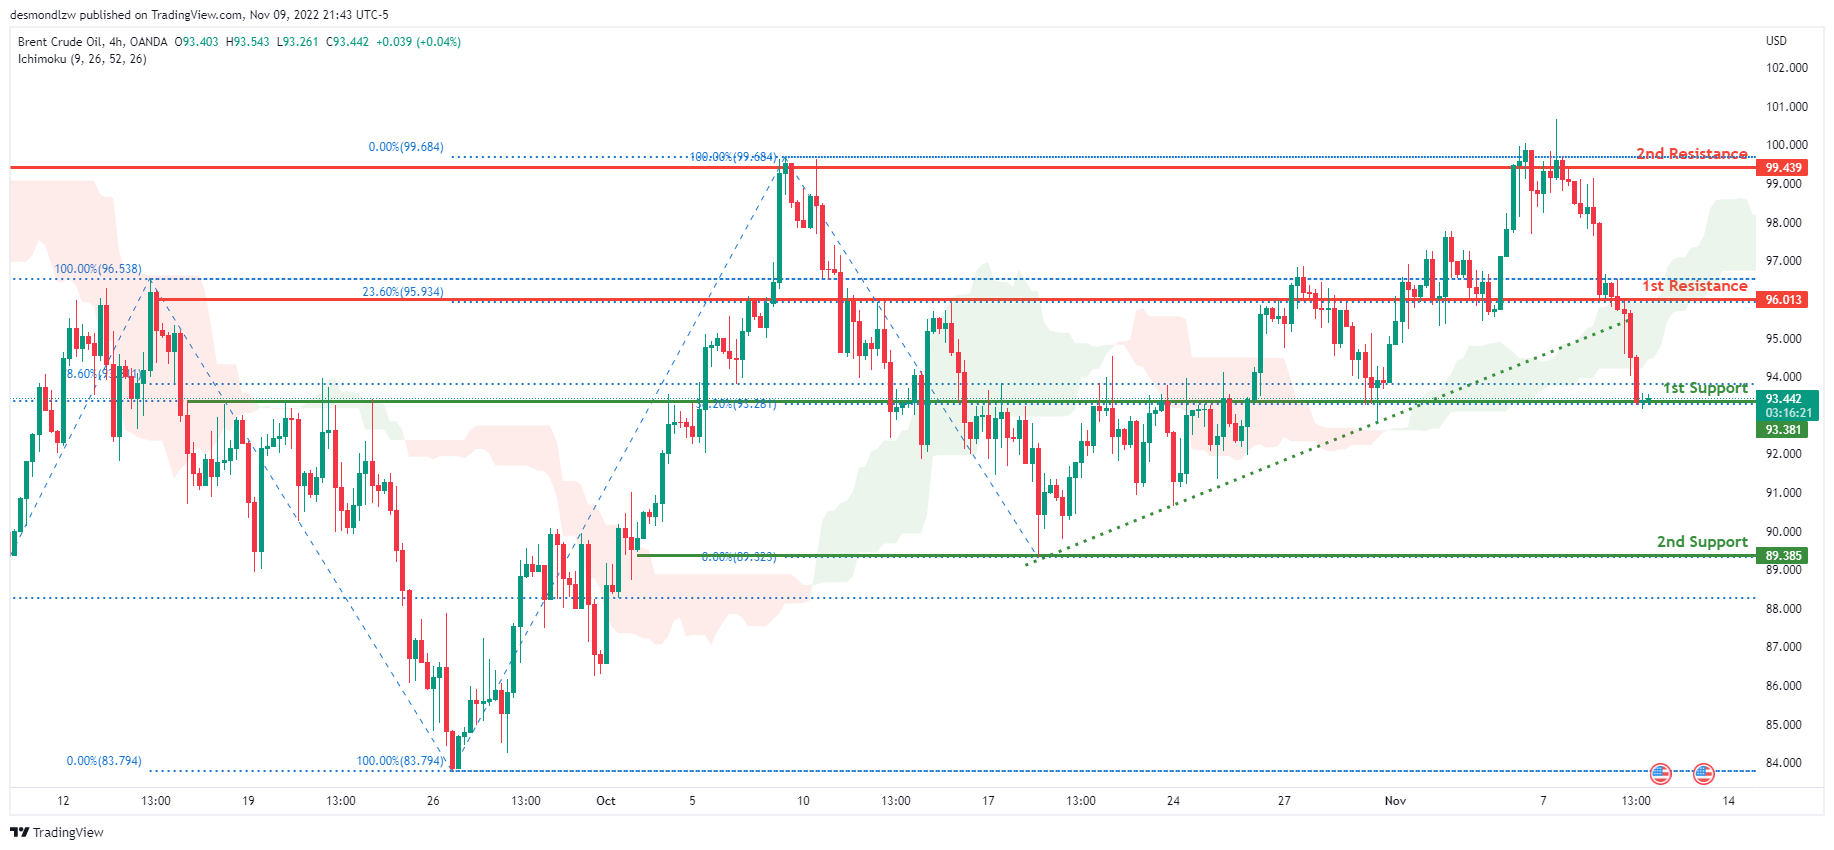
Looking at the H4 chart, the current overall bias for Oil is bearish. To add confluence to this, the price is below the Ichimoku cloud which indicates a bearish market. Overnight, price had bearish momentum downwards with the price currently resting on the 1st support line at 93.381 where the 38.2% and 78.6% Fibonacci lines are located.The price is currently trading at 93.452 at the time of writing. If this bearish momentum continues, expect price to break the 1st support line and head towards the 2nd support line at 89.385 where the previous low and 0% Fibonacci line is located. In an alternative scenario, price could head back down to retest the 1st resistance level at 93.381 where the 38.2% and 78.6% Fibonacci lines are located.
Areas of consideration:
- H4 time frame, 1st resistance at 96.013
- H4 time frame, 1st support at 93.381
- H4 time frame, 2nd support at 93.381
Dow Jones Industrial Average:
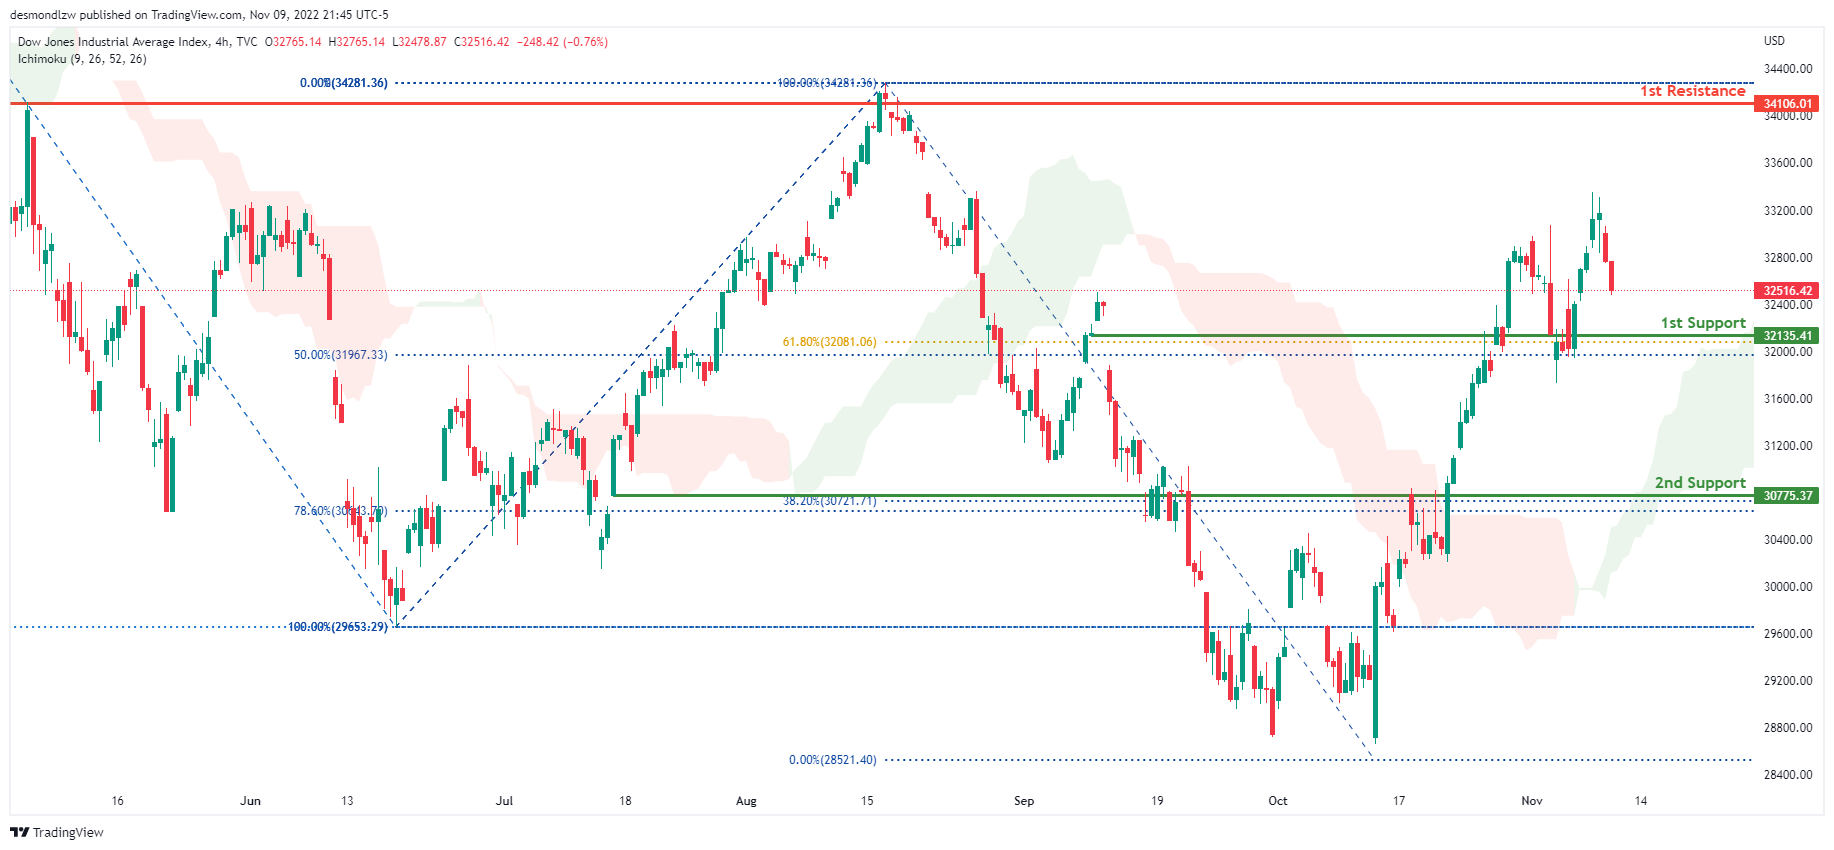
On the H4 chart, the overall bias for DJI is bullish. To add confluence to this, the price is above the Ichimoku cloud which indicates a bullish market. Overnight, price had some bearish momentum downwards. The price is currently trading at 33135.41 at time of writing. If this bullish momentum continues, expect the price to possibly head towards the 1st resistance at 34106.01 where the previous high and 100% Fibonacci line is located. In an alternative scenario, price could head towards the 1st support line at 32135.41, where the 61.8% and 50% Fibonacci lines are located.
Areas of consideration:
- H4 time frame, 1st support at 32135.41
- H4 time frame, 1st Resistance at 34106.01
DAX:
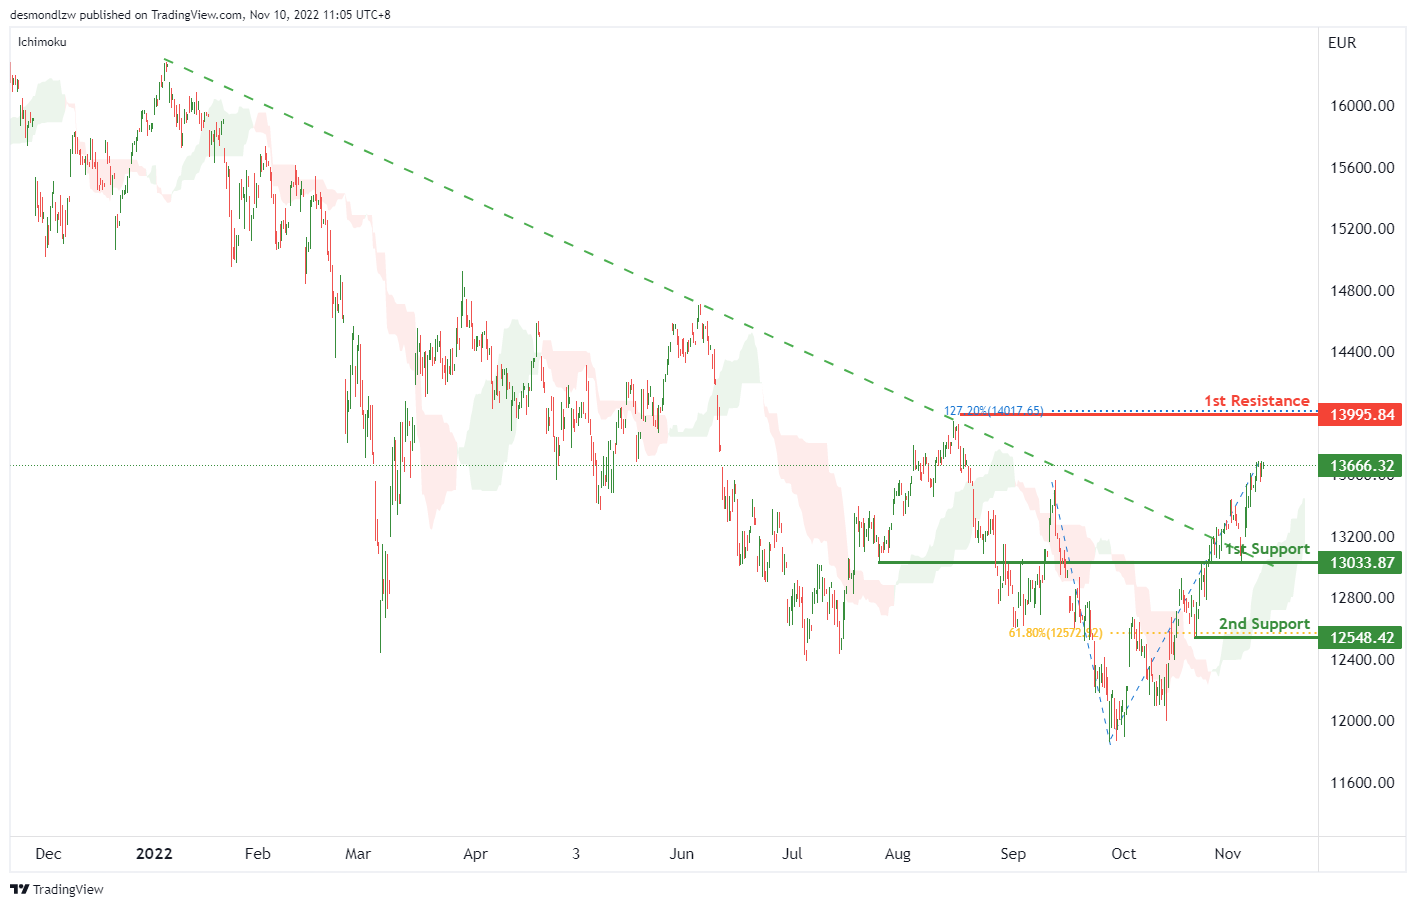
On the H4 chart, the price breaks a descending trendline. Expecting price to possibly continue this bullish momentum and rise to the 1st resistance is at 13995.84, where 127.2% fibonacci extension sits. Alternatively, the price may drop to the 1st support at 13033.87, which is in line with the previous swing low, if the 1st support is broken, the 2nd support is at 12548.42, which is in line with the 61.8% fibonacci retracement.
Areas of consideration:
- H4 time frame, current price
- H4 time frame, 1st resistance is at 13995.84
ETHUSD:
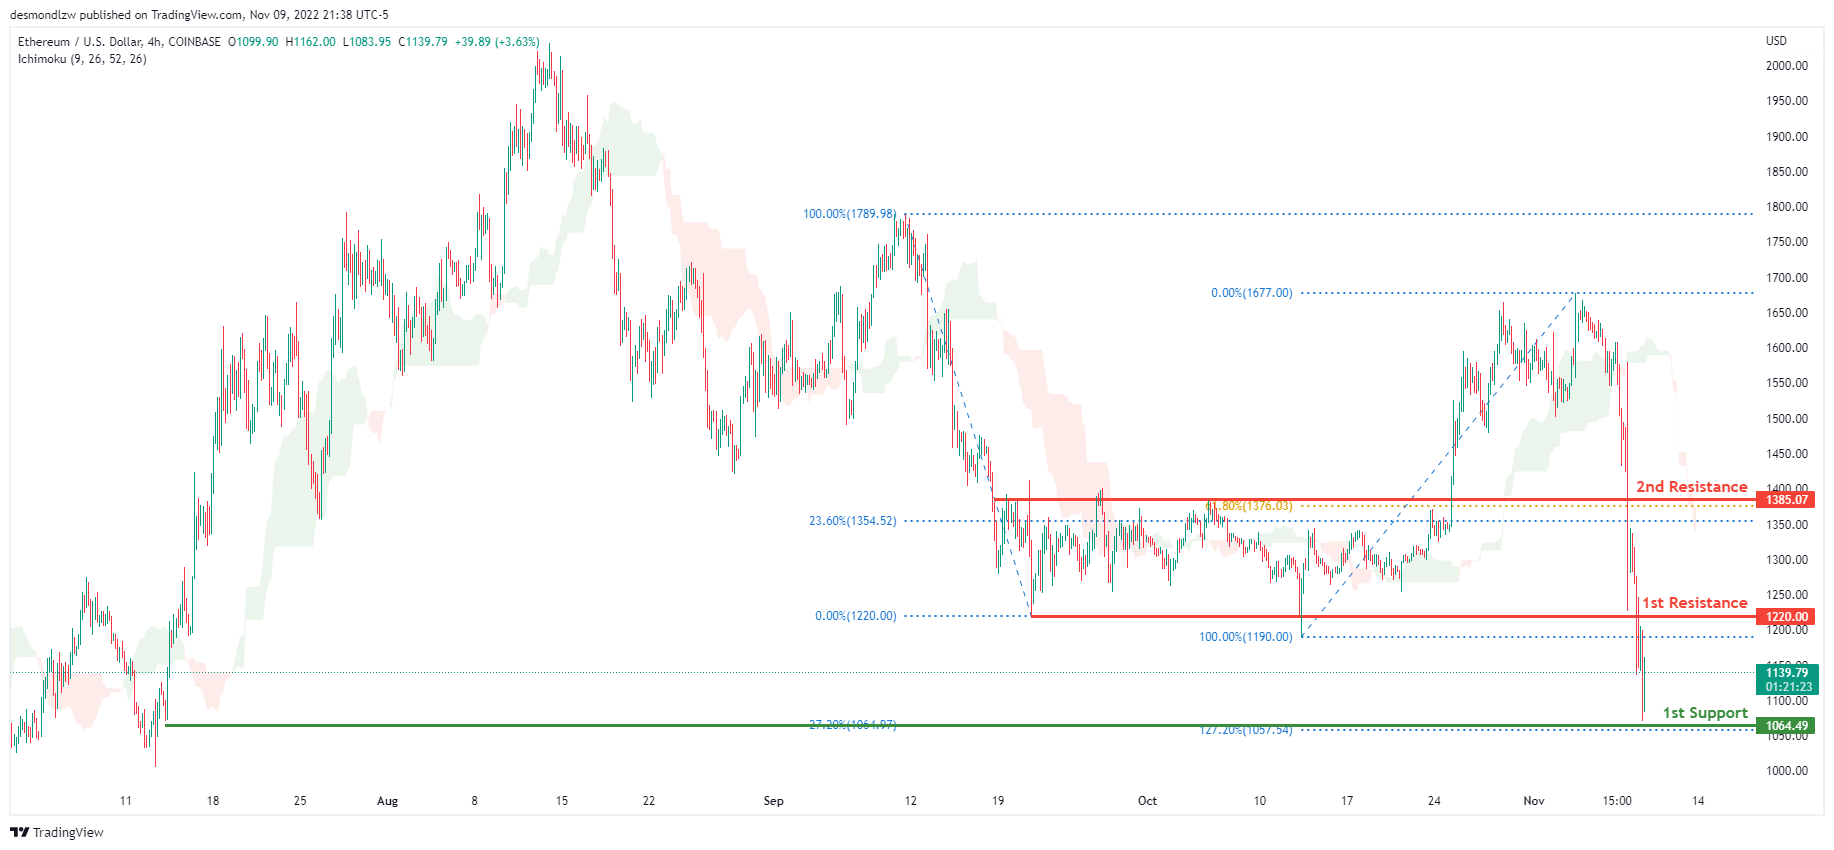
Looking at the H4 chart, the current overall bias for ETHUSD is bearish, with price currently under the Ichimoku cloud indicating a bearish market. Overnight, prices had huge bearish momentum downward with the price closing under the 1st resistance line at 1220.00 where the previous low and 100% Fibonacci line was located. The price is currently trading at 1064.49 at the time of writing. If this bearish momentum continues, expect the price to head towards the 1st support line at 1064.49 where the -27.2% Fibonacci expansion and 127.2% Fibonacci extension line is located. In an alternative scenario, price could head back up to retest the 1st resistance line .
Areas of consideration:
- H4 time frame, 1st resistance of 1220.00
- H4 time frame, 1st support at 1064.49
BTCUSD:
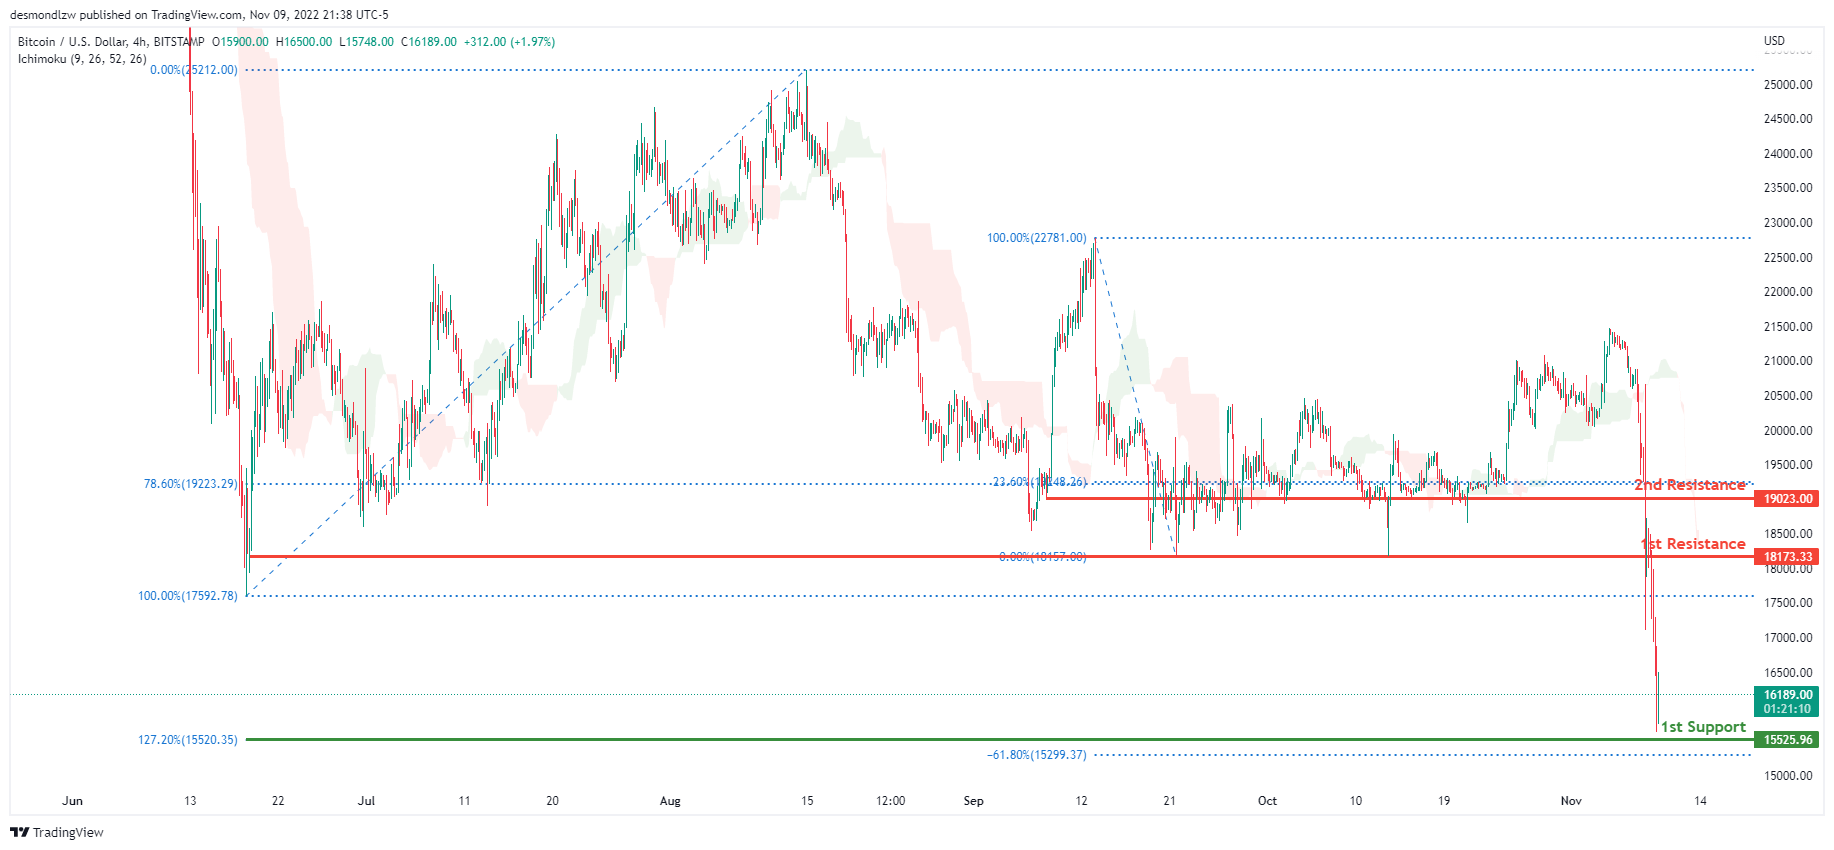
On the H4 chart, the overall bias for BTCUSD is bearish. To add confluence to this, the price is below the Ichimoku cloud which indicates a bearish market. Overnight, price continued its huge downwards bearish momentum with price currently above the 1st support line at 15525.96, where the 127.2% Fibonacci extension line and -61.8% Fibonacci expansion line is located . Price is currently trading at 16226.00 at time of writing. If this bearish momentum continues, expect the price to head towards the 1st support line. In an alternative scenario, price could retrace back up to retest the 1st resistance line at 18173.33, where the previous low and 0% Fibonacci line is located.
Areas of consideration:
- H4 time frame, 1st resistance 18173.33
- H4 time frame, 1st support at 15525.96
S&P 500:
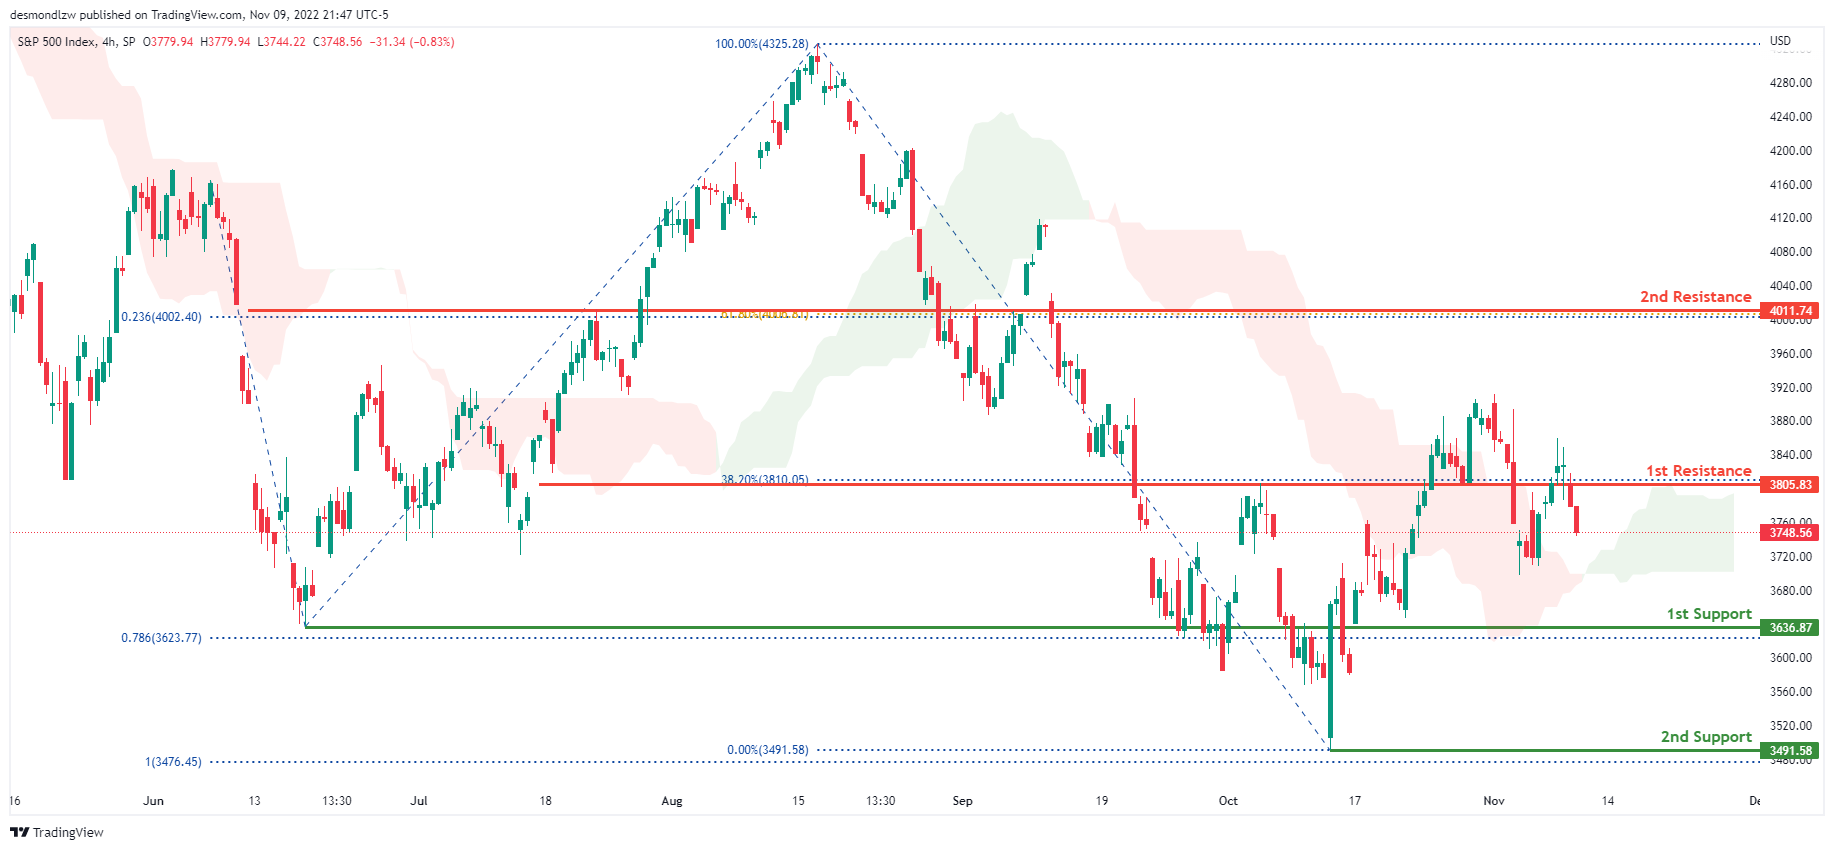
On the H4 chart, the overall bias for S&P500 is bullish with price above the Ichimoku cloud. Overnight, price had bearish momentum with the price closing under the 1st resistance at 3805.83 where the 38.2% Fibonacci line is located. The price is currently trading at 3748.56 at time of writing. If bullish momentum continues, expect the price to head back up to retest the 1st resistance line. In an alternative scenario, price could possibly head back down towards the 1st support line at 3636.87 where the previous swing low and 78.6% Fibonacci projection line is located.
Areas of consideration:
- H4 time frame, 1st support at 3636.87
- H4 time frame, 2nd support at 3491.58
- H4 time frame, 1st resistance at 3805.83
BoJ Kuroda: Premature to lay out details of exit strategy
BoJ Governor Haruhiko Kuroda told the parliament, "it's premature to lay out details of an exit strategy. But one major factor of debate will be the pace of increase in the BoJ's short-term policy rate, now set at -0.1%."
"Another factor would be how to adjust its balance sheet," he said, noting that other major central banks adopted the sequence of interest rate hike first, then shrinking balance sheet.
"It's extremely important for the BOJ to underpin the economy with ultra-loose monetary policy and ensure the necessary environment is falling into place for companies to hike wages," Kuroda emphasized.
Fed Kashkari: Any talk of a pivot is entirely premature
Minneapolis Federal Reserve Bank President Neel Kashkari said, "at the next meeting, which is mid-December, I don't know what we are going to do."
"There's a lot of talk in the public about might we raise rates by 50 basis points, might we raise rates by 75 basis points - those are certainly going to be on the table, but could it be something beyond that? It's possible too," he added.
Fed's dual mandate, price stability and maximum employment could come into tension at a certain point. However, Kashkari said, "we are a long, long, long way away from that right now, so that's why any talk of a pivot is entirely premature."
Fed Evans: There’s benefits to adjusting tightening pace soon
Chicago Fed President Charles Evans said yesterday, "there's benefits to adjusting the pace (of tightening) as soon as we can."
"I'm hopeful that we're getting to a point where the dynamics for inflation turning over and returning towards our 2% objective will be put in place, if not very soon, soon, and we'll actually see it in inflation," he said.
"If you don't begin to think about adjusting the pace, taking account of lags, and you just keep increasing rates by a large amount every time you get a disappointing report," then "next thing you know, you're at a very high federal funds rate."
"I'm going to continue to be nervous that, as we go higher than that, it could be that the economy is going to face more challenges, and that that could present risks on the 'real' side, the full employment mandate," he said. "It's a risk."
Is the UK Economy One Step Closer to Recession?
Following last week’s dovish triple hike by the Bank of England, pound traders are now likely to turn their attention to the first estimate of the UK GDP for Q3 due out on Friday at 07:00 GMT. Expectations are for the Office for National Statistics to confirm the BoE’s forecast of a contraction, but the big question is, how will the outcome affect market speculation with regards to the Bank’s future course of action and how will the pound react?
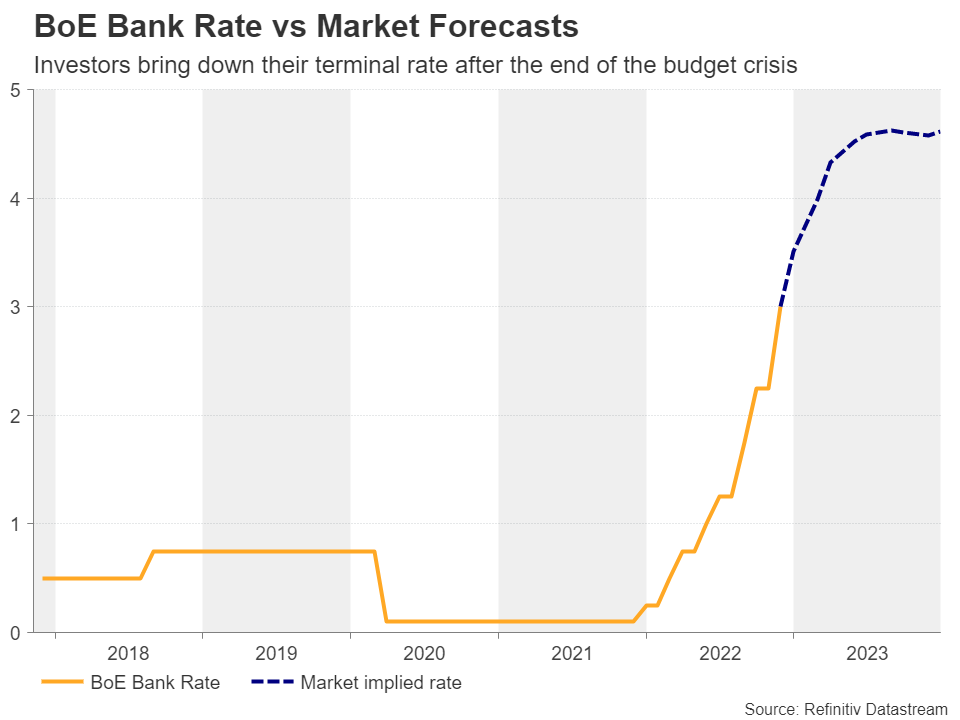
Investors expect smaller hikes by the BoE
At last week’s gathering, the BoE decided to raise interest rates by 75bps, the largest hike since 1989. However, the language accompanying the decision was much more dovish than expected, with officials warning of a prolonged recession and noting that interest rates are unlikely to match the peak implied by market pricing.
On top of that, two policymakers voted for a smaller increment at that meeting, which combined with the accompanying warnings, prompted market participants to bring down their implied rate path. Before the meeting and after the budget drama was over, investors had lifted their terminal rate to as high as 5.25%, but today they see it at around 4.63% in August 2023. They are also assigning around an 80% probability for a 50bps hike in December, with the remaining 20% pointing to a 75bps increment. They foresee only one more hike of the same size in February, while they are expecting quarter-point increments thenceforth.
An economic contraction is broadly anticipated
So, with all that in mind, traders may now shift their attention to the first estimate of the UK GDP for Q3. The consensus is for a 0.5% contraction, in line with the Bank’s view of a recession at the end of the year. More specifically, the Bank projected that the economy would decline by around 0.75% over the second half of 2022 and continue to contract throughout 2023 and the first half of 2024, marking the longest downturn on record.
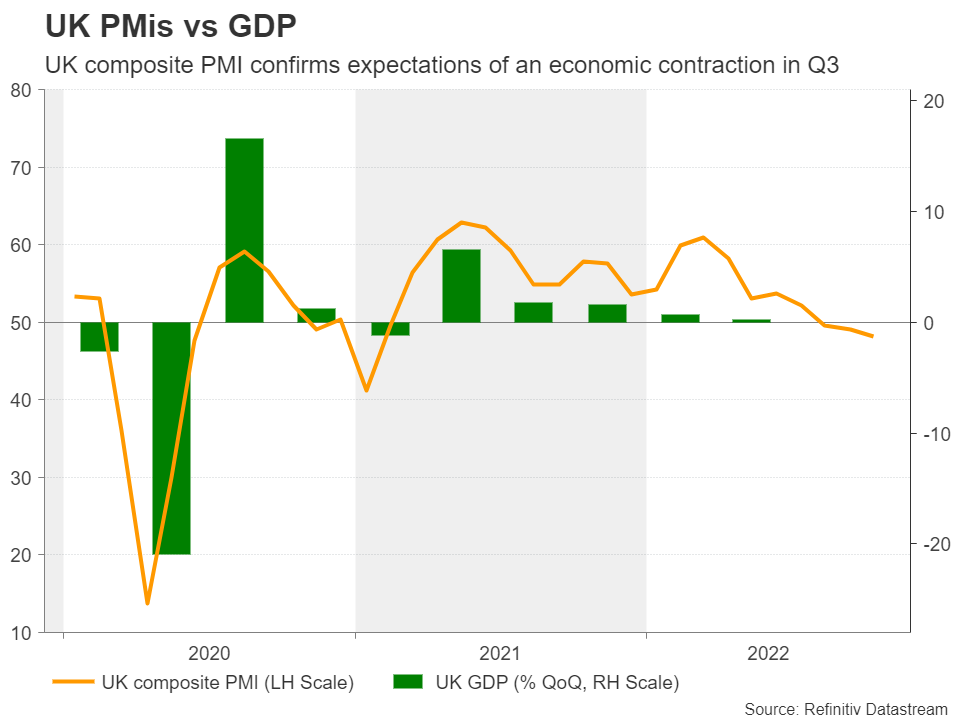
Conditional upon Friday’s number matching economists’ consensus, a contraction of at least 0.25% would be needed in Q4 for the Bank’s own forecast to materialize. In other words, Friday’s number may be well factored into the markets and therefore it is unlikely to hurt the pound much. After all, the PMIs have already set the stage for a negative growth rate in Q3. The composite index fell below the boom-or-bust zone of 50 in August and slid even further in September. For the pound to fall instantly, a negative surprise may be needed, as it could raise fears that the economic wounds are unfortunately deeper than expected.
Pound’s outlook remains gloomy
Nonetheless, even if the actual number matches the consensus and the pound does not instantly tumble, its path of least resistance possibly remains to the downside. The BoE seems to have shifted its focus from sky-high inflation to the bleeding economy, and a slower rate path while inflation is running at double digits is far from an encouraging development. What’s more, the government’s budget announcement on November 17 is expected to include some significant fiscal tightening, which implies downside risks to the Bank’s already lackluster projections, as officials were not able to include the potential impact in their November calculations.
The big question though is whether the pound will suffer more than the US dollar in the short run. Although the Fed sounded more hawkish than anticipated at last week’s gathering, the unexpected rise in the unemployment rate for October on Friday revived speculation over a slower rate path in the US. The overstretched fall in the dollar suggests that the Fed’s hawkishness may already be largely priced in, and that anything pointing to a pivot coming earlier than previously estimated may weigh further on the dollar.
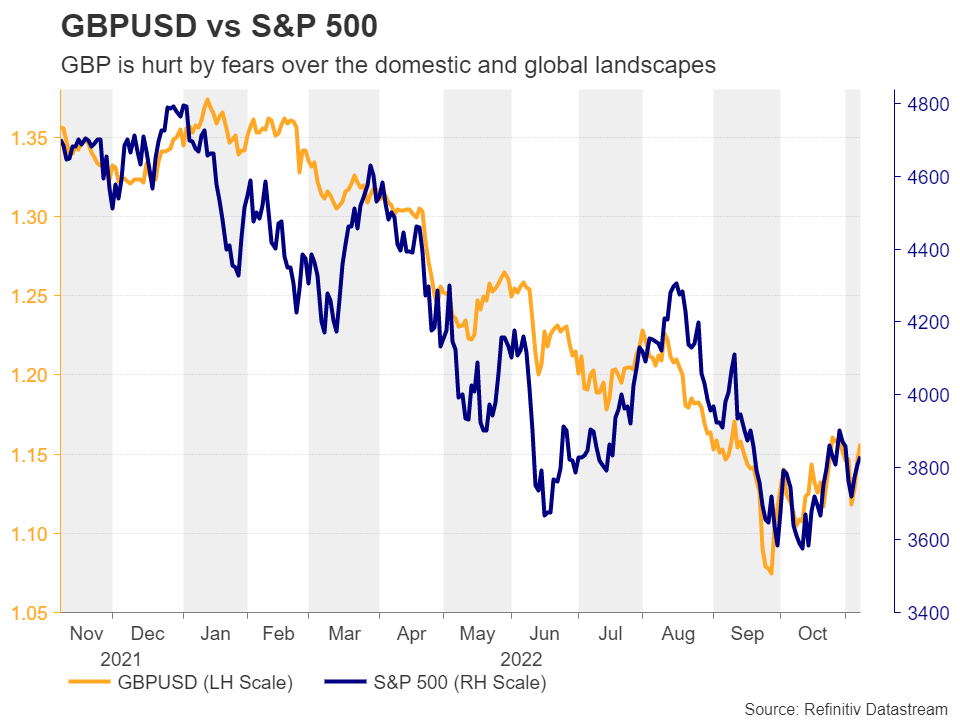
However, with the Fed still considered as a more hawkish central bank than the BoE, any further declines of the US dollar against the British pound may stay limited and short lived. On top of that, renewed global growth fears could add fuel to the safe haven’s engines and perhaps work against sterling, whose link to the broader market sentiment has strengthened recently, despite its correlation with the S&P 500 still being weaker than other traditional risk-linked currencies, like the aussie, kiwi and loonie.
Technical analysis also points to a downtrend
From a technical standpoint, pound/dollar remains below the downtrend line drawn from the high of February 23. The pair hit that line on Tuesday and pulled back somewhat on Wednesday. That said, although this still points to a bearish outlook, a break below the 1.1145 barrier may be needed to signal a trend resumption. Such a break would confirm a lower low on the daily chart and may initially pave the way towards the low of October 12 at 1.0920, where another dip could see scope for extensions towards the 1.0535 territory.
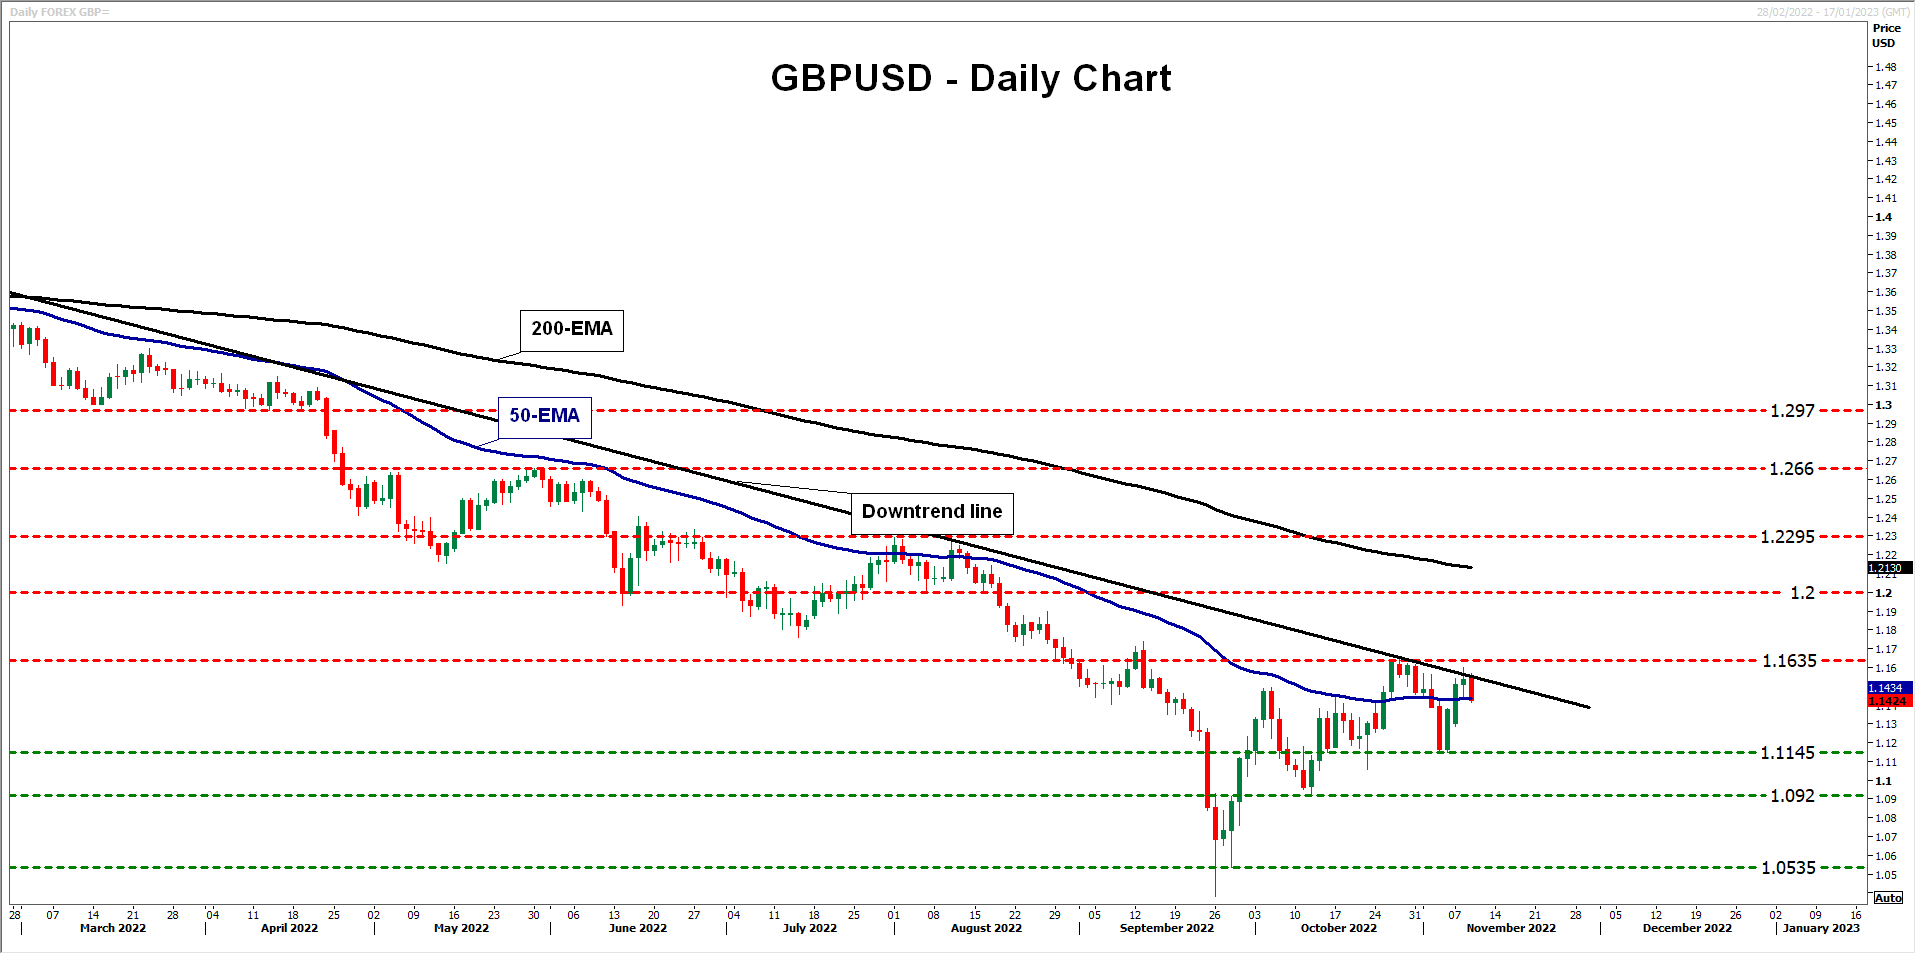
On the upside, the move supporting the case for a potential bullish reversal may be a break above the 1.1635 barrier, marked as resistance by the highs of October 26 and 27. This would not only validate the break above the aforementioned downtrend line but also confirm a higher high on the daily chart. The bulls could then get encouraged to climb towards the psychological round number of 1.2000 and if they are not willing to stop there, the rally may continue towards the 1.2295 area.
NZD/USD Remains Supported Ahead of US CPI Report
Key Highlights
- NZD/USD started a fresh increase above the 0.5800 resistance.
- A major rising channel is forming with support near 0.5835 on the 4-hours chart.
- Gold price might continue higher above $1,715 and $1,720.
- The US CPI could increase 8% in Oct 2022 (YoY), down from 8.2%.
NZD/USD Technical Analysis
The New Zealand Dollar formed a base above the 0.5600 against the US Dollar. NZD/USD started a fresh increase above the 0.5700 and 0.5750 resistance levels.
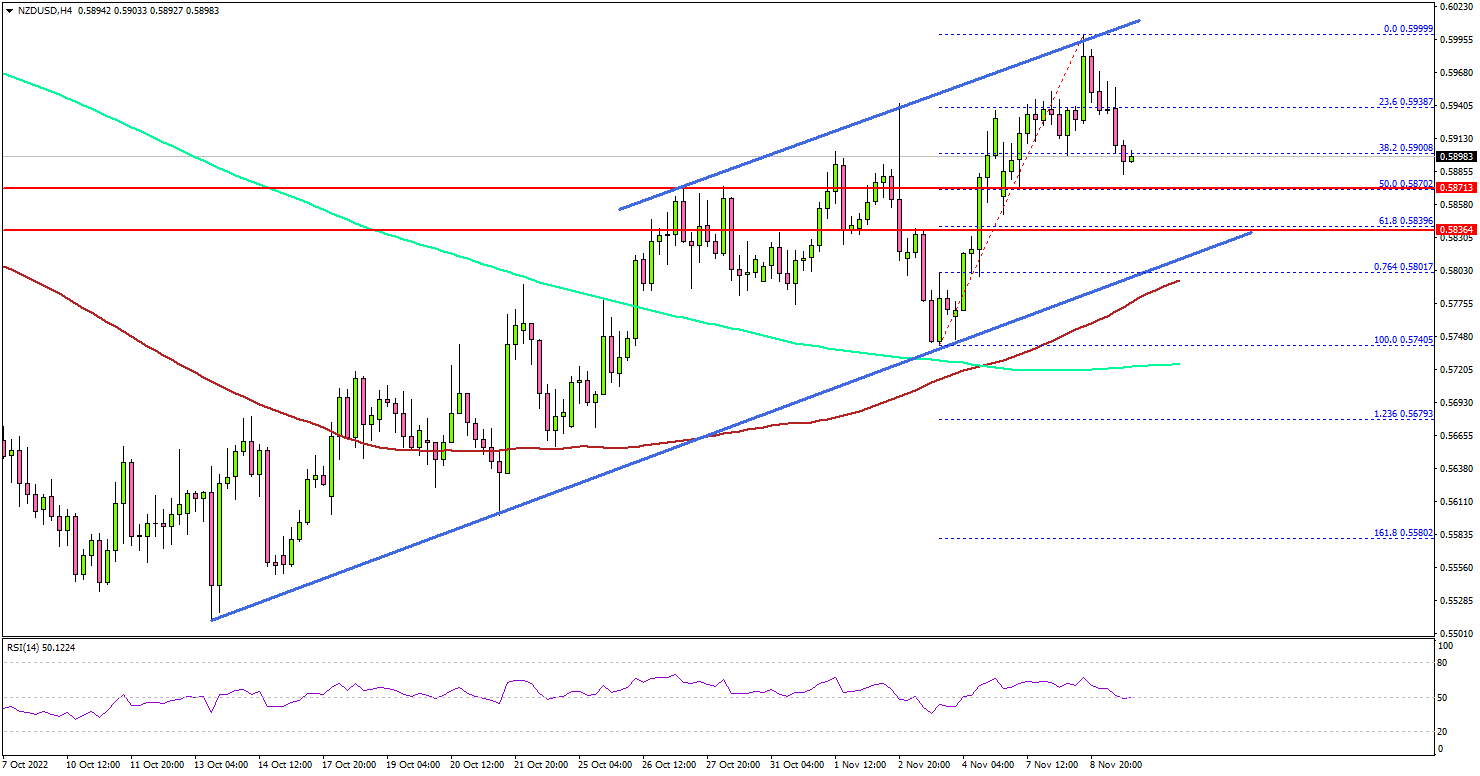
Looking at the 4-hours chart, the pair remained well bid and climbed above the 0.5800 level. It even closed above the 0.5850 level, the 100 simple moving average (red, 4-hours) plus the 200 simple moving average (green, 4-hours).
The bulls pushed the pair above the 0.5900 level. It traded as high as 0.5999 and failed to surpass the 0.6000 resistance zone. The pair is now correcting lower below 0.5950.
There was a move below the 38.2% Fib retracement level of the upward move from the 0.5740 swing low to 0.5999 high. An initial support is near the 0.5870 level.
The 50% Fib retracement level of the upward move from the 0.5740 swing low to 0.5999 high is also near the 0.5870 level. The next major support is near the 0.5835 zone. There is also a major rising channel forming with support near 0.5835 on the same chart.
The main support sits at 0.5800 zone or the 100 simple moving average (red, 4-hours). A close below the 0.5800 level could increase selling pressure. In the stated case, it could decline towards the 0.5720 support.
On the upside, the pair could face hurdles near 0.5940 level. The next major resistance may perhaps be near 0.6000. Any more gains could set the pace for a move towards the 0.6050 level, above which it could even test 0.6120.
Looking at gold price, there was a strong upward move above the $1,680 level and it seems like the price might even climb above the $1,720 level.
Economic Releases
- US Consumer Price Index for Oct 2022 (MoM) – Forecast +0.6%, versus +0.2% previous.
- US Consumer Price Index for Oct 2022 (YoY) – Forecast +8.0%, versus +8.2% previous.
- US Consumer Price Index Ex Food & Energy for Oct 2022 (YoY) – Forecast +6.5%, versus +6.6% previous.
- US Initial Jobless Claims - Forecast 220K, versus 217K previous.