

Sample Category Title
USD/JPY Daily Outlook
Daily Pivots: (S1) 145.01; (P) 145.97; (R1) 146.64; More...
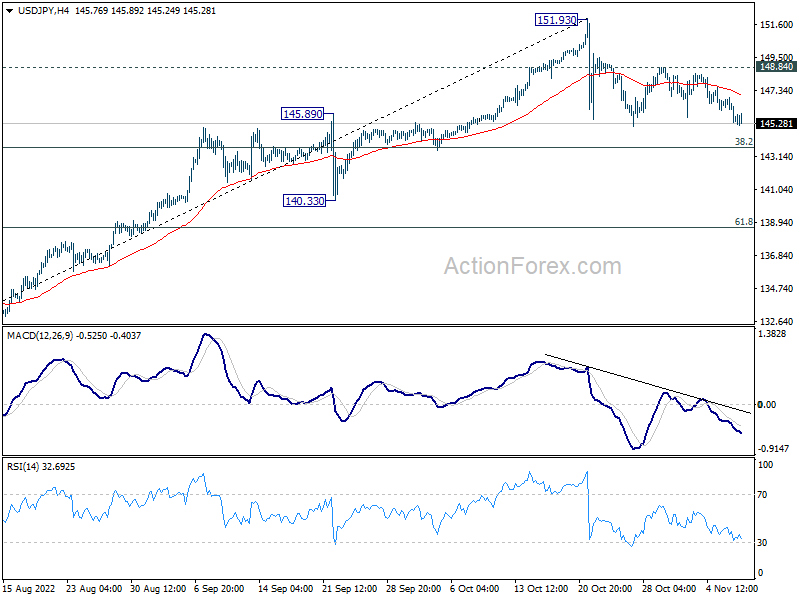
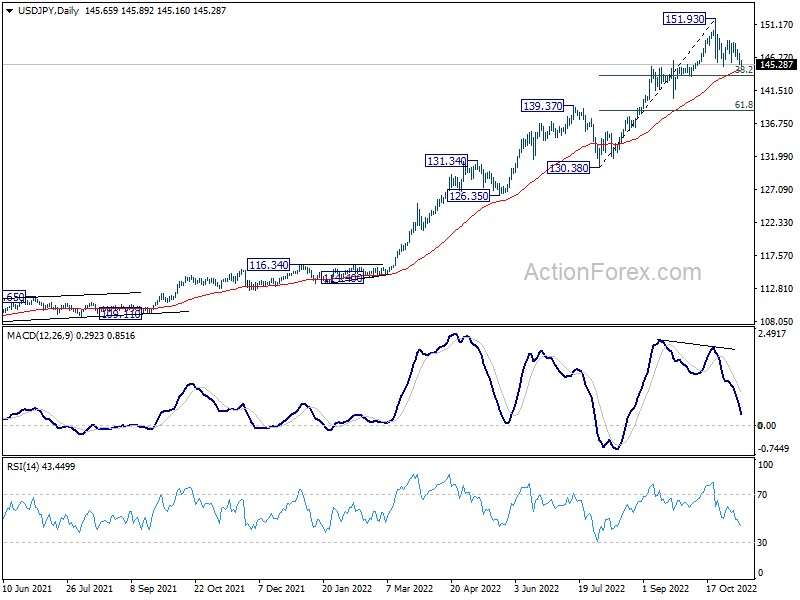
USD/JPY's consolidation from 151.93 is extending and deeper decline could be seen. But downside downside should be contained by 38.2% retracement of 130.38 to 151.93 at 143.69 to bring rebound. On the upside, above 148.84 minor resistance will bring stronger rebound back towards 151.93 high. But upside should be limited there to continue the corrective pattern.
In the bigger picture, up trend from 101.18 is still in progress, as part of the whole up trend from 75.56 (2011 low). 147.68 (1998 high) was already met and there is no clearly sign of topping yet. In any case, break of 140.33 support is needed to be the first sign of medium term topping. Otherwise, further rise is in favor to next target at 160.16 (1990 high).
AUD/USD Daily Report
Daily Pivots: (S1) 0.6450; (P) 0.6501; (R1) 0.6557; More...
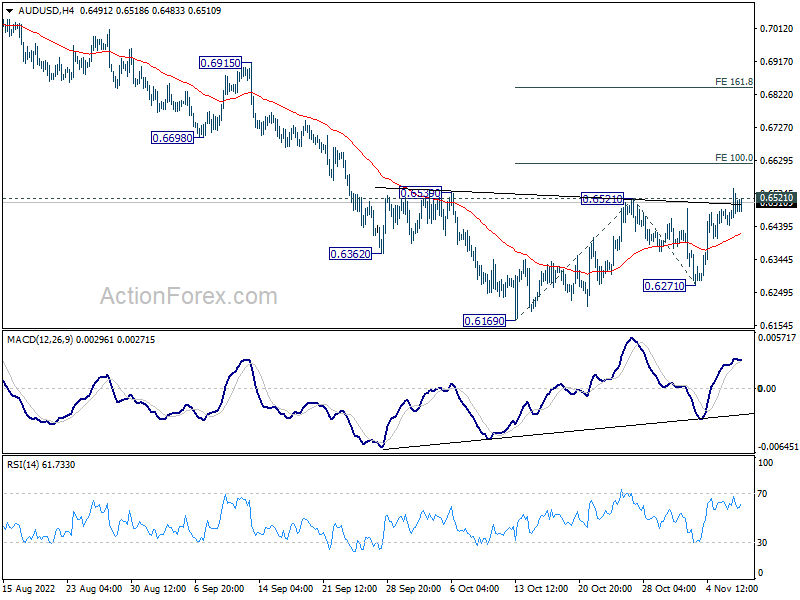
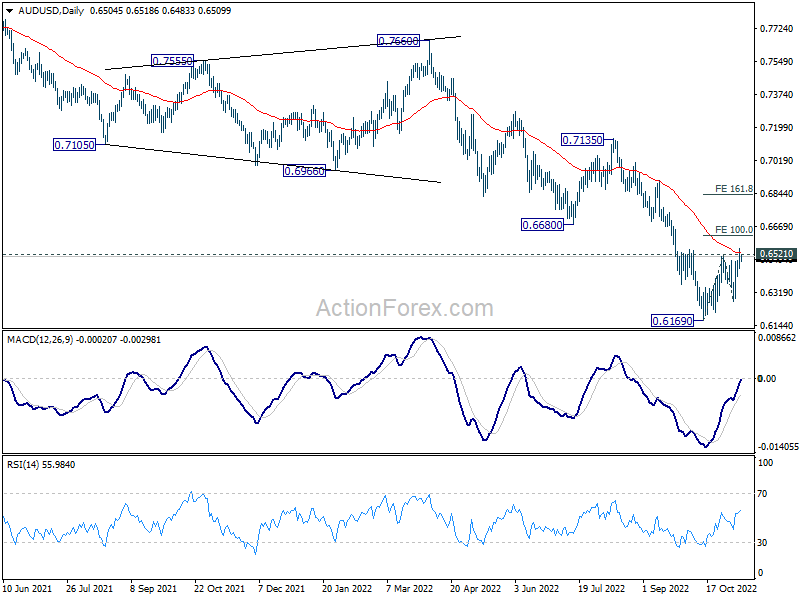
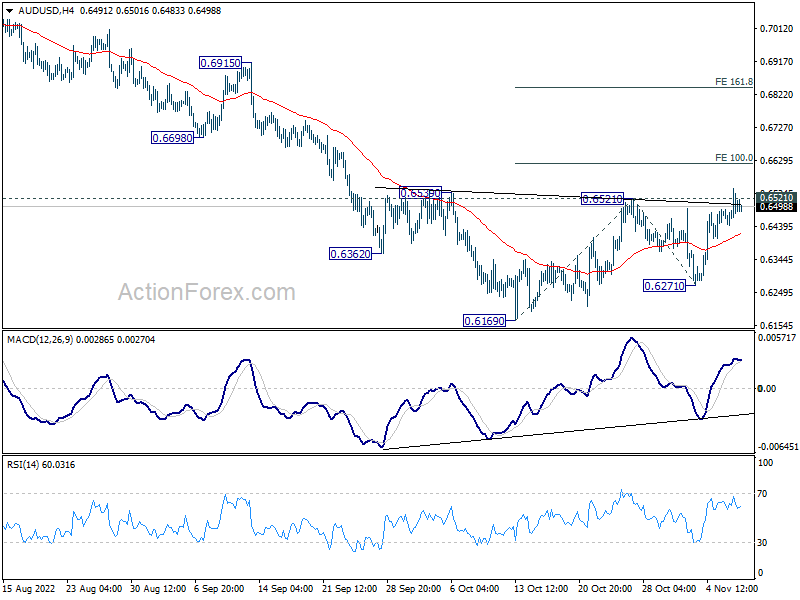
AUD/USD breached 0.6521 resistance but failed to sustain above there. Intraday remains neutral first. On the upside, decisive break of 0.6521 resistance will now complete a head and shoulder bottom pattern (ls: 0.6362; h: 0.6169; rs: 0.6271). Further rally should be seen to 100% projection of 0.6169 to 0.6521 from 0.6271 at 0.6623, and then 161.8% projection at 0.6841. Nevertheless, break of 0.6271 will bring retest of 0.6169 low instead.
In the bigger picture, down trend from 0.8006 (2021 high) is expected to continue as long as 0.6680 support turned resistance holds. Medium term momentum remains strong and retest of 0.5506 (2020 low) cannot be ruled out. But firm break of 0.6680 will be the first sign of reversal, and bring stronger rebound back to 0.7135 resistance.
USDJPY Exposed to More Downside in the Short-Term
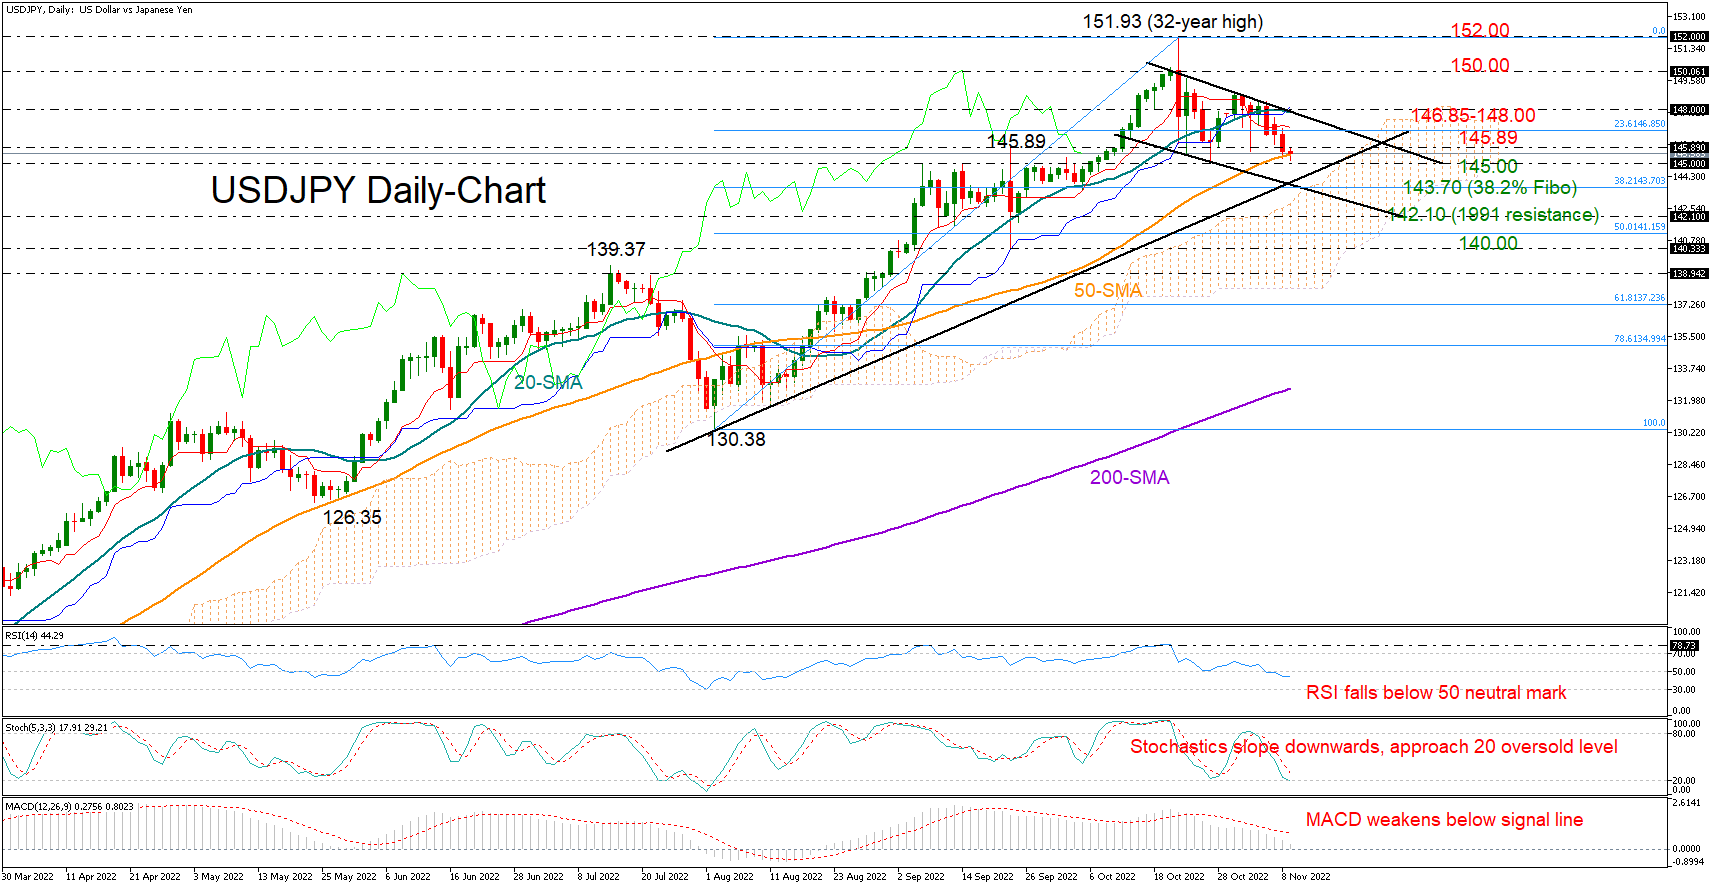
USDJPY stretched its November’s losses towards the 50-day simple moving average (SMA) and close to the 145.00 round-level on Tuesday as the US midterm election results started to roll in.
The momentum indicators point to more declines ahead as the RSI is weakening below its 50 neutral mark and the MACD is decelerating below its red signal line. The stochastics are in downward move too, though within a short distance from their 20 oversold level, suggesting that the bearish wave in the price could soon take a breather.
Should the 145.00 mark give way, the bearish correction could immediately pause near the 38.2% Fibonacci retracement of the 130.38-151.93 upleg at 143.70. Note that the lower boundary of a short-term descending channel and the tentative ascending trendline from August’s low of 130.38 are currently intersecting each other around the same region. Hence, a decisive close lower may trigger an extension straight to the 142.10 constraining zone and then towards the 140.00 psychological mark. A step below July’s high of 139.37 would confirm a neutral outlook in the medium-term picture.
On the upside, the 145.89 barrier has resumed its resistance role and is currently keeping the bulls under control. A step higher could face a more challenging session between the 23.6% Fibonacci of 146.85 and the channel’s upper band at 148.00, where the 20-day SMA is currently lying. If that wall collapses, the focus will fall on the 150.00 key number, while beyond that, the door will open for the 32-year high of 151.93.
In brief, the latest downturn in USDJPY is expected to continue in the short-term, with traders likely looking for immediate support around 143.70.
UK 100 Holds onto Gains
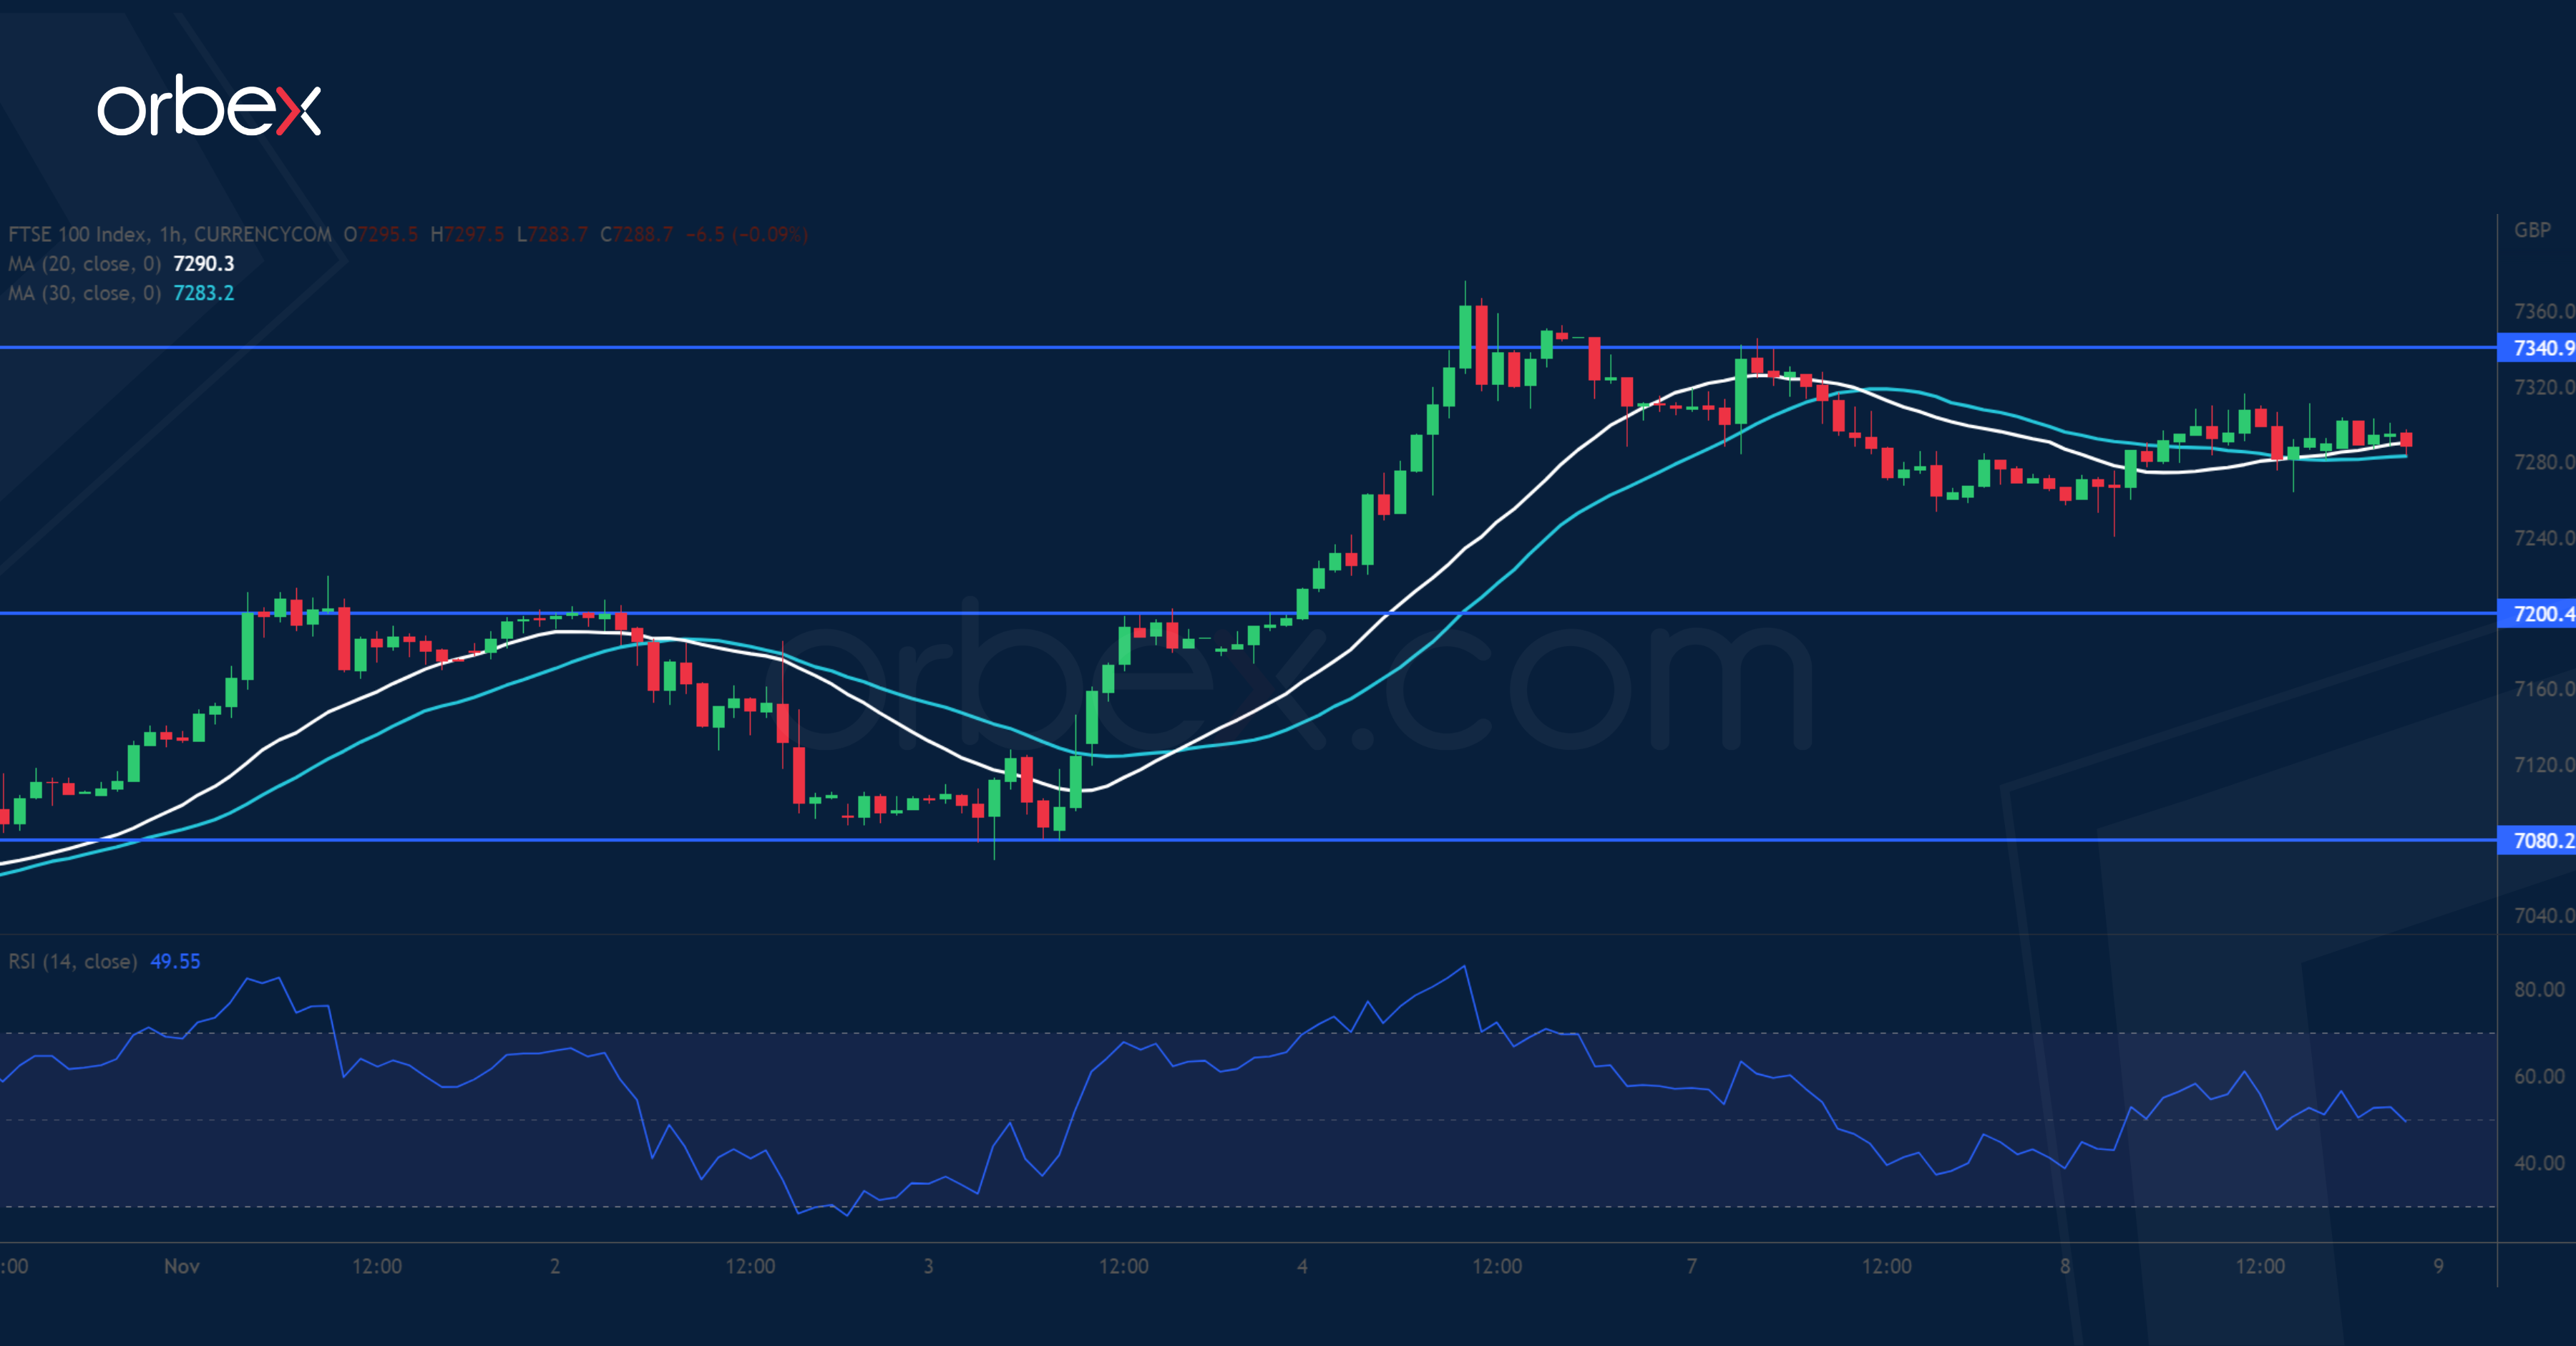
The FTSE 100 treads water over sluggish prospects for the housing sector. A bullish MA cross on the daily chart suggests an acceleration of the rally. The index is consolidating its gains after lifting offers around 7330 at the origin of a sell-off in mid-September. 7200 is the first level to gauge the strength of buying interest with 7080 as a second line of defence. A bounce back above 7340 is likely to carry the price action to the previous peak at 7500, which could be a step closer to reverse the bearish course in the medium-term.
CADJPY Awaits Breakout
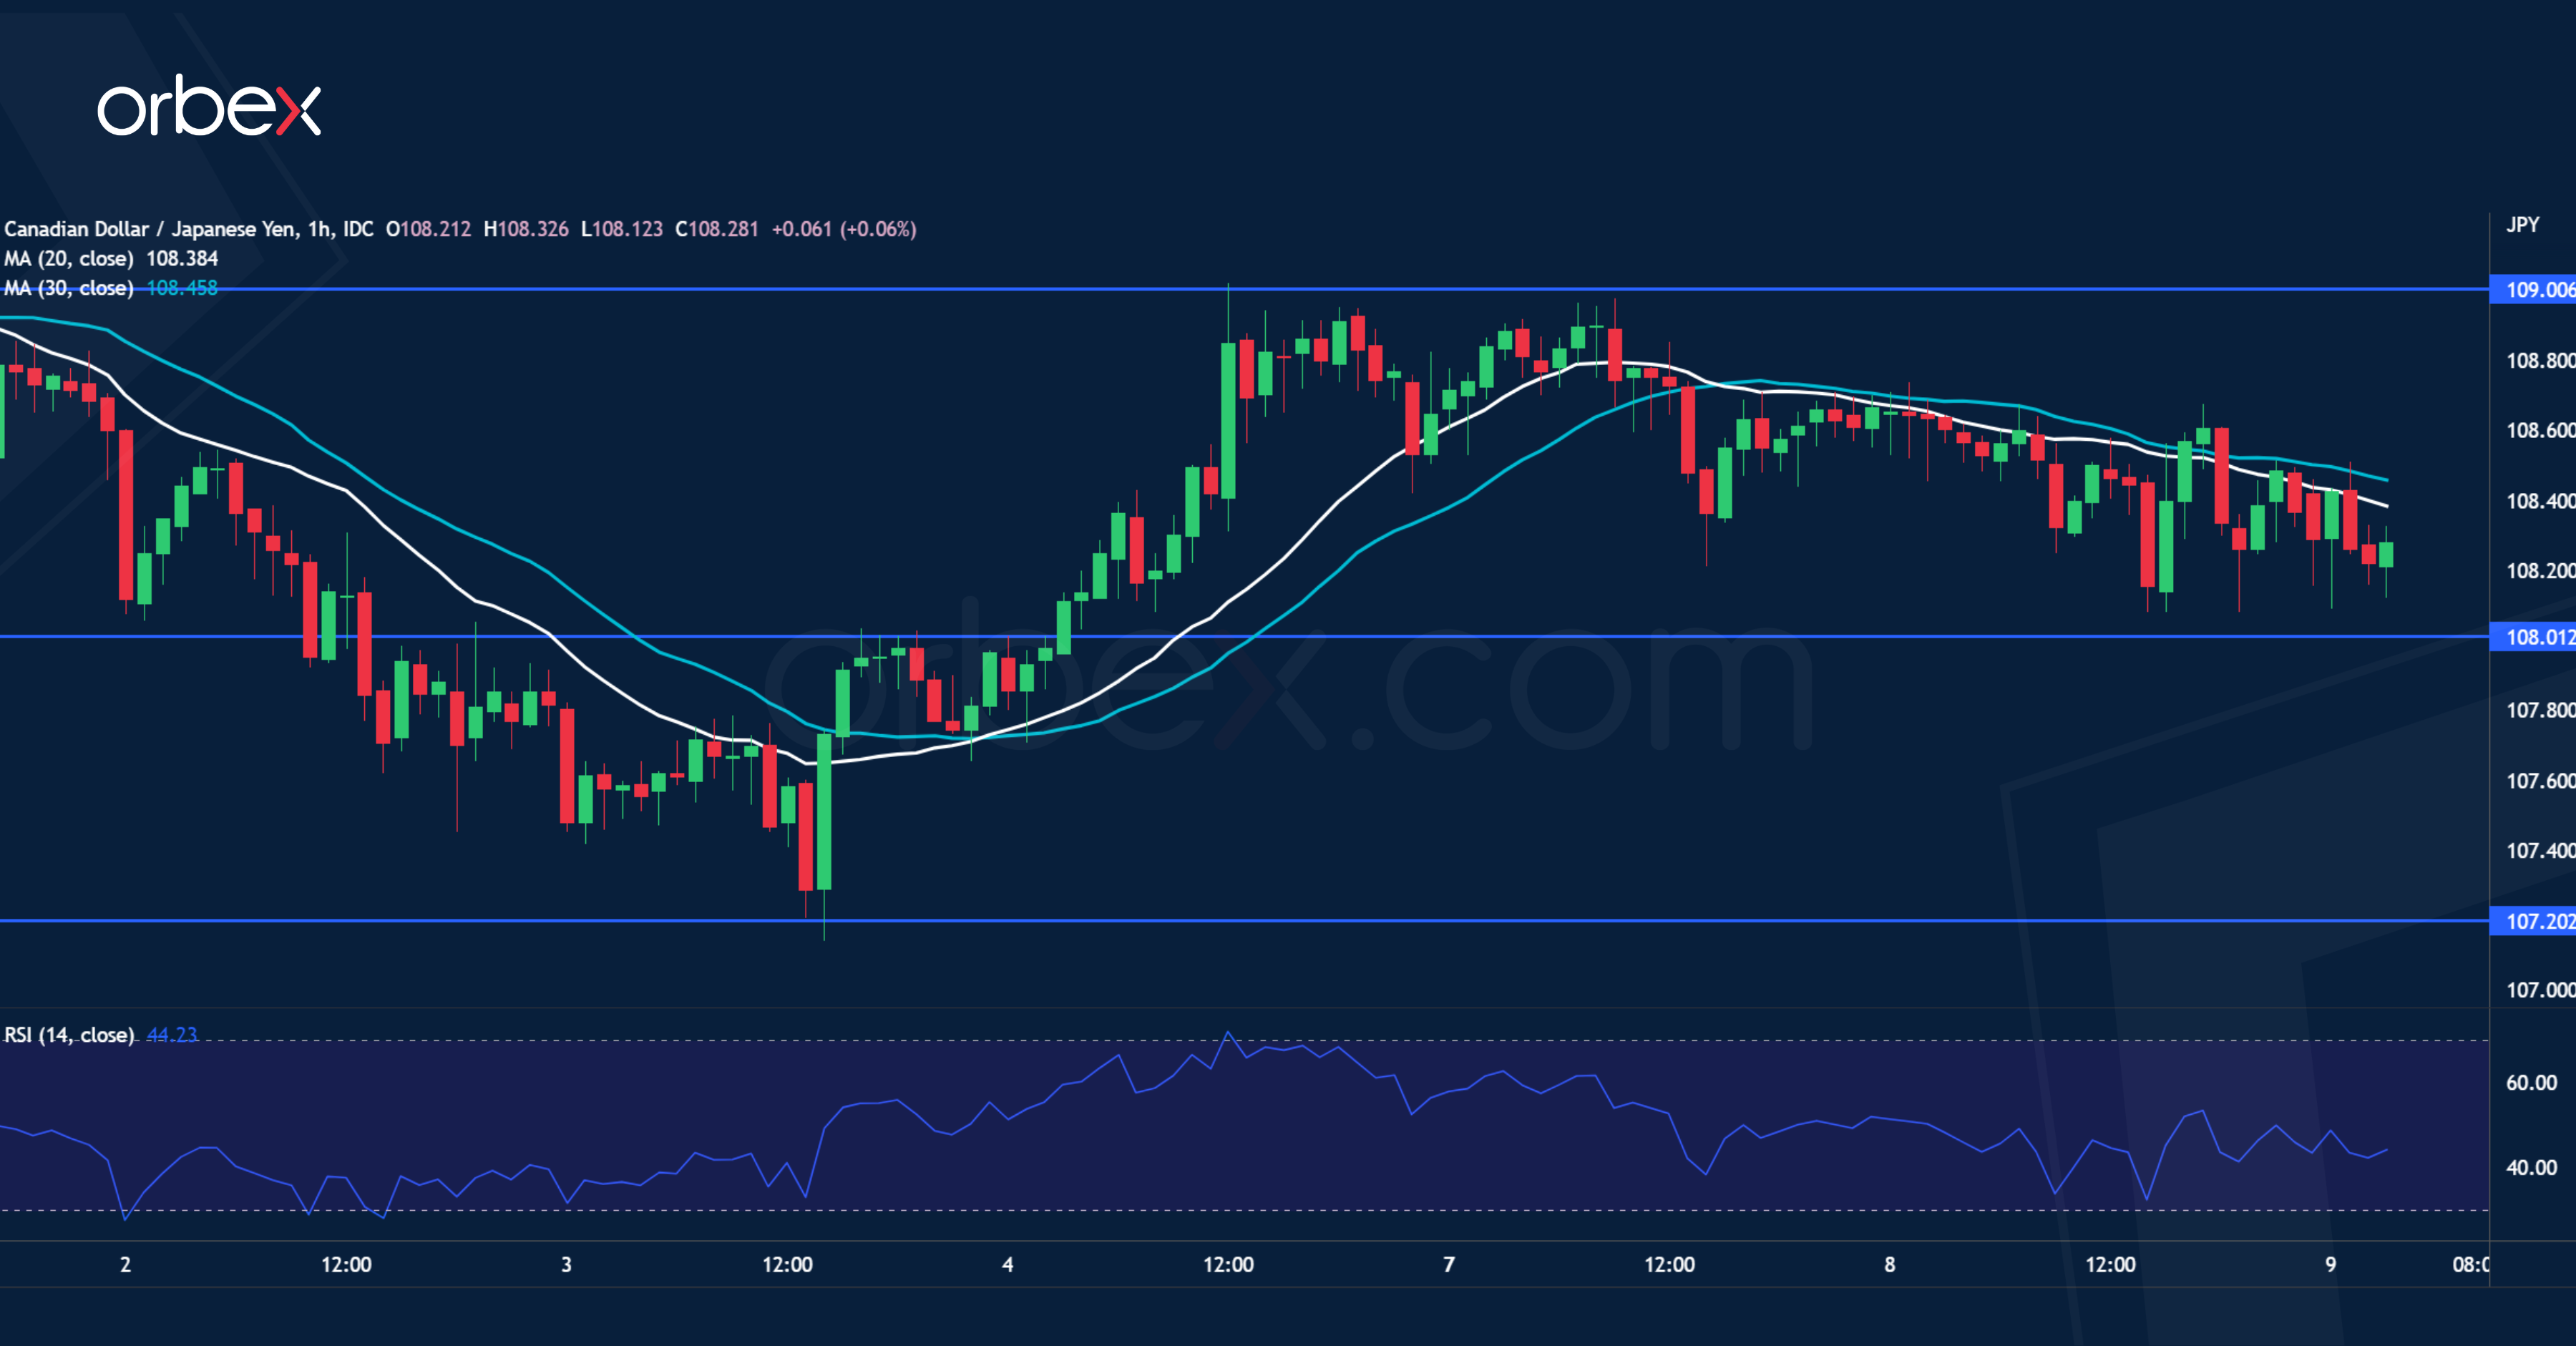
The Canadian dollar drifts lower as oil prices hit resistance. The latest rally came to a halt in the sell zone around 109.00. Still, on the daily chart, sentiment is extremely bullish after the loonie hit a 8-year high (106.50). The bulls may look at the recent consolidation as an opportunity to accumulate. 108.00 is the immediate support and 107.20 is the lower band of the range and a critical floor to keep the price afloat. A rally above the psychological level of 109.00 may resume the uptrend above 110s.
EURUSD Tests Resistance
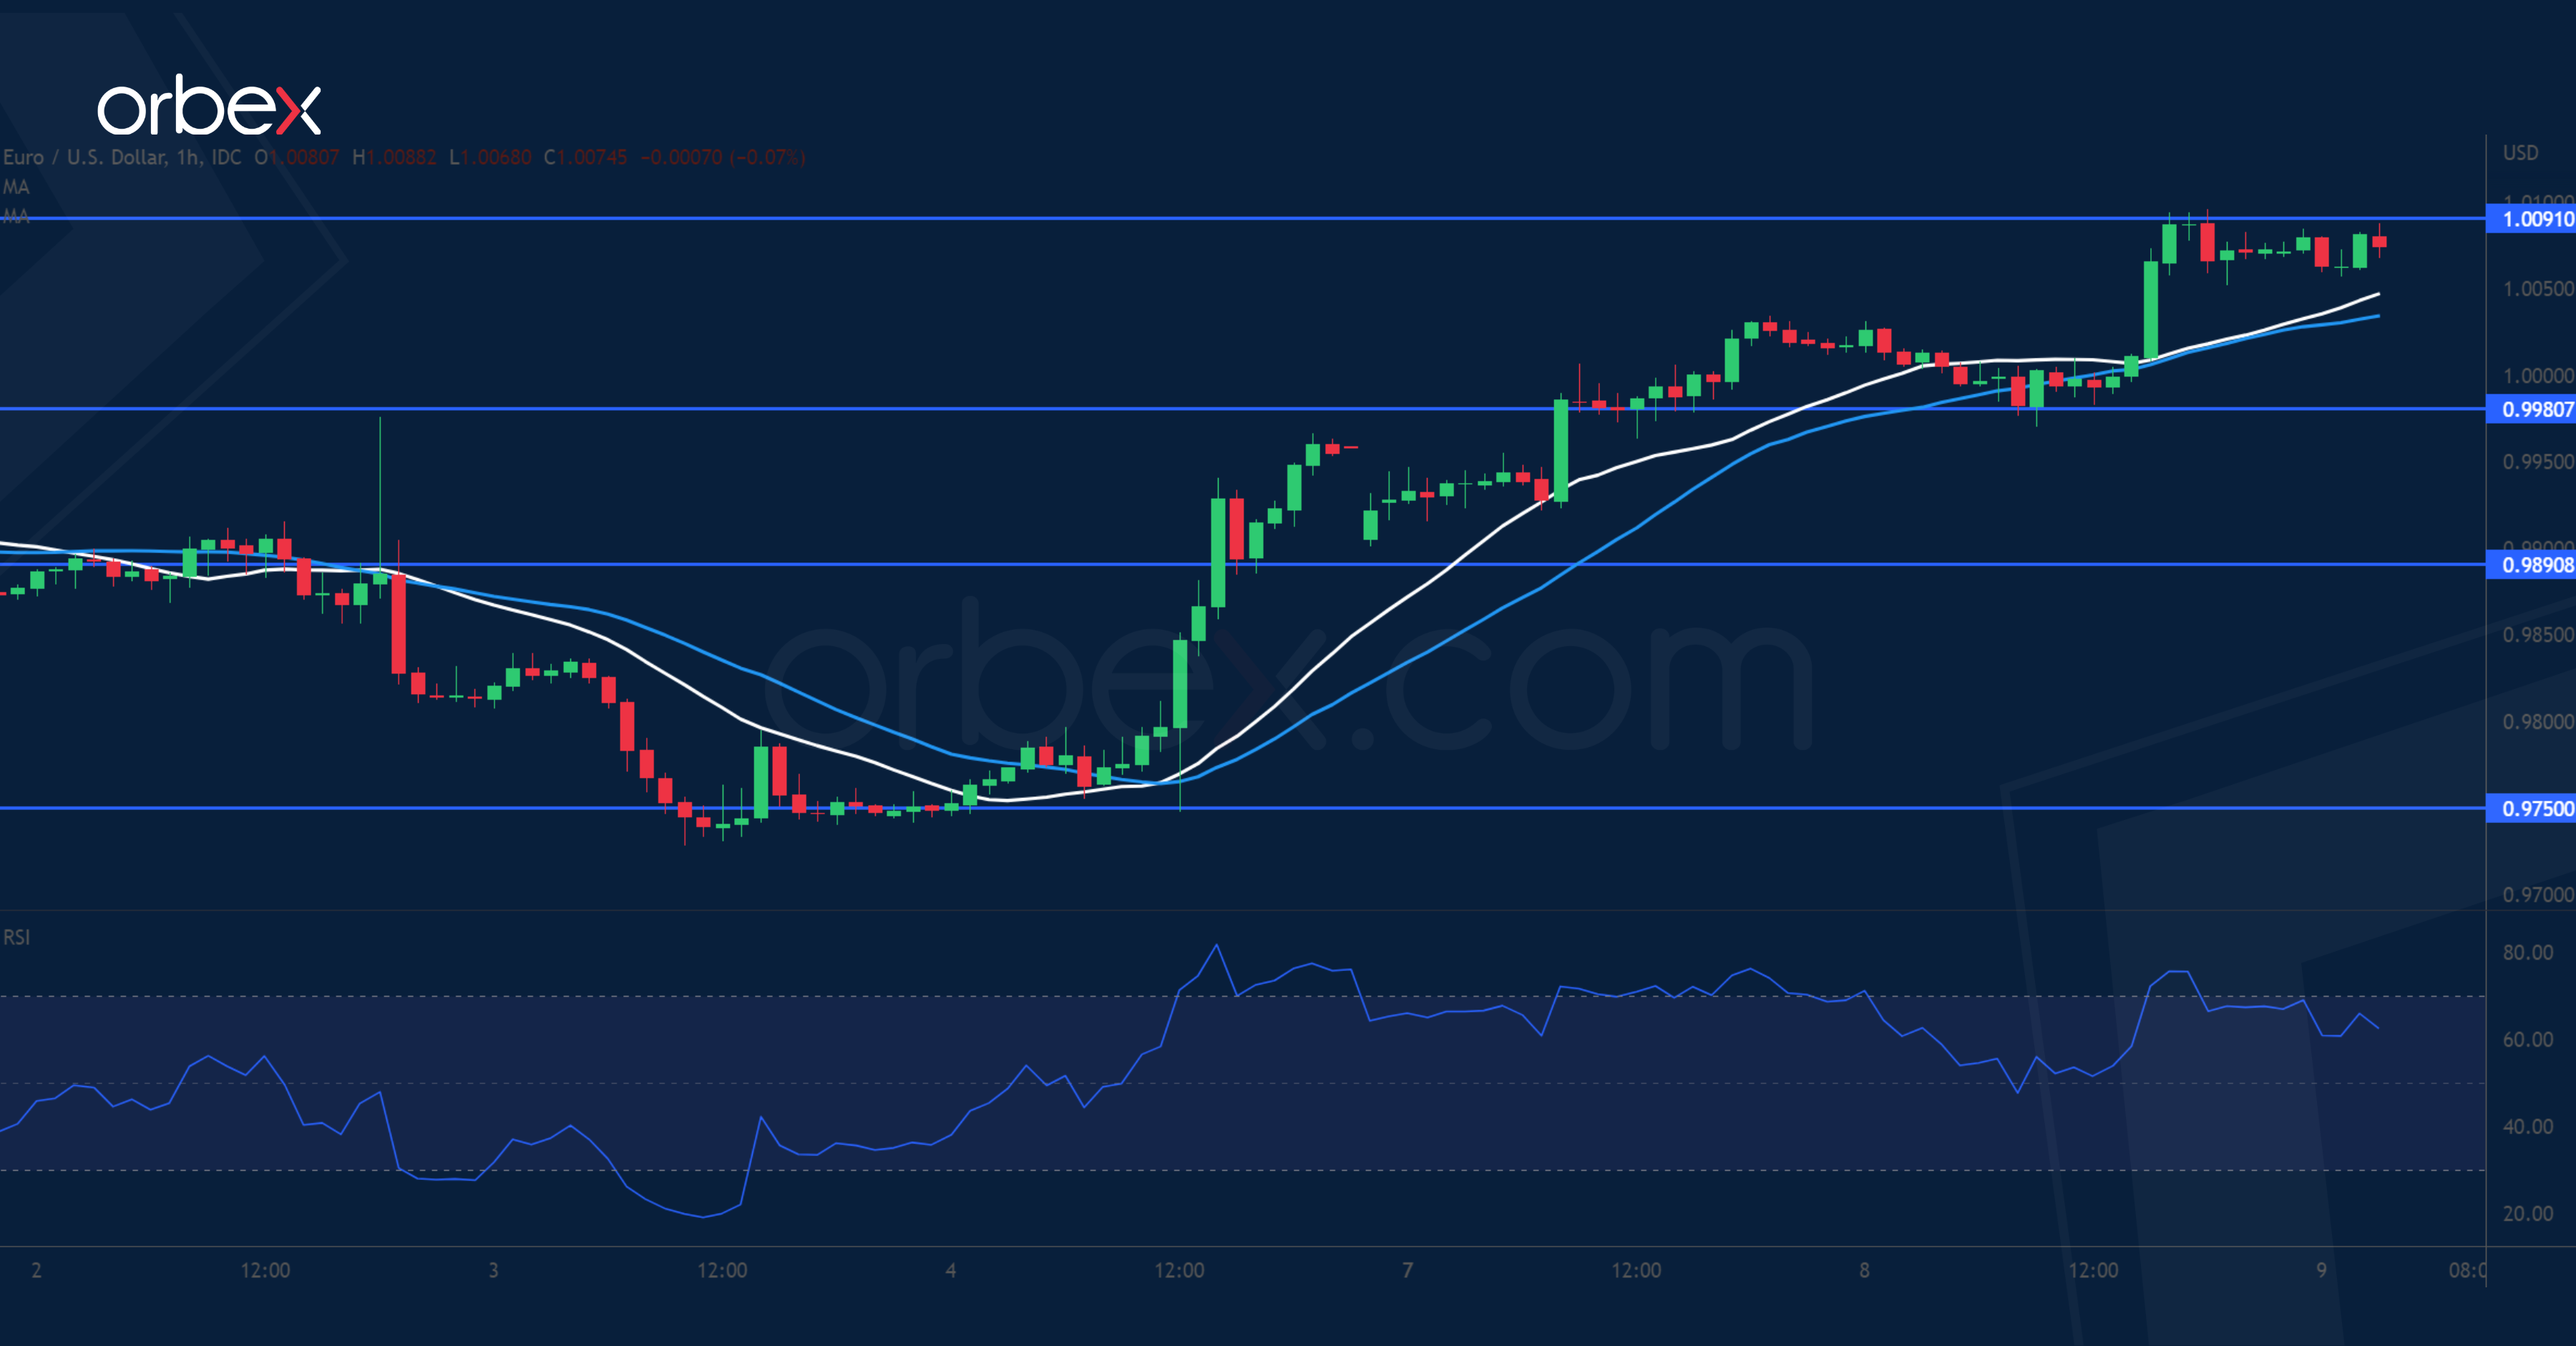
The euro rallies as September’s retail sales in the eurozone beat expectations. A close above 0.9950 has prompted some sellers to cover their positions. Then a tentative break above 1.0090 shows strong buying interest which could dictate the market’s next move. A valid breakout would propel the single currency to September’s high at 1.0190, a supply area from a previous sell-off, shifting sentiment to the optimistic side. As the RSI goes overheated, the demand zone near 0.9980 is the level to monitor in case of a pullback.
Markets Will Have to Continue Their Countdown the Tomorrow’s US CPI Release
Markets
Markets had to rely on their own internal dynamics/technical considerations yesterday given the empty eco calendar. Both US and EMU yields initially hovered close to post-Fed peak levels, but forces of gravity came into play during the US trading and finally inspired some global dovish repositioning. Markets are still in doubt whether the Fed will be able to continue exclusively prioritizing inflation while plenty of other central bank colleagues already shifted to a more balanced approach between taming inflation and preserving economic growth. An at that point potential Republican victory in the US mid-term elections maybe also supported the dovish intraday twist as it reduces the probability of more fiscal stimulus. US yields declined between 9.4 bps (5-y) and 4.4 bps (30-y). The $40bn US 3-y Note action attracted solid demand. The German yield curve bull flattened with yields dropping between 3.7 bps (5-y) and 8.2 bps (30-y). EMU swaps slightly outperformed Bunds. After the European close, ECB Wunsch said that ‘if the economic slowdown is shallow and accompanied by a further rise in inflation & inflation expectations, real rates will have to move above the market consensus. Markets currently see a policy rate peak near 3%. As was the case over the previous days, the mildly dovish post-Fed/post-Payrolls market tenure provided more relief for equites with US indices gaining between 1.02% (Dow) and 0.49% (Nasdaq). Admittedly, the end-of-session gain occurred amid sharp intraday swings. The ‘risk-on’ kept the dollar in the defensive. DXY closed almost at the 110.59 support (end October low). A break would take some further shine off the US currency. After a hesitant start, EUR/USD fiercely recaptured parity to close at 1.0074. Sterling gained modestly against the dollar (cable close 1.1544), but lost marginally against the euro (close EUR/GBP 0.8726).
Asian equities show a mixed picture this morning with China and Japan trading in red. Markets don’t draw firm conclusions from the outcome of the US mid-term election. The Democrats have a good chance of maintaining the Senate. US yields are rising 1-2 bps. The dollar gains marginally (DXY 109.76; EUR/USD 1.0062). The eco calendar is almost empty. Markets will have to continue their countdown the tomorrow’s US CPI release. After the recent solid performance of CE currencies, we keep an eye at the Hungarian CPI (21% Y/Y) and at the interest rate decision of the Polish central bank. Economists are divided between a 25 bps rate hike (to 7%) or an unchanged decision. Core yields probably are capped by recent highs going into the US CPI. EUR/USD 1.0094 resistance is within reach.
News Headlines
Chinese consumer inflation dropped from 2.8% to 2.1% y/y in October, driven amongst others by decelerating food prices from 8.8% to 7%. Core inflation steadied at 0.6% and service prices edged down to 0.4% from 0.5% the month before in a sign of zero-Covid driven demand pressure. Highlighting the disinflationary trend in China, producer prices turned negative (-1.3% y/y) for the first time since late 2020. Mining was the biggest drag on the PPI number, faltering 6.7% y/y. It follows declines in global commodity prices including an 18% drop in iron ore. The Chinese yuan eases a tad against the dollar this morning. USD/CNY trades at 7.248, up from 7.23. The intraday cycle/15 year high stands at 7.32.
The European Commission will propose changes to the debt rules later today. The current rules stipulate that euro zone countries must cut debt every year by 1/20th of the excess above 60% of GDP. This has become unrealistic for countries including Italy and Greece which saw debt soaring to 148% and 186% following the pandemic and energy crisis. Instead of a one-size-fits all rule, each country would agree on its own four-year debt reduction plans (which may be extended to seven years) with the EC, to be signed of later by other EU finance ministers, officials said. There would be limits on primary expenditures though and keeping budget deficits below 3% would still be required. Fines for breaches would be lowered but more easily applied, they added.
USD/JPY Pair Moved into a Short-Term Bearish Zone Below 146.50
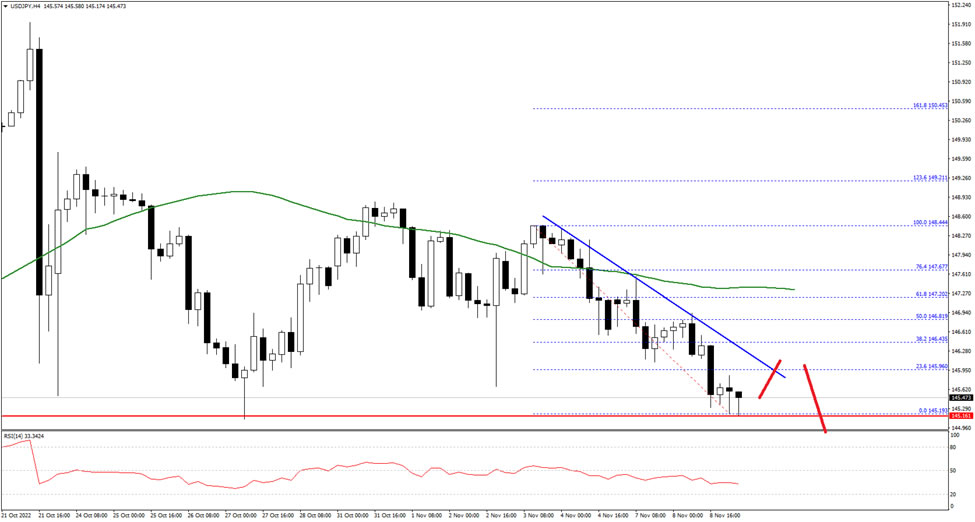
The US Dollar started a fresh decline from well above the 148.00 zone against the Japanese Yen. The USD/JPY pair traded below the 146.50 level to move into a short-term bearish zone.
The pair traded as low as 145.19 and is currently consolidating losses. An immediate resistance on the upside is near the 145.95 level and a connecting bearish trend line on the hourly chart.
The next major resistance is near 146.40 on FXOpen. A clear break above the 146.40 resistance could push the price towards 147.20 and the 50 hourly simple moving average. The next major resistance is near the 148.00 level.
On the downside, an initial support is near the 145.20 zone and the recent low. The next major support sits near the 145.00 level, below which there is a risk of more downsides towards the 144.20 level.
USD/CAD Daily Outlook
Daily Pivots: (S1) 1.3368; (P) 1.3447; (R1) 1.3507; More....
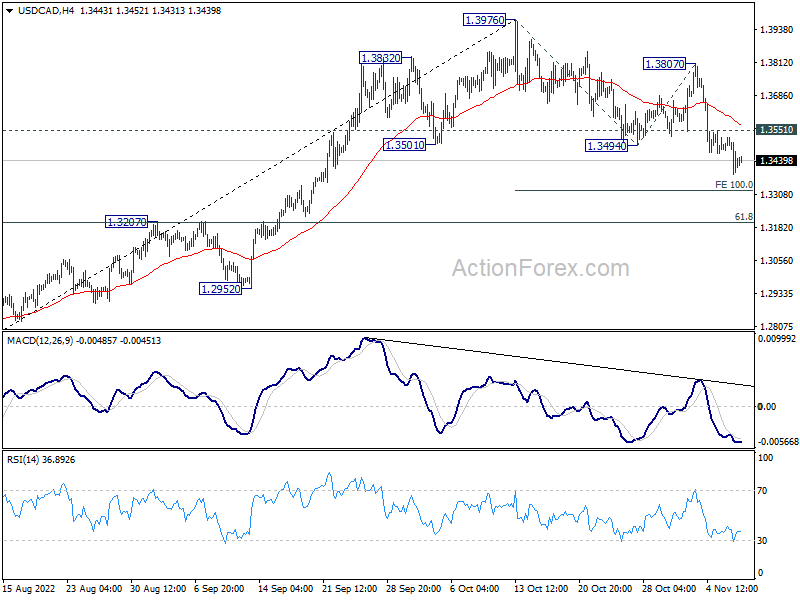
Intraday bias in USD/CAD stays on the downside at this point. As noted before, a head and should top pattern (1.3832; h: 1.3976; rs: 1.3807) was formed already. Deeper decline would be seen to 100% projection of 1.3976 to 1.3494 from 1.3807 at 1.3325 and possibly below. But downside should be contained by 1.3207 cluster support (61.8% retracement of 1.2726 to 1.3976 at 1.3204) to bring rebound. On the upside, above 1.3551 minor resistance will turn intraday bias neutral first.
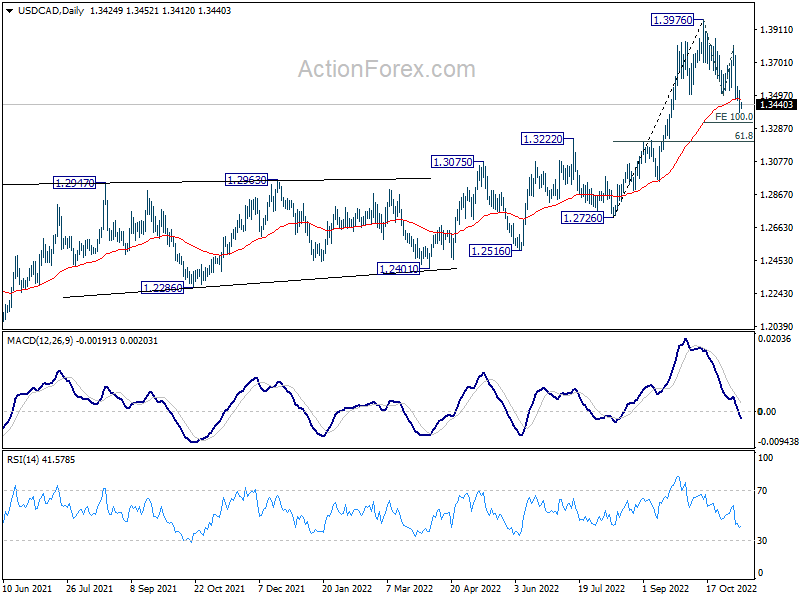
In the bigger picture, up trend from 1.2005 (2021 low) is still in progress. Based on current impulsive momentum, it could be resuming long term up trend from 0.9056 (2007 low). Whether it is or it isn't, retest of 1.4689 (2016 high) should be seen next. This will now remain the favored case as long as 1.3222 resistance turned support holds.
Dollar Down on Risk-On Sentiment, But Selling Not Too Committed Yet
Dollar was sold off broadly overnight, following risk-on sentiments. Investors appeared to welcome the results of US mid-term election so far. But the decline in the greenback is not too committed so far. Dollar is still holding on to near term support levels against European majors, and even Aussie. The skepticism about risk sentiment is also seen with softness in commodity currencies. For now, Sterling is slightly stronger than other European majors, which are together the strongest on for the week.
Technically, USD/CAD's head and should top is taking shape with yesterday's fall. One focus is now on 0.6521 resistance in AUD/USD. Decisive break there will complete a head and should bottom pattern (ls: 0.6362; h: 0.6169; rs: 0.6271). Next target will be 100% projection of 0.6169 to 0.6521 from 0.6271 at 0.6623, and then 161.8% projection at 0.6841.
In Asia, Nikkei dropped -0.56%. Hong Kong HSI is down -1.62%. China Shanghai SSE is down -0.53%. Singapore Strait Times is up 0.64%. Japan 10-year JGB yield is up 0.0016 at 0.254. Overnight, DOW rose 1.02%. S&P 500 rose 0.56%. NASDAQ rose 0.49%. 10-year yield dropped -0.0088 to 0.4126.
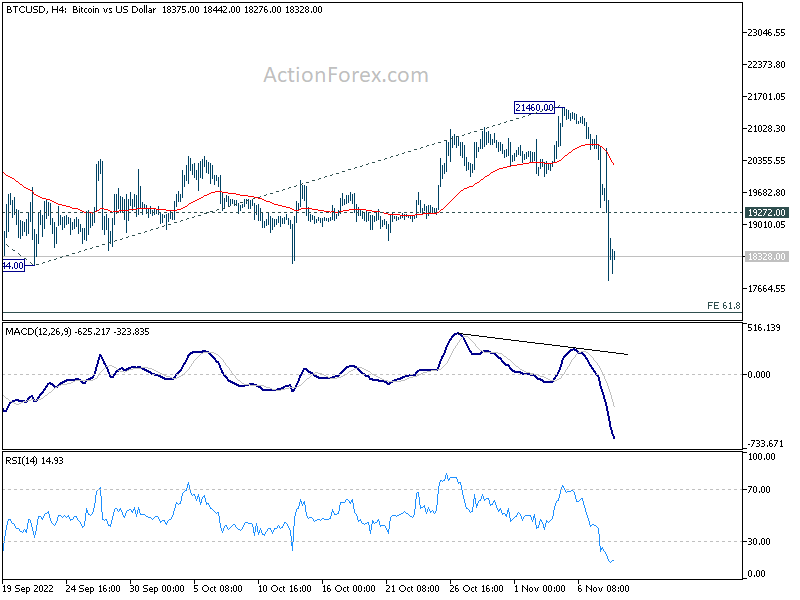
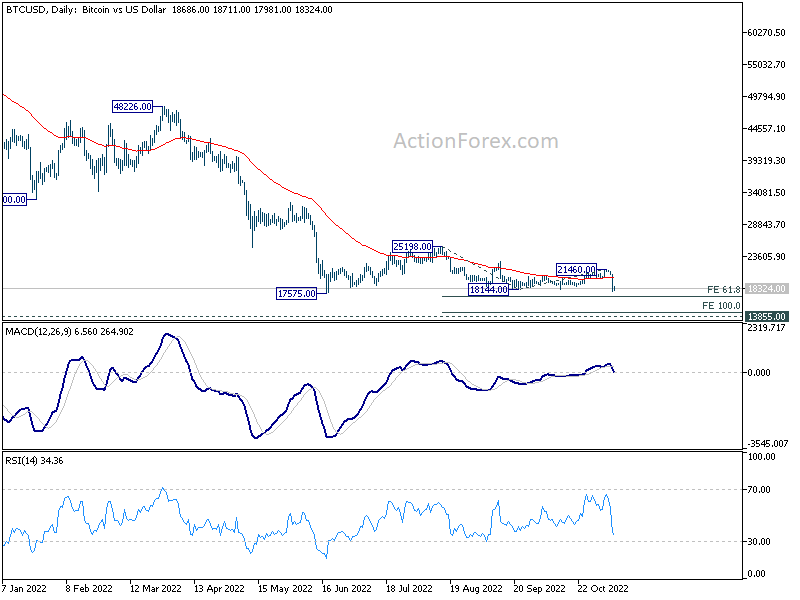
Bitcoin resuming down trend on broad crypto selloff
Cryptocurrencies stumbled overnight with Bitcoin crashing to the lowest level since June, eyeing 2022 low. The moves came on news that Binance offered to FTX's non-US operations to fix "liquidity crunch".
Technically, current downside moment, and the break of September's low at 18144 suggests that Bitcoin is ready for down trend resumption. For now, further decline is expected as long as 19272 resistance holds.
Bitcoin is ready to taken on 61.8% projection of 25198 to 18144 from 21460 at 17100 first. Firm break there could prompt downside acceleration to 100% projection at 14406.
Gold surges, will complete double bottom?
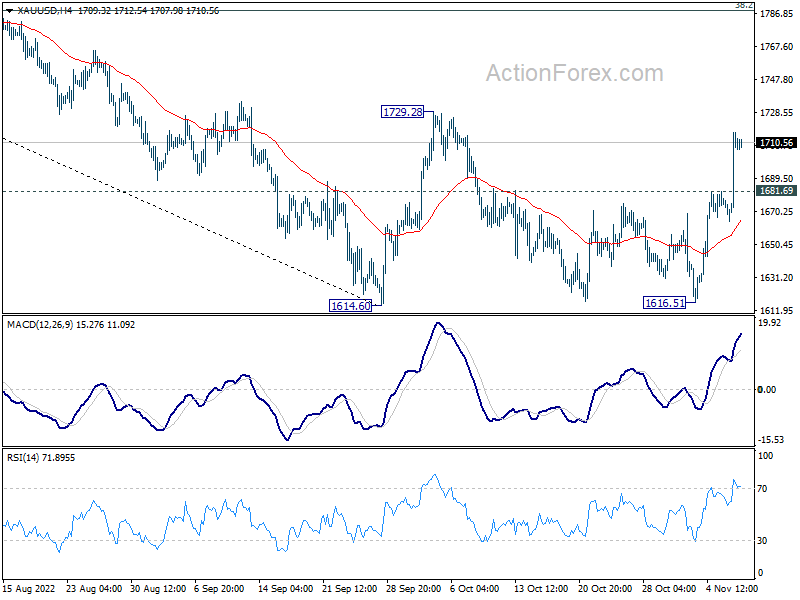
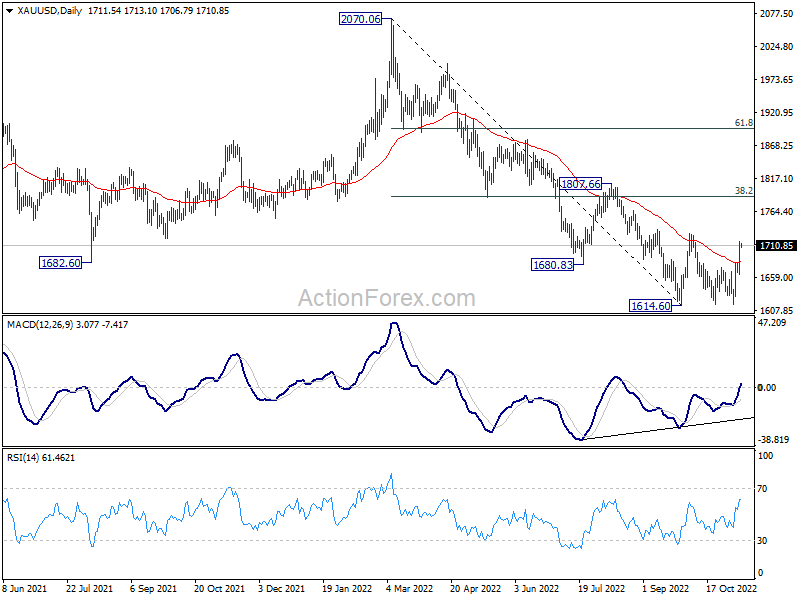
Gold surged notably on the back of selloff in the greenback, which came with rally in the US stocks. So far, the markets are expecting Republicans to take back control of the House after mid-term elections. Meanwhile, the race for Senate remains tight. Yet, in either case, the result would be a divided Congress and Administration. Investors would welcome such as result as that would limit new taxes and regulations.
Immediate focus is now on 1729.28 resistance in Gold. Decisive break there would complete a double bottom pattern (1614.60; 1616.51), which is at least a near term bullish sign. Stronger rally should be seen to 38.2% retracement of 2070.06 to 1614.60 at 1788.58 at least. Nevertheless, break of 1681.69 minor support will retain near term bearishness, and turn bias neutral first.
On the data front
Japan bank lending rose 2.7% yoy in October, versus expectation of 2.5% yoy. Current account surplus widened from JPY 0.10T to 0.67% in September, above expectation of JPY 0.41T. From China, CPI slowed from 2.8% yoy to 2.1% yoy in October, below expectation of 2.5% yoy. PPI dropped -1.3% yoy, versus expectation of -1.4% yoy.
USD/CAD Daily Outlook
Daily Pivots: (S1) 1.3368; (P) 1.3447; (R1) 1.3507; More....
Intraday bias in USD/CAD stays on the downside at this point. As noted before, a head and should top pattern (1.3832; h: 1.3976; rs: 1.3807) was formed already. Deeper decline would be seen to 100% projection of 1.3976 to 1.3494 from 1.3807 at 1.3325 and possibly below. But downside should be contained by 1.3207 cluster support (61.8% retracement of 1.2726 to 1.3976 at 1.3204) to bring rebound. On the upside, above 1.3551 minor resistance will turn intraday bias neutral first.
In the bigger picture, up trend from 1.2005 (2021 low) is still in progress. Based on current impulsive momentum, it could be resuming long term up trend from 0.9056 (2007 low). Whether it is or it isn't, retest of 1.4689 (2016 high) should be seen next. This will now remain the favored case as long as 1.3222 resistance turned support holds.
Economic Indicators Update
| GMT | Ccy | Events | Actual | Forecast | Previous | Revised |
|---|---|---|---|---|---|---|
| 23:50 | JPY | Bank Lending Y/Y Oct | 2.70% | 2.50% | 2.30% | |
| 23:50 | JPY | Current Account (JPY) Sep | 0.67T | 0.41T | -0.53T | 0.10T |
| 01:30 | CNY | CPI Y/Y Oct | 2.10% | 2.50% | 2.80% | |
| 01:30 | CNY | PPI Y/Y Oct | -1.30% | -1.40% | 0.90% | |
| 05:00 | JPY | Eco Watchers Survey: Current Oct | 49.9 | 50.5 | 48.4 | |
| 15:00 | USD | Wholesale Inventories Sep F | 0.80% | 0.80% | ||
| 15:30 | USD | Crude Oil Inventories | 0.3M | -3.1M |