Sample Category Title
WTI Oil: Oil Remains Firmly in Red on Demand Fears, Strong Dollar
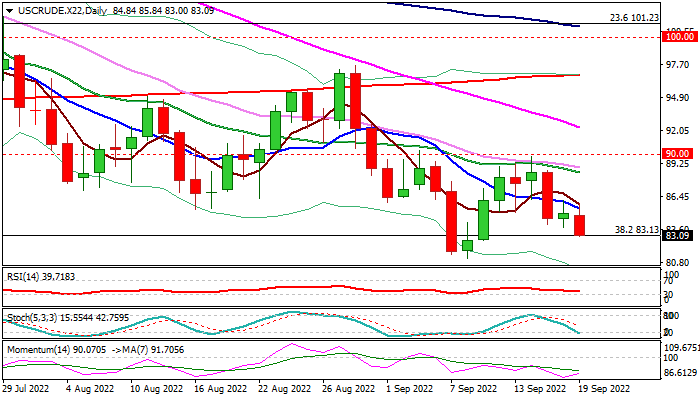
WTI oil started the week in negative mode, falling 1.7% during Asian and early European trading on Monday.
Crude oil is pressured by fears of recession that would significantly slow global economy and lower demand for energies, while strong dollar on prospects of further aggressive steps of the Fed towards its monetary policy, adds to negative sentiment
The contract remains in red following three consecutive weeks of losses, as well as falling for the fourth straight month.
Fresh weakness probes again through pivotal Fibo support at $83.13 (38.2% of $6.52/$130.48, Apr 2020/Mar 2022 rally), with firm break here to generate bearish signal for retest of key near-term support at $81.17 (nine-month low, posted on Sep 8).
Bearish technical studies on daily and weekly chart support the action, with upticks expected to provide better selling opportunities.
Upticks will face solid resistance from daily Tenkan-sen ($85.50) which should ideally cap.
Only break above $90 zone (daily Kijun-sen / Sep 14 lower top / psychological) would sideline bear
Res: 85.50; 86.16; 88.68; 89.40.
Sup: 82.73; 81.17; 80.00; 78.48.
Bitcoin’s Depressing Technical Picture
Market picture
Bitcoin is down 8.8% over the past week, ending near $19,700. The losses continued to pile up on Monday, decreasing the price to $18.5K (-7.77% in 24 hours). Ethereum collapsed 25% to $1300 in exactly one week. Top altcoins fell from 10% (Solana, Dogecoin) to 19% (Polkadot). The exception was XRP (-0.5%).
Total crypto market capitalisation, according to CoinMarketCap, was down 14% for the week at $903bn. The cryptocurrency Fear & Greed Index returned to “extreme fear” territory at 21 by Monday.
Flee from risks in global markets has pressured Bitcoin over the past week. Ethereum has underperformed, quickly taking back the speculative advantage accumulated before the move to PoS.
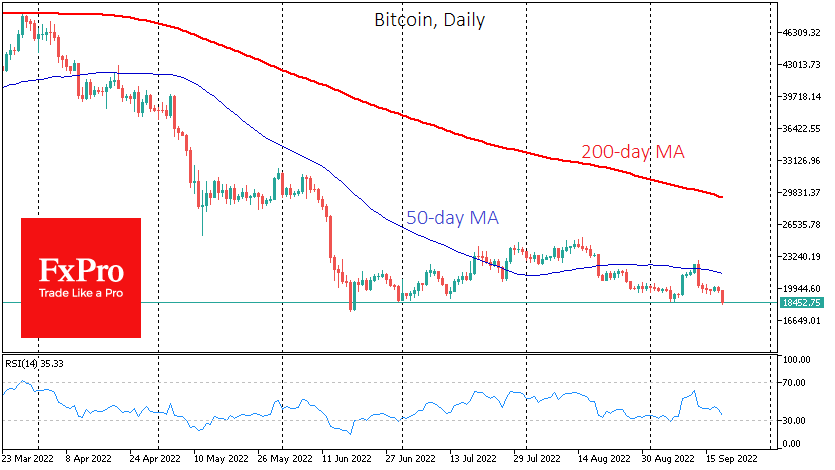
The local technical picture in BTCUSD looks quite worrying. The pair has fallen to the lows of June, where it spent a few hours during the long squeeze.
Bitcoin’s main fall came Tuesday on higher-than-expected US inflation, raising the possibility of a sharper monetary policy tightening at this week’s Fed meeting.
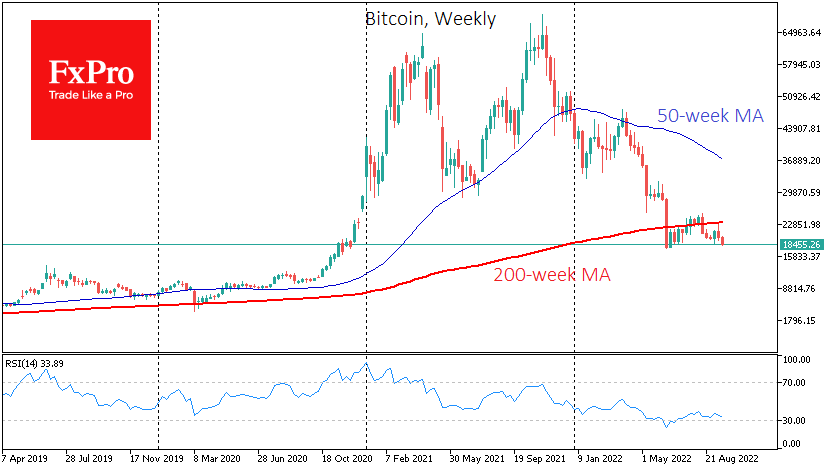
The bear market was confirmed by BTCUSD actively selling off after testing the significant moving averages – the 50-day and 200-week moving averages. The latter, which had previously confirmed that the crypto market was growing over the long term, capitulated in June. And in recent months has acted as a selling point from which to intensify, convincing investors that the 10k mark of Bitcoin will be seen sooner than the 30k mark.
News background
Ethereum’s transition to the new algorithm last week was a success, with the network’s power consumption reduced by 99.95%. However, the hopes of crypto bulls, expecting a rise in quotations, were not fulfilled.
Changpeng Zhao, CEO of cryptocurrency exchange Binance, urged traders to be patient. In his view, the move to PoS should not be expected to impact the Ethereum ecosystem immediately.
US Securities and Exchange Commission (SEC) chief Gary Gensler has warned after The Merge update ETH can be treated as security from a legal perspective.
Nassim Taleb, the author of Black Swan, called bitcoin a “tumour” caused by the US Federal Reserve’s loose monetary policy. In his view, 15 years of low-interest rates ruined the economy and created bubbles in the market, like BTC.
Gold Faces Dim Outlook as New Resistance Pops Up
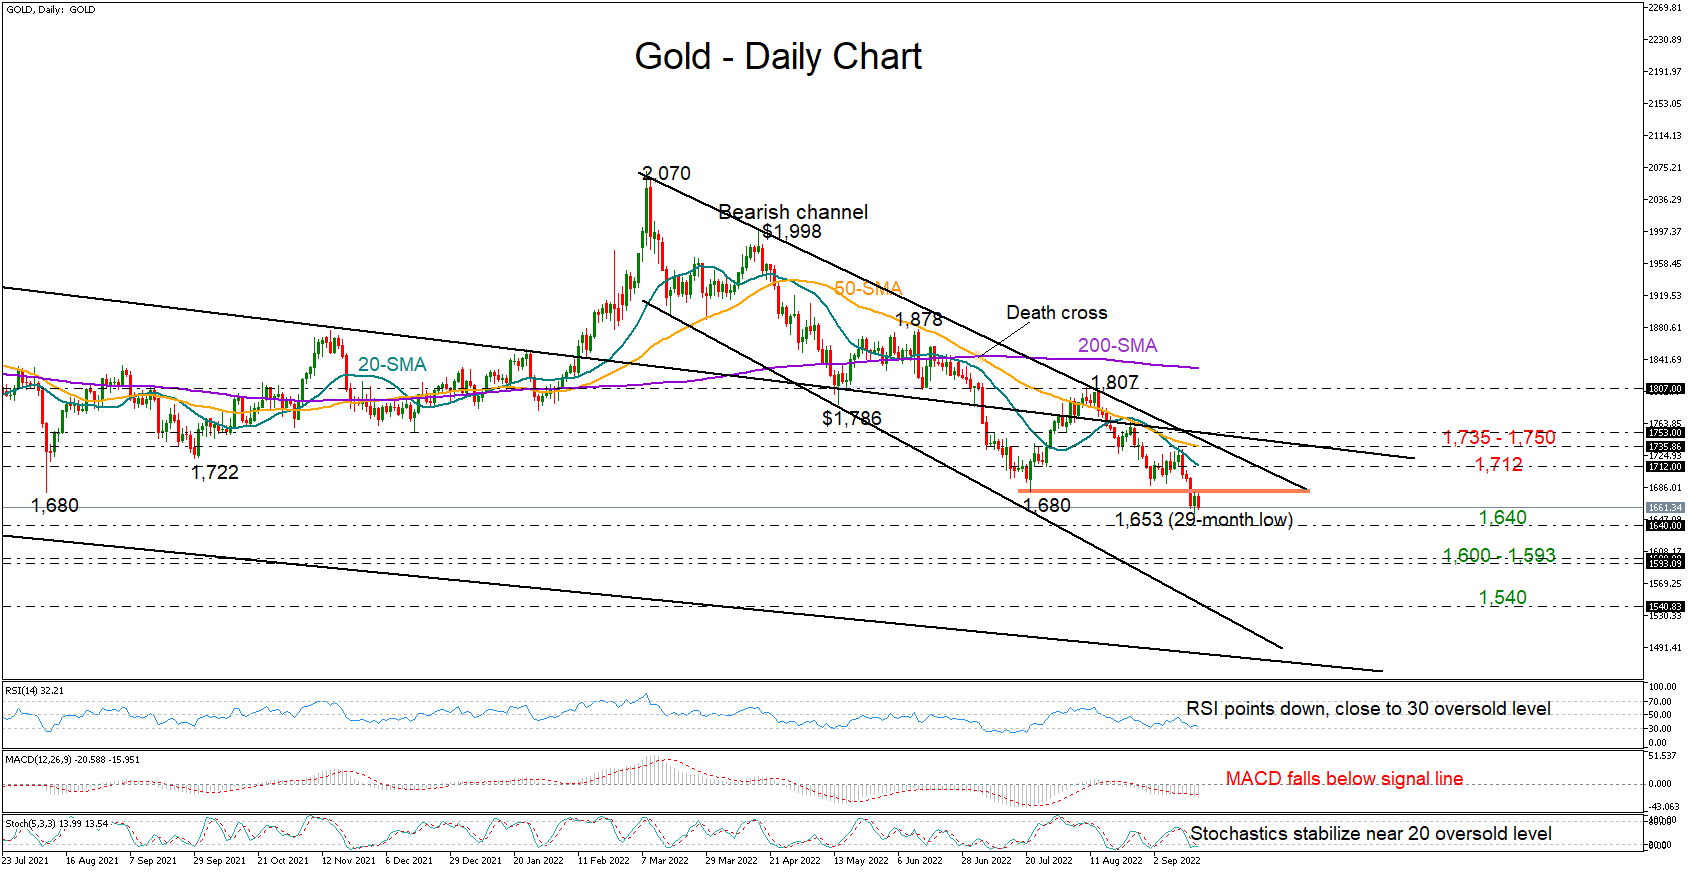
Gold resumed its bearish momentum early on Monday after Friday's rebound off a 29-month low of 1,653 faded immediately around the previous low of 1,680. Strikingly, the latter overlaps with the 200-weekly moving average (SMA), which has been out of sight since the end of 2018.
In technical indicators, the bearish cross within the 20- and 50-day SMAs is endorsing the negative trend in the market. Meanwhile, the MACD is set for another downside extension below its red signal and zero lines, while the RSI and the stochastics, although close to their oversold levels, have yet to change direction northwards, all keeping the bias on the bearish side for now.
If the 1,680 resistance stands firm, the precious metal could slide towards the 1,640 barrier from February-April 2020. Breaking lower, the 1,600 psychological mark may attract special attention in fear that any violation at this point could quickly sink the price to the bottom of the bearish channel seen around 1,540.
Alternatively, a close above the 1,680-1,690 constraining zone could stage a new battle near the 20-day SMA currently at 1,712. Running higher, the price may next attempt to breach the 50-day SMA at 1,735 and successfully pierce the channel’s upper band at 1,750. Note that a former restrictive line is also passing through this area.
Summarizing, gold remains exposed to additional declines as the price is fighting a critical support-turned-resistance zone at 1,680. If the bulls cannot knock down that wall, the bears may further worsen the already dim outlook.
Daily Technical Analysis
EUR/USD
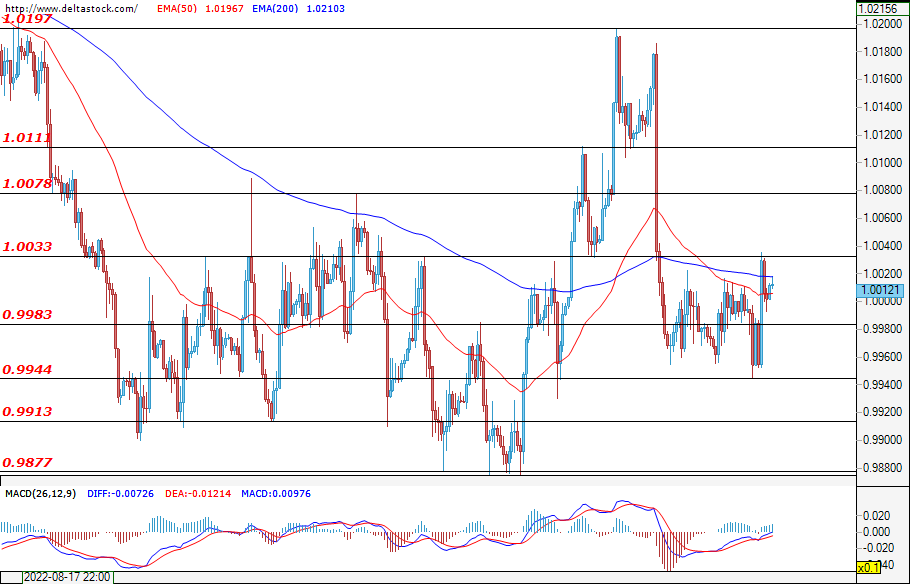
Over the past week, we saw highly volatile movements within the single European currency. The market reached a high of 1.0197, but was later affected by a sharp correction that took the pair down towards the levels at around 0.9950. There, we saw repeated attempts by the bulls to break through the resistances at around 1.0000, but with no success. The attempts of the bears to breach the bottom below 0.9950 were also fruitless. This week, we expect streams of important events that could lead to even greater volatility. On Wednesday, we will await the decision of the U.S. Federal Reserve on its main interest rate and the follow-up market reaction to the expected increase by another 0.75%. Then, on Friday, we will follow the EU managers' estimates on manufacturing and services. Today, however, there are no scheduled events that are expected to move the EUR/USD in any fundamental way. Whether the pressure will continue and whether the level at 0.9950 will be breached remains to be seen later this week. However, a possible negative reaction to the dollar should not be ruled out as well.
USD/JPY
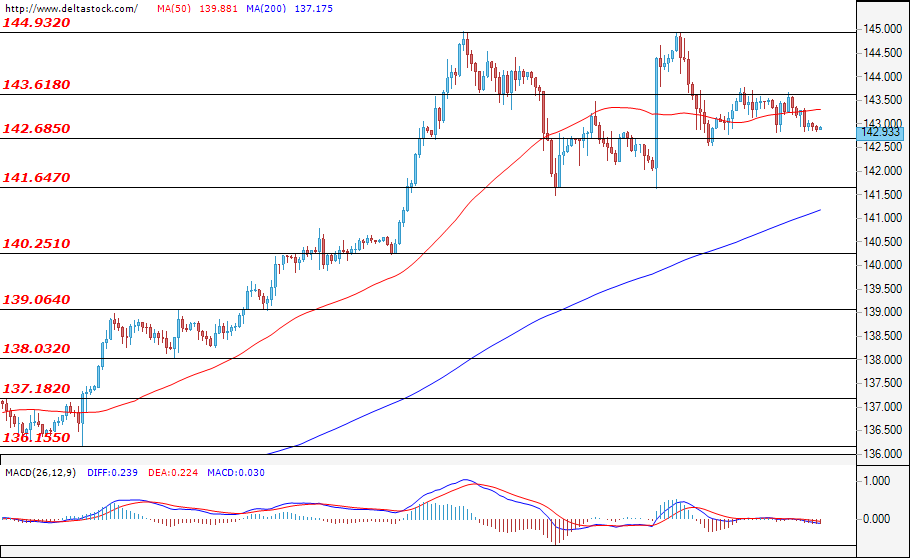
On Wednesday last week, the Ninja's attempt to breach its previous high of 144.93 failed, and by the end of the week, the currency pair was locked in a narrow range between 143.60 and 142.60. The dollar is calling the shots so far, so the most important data in the coming days will be the Fed's decision to raise the key interest rate in the U.S. by another 0.75% on Wednesday. Usually, the reaction is positive for the dollar and we will likely see an extension of the rally against the yen that has not stopped since the beginning of the year, but divergences in Fed expectations could shake the dollar and result in a deeper correction than the one we witnessed just a few trading sessions ago. Let's also not forget the interest rate decision from Japan’s BoJ, which is expected this Thursday. No changes in the policy of the Japanese central bank are expected, but surprises here should not be ruled out still. Today is an official non-working day in Japan, so support for the currency is expected to be weak.
GBP/USD
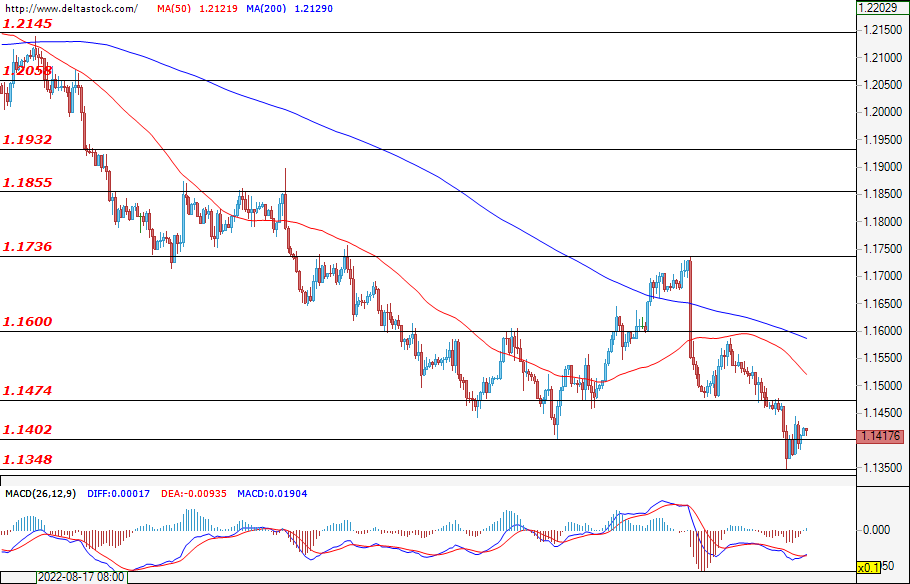
The Cable continued its downtrend from last week. After seeing a weekly high of 1.1736 on Tuesday, it looks like the bears have found good entry points as they took full control over the pair right until the end of the week. A few hours before the end of the last trading session for the week, we saw a new bottom at 1.1348. There, the pair stabilised and managed to end the session at about 80 pips higher than the local bottom. This week, on Thursday, the Bank of England will also announce its main interest rate decision, but not before the Fed’s decision on Wednesday. The BoE is expected to raise its rate by 0.50%. Rumours of both a larger and a smaller interest rate hike are both present, so the reaction to the data should be closely monitored. The downtrend is strong, but a potential interest rate hike could stabilise the currency pair and we could see sharp upward corrections.
EUGERMANY40
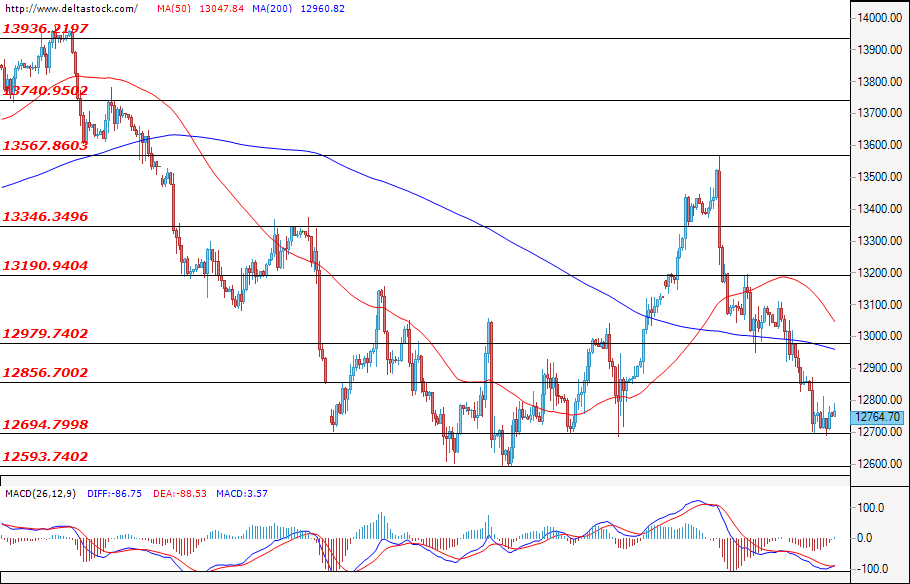
Last week, the EUGERMANY40 got off to a decent start by reaching a high of 13567, but as with the other instruments mentioned in today's analysis, the downward corrections did not wait. We saw a sharp decline and a consolidation at around 13000, but the key level did not hold and another bear attack followed, which found its bottom at 12690. The German index therefore failed to reach a new bottom and did not confirm its downtrend. Important to its direction this week will be the German managers' assessment of manufacturing, which we will see on Friday at 07:30 GMT. We also see a high correlation with the U.S. indices which, in turn, are expected to be affected by the U.S. interest rate decision on Wednesday.
US30
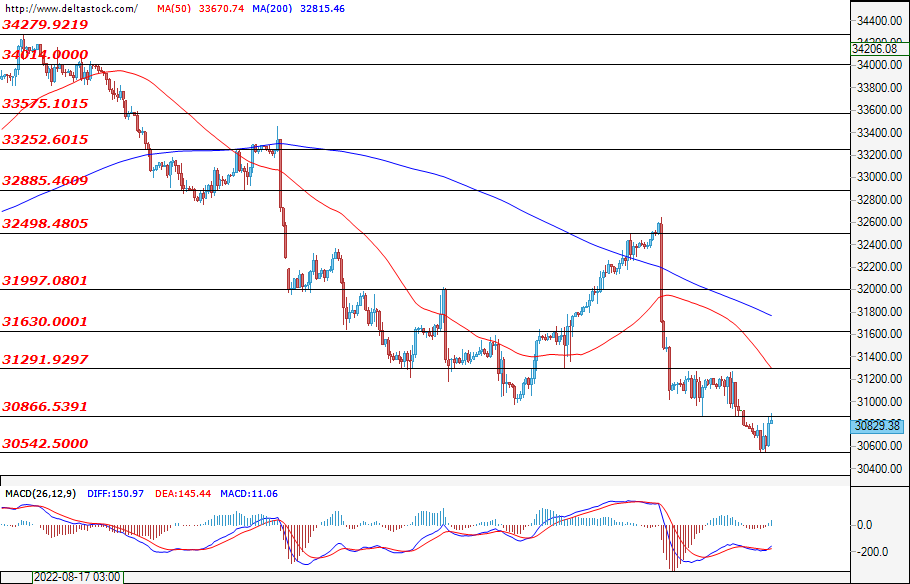
The blue-chip index also started last week with some recent gains and reached the key level of 32500. However, what followed was one of the most aggressive bear attacks in the last quarter. The declines in some shares were so big that trading on the exchange was halted for a couple of minutes. .A consolidation followed, which lasted for almost three days. However, this was followed up by yet another bear attack that resulted in a new low of 30542. The downward pressure is high due to expectations this week that the Fed will raise its main rate on Wednesday at 12:30 GMT) by another 0.75 basis points, or up to 3.25%. Much of this decision is already baked into the market, but if we see a surprising decision from the Fed, then the market’s reaction could also be unexpected. While the probability of the trend to continue its decline is high, aggressive and tempting upward corrections should not be ruled out as well.
Gold Price Started a Fresh Decline from Well above $1,700
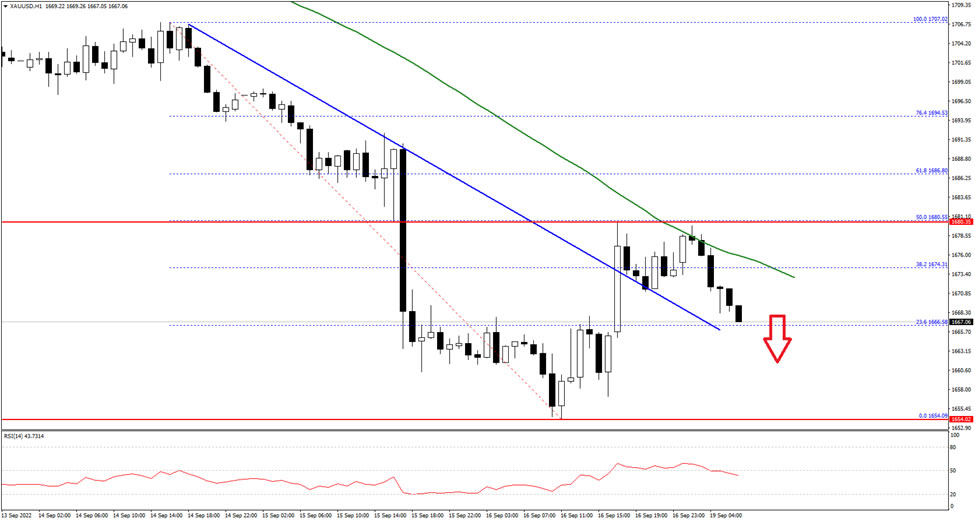
Gold price started a fresh decline from well above the $1,700 level against the US Dollar. The price traded below the $1,680 support to move into a bearish zone.
It traded as low as $1,654 and recently started an upside correction. There was a move above the $1,665 level and a connecting bearish trend line on the hourly chart. However, the bears appeared near the $1,680 level and the 50 hourly simple moving average.
The first major resistance is near the $1,680 level. The next main resistance could be near the $1,688 level, above which the price could start another steady increase.
On the downside, an initial support is near the $1,660 level. The next major support is near the $1,655 level, below which the price might decline towards the $1,648 support level in the near term. Any more losses might call for a test of $1,635 on FXOpen.
EURUSD Hovers Around the Parity Level Again
EURUSD is moving back and forth of the 1.0000 psychological level, failing once again to surpass the descending trend line in the preceding week. The technical oscillators seem to be in confusion, as the MACD is holding above its trigger line in the negative region, while the RSI is ticking lower below the neutral threshold of 50.
If the price has a closing day below the parity level, then the focus should shift to the downside again, meeting the 20-year trough at 0.9863 ahead of the low in September 2022 at 0.9835. More downside pressures could open the way for the 0.9780 barrier before tumbling to the 0.9700 handle, registered in September 2022.
Alternatively, a move higher and a break of the 50-day simple moving average (SMA) at 1.0094, which hovers near the falling trend line could add to optimism for more bullish actions, meeting the 1.0200 and 1.0355 resistance levels.
All in all, EURUSD is appearing neutral in the very short-term timeframe, beneath the 1.0200 barrier and above the 20-year low of 0.9863. Only a climb above the long-term downward sloping channel may change the outlook to bullish.

GBPUSD Elliott Wave: Forecasting The Decline After Irregular Flat
Hello Fellow Traders. In this technical article we’re going to take a look at the Elliott Wave charts charts of GBPUSD forex pair published in members area of the website. As our members know GBPUSD is showing incomplete bearish sequences and we were calling for an extension in weakness. Recently the pair corrected the short term cycle from the 1.2294 peak. Recovery unfolded as Elliott Wave Irregular Flat structure. Once the pair completed flat pattern, GBPUSD made decline toward new lows as expected. In further text we’re going to explain the forecast and Elliott Wave Pattern.
Before we take a look at the real market example of Expanded Flat, let’s explain the pattern in a few words.
Elliott Wave Expanded Flat Theory
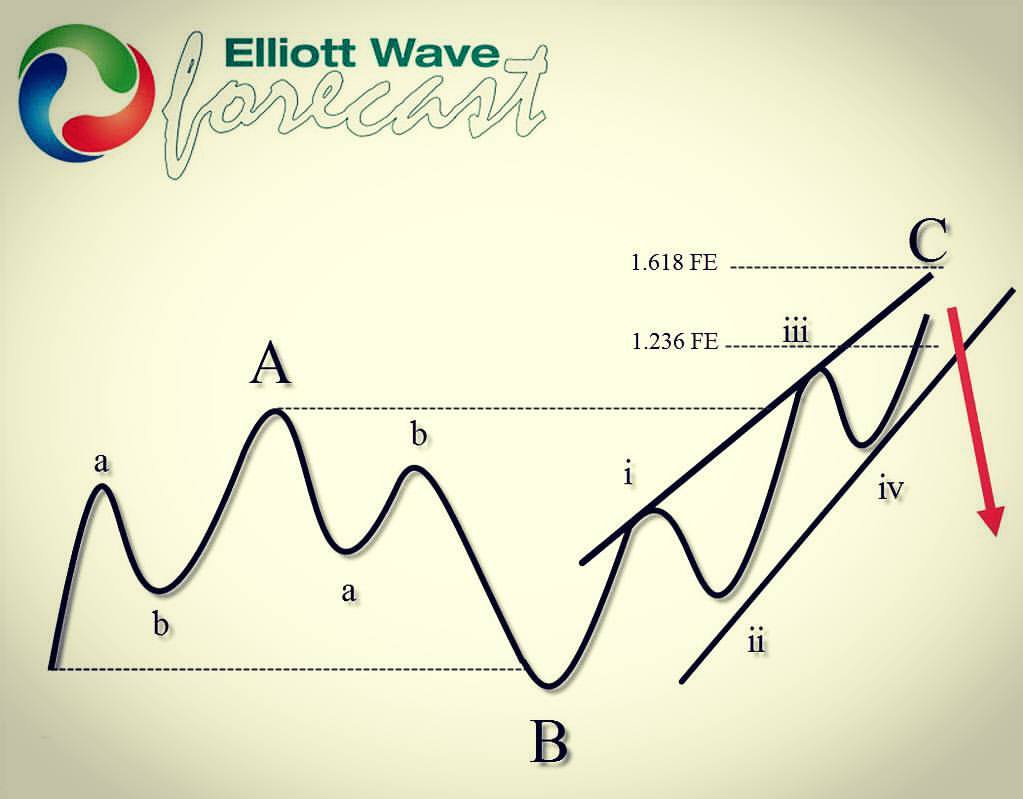
Elliott Wave Flat is a 3 wave corrective pattern which could often be seen in the market nowadays. Inner subdivision is labeled as A,B,C , with inner 3,3,5 structure. Waves A and B have forms of corrective structures like zigzag, flat, double three or triple three. Third wave C is always 5 waves structure, either motive impulse or ending diagonal pattern. It’s important to notice that in Irregular Flat Pattern wave B completes below the starting point of wave A. Wave C ends above the ending point of wave A . Wave C of Flat completes usually between 1.00 to 1.236 Fibonacci extension of A related to B, but sometimes it could go up to 1.618 fibs ext.
At the graphic below, we can see what Expanded Flat structure looks like
Now, let’s take a look what Elliott Wave Flat Pattern looks like in the real market
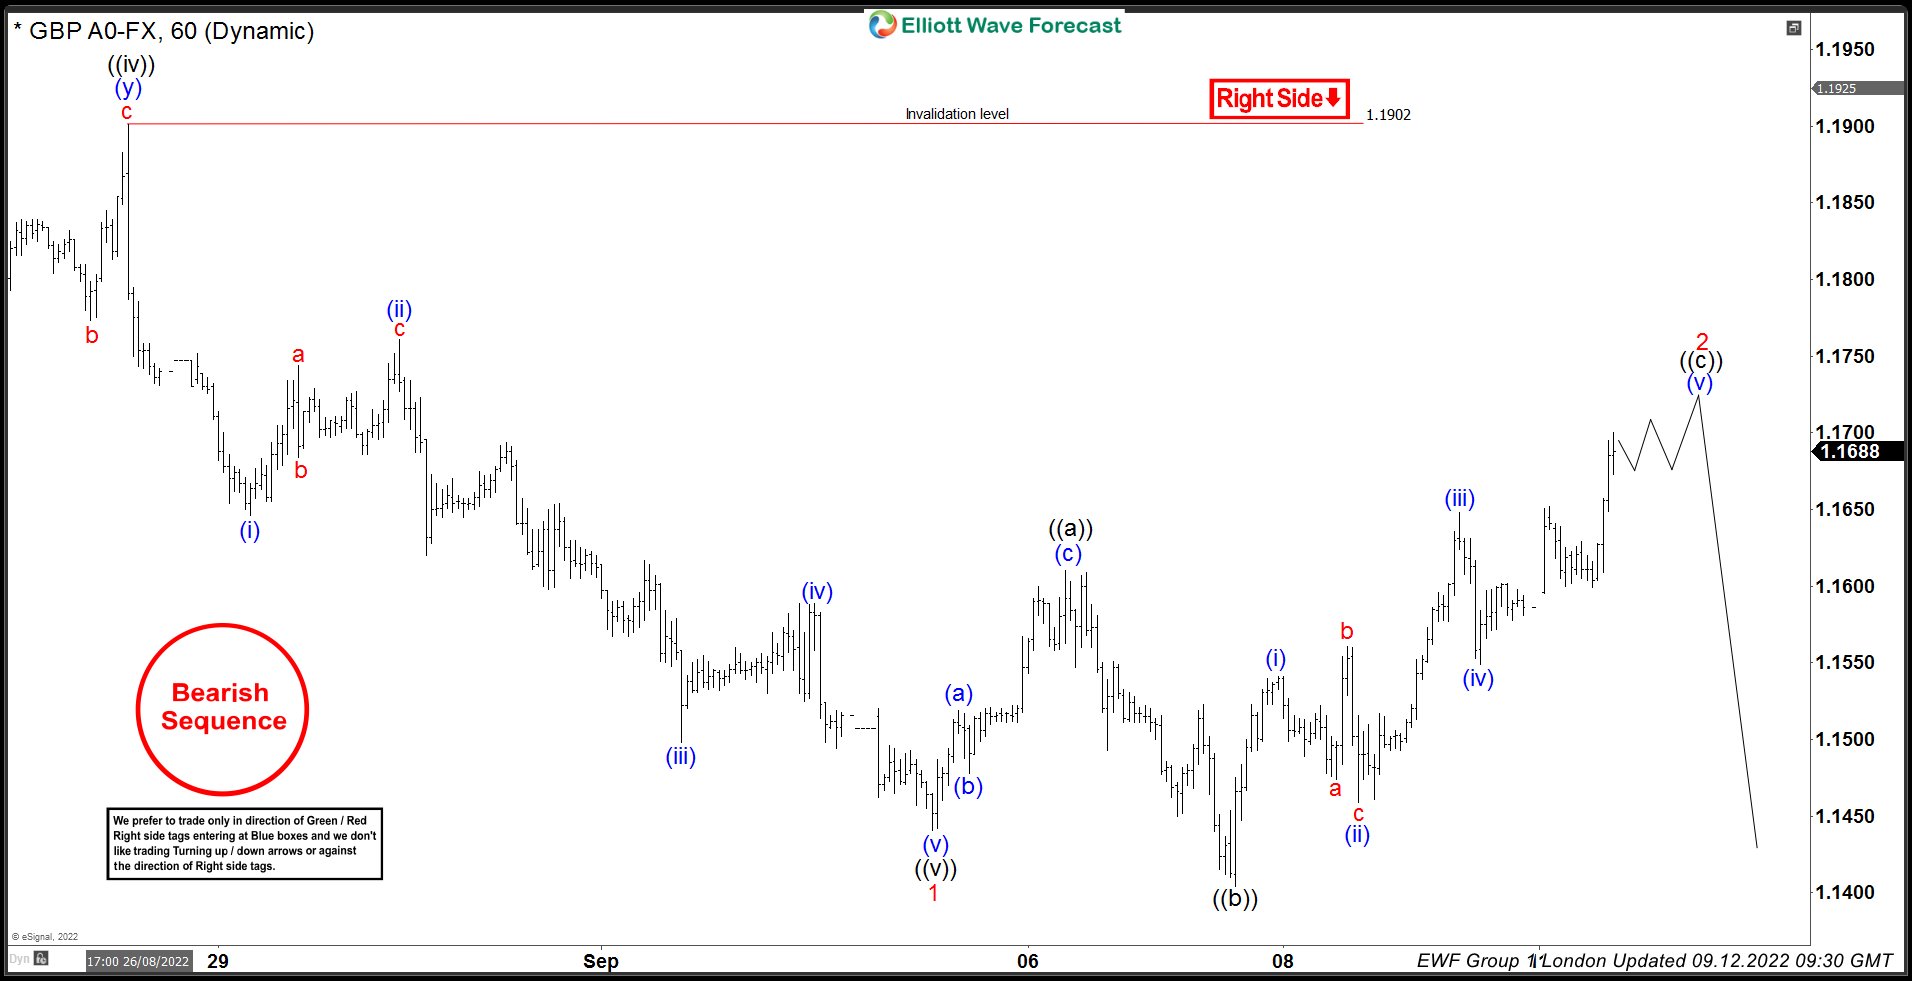
GBPUSD 1h Hour Elliott Wave Analysis 09.12.2022.
GBPUSD is giving us recovery against the 1.1902 peak that is unfolding as Expanded Flat Pattern. We can see waves ((a))and ((b)) black are showing corrective sequences. Wave ((b)) has broken the starting point of ((a)) while ((c)) has broken ending point of ((a)) which suggests this correction is unfolding as expanded flat. Wave ((c)) leg already shows 5 waves up. However if we downgrade the chart we can see that subdivison of (v) blue is still incomplete . We look for a shallow pull back and another marginal push up to complete the pattern. Approximate area to complete 2 red recovery comes at 1.1686-1.1770.
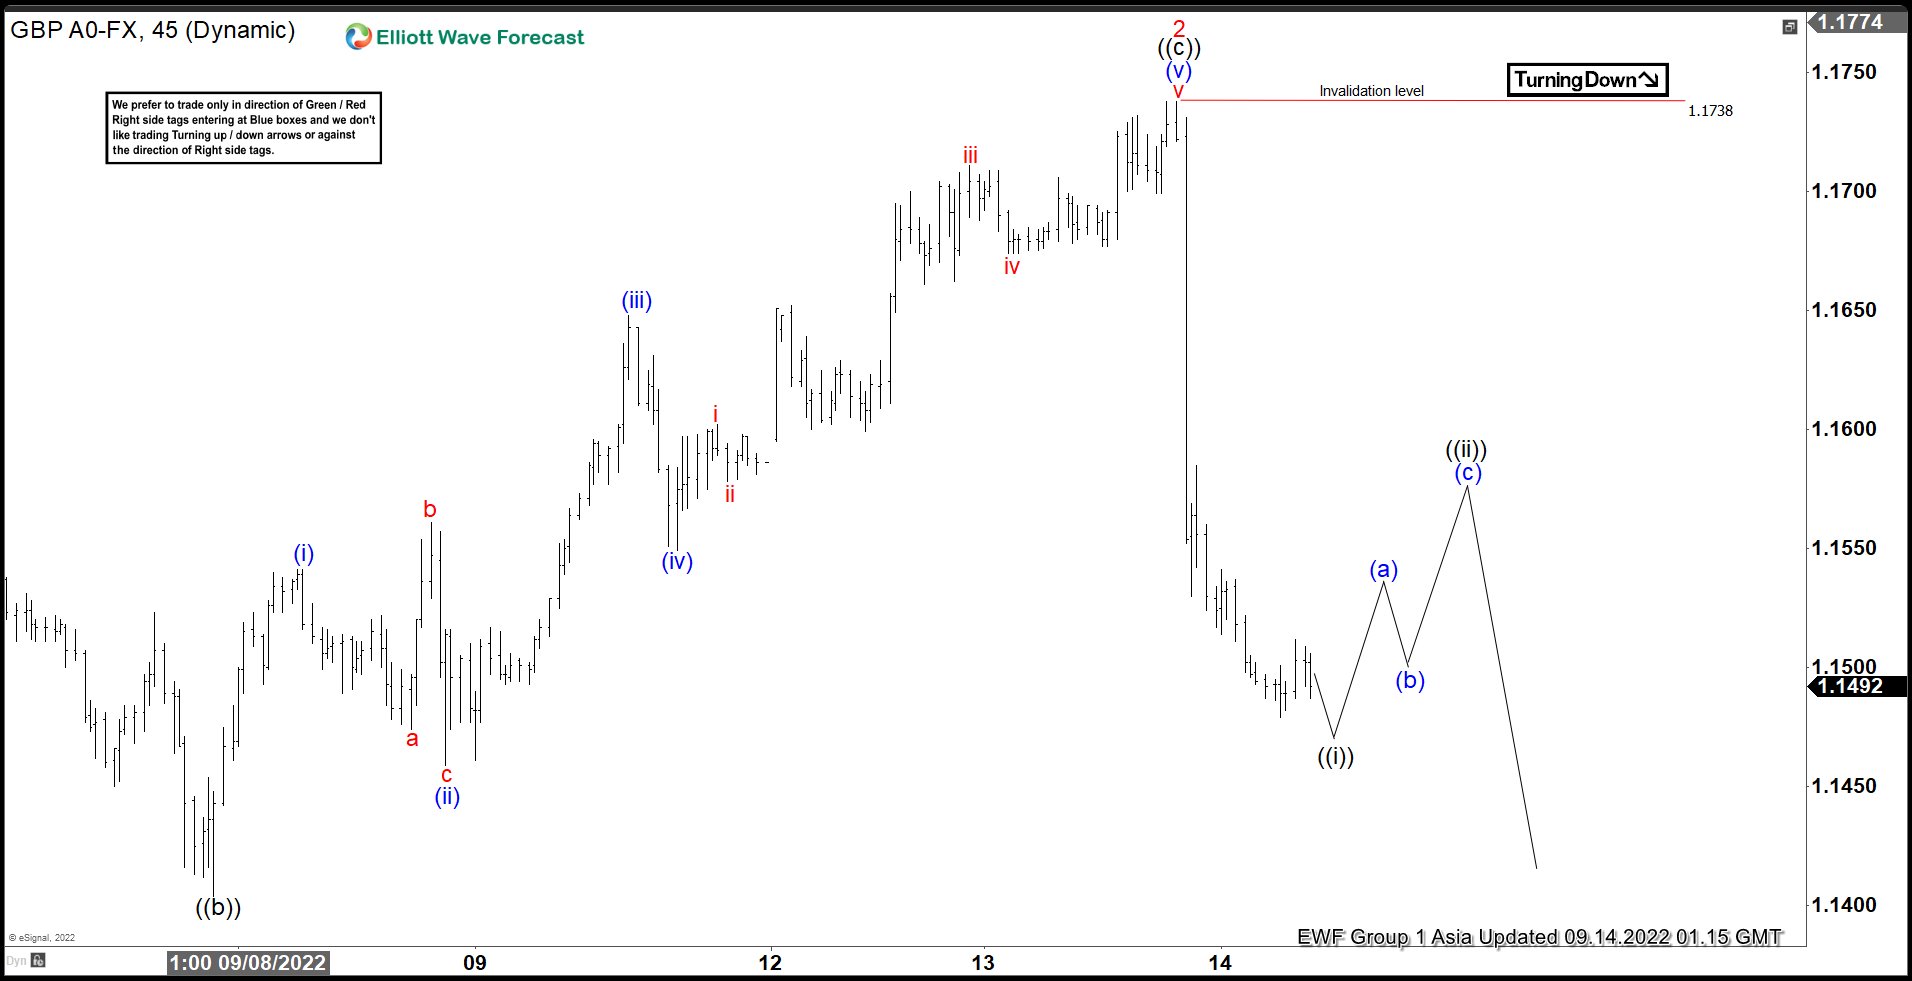
GBPUSD 1h Hour Elliott Wave Analysis 09.14.2022.
We got shallow pull back iv red of (v) blue and another high v red as expected. Wave 2 recovery completed as a expanded flat at 1.1738 high. GBPUSD made sharp decline from that high ,that looks impulsive. We expect ((i)) black to complete soon after which we should ideally see a 3 waves bounce in ((ii)) black. As far as 1.1738 pivot holds, more weakness should be ideally seen in the pair.
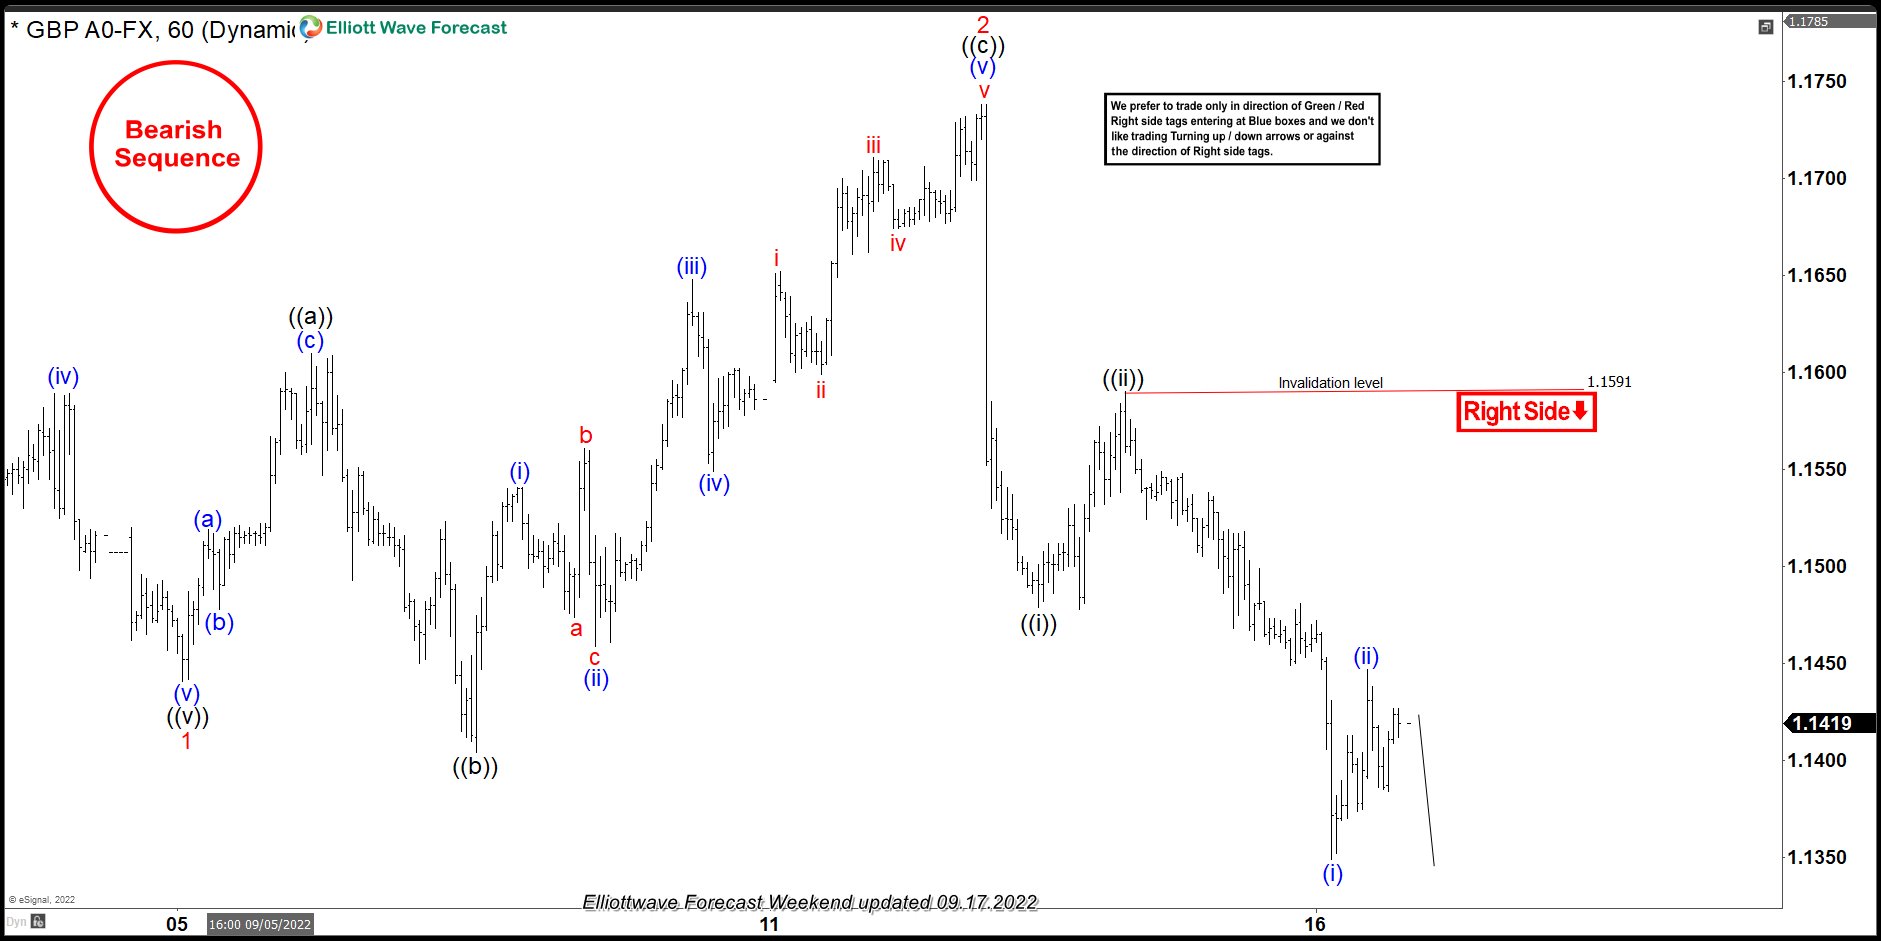
GBPUSD 1h Hour Elliott Wave Analysis 09.17.2022.
The pair has given us 3 waves bounce ((ii)) black that ended at 1.1591 high. After short term bounce , the pair found sellers again and made drop toward new lows as expected. Now GBPUSD remains bearish against the 1.159 high in first degree.
USD/JPY: The Exchange Rate of the Currency Pair May Rise to 148.09
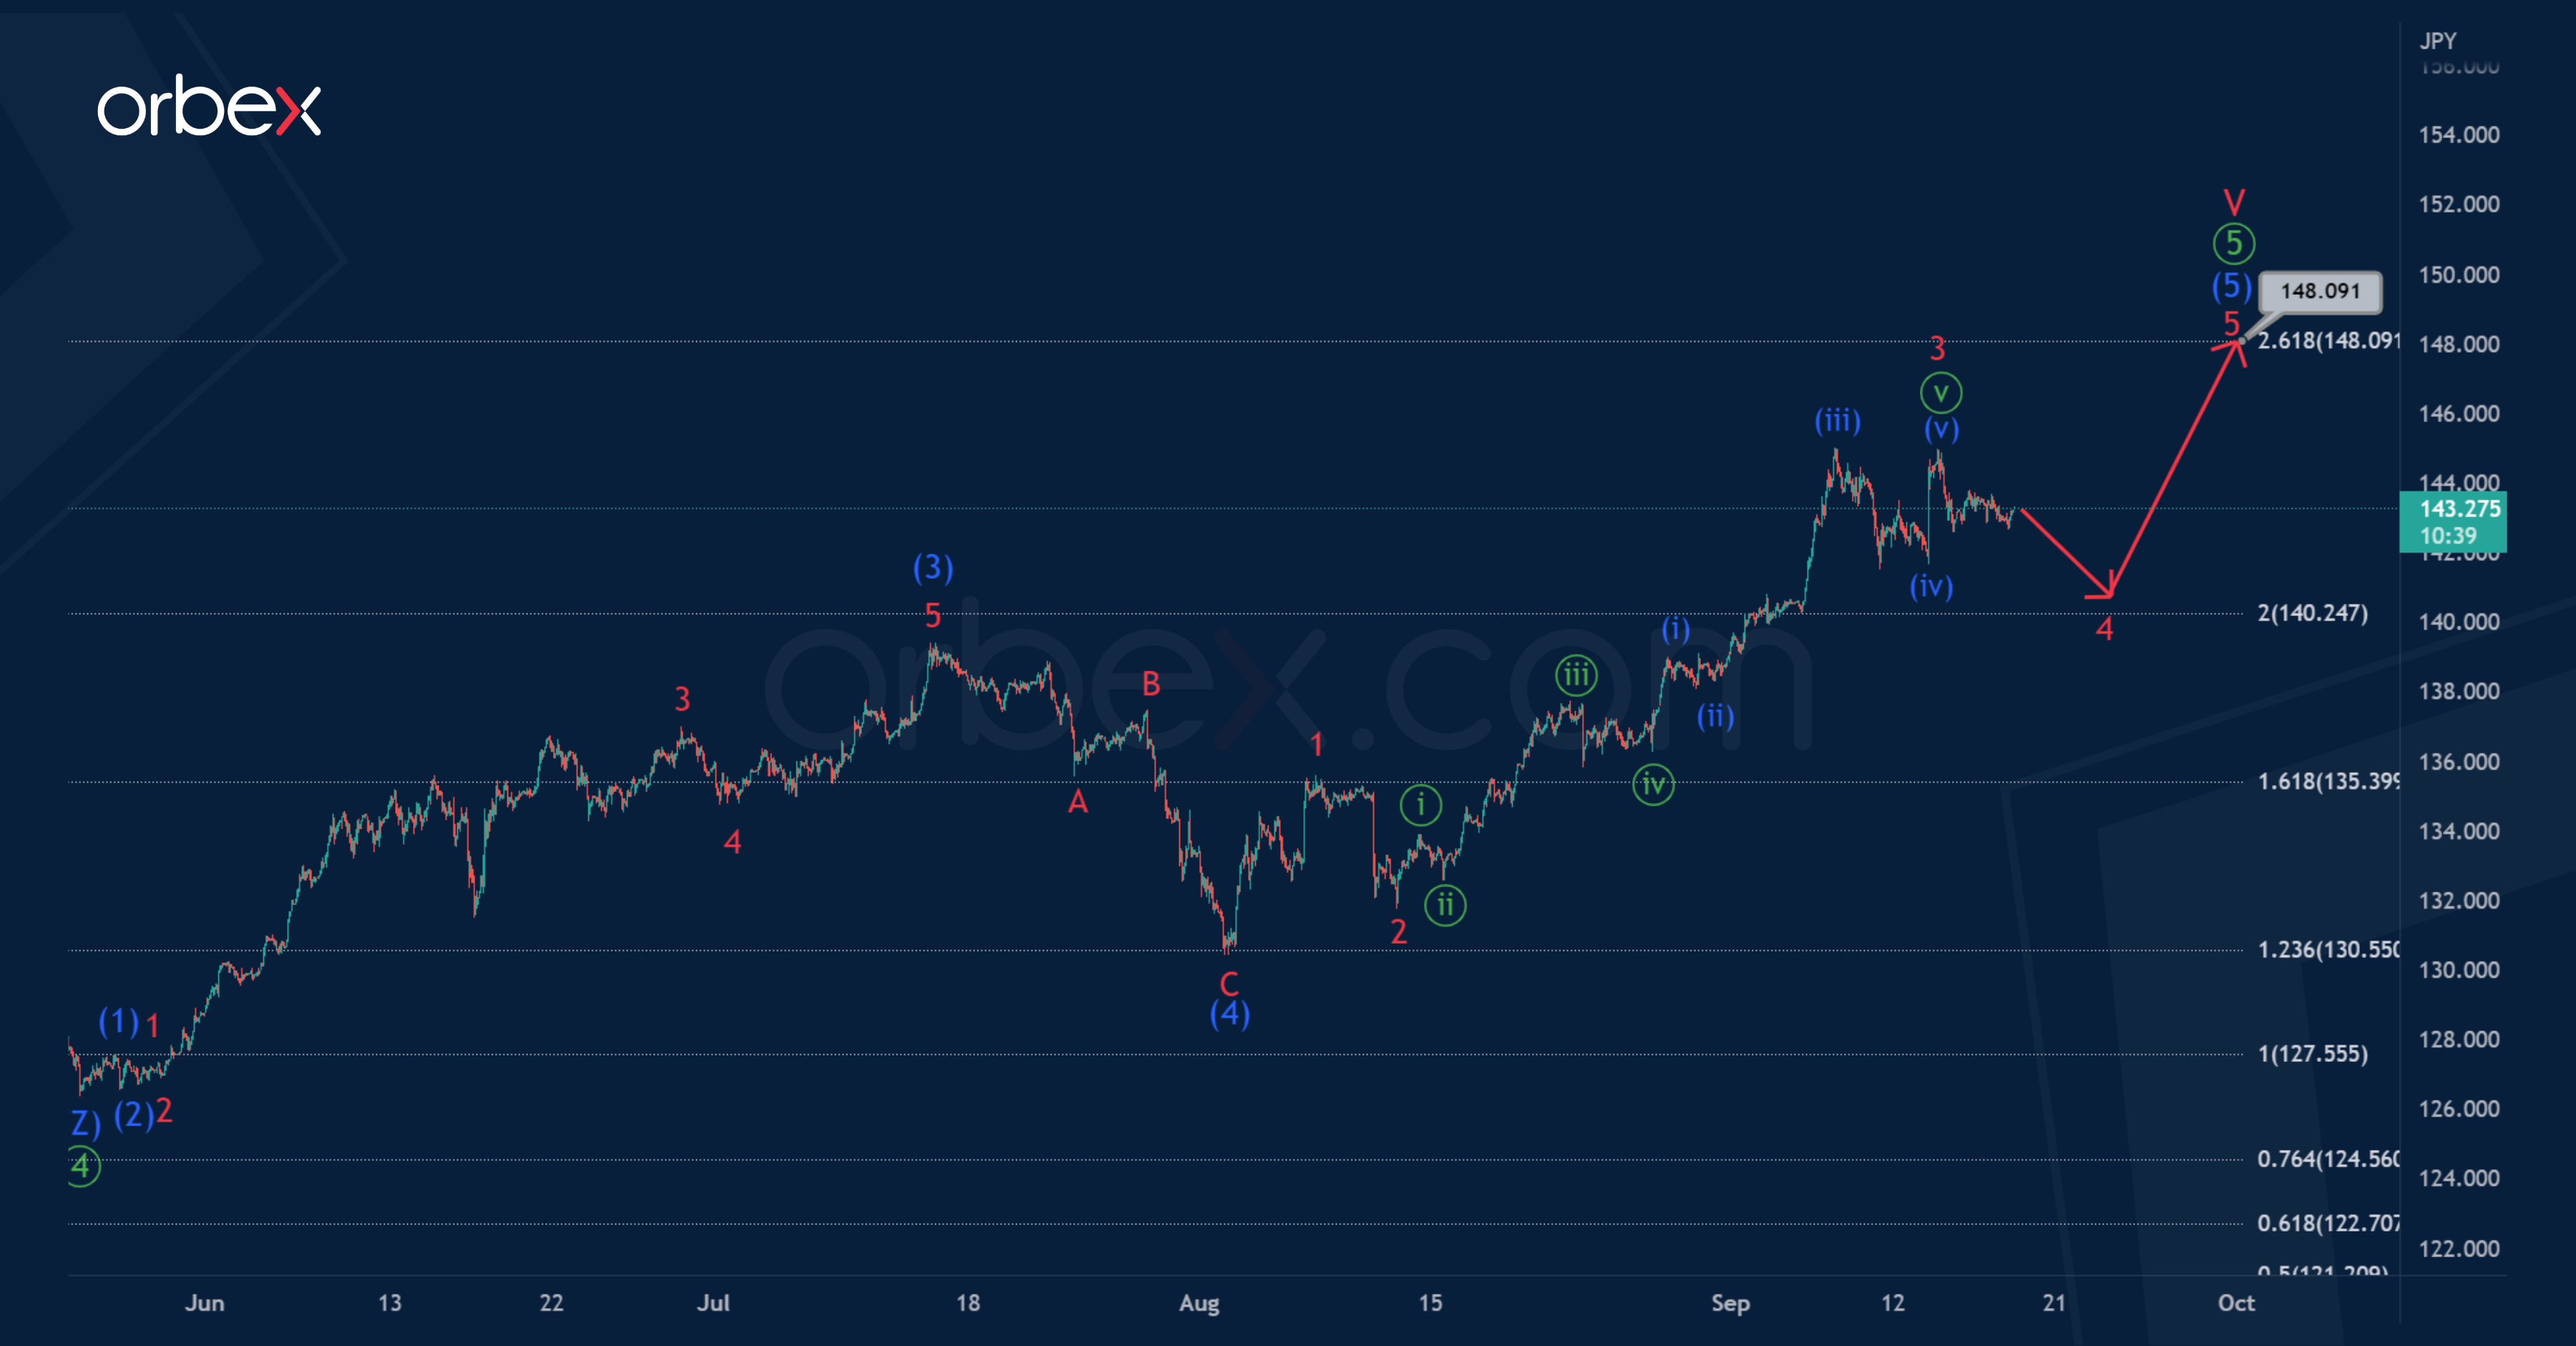
The structure of the USDJPY currency shows the formation of a global impulse trend, which consists of cycle waves.
On the current chart, we see how the price rises in a cycle wave V.
Wave V, apparently, takes the form of a 5-wave impulse ①-②-③-④-⑤ of the primary degree. In the specified pulse, the first four parts look completed.
Currently, we assume the construction of the primary fifth wave, which takes the form of an intermediate impulse. The price in the final primary wave ⑤ may rise to 148.09.
At that price level, wave V will be at 200% of previous cycle impulse III.
An alternative scenario shows that the entire cycle wave V has already completely ended in the form of a primary impulse.
Thus, in the next coming trading weeks, we can expect a fall in the exchange rate and the formation of a new bearish trend.
In the short term we may see the formation of bearish impulse, which will consist of primary sub-waves ① -② -③ -④ -⑤, as shown on the chart, where the first two small sub-waves ① - ② have already been built.
The upcoming decline may reach the area of 130.43, that is, the previous minimum of fluctuations, and then even lower.

DAX 40 Tests Critical Floor
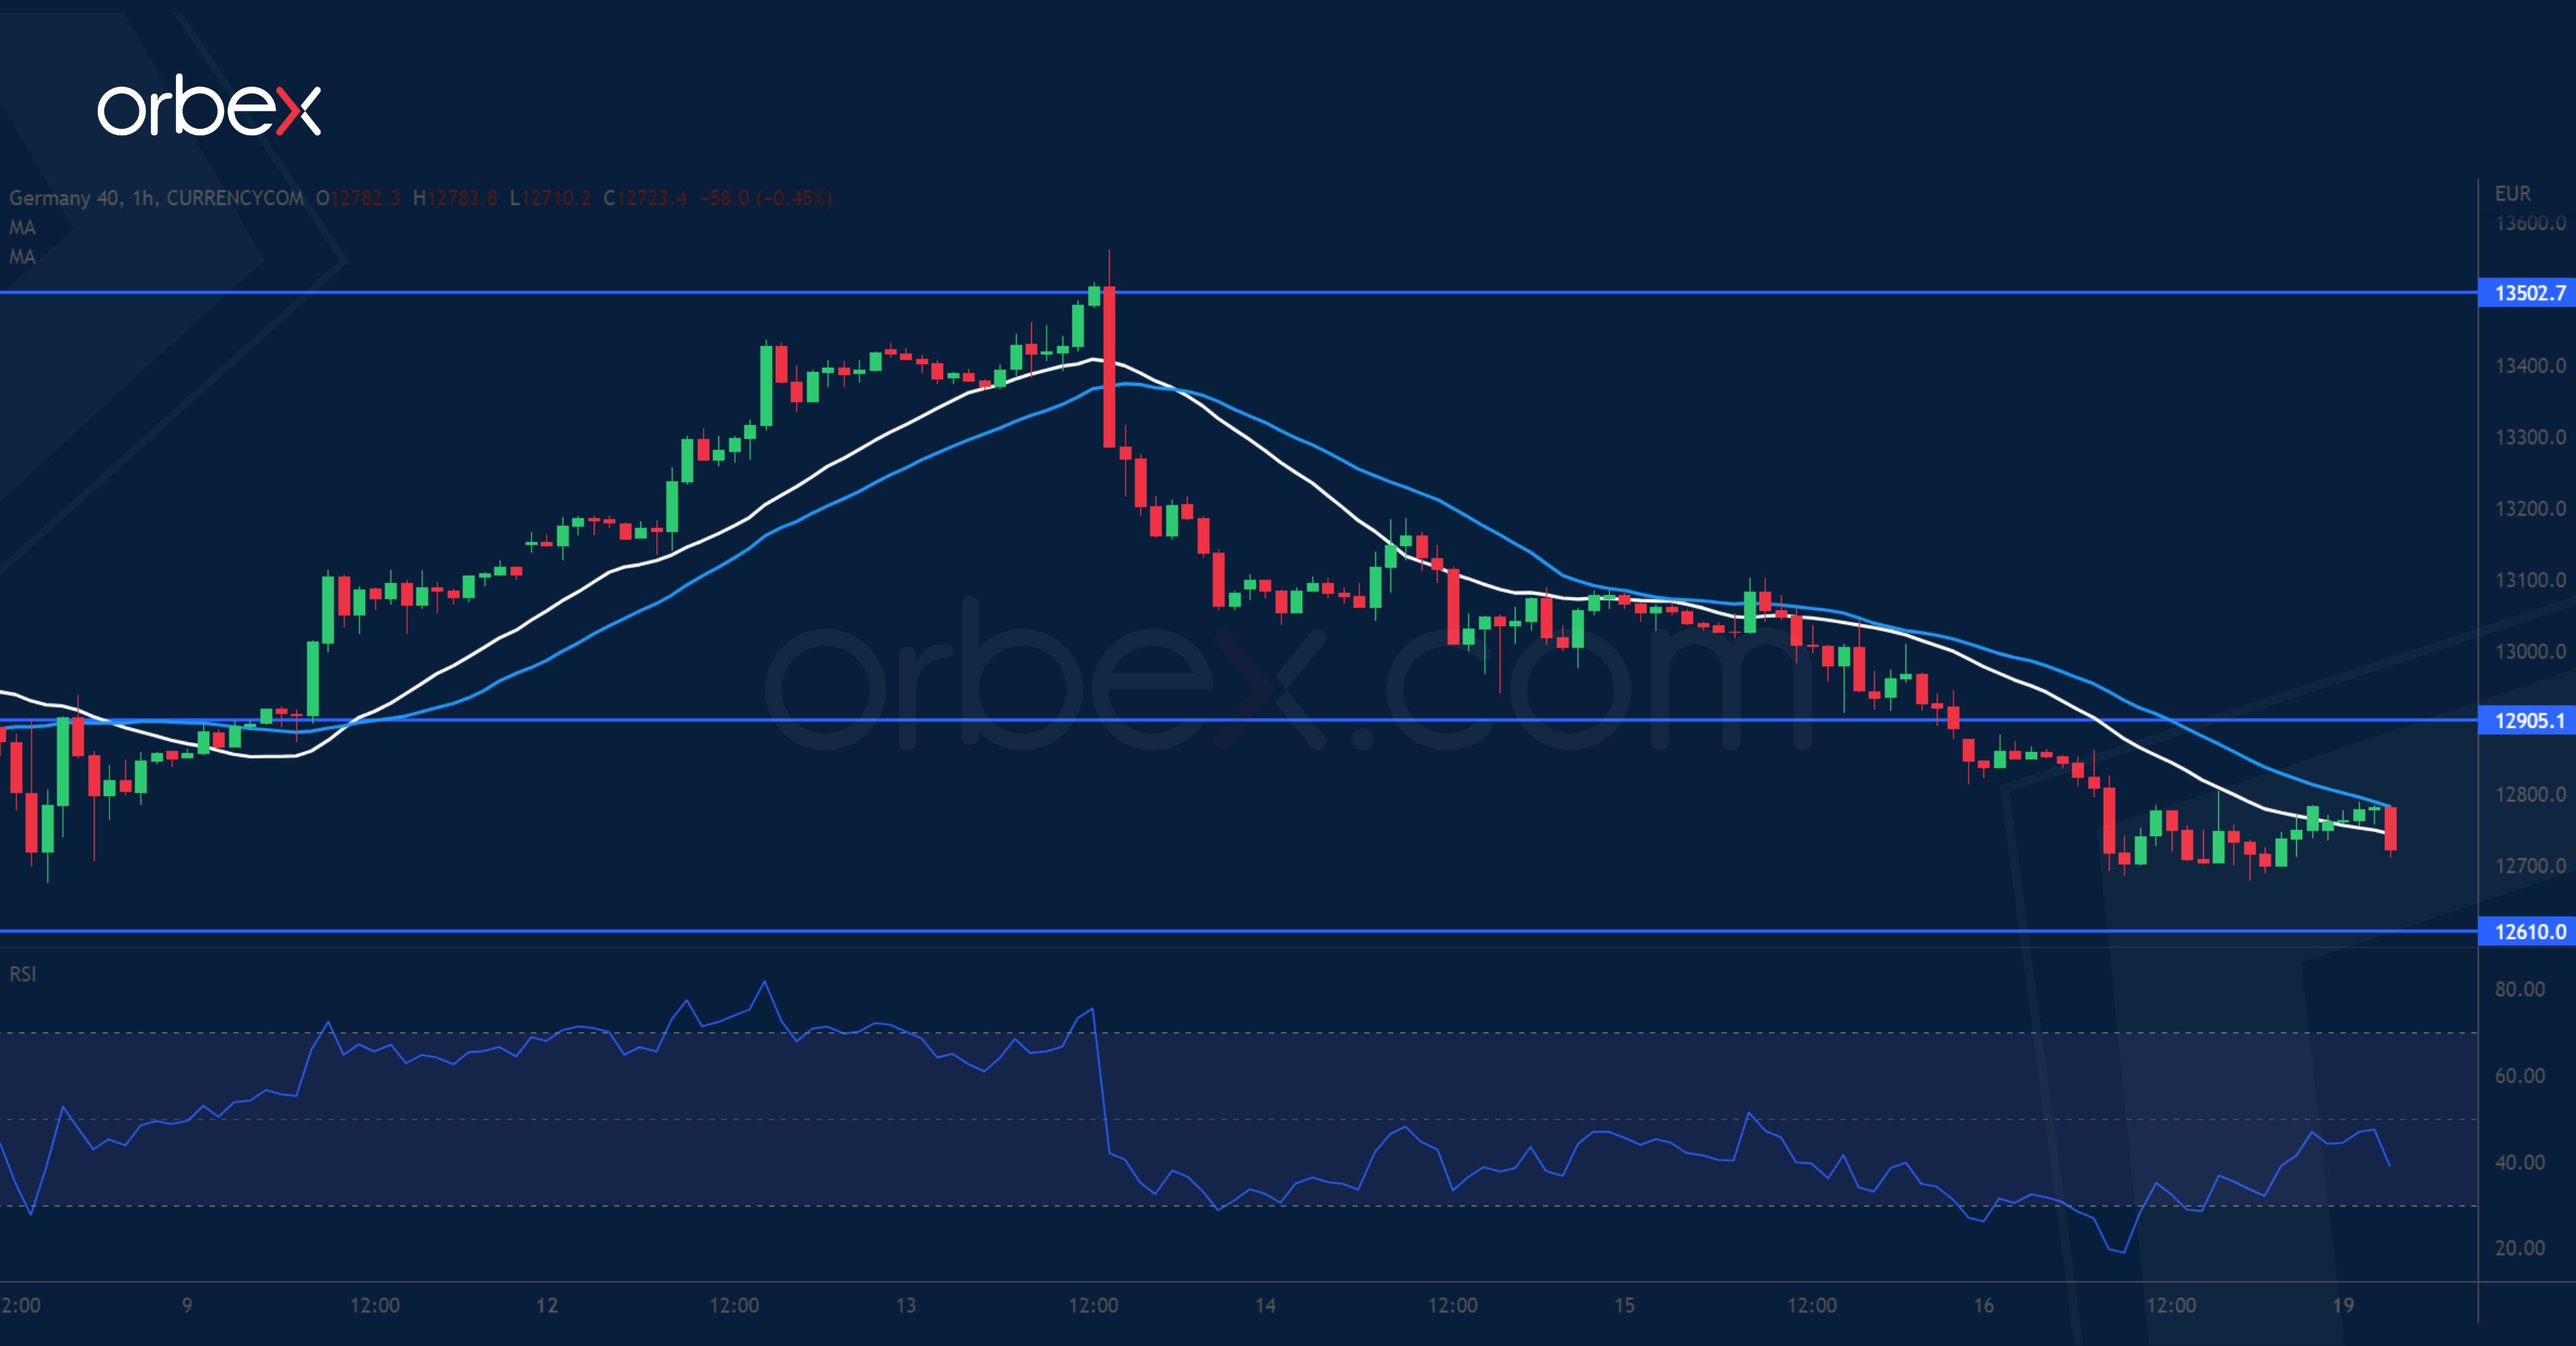
The Dax 40 slips as high interest rates prompt investors to take refuge in cash. After hitting the supply zone around 13500, the index has given up all gains from this month’s rally. This is a strong indication of the prevailing bearish bias. 12610 is the next support and its breach would bring the index back to the critical level of 12420. Then a bearish breakout may cause the remaining bulls to abandon the ship, resuming the downtrend towards 11900 in the medium-term. 12900 is a fresh resistance in case of a bounce.
AUD/JPY Seeks Support
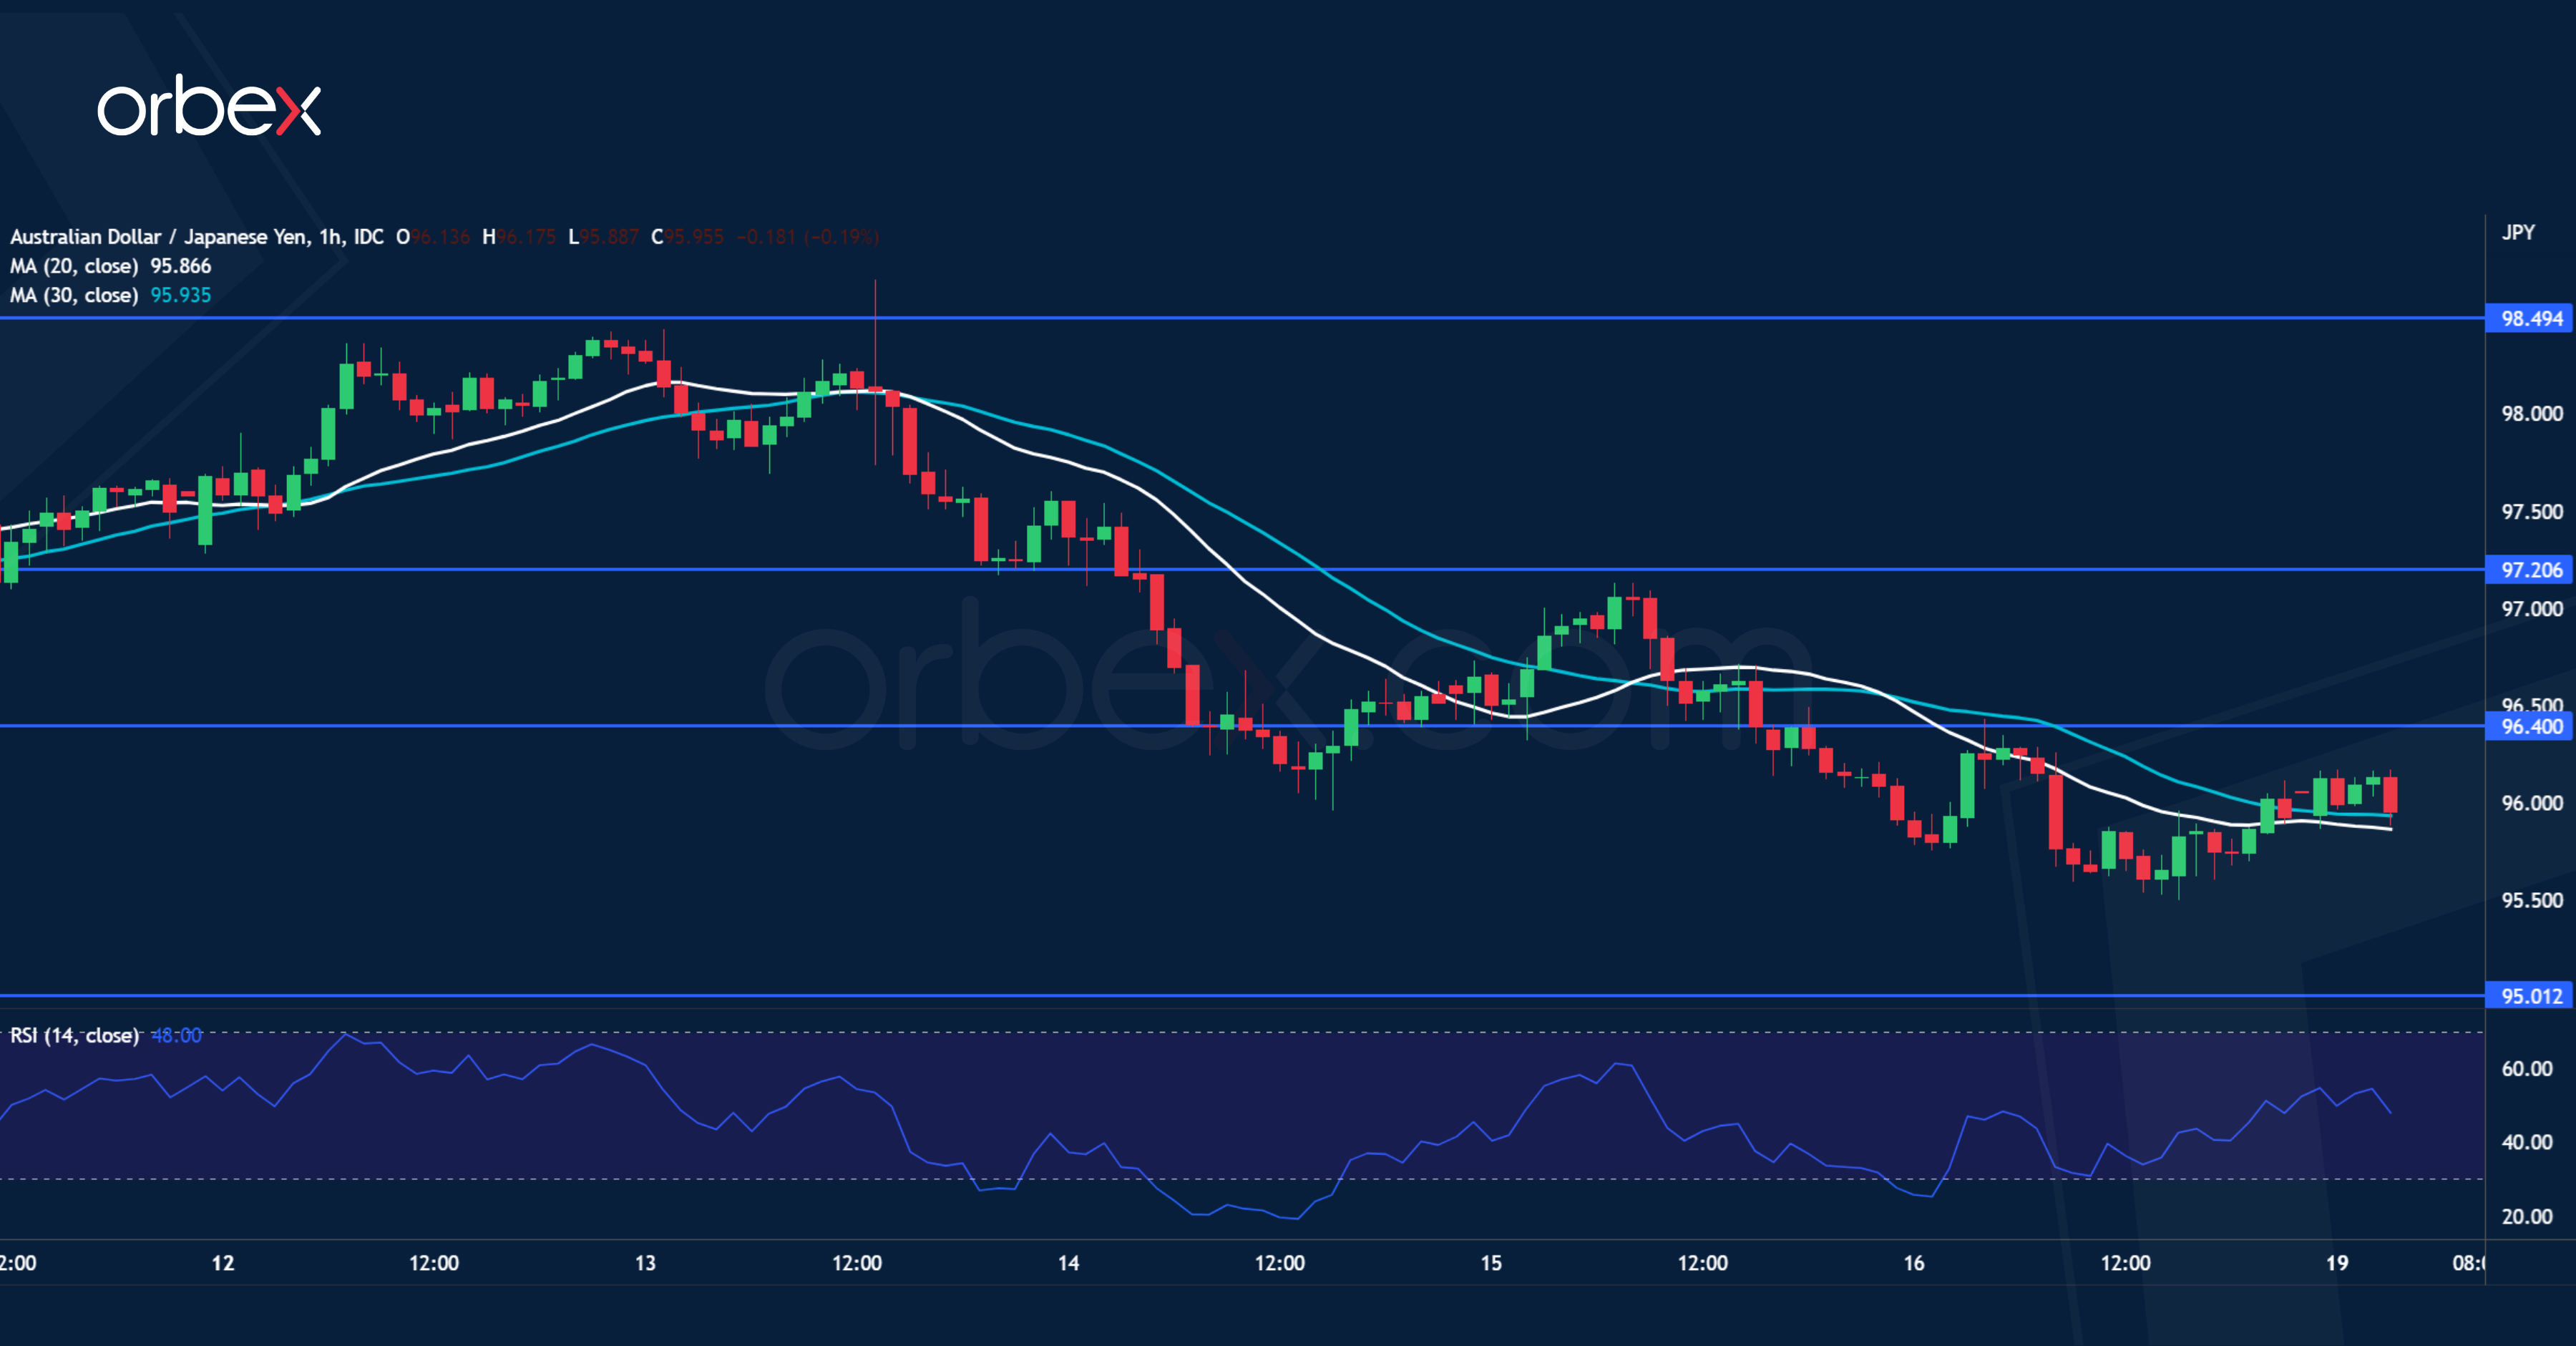
The Australian dollar softens as investors shun risk assets. The pair is looking to hold onto its recent gains after rallying above June’s high at 96.60. However, short-term price action may struggle as there is no sign of committed buying yet. A break below 96.70 has forced leveraged buyers to bail out. The daily support and psychological level of 95.00 is a major area to gauge buying interest. A bounce will need to lift 96.40 before it could take hold. Failing that, a bearish breakout would deepen the correction below 94.00.