

Sample Category Title
USD/CHF Daily Outlook
Daily Pivots: (S1) 0.9610; (P) 0.9636; (R1) 0.9670; More
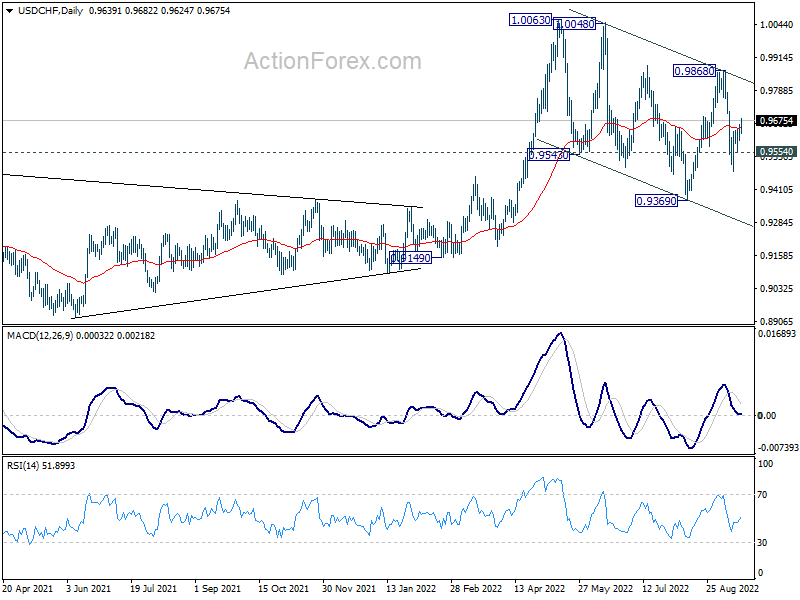
Intraday bias in USD/CHF is back on the upside with strong break of 4 hour 55 EMA (now at 0.9644). Further rally should be seen to 0.9868 resistance first. Break there will argue that larger up trend is ready to resume through 1.0063. Overall, the corrective pattern from 1.0063 high could still extend. Below 0.9554 minor support will turn bias back to the downside for 0.9478 and below.
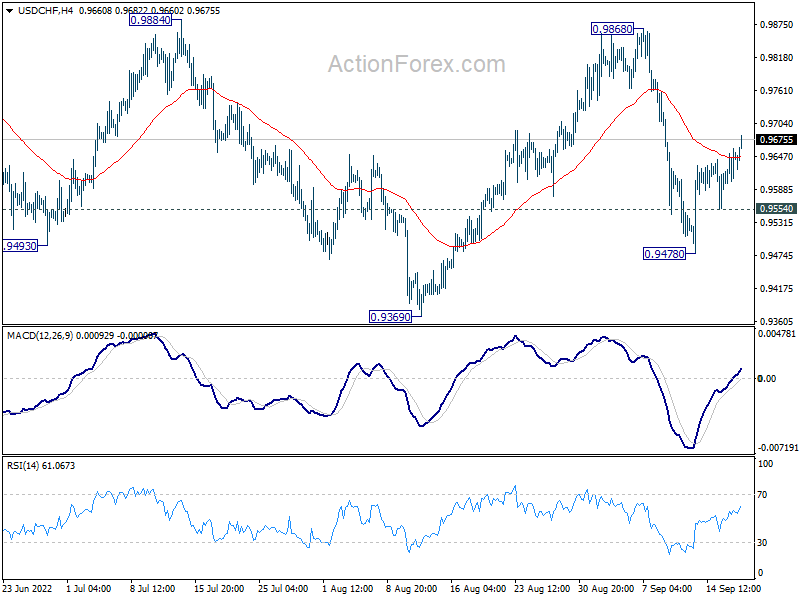
In the bigger picture, current development suggests that up trend from 0.8756 (2021 low) is still in progress. Sustained break of 1.0063 will target 100% projection of 0.9149 to 1.0063 from 0.9369 at 1.0283, and then 1.0342 (2016 high). For now, this will remain the favored case as long as 0.9369 support holds, even in case of deep pull back.
EUR/USD Daily Outlook
Daily Pivots: (S1) 0.9961; (P) 0.9999; (R1) 1.0053; More...
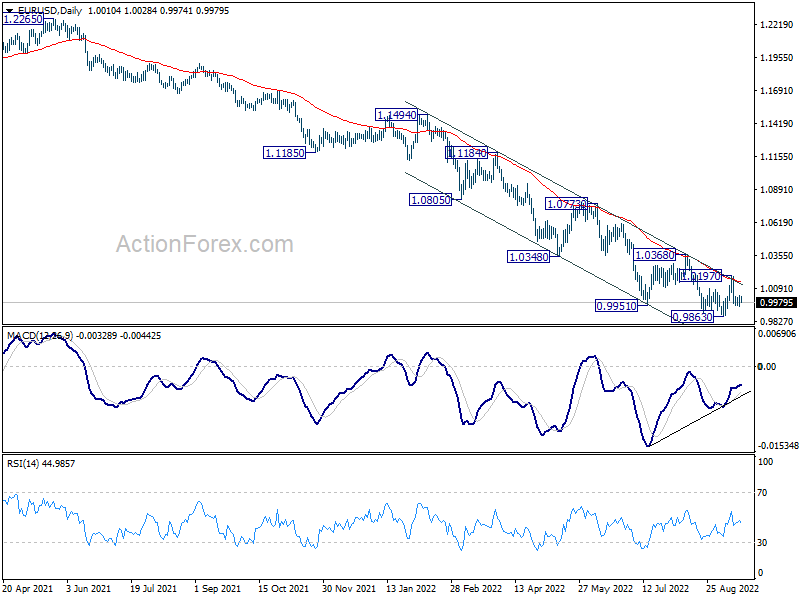
Intraday bias in EUR/USD remains neutral and outlook stays bearish. On the downside, firm break of 0.9863 support will resume larger down trend. On the upside, break of 1.0197 resistance will now raise the chance of larger trend reversal, and target 1.0368 resistance.
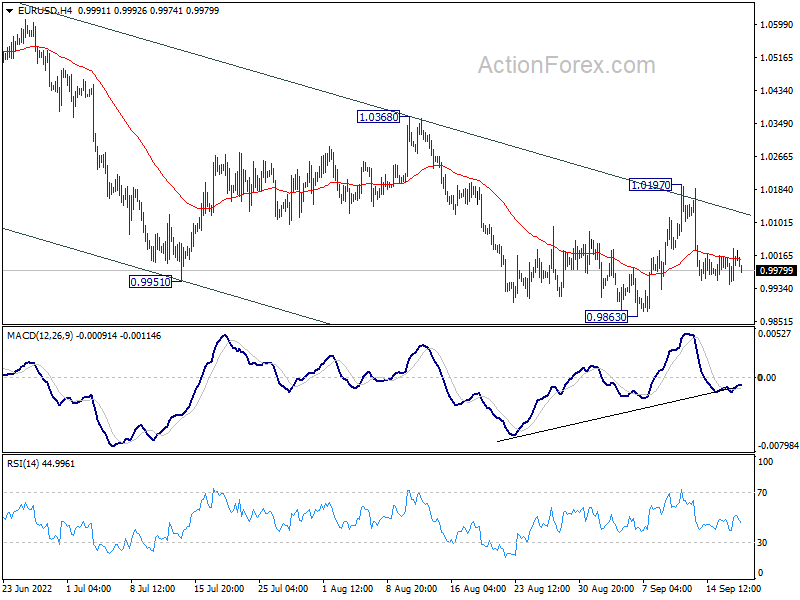
In the bigger picture, down trend from 1.6039 (2008 high) is still in progress. Next target is 100% projection of 1.3993 to 1.0339 from 1.2348 at 0.8694. In any case, outlook will stay bearish as long as 1.0368 resistance holds, in case of strong rebound.
A Flurry of Central Bank Meetings Ahead
Market movers today
There are no major releases today, so attention will turn to the string of central banks meetings coming up this week, starting with Riksbanken tomorrow, followed by the Fed (Wednesday) and Bank of Japan, Bank of England, Swiss National Bank and the Turkish central bank on Thursday.
Also, in focus will be the preliminary PMIs on both sides of the Atlantic on Friday.
The 60 second overview
Markets: The week kicks off in a risk-off mode as markets brace themselves for a flurry of central bank meetings ahead. It should be a rather quiet day with thin trading as Japan and UK are off, with the latter observing a day of mourning for the late Queen Elizabeth II. All eyes are on Wednesday's Fed meeting with investors considering a 75bp hike a done deal and some calling for an even larger hike. A poll for leading academic economists by Financial Times found that the Fed was expected to lift its policy rate above 4% and hold it there beyond 2023. See our Research US - Fed preview: Fast pace hiking cycle continues, 16 September.
Hungary: Yesterday, the EU commission said that it plans to withhold EUR 7.5bn in EU funding for Hungary (or a third of the country's total EU funds) over rule of law violations involving corruption in the awarding of public contracts. The decision to withhold the funds must be approved by a majority of the EU's member states, excluding Hungary, within a month but the deadline could be extended up to two months "in exceptional circumstances". Hungarian authorities said yesterday that they plan to pass a series of laws this week to address EU concerns. Yesterday's decision by the EU Commission is likely to put pressure on the HUF today.
Geopolitics: In the last seven days, two conflicts have erupted in Russia's neighbourhood: an expanded version of the Nagorno-Karabakh conflict between Azerbaijan and Armenia, and a border conflict between Tajikistan and Kyrgyzstan. These conflicts may have broader long-term geopolitical repercussions as Russia seems to be taking a more and more hands-off approach when it comes to protecting its post-Soviet allies. The Azerbaijan-Armenia conflict last escalated in 2020. Back then, the war resulted in Russia-brokered ceasefire and in Azerbaijani victory. Turkey's material support to its neighbouring Azerbaijan also played a game-changing role in the conflict. The latest conflict seems like the second time, Armenia, a member of the CSTO, an intergovernmental military alliance for post-Soviet states, is being left without any support from Russia. Same time, US flags were hoisted over the weekend as House Speaker Pelosi paid a visit to Armenia's capital Yerevan, strongly condemning Azerbaijan's attack. Similarly, Russia seems to pay little attention to the border clash between two CSTO members, Tajikistan and Kyrgyzstan, in Central Asia, implying that it either has little resources or motivation (or both) at this point to promote peace and stability in the region, and protect its so-called allies.
Equities: Inflation fear and recession fears continue to switch gears. On Friday, the latter one took the lead. Positive inflation data combined with Fedex's profit warning underlined the shift. Defensives and growth sectors took the lead (such as staples, health care but also tech) while energy, industrials and materials sold off 2%. Dow -0.5%, S&P 500 -0.7%, Nasdaq -0.9% and Russell 2000 -1.5%. Futures are somewhat lower this morning too.
FI: It is going to be a busy week in terms of central bank meetings with the main focus on the Federal Reserve on Wednesday and the possibility of a 100bp rate hike by the Federal Reserve. However, we begin in Sweden with the Riksbank, where 75bp is fully priced in. Furthermore, we have Bank of England, Bank of Japan and the Swiss central bank. We expect that there will be one common factor for all of the central banks, and this is "frontloading" of tighter monetary policy in order to bring down inflation. This should lead to flatter curves 2-10Y and 2-5Y as well as a stronger dollar.
FX: Major G10 crosses ended last week on a quiet note with EUR/USD firmly stuck at parity. USD/JPY remains off peak after BOJ's 'rate check'. SEK, NOK and GBP continued to trade lower vs EUR and USD as equities closed the week in red. All eyes on all the central bank decisions especially the Fed - but also the two Scandies.
Credit: Credit markets ended the week in risk off mode as investors continued to weigh uncertainty from hawkish central banks and stubborn inflation. Itrax main widened around 4bp to close at 112bp, while Itrax Xover widened 17bp to close at 552bp. Primary market activity was relatively muted on Friday.
Technical Outlook and Review
USD/JPY:
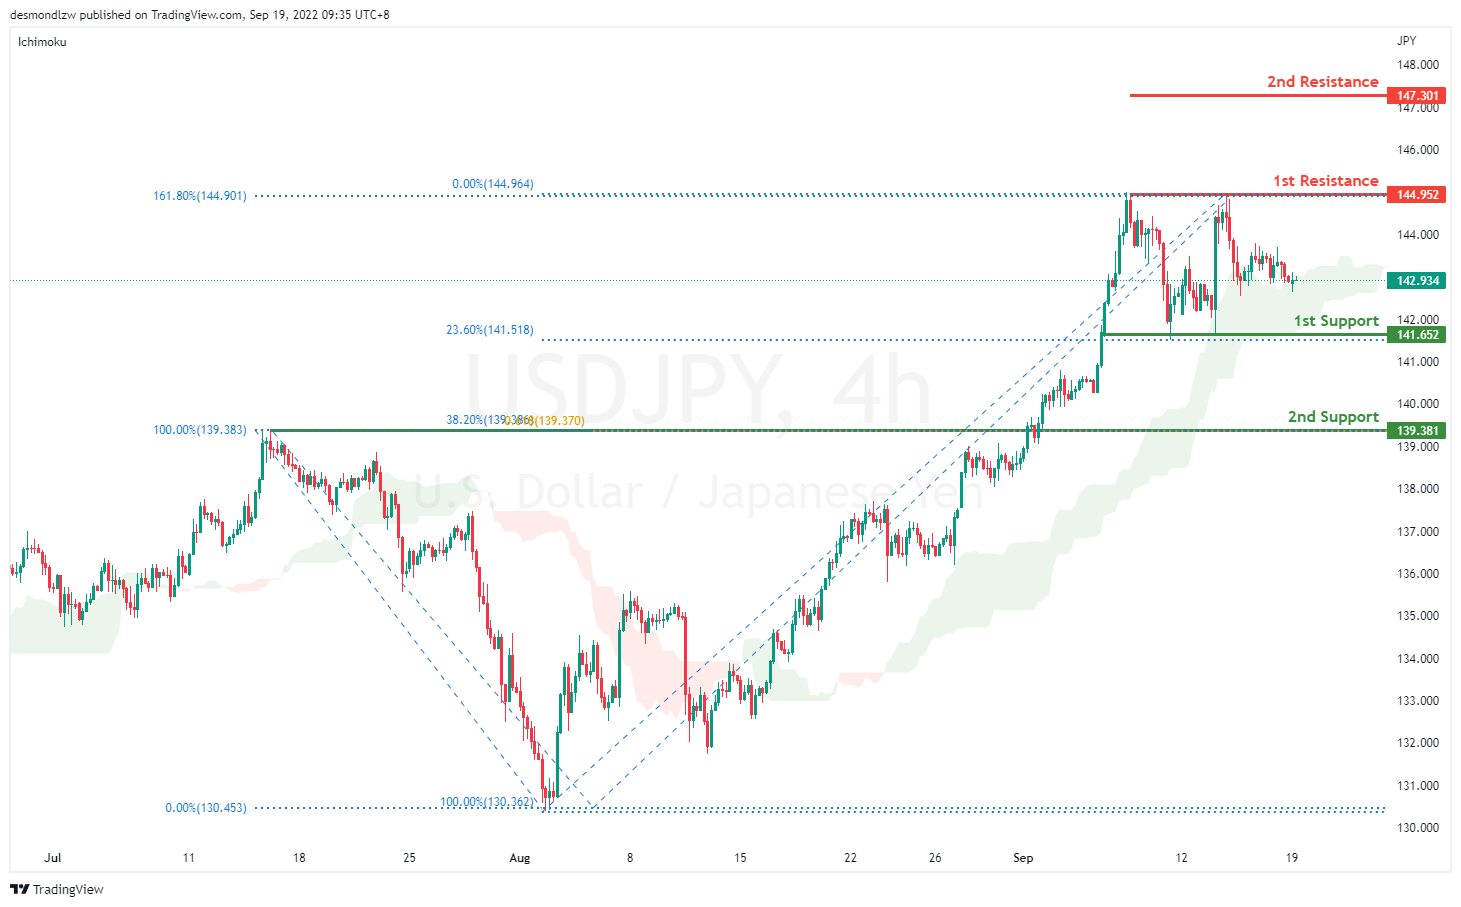
On the H4 chart, price is still respecting the ascending momentum. We are still bullish bias- Price is testing above the previous low and if bullish momentum continues, it should bring price to first resistance at 144.952 where the 161.8% extension sits. If it breaks this level, it should bring price to 147.301 where the previous swing high sits. Alternatively it could pull back to the first support at 141.652 where the 23.6% retracement and 100% projection sits then to the second support at 139.381 where the 38.2% retracement and overlapping support sits.
Areas of consideration:
- H4 time frame, 1st resistance at 144.952
- H4 time frame, 1st support at 141.652
DXY:
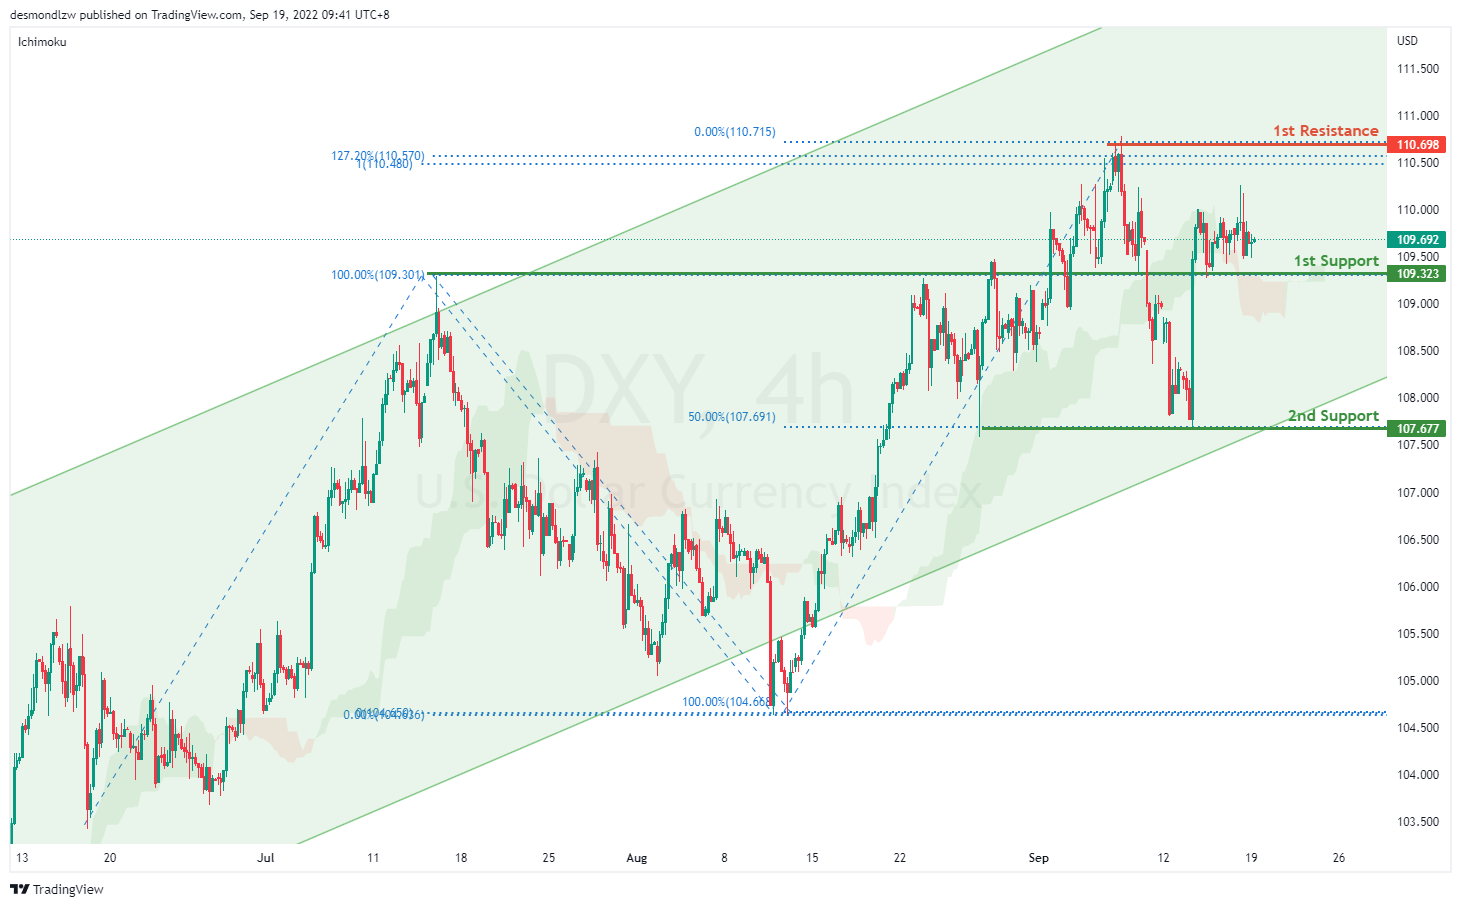
On the H4, price is still respecting the bullish channel and has failed to break the first support- we are bullish bias. Price has rebounded off the support level and is moving toward the first resistance at 110.698 levels where the previous swing high sits. Alternatively, price could pull back to test the first support at 109.323 where the 23.6% retracement sits then the second support at 107.677 where the 61.8% projection, 61.8% retracement and previous swing low sits.
Areas of consideration:
- H4 time frame, 1st resistance at 110.698
- H4 time frame, 1st support at 109.323
EUR/USD:
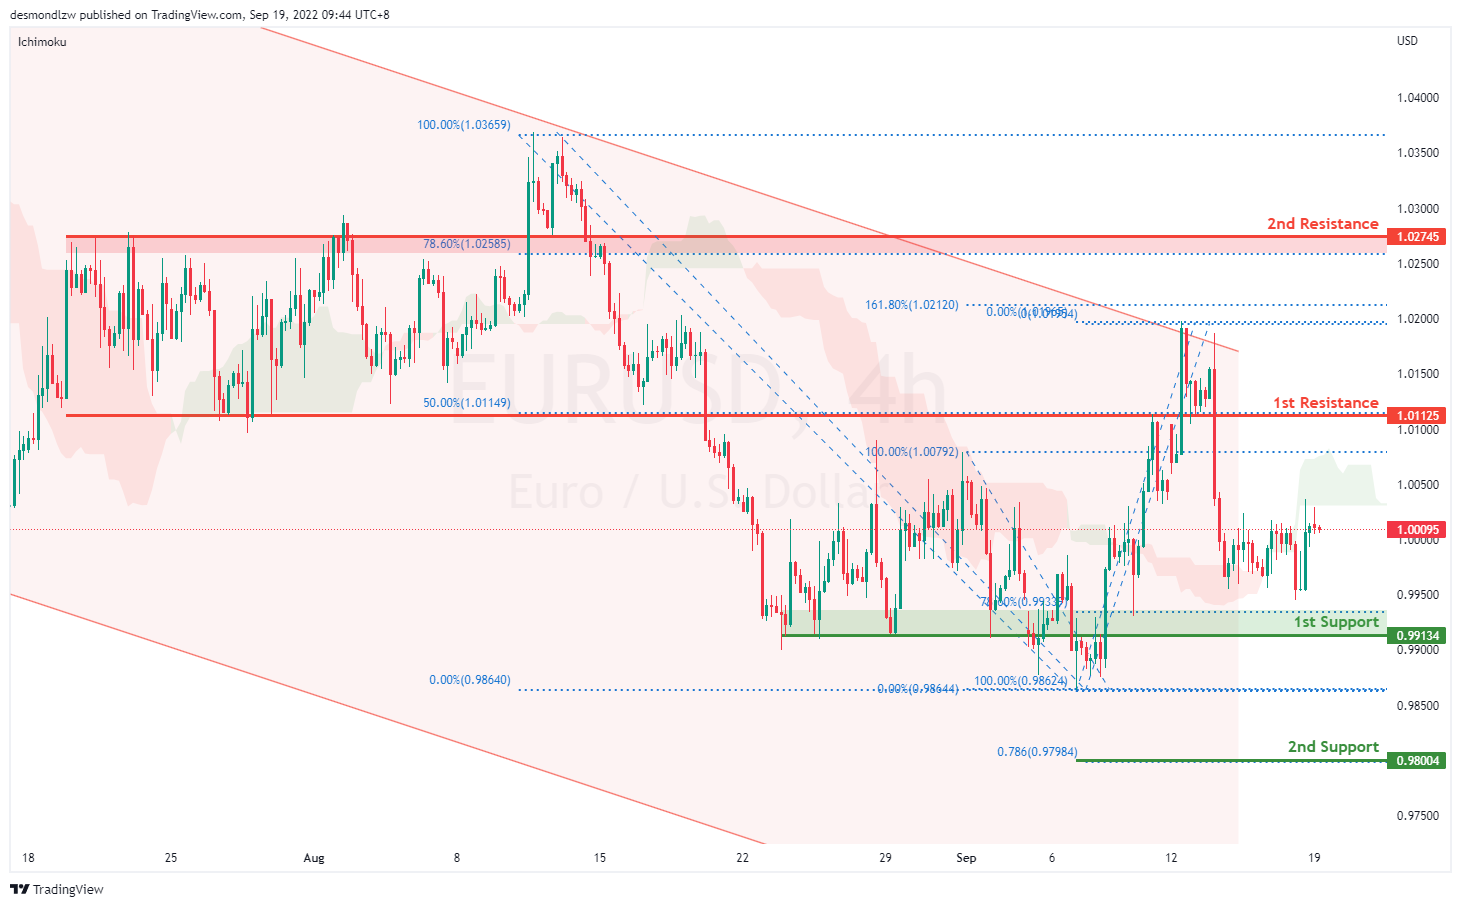
On the H4, price is moving within the channel, we are currently bullish bias as price fails to break the first support. Price seems like its moving to first resistance at 1.0112 level where the 50% retracement and previous swing low sits. If bullish momentum continues, it should bring price to second resistance at 1.0274 where the 78.6% retracement and previous swing high sits. Alternatively, price could pull back to test the first support at 0.9913 where the 78.6% projection and previous swing low sits, subsequently the second support at 0.9878 where the previous swing low sits.
Areas of consideration :
- H4 1st resistance at 1.0112
- H4 1st support at 0.99134
GBP/USD:
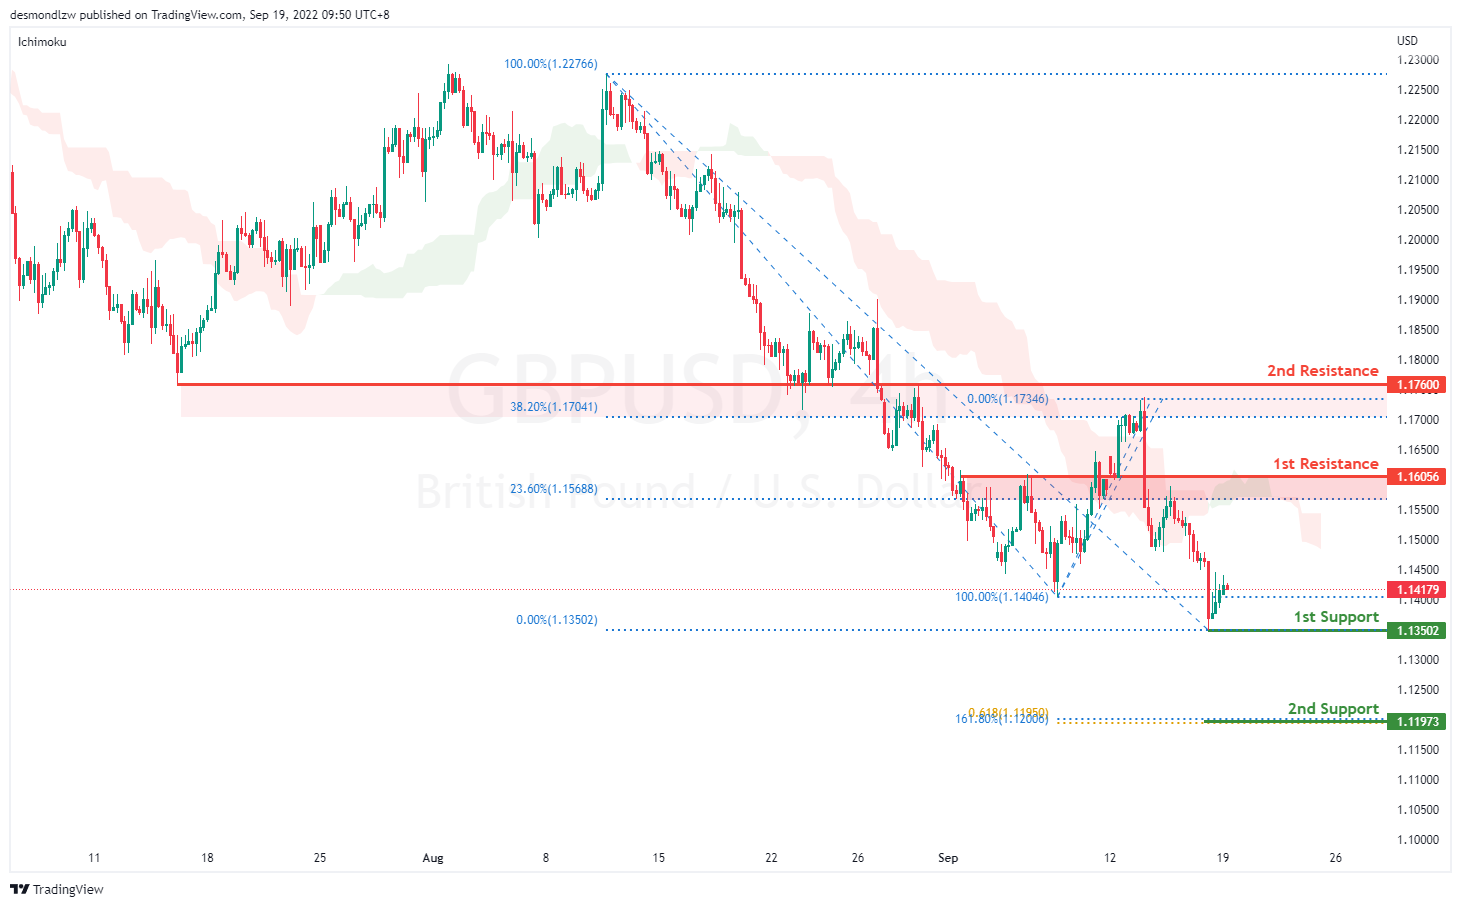
On the H4, prices are still moving in a bearish momentum hence we are bearish biassed. Prices have pulled back slightly but if bearish momentum continues, it should test the first support at 1.1350 levels where the previous swing low sits then the second support at 1.1197 where the 161.8% extension sits. Alternatively, price could pull back to test the first resistance at 1.1605 where the 23.6% retracement and overlapping support sits then the second resistance at 1.1760 where the 38.2% retracement and previous swing high sits
Areas of consideration:
- H4 1st resistance at 1.1605
- H4 1st support at 1.1350
USD/CHF:
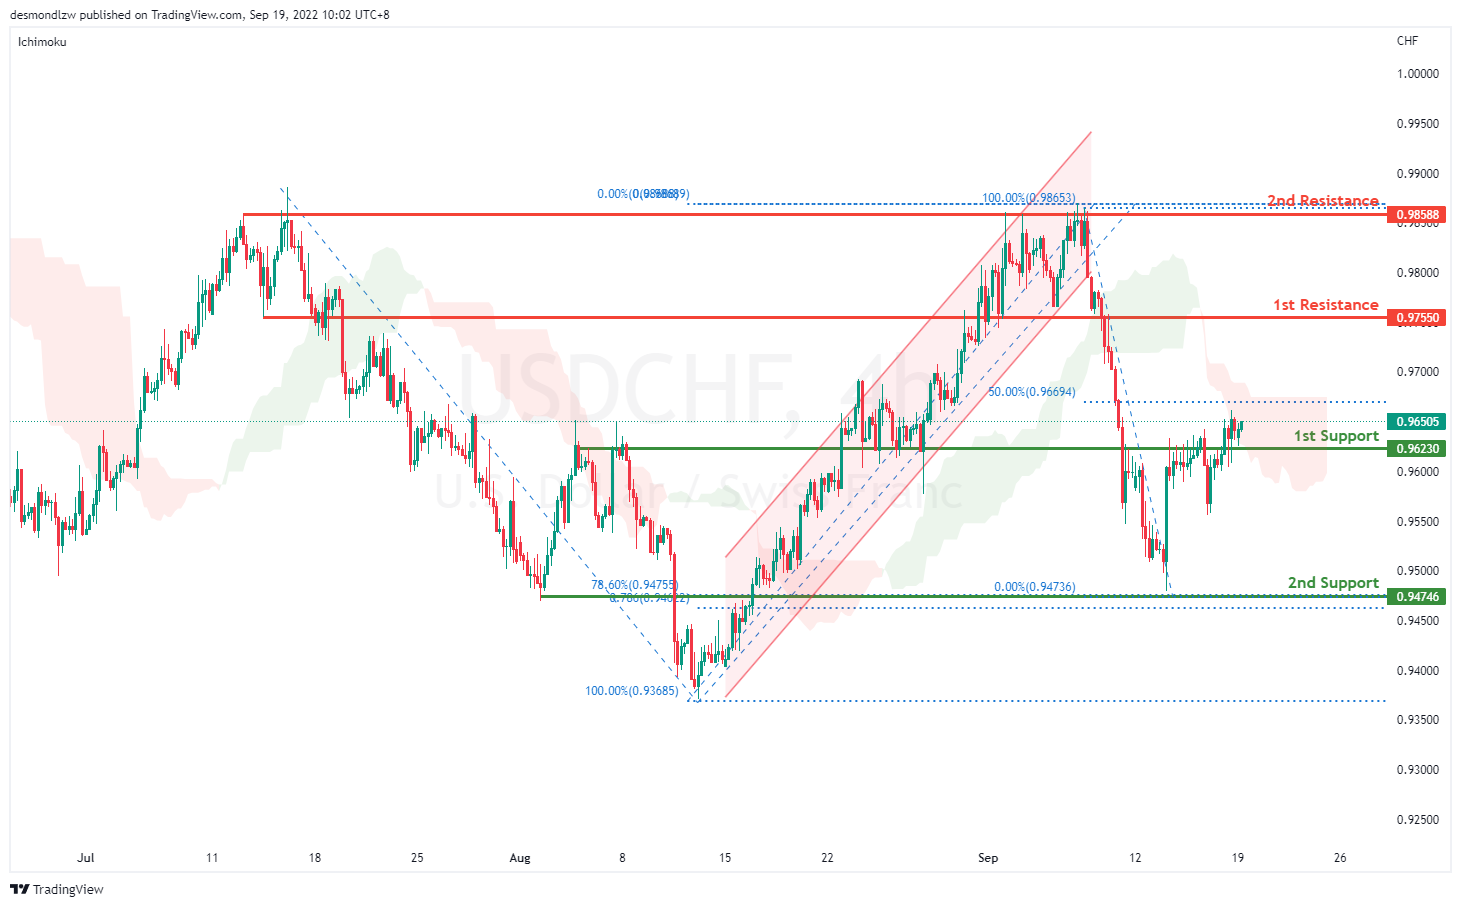
On the H4, prices have broken the ascending channel and we are currently bearish bias. Price has broken the first support at 0.9623 where the overlapping resistance sits but prices are ranging. If price continues with the bearish momentum, it should bring price back to test the 0.9623 levels before testing the second support at 0.9474 where the 78.6% projection and 78.6% retracement sits. Alternatively, price could pull back to test the first resistance at 0.9755 then the second support at 0.9858 where the swing high sits
Areas of consideration
- H4 1st support at 0.9623
- H4 1st resistance at 0.9755
XAU/USD (GOLD):
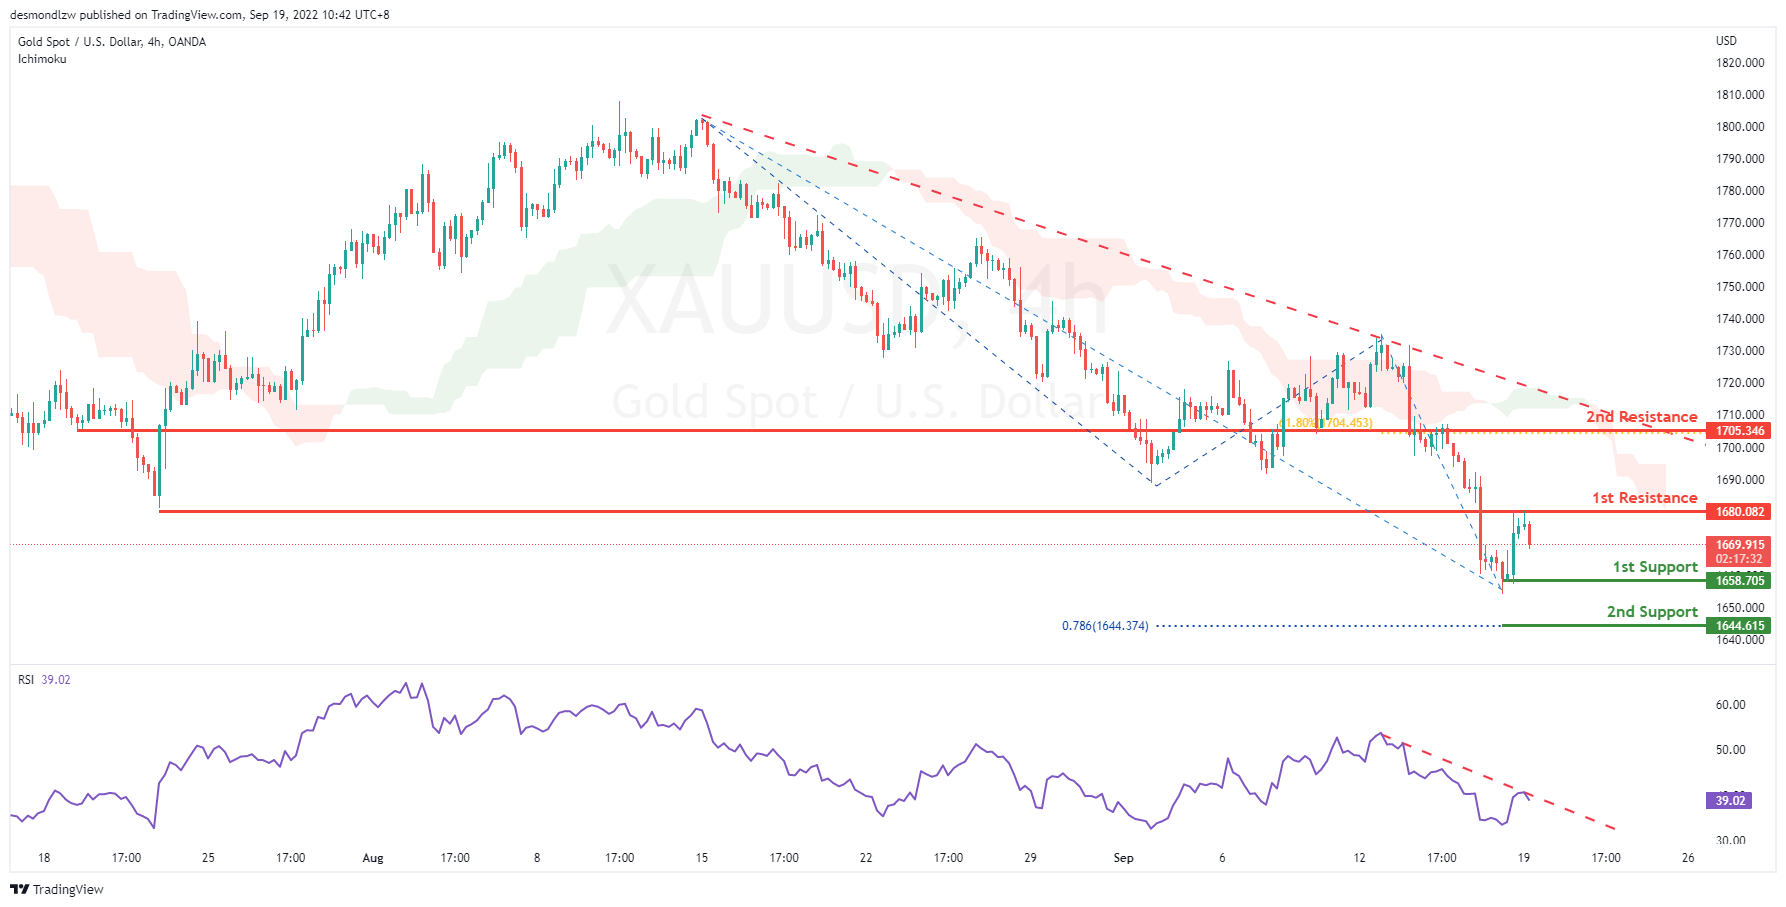
On the H4, with the price moving within the descending trendline, below ichimoku cloud and RSI is showing a descending trendline, we have a bearish bias that the price may drop to the 1st support at 1658.705, which is in line with the swing low. If the 1st support is broken, the 2nd support could be at 1644.615, which is in line with the 78.6% fibonacci projection. Alternatively, the price may rise to the 1st resistance at 1680.082, which is in line with the overlap resistance. If the 1st resistance is broken, the 2nd resistance could be at 1705.346, where the 61.8% fibonacci retracement is.
Areas of consideration:
- H4 time frame, 1st support at 1658.705
- H4 time frame, 1st resistance at 1680.082
AUD/USD:
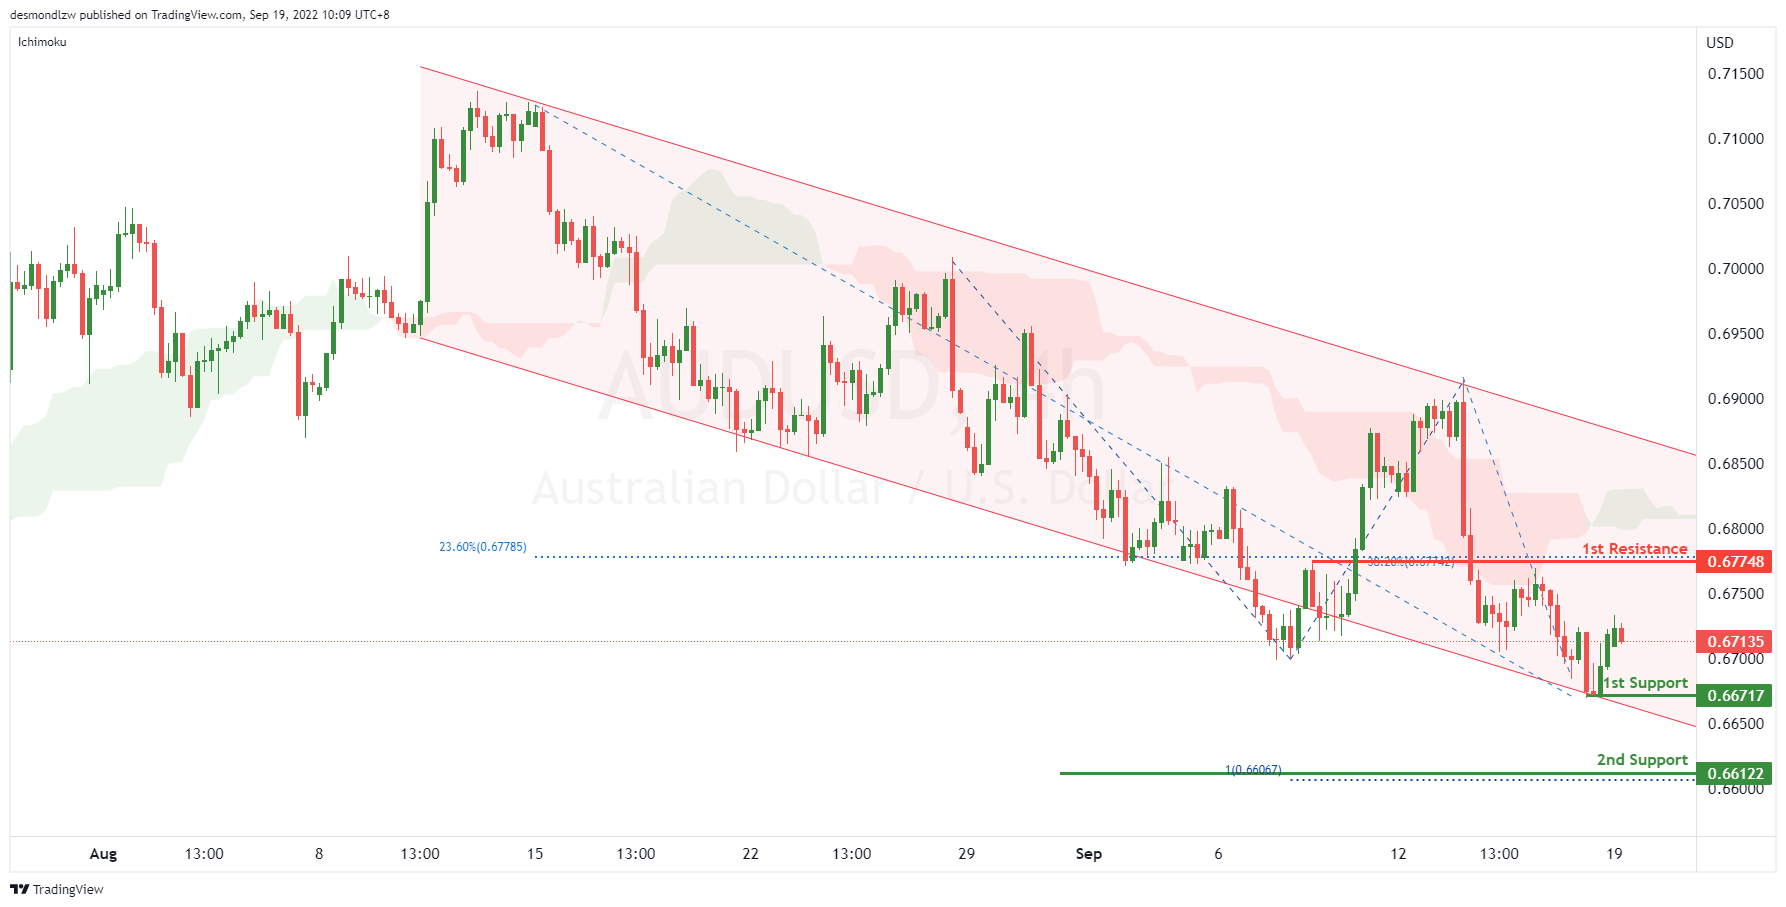
On the H4, with the price moving within the descending channel and below ichimoku cloud, we have a bearish bias that the price may drop to the 1st support at 0.66717, which is in line with the swing low. If the 1st support level is broken, the 2nd support could be at 0.66122, where the 100% fibonacci projection is. Alternatively, the price may rise to the 1st resistance at 0.67748, which is in line with the 38.2% fibonacci retracement and 23.6% fibonacci retracement.
Areas of consideration
- H4, current price
- H4 1st support at 0.66717
NZD/USD:
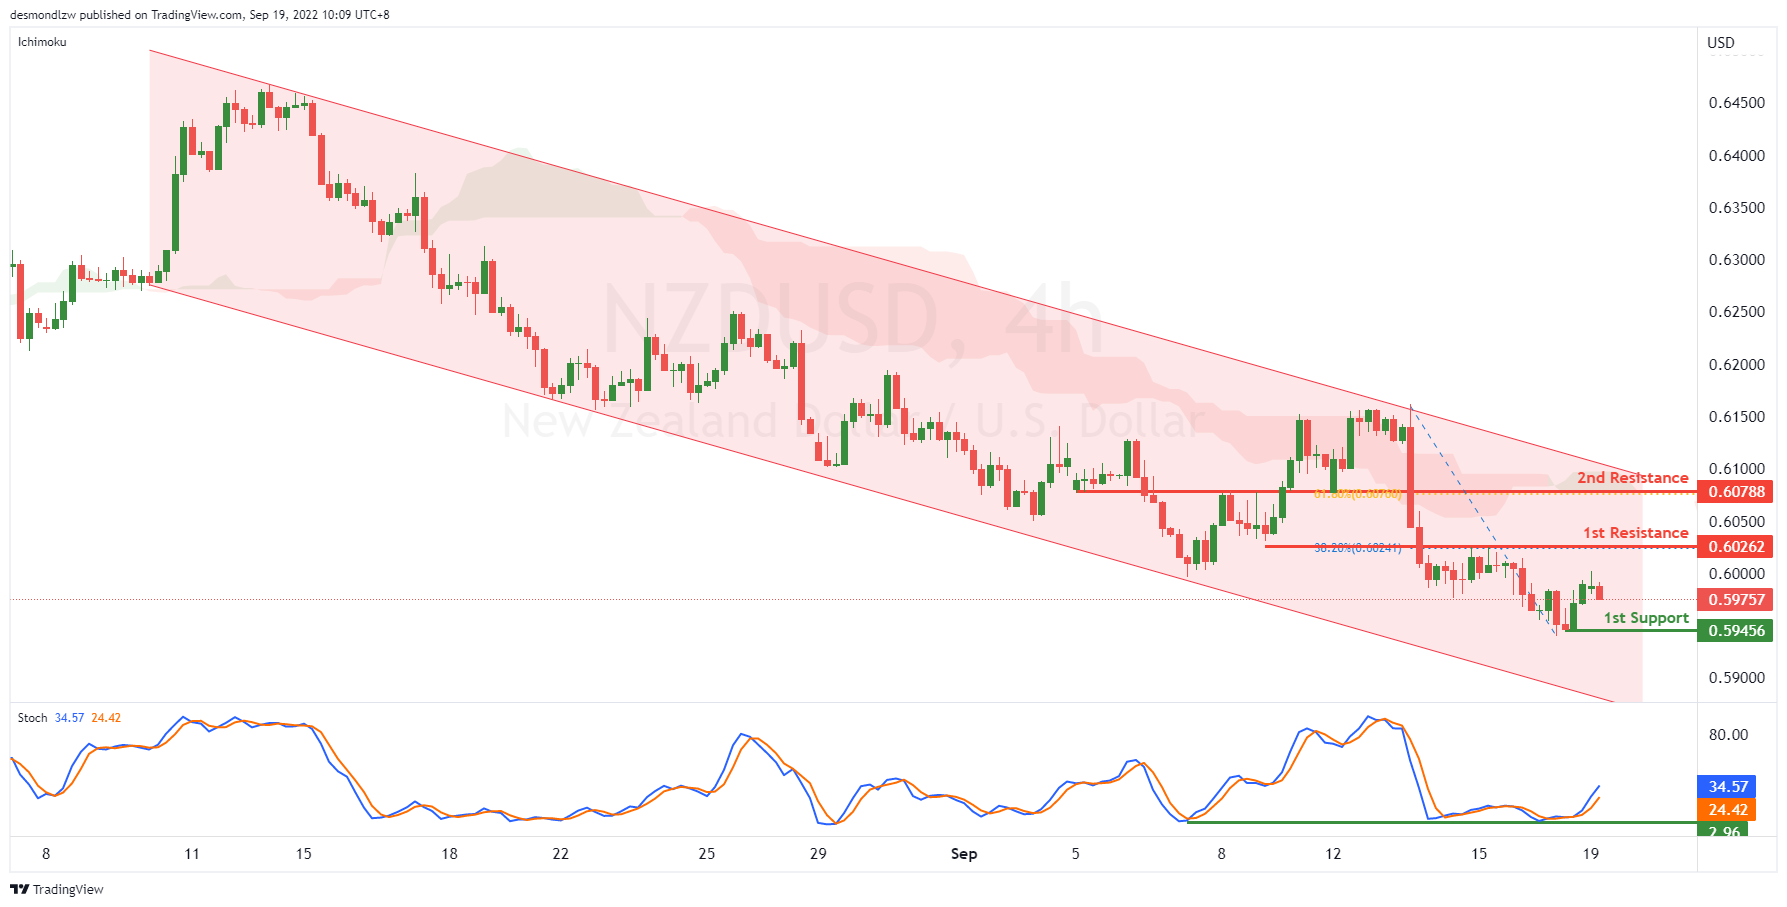
On the H4, with the price moving within the descending channel and below ichimoku cloud, we have a bearish bias that the price may drop to the 1st support at 0.59456, where the swing low is. Alternatively, as the Stoch is reversing from the support, the price may rise to the 1st resistance at 0.60262, which is in line with the pullback resistance and 38.2% fibonacci retracement. If the 1st resistance is broken, the 2nd resistance could be at 0.60788, which is in line with the overlap support and 61.8% fibonacci retracement.
Areas of consideration:
- H4 time frame, 1st support at 0.59456
- H4 time frame, 1st resistance at 0.6026
USD/CAD:
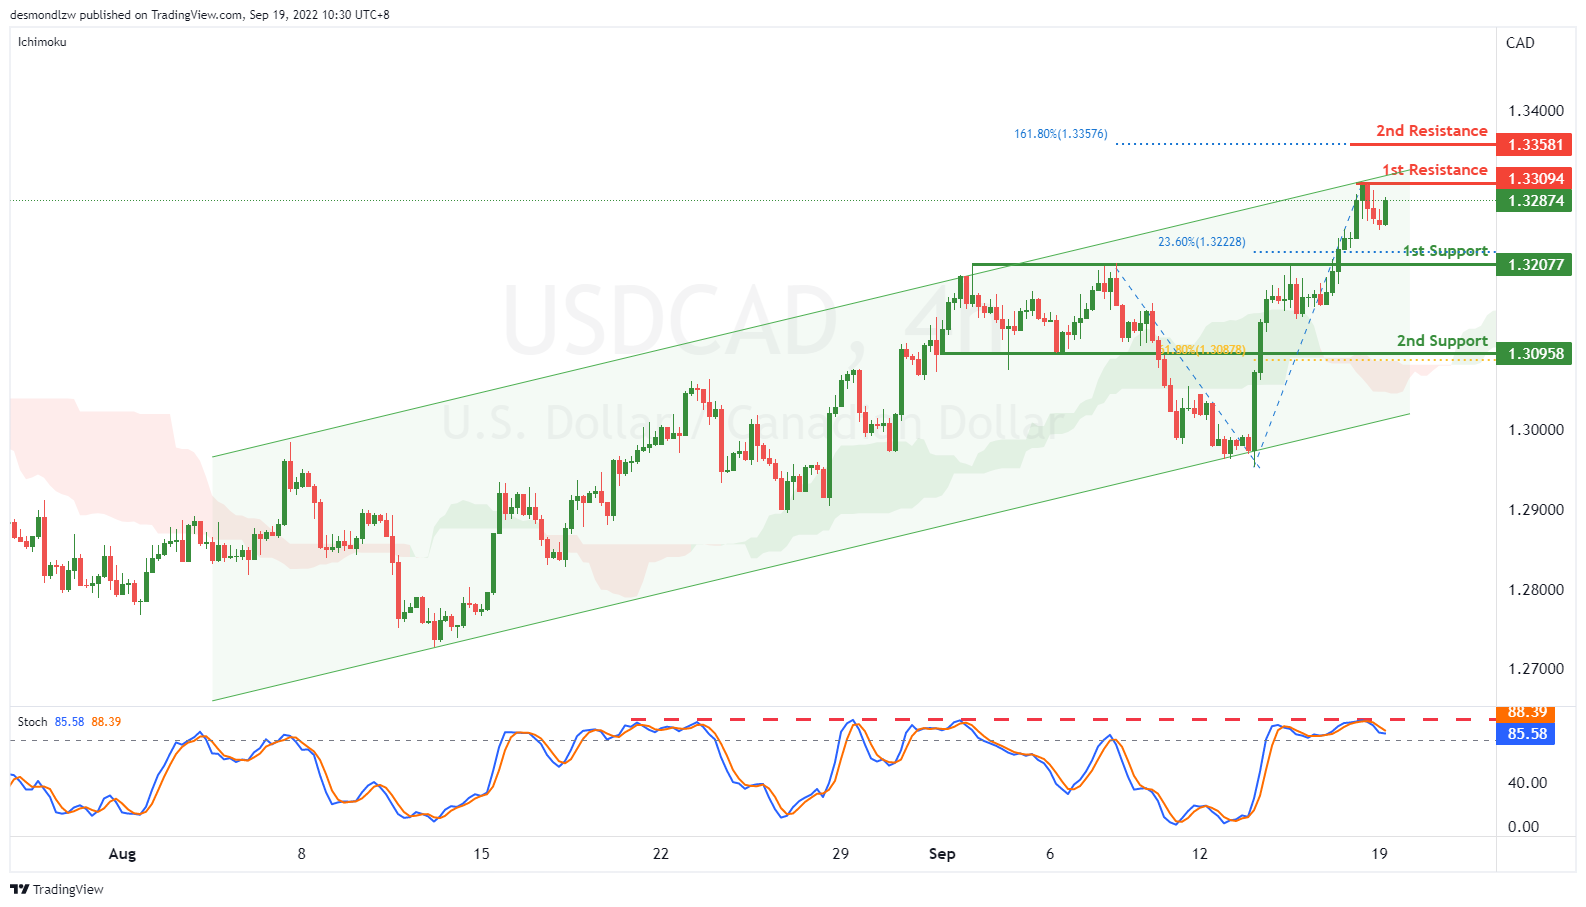
On the H4, with the price moving within the ascending channel and above ichimoku cloud, we have a bullish bias that the price may rise to the 1st resistance at 1.33094, which is in line with the swing high. If the 1st resistance is broken, the 2nd resistance could be at 1.33581, where the 161.8% fibonacci extension is. Alternatively, as the Stoch is reversing from the resistance, the price may drop to the 1st support at 1.32077, which is in line with the 23.6% fibonacci retracement and previous swing highs after testing the 1st resistance. If the price breaks the 1st support, the 2nd support could be at 1.30958, which is in line with the overlap support and 61.8% fibonacci retracement.
Areas of consideration:
- H4 time frame, 1st resistance at 1.33094
- H4 time frame, 1st support at 1.32077
OIL:
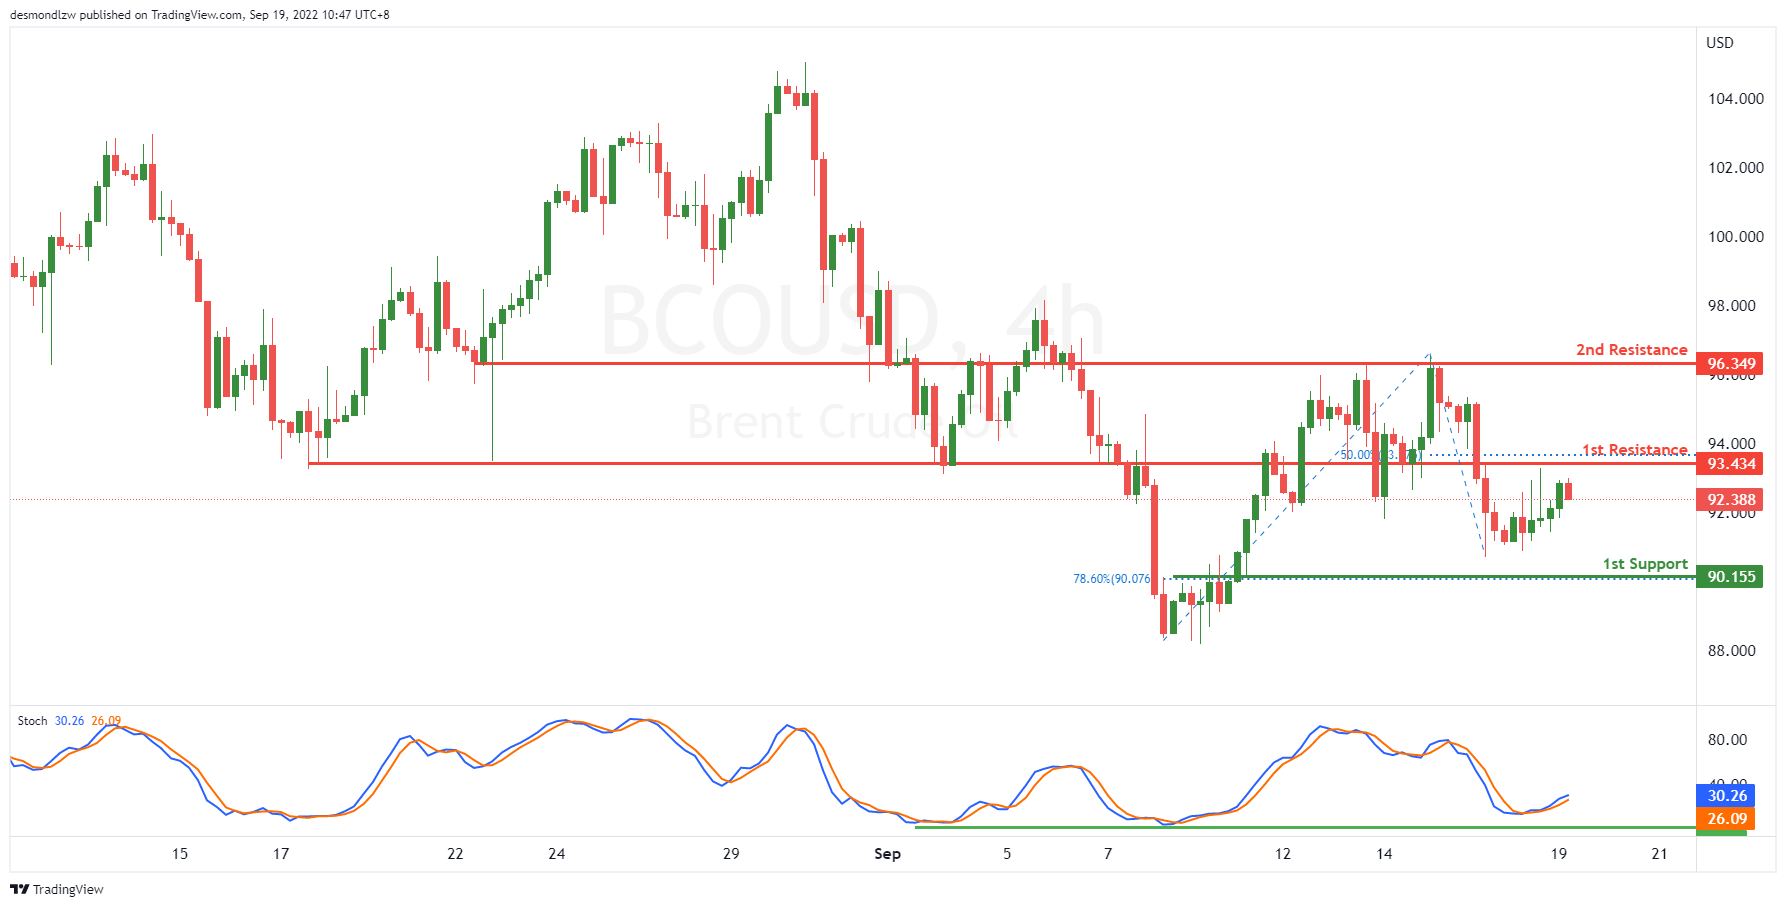
On the H4, with the stoch is reversing from the support line and here is a golden cross, we have a bullish bias that the price may test the 1st resistance at 93.434, which is in line with the 50% fibonacci retracement. If the 1st resistance is broken, the next key resistance could be at 96.349, which is in line with the overlap resistance. Alternatively, the price may drop to the 1st support at 90.155, where the78.6% fibonacci retracement is.
Areas of consideration:
- H4 time frame, 1st resistance at 93.434
- H4 time frame, 2nd resistance at 96.349
Dow Jones Industrial Average:
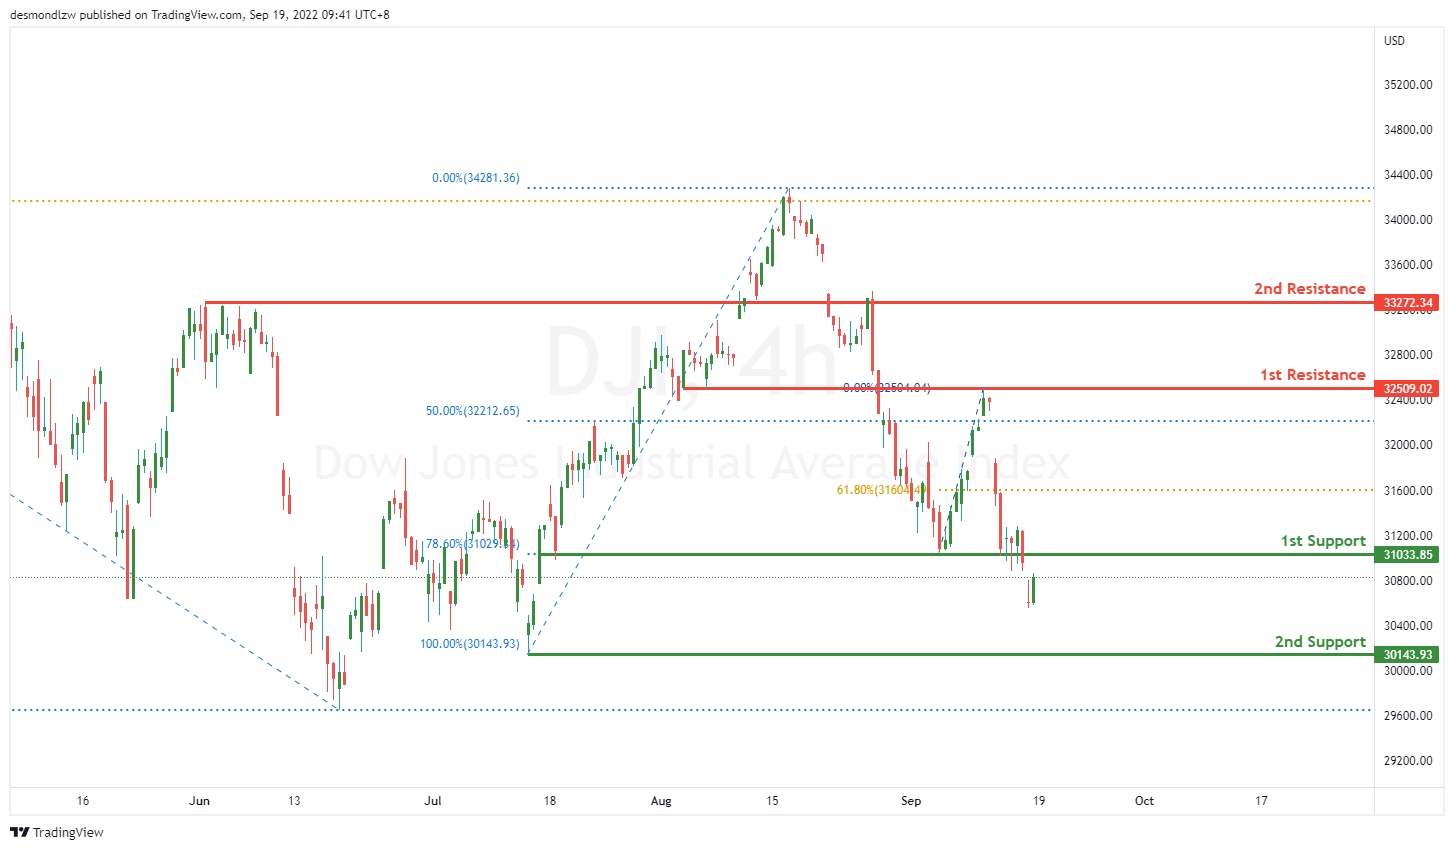
On the H4, price is reflected off nicely at the first resistance at 32500.85 where the 50% Fibonacci retracement is and broke right through the first support at 31029.34 where the 78.6% Fibonacci retracement is. Price might continue heading downwards towards the second support at 30343.73 where the previous swing low is.
Areas of consideration:
- H4 time frame, 1st support at 31029.34
- H4 time frame, 2nd support at 30343.73
DAX:
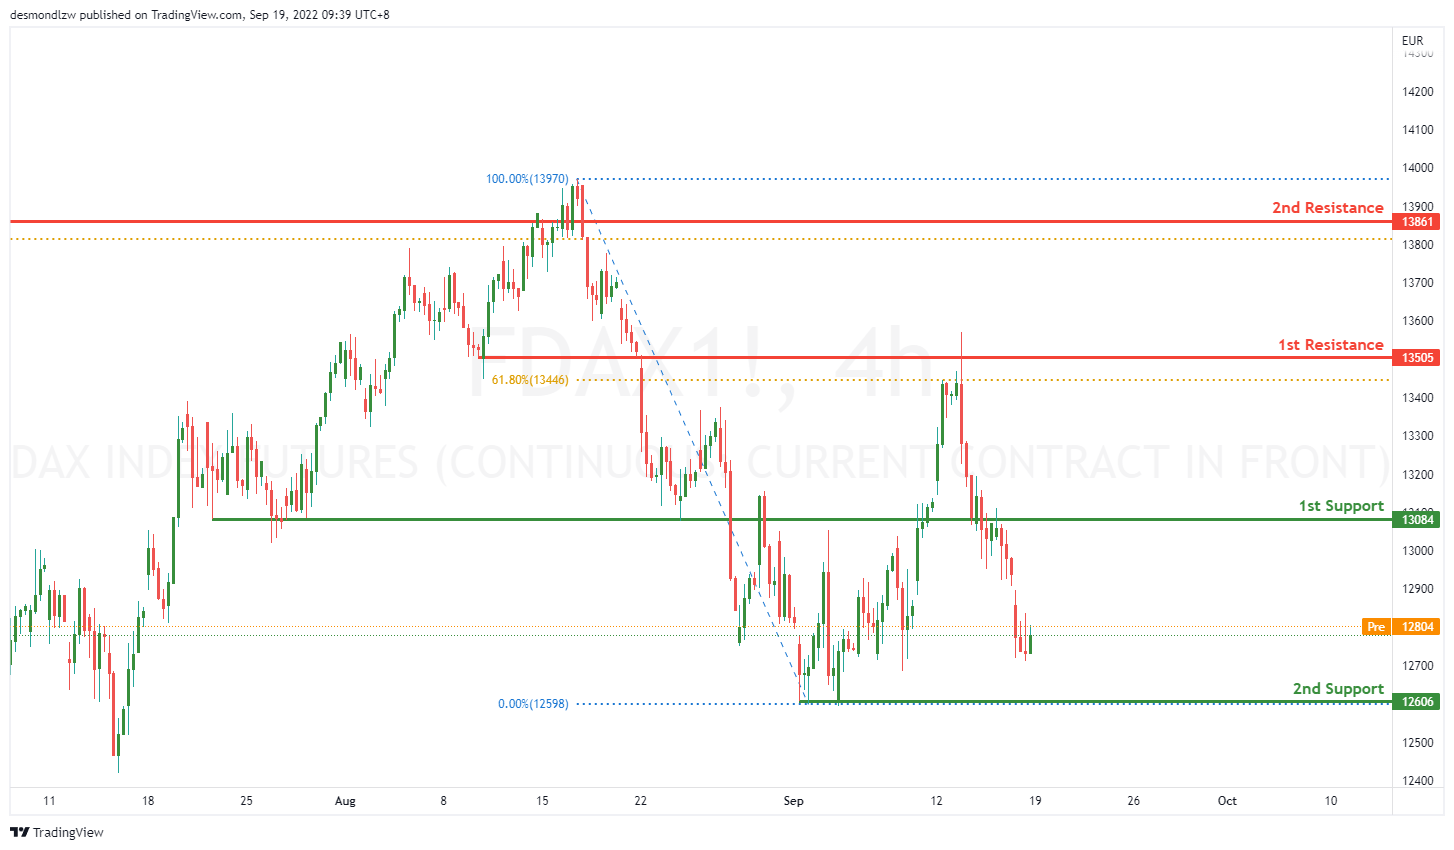
On the H4, price has reflected of the first resistance at 13505 where the 61.8% retracement is and got a big reaction breaking through the first support at 13084. Price might continue going down towards the second support at 12606 where the swing low is.
Areas of consideration:
- H4 time frame, 1st support at 13084
- H4 time frame, 2nd support at 12606
ETHUSD:
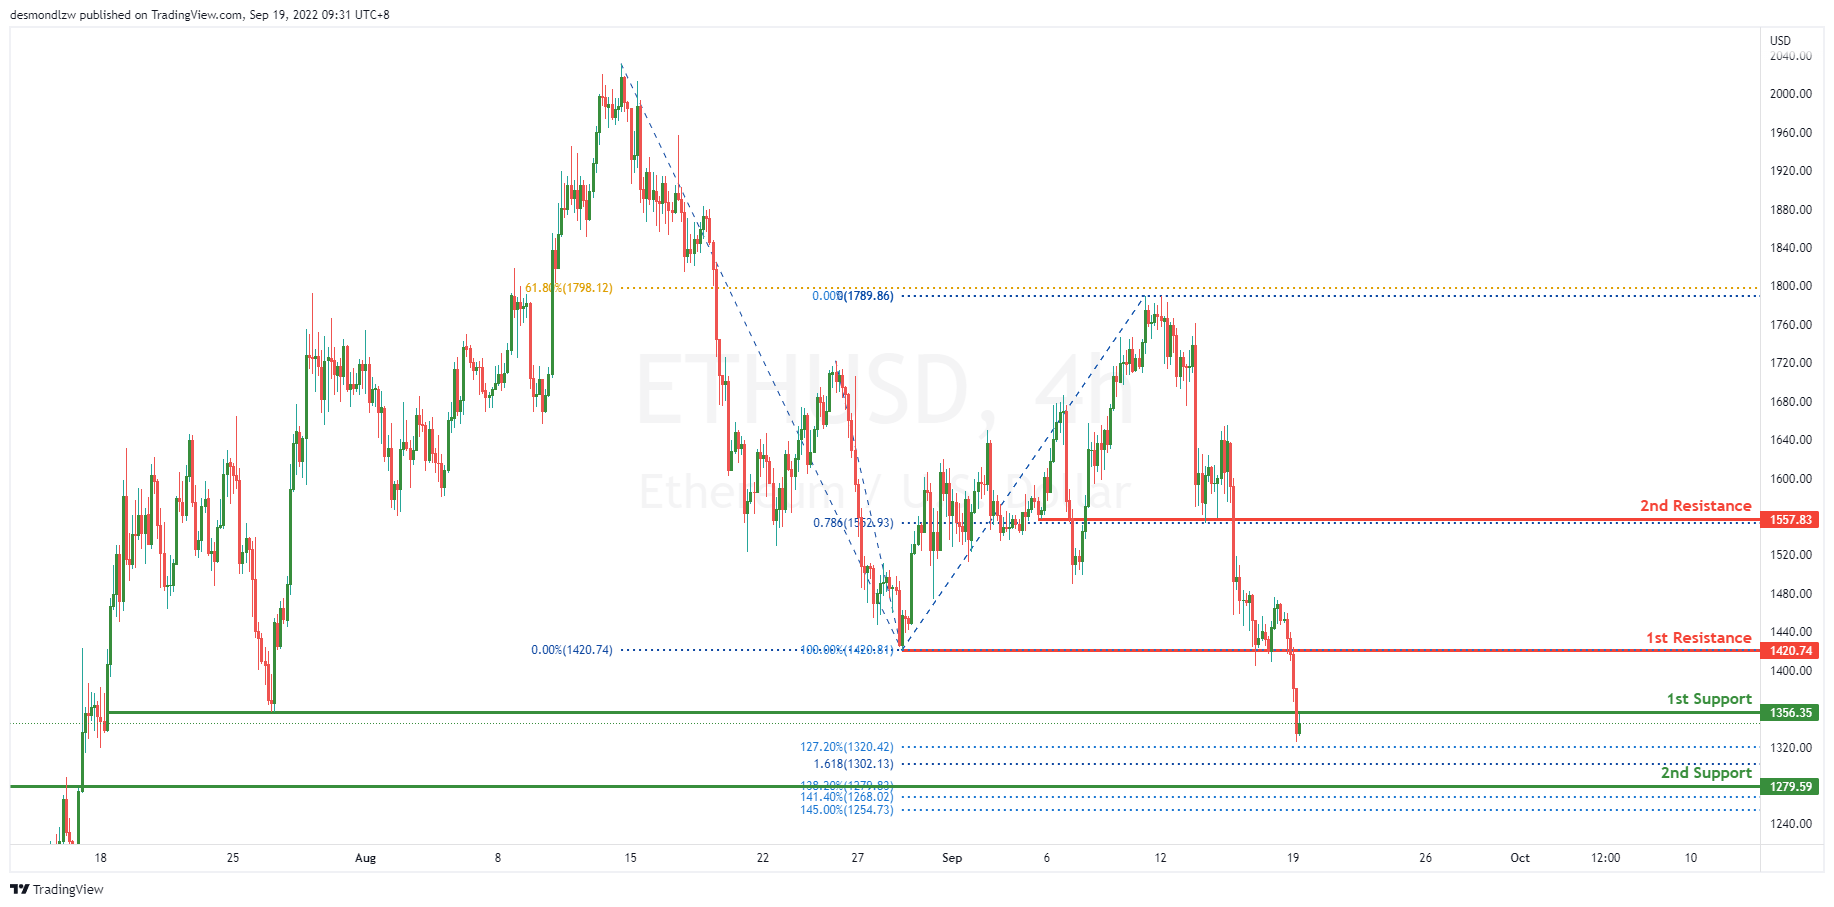
On the H4, price has pushed through the 1st Resistance at 1420.81 where the previous swing low sat. Price has also pushed through the 1st support at 1356.35 where the 127.2% Fibonacci extension lies. Expecting a pullback from the 127.2% Fibonacci extension back up to the 1st resistance at 1420.81.
Areas of consideration:
- H4 time frame, 1st resistance of 1420.81
- H4 time frame, 1st support at 1356.35
BTCUSD:
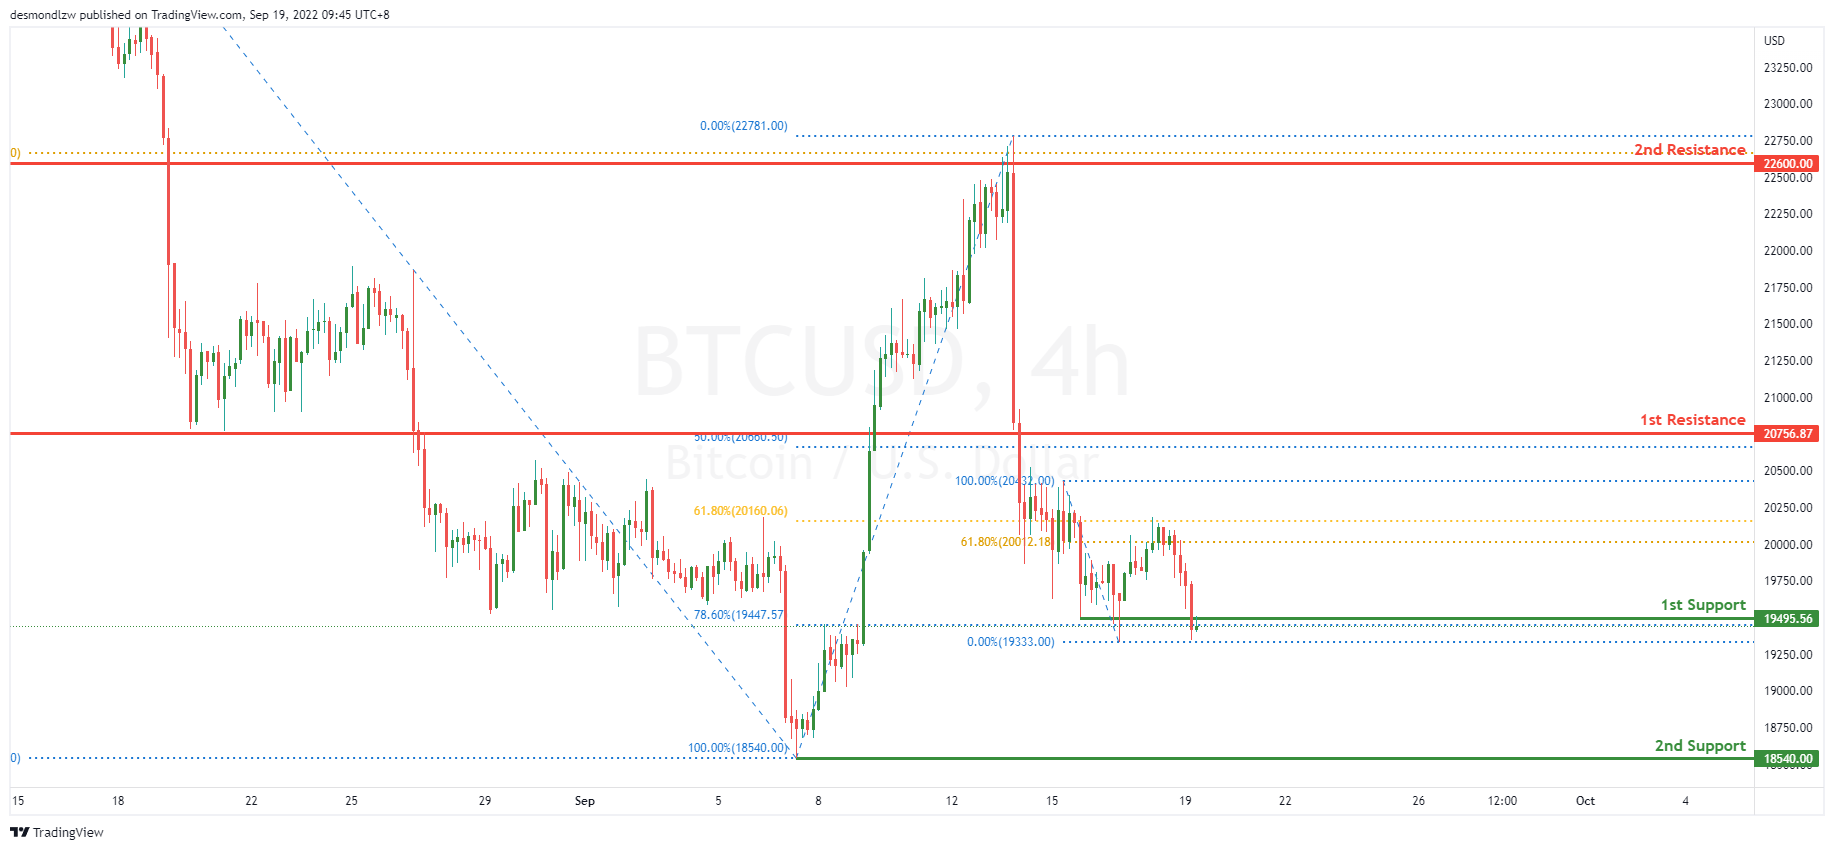
On the H4, price reflected off the first resistance at 22600.00, broke past the second resistance at 20756.87 and is moving in a bearish momentum hence we are bearish. Price has moved and pushed through the first support at 19557.00 where the 78.6% retracement sits. If bearish momentum continues, it should bring price to the second support 18540.00 where the previous swing low sits.
Areas of consideration:
- H4 time frame, 1st resistance of 22600.00
- H4 time frame, 1st support at 19557.00
S&P 500:
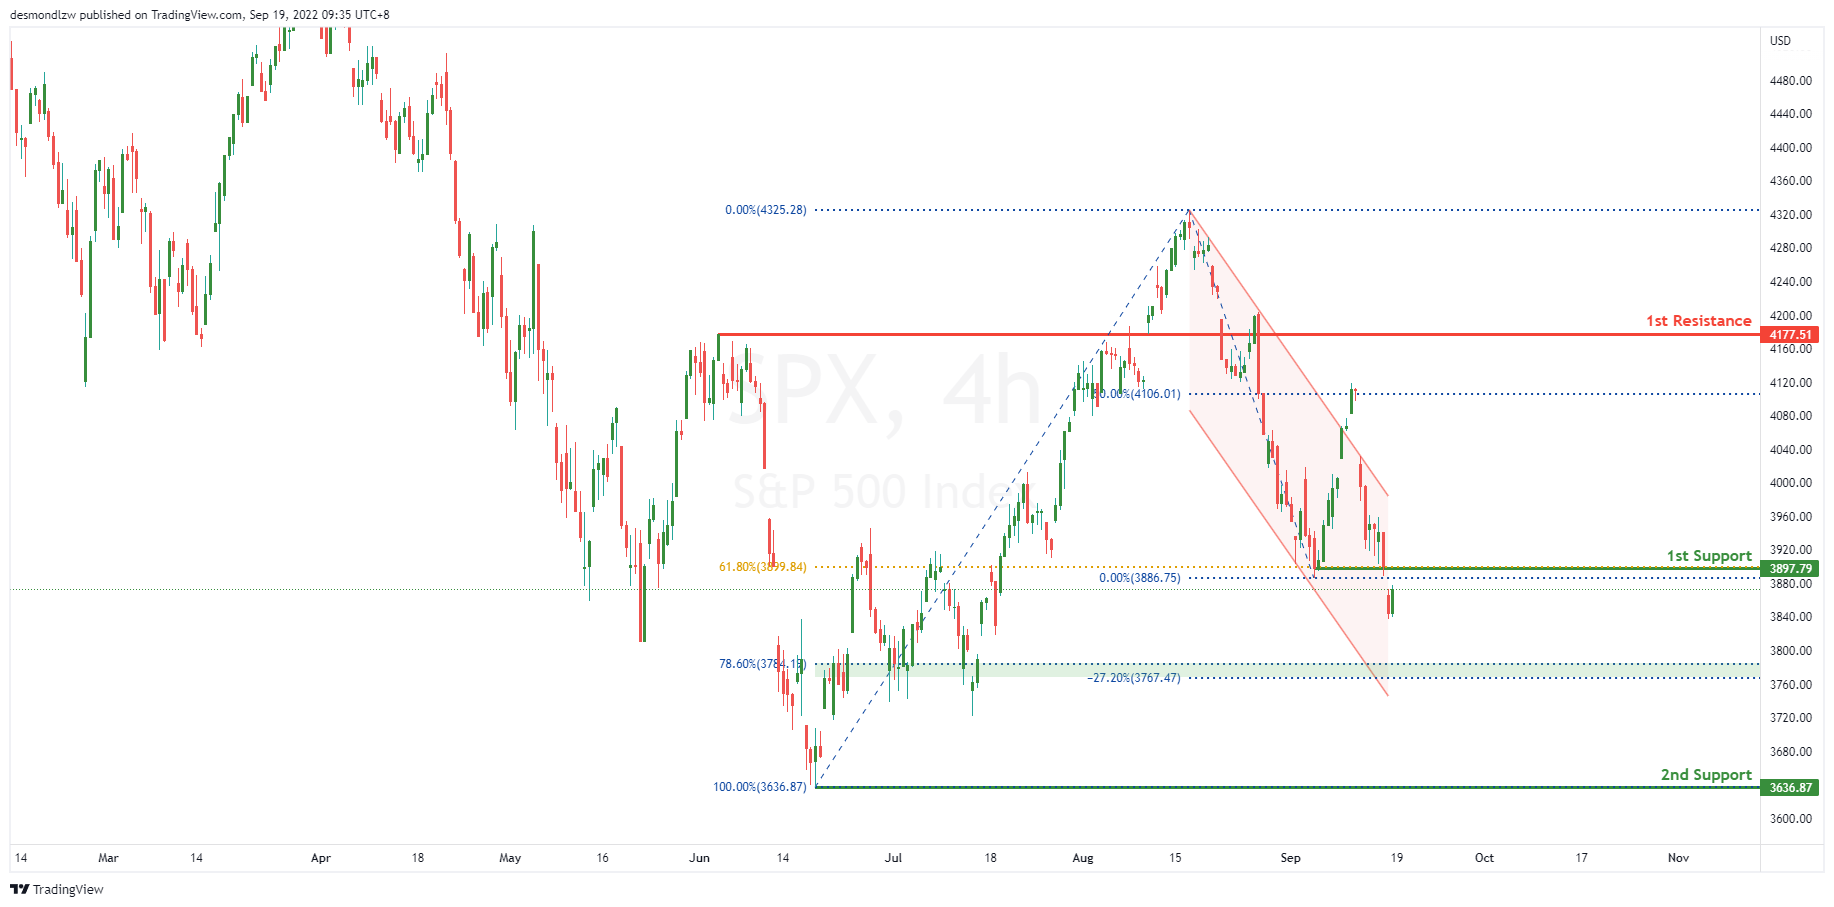
On the H4, the price reversed from the 4100 price area forming a bearish channel, with the price falling towards the 1st support are of 3900. With our bearish bias still valid, as price trades back towards the 61.8% Fibonacci retracement, look for price to test the 1st support area. Price has broken below the 1st support level, the price could fall towards the 78.6% Fibonacci retracement level of 3784.19. There could be some pullback up towards the 1st Support level area else it could head towards the 2nd support of 3636.87. As the price falls towards the 2nd support, it could find some pullback towards the 78.6% Fibonacci retracement pullback support area.
Areas of consideration:
- H4 time frame, 1st support at 3900
- H4 time frame, 2nd support at 3636.87
GBP/USD Daily Outlook
Daily Pivots: (S1) 1.1355; (P) 1.1418; (R1) 1.1485; More...
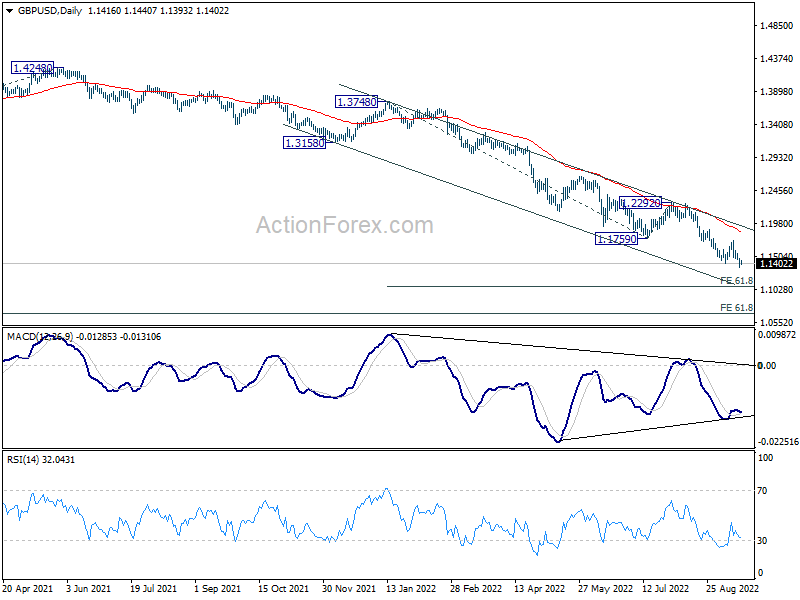
Intraday bias in GBP/USD stays on the downside this week. Current down trend should target 61.8% projection of 1.3748 to 1.1759 from 1.2292 at 1.1063. On the upside, above 1.1479 minor resistance will turn intraday bias neutral first. But break of 1.1737 resistance is needed to indicate short term bottoming. Otherwise, outlook will remain bearish in case of recovery.
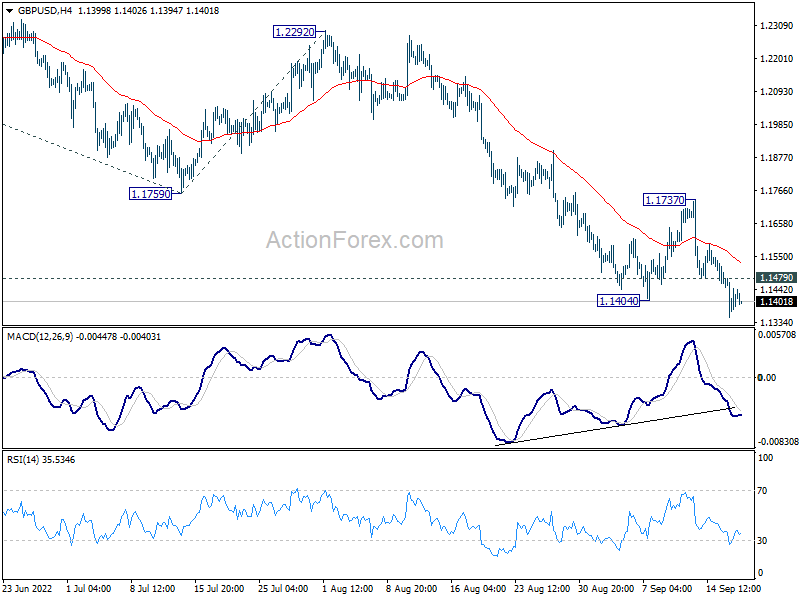
In the bigger picture, based on current momentum, fall from 1.4248 (2018 high) is probably resuming long term down trend from 2.1161 (2007 high). Sustained break of 1.1409 will target 61.8% projection of 1.7190 (2014 high) to 1.1409 (2020 low) from 1.4248 (2021 high) at 1.0675. This will remain the favored case for now as long as 1.2292 resistance holds.
Fed, SNB and BoE to Hike, BoJ to Stand Pat This Week
Dollar is trading with a slightly firmer tone in quiet Asian session. But overall, most major pairs and crosses are stuck inside Friday's range. Trading would likely remain subdued with Japan and UK on holiday, and the calendar is light. Nevertheless, the week ahead is ultra busy with four central bank meetings and some important economic data too.
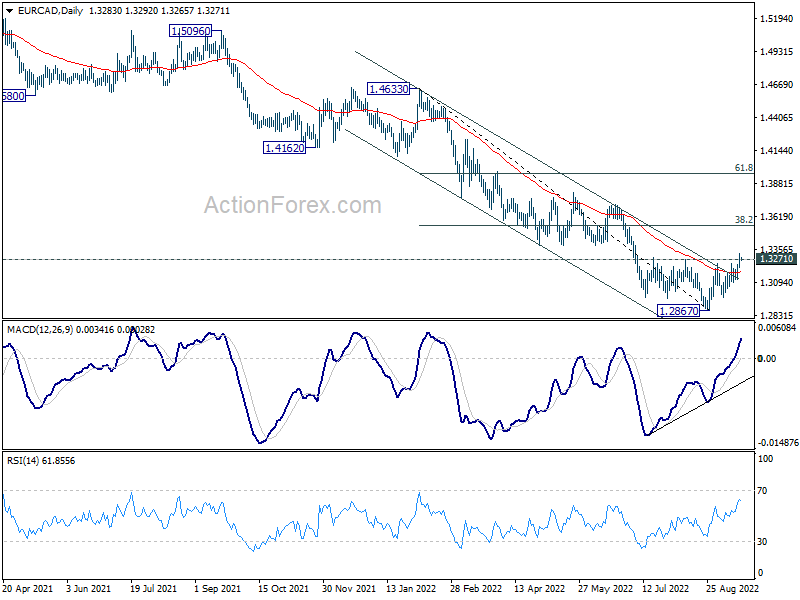
Technically, Euro has made nice bounces in some crosses, on expectation of hawkish ECB. EUR/CAD's break of 1.3271 resistance confirmed short term bottoming at 1.2867, on bullish convergence condition in daily MACD. The break above 55 day EMA, as well as the falling trend line resistance argues that it's at least correcting the decline from 1.4633. Further rally is in favor back to 38.2% retracement from 1.4633 to 1.2867 at 1.3542. Such development could help cushion any decline in EUR/USD.
In Asia, Japan is on holiday. Hong Kong HSI is down -0.99%. China Shanghai SSE is down -0.21%. Singapore Strait Times is down -0.09%.
ECB Lane: Tightening is not pain free
ECB Chief Economist Philip Lane said in a conference over the weekend, monetary tightening is "going to dampen demand", and "we're not going to pretend this is pain free".
"Demand is now a source of inflation pressure, it was not six or nine months ago in the same way it now is," he added.
While rate hikes could continue at each remaining meeting of the year, and extend to early next year, Lane said ECB is open mind on where to stop with a meeting-by-meeting approach.
On the economy, Lane said separately in an RTE interview, "If we think our base case is to barely grow, a technical recession - falling into a mild recession - cannot be ruled out."
Bundesbank Nagel: We have to be determined, in October and beyond
Bundesbank President Joachim Nagel said on Sunday, "If the data trend continues, more interest-rate increases have to follow -- that's already agreed in the Governing Council. We have to be determined, in October and beyond."
Nagel added that interest rates are still "somewhat off the levels" to curb inflation. "We must bring inflation back under control," he said. "We mustn't let up, even if the economy worsens."
On the German economy, he said that momentum will likely slow in Q3 and Q4, but he's confident that it could avoid a steep slump.
NZ BusinessNZ services rose to 58.6, bouncing for how long?
New Zealand BusinessNZ Performance of Services Index rose from 54.4 to 58.6 in August. Looking at some details, activity/sales rose from 54.4 to 67.1. Employment rose from 49.3 to 50.8. New orders/business rose from 53.4 to 66.5. Stocks/inventories rose from 53.8 to 59.6. Supplier deliveries rose from 47.6 to 49.6.
BNZ Senior Economist Doug Steel said that "overall, combining August's strong PSI with last week's firmer PMI yields a composite index (PCI) that suggests annual GDP growth up toward 5% in Q3 2022. We currently forecast 5%+ for that period but that strength is mostly a function of the very weak base period. If the PCI is truly bouncing, the key question is for how long?"
Fed, SNB and BoE to hike, BoJ to stand pat
Four central banks will meet this week. Fed is expected hike by another 75bps to 3.00-3.25%. There is some speculation of a 100bps hike, but Fed is unlikely to push the panic button and do that. The new economic projections and dot plot will also be released. Some hawkish surprise could be seen there, which indicates higher terminal rate for current cycle, and a longer period to stay there.
BoJ is expected to stay firmly on hold on monetary policy. Governor Haruhiko Kuroda might reiterate that rapid, one-sided depreciation in the exchange rate is undesirable, but nothing more. SNB is expected to joint the 75bps hike club, and lift interest rate back to positive at 0.50%. SNB will also repeat that appreciation of the Swiss Franc is welcome for now, as it helps curb imported inflation. BoE is expected to deliver another 50bps hike to 2.25%. Given that the UK economy is already in recession, there could be dovish surprises in the voting.
Other central bank activities include release of RBA minutes and ECB monthly bulletin. On the data front, Canada CPI and retail sales will catch much attention, together with PMIs from Australia, Eurozone, UK and the US.
Here are some highlights for the week:
- Monday: New Zealand BusinessNZ services; Canada IPPI, RMPI; US NAHB housing index.
- Tuesday: Japan CPI; RBA minutes; Swiss trade balance, SECO economic forecasts Germany PPI; Eurozone current account; Canada CPI, US building permits and housing starts.
- Wednesday: UK public sector net borrowing, CBI industrial order expectations; US existing home sales, FOMC rate decision.
- Thursday: New Zealand trade balance; BoJ rate decision; SNB rate decision; ECB monthly bulletin; BoE rate decision; Canada new housing price index; US jobless claims, current account, consumer confidence.
- Friday: Australia PMIs; Eurozone PMIs; UK PMIs; Canada retail sales; US PMIs.
GBP/USD Daily Outlook
Daily Pivots: (S1) 1.1355; (P) 1.1418; (R1) 1.1485; More...
Intraday bias in GBP/USD stays on the downside this week. Current down trend should target 61.8% projection of 1.3748 to 1.1759 from 1.2292 at 1.1063. On the upside, above 1.1479 minor resistance will turn intraday bias neutral first. But break of 1.1737 resistance is needed to indicate short term bottoming. Otherwise, outlook will remain bearish in case of recovery.
In the bigger picture, based on current momentum, fall from 1.4248 (2018 high) is probably resuming long term down trend from 2.1161 (2007 high). Sustained break of 1.1409 will target 61.8% projection of 1.7190 (2014 high) to 1.1409 (2020 low) from 1.4248 (2021 high) at 1.0675. This will remain the favored case for now as long as 1.2292 resistance holds.
Economic Indicators Update
| GMT | Ccy | Events | Actual | Forecast | Previous | Revised |
|---|---|---|---|---|---|---|
| 22:30 | NZD | Business NZ PSI Aug | 58.6 | 51.2 | 54.4 | |
| 10:00 | EUR | German Buba Monthly Report | ||||
| 12:30 | CAD | Industrial Product Price M/M Aug | 0.20% | -2.10% | ||
| 12:30 | CAD | Raw Material Price Index Aug | 3.20% | -7.40% | ||
| 14:00 | USD | NAHB Housing Market Index Sep | 48 | 49 |
NZ BusinessNZ services rose to 58.6, bouncing for how long?
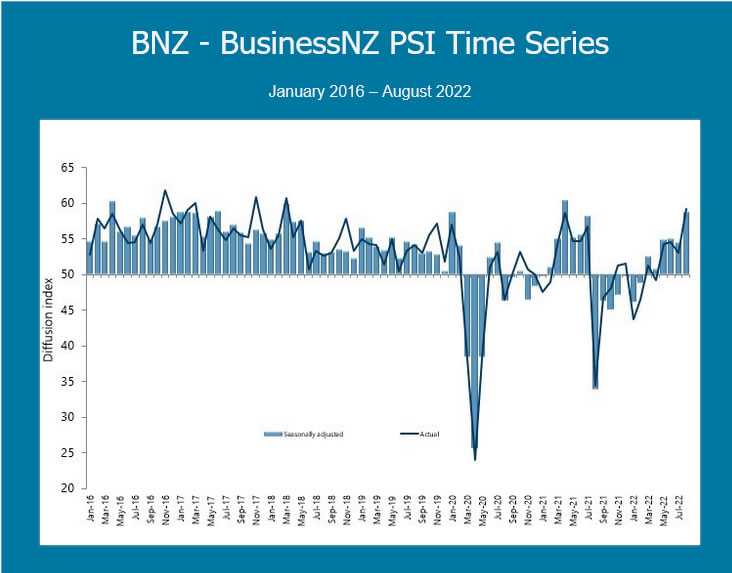
New Zealand BusinessNZ Performance of Services Index rose from 54.4 to 58.6 in August. Looking at some details, activity/sales rose from 54.4 to 67.1. Employment rose from 49.3 to 50.8. New orders/business rose from 53.4 to 66.5. Stocks/inventories rose from 53.8 to 59.6. Supplier deliveries rose from 47.6 to 49.6.
BNZ Senior Economist Doug Steel said that "overall, combining August's strong PSI with last week's firmer PMI yields a composite index (PCI) that suggests annual GDP growth up toward 5% in Q3 2022. We currently forecast 5%+ for that period but that strength is mostly a function of the very weak base period. If the PCI is truly bouncing, the key question is for how long?"
ECB Lane: Tightening is not pain free
ECB Chief Economist Philip Lane said in a conference over the weekend, monetary tightening is "going to dampen demand", and "we're not going to pretend this is pain free".
"Demand is now a source of inflation pressure, it was not six or nine months ago in the same way it now is," he added.
While rate hikes could continue at each remaining meeting of the year, and extend to early next year, Lane said ECB is open mind on where to stop with a meeting-by-meeting approach.
On the economy, Lane said separately in an RTE interview, "If we think our base case is to barely grow, a technical recession - falling into a mild recession - cannot be ruled out."
Bundesbank Nagel: We have to be determined, in October and beyond
Bundesbank President Joachim Nagel said on Sunday, "If the data trend continues, more interest-rate increases have to follow -- that's already agreed in the Governing Council. We have to be determined, in October and beyond."
Nagel added that interest rates are still "somewhat off the levels" to curb inflation. "We must bring inflation back under control," he said. "We mustn't let up, even if the economy worsens."
On the German economy, he said that momentum will likely slow in Q3 and Q4, but he's confident that it could avoid a steep slump.
EUR/USD Faces Uphill Task, USD/JPY Signals Correction
Key Highlights
- EUR/USD is attempting a recovery wave above 1.0000.
- A major bullish trend line is forming with support at 0.9995 on the 4-hours chart.
- GBP/USD extended losses below the 1.1450 support zone.
- USD/JPY is signaling a downside correction from the 145.00 resistance.
EUR/USD Technical Analysis
The Euro faced a strong resistance near the 1.0197 against the US Dollar. EUR/USD started a fresh decline and traded below the 1.0060 support zone.

Looking at the 4-hours chart, the pair extended losses below the 1.0020 support, the 100 simple moving average (red, 4-hours), and the 200 simple moving average (green, 4-hours).
It traded as low as 0.9945 before the bulls took a stand. It is now consolidating losses above the 0.9980 level. On the upside, the pair is facing a strong resistance near the 1.0060 zone and the 200 simple moving average (green, 4-hours).
The 50% Fib retracement level of the key decline from the 1.0197 swing high to 0.9945 low is also near the 1.0070 level to act as a resistance.
A clear move above the 1.0060 and 1.0070 levels could open the doors for a larger increase. In the stated case, the pair might rise towards the 1.0120 and 1.0130 levels.
On the downside, an initial support is near the 0.9995 level. There is also a major bullish trend line forming with support at 0.9995 on the same chart. A downside break below the trend line support might spark a sharp decline towards the 0.9950 support.
The next major support is near the 0.9920 level, below which the pair could even test the 0.9900 level in the coming sessions.
Looking at USD/JPY, the pair made two attempts to clear the 145.00 resistance level, but failed. As a result, there is a risk of a downside correction to 140.00.
Economic Releases
- NAHB Housing Market Index for Sep 2022 – Forecast 48, versus 49 previous.