Sample Category Title
Pound Slides After Soft Retail Sales
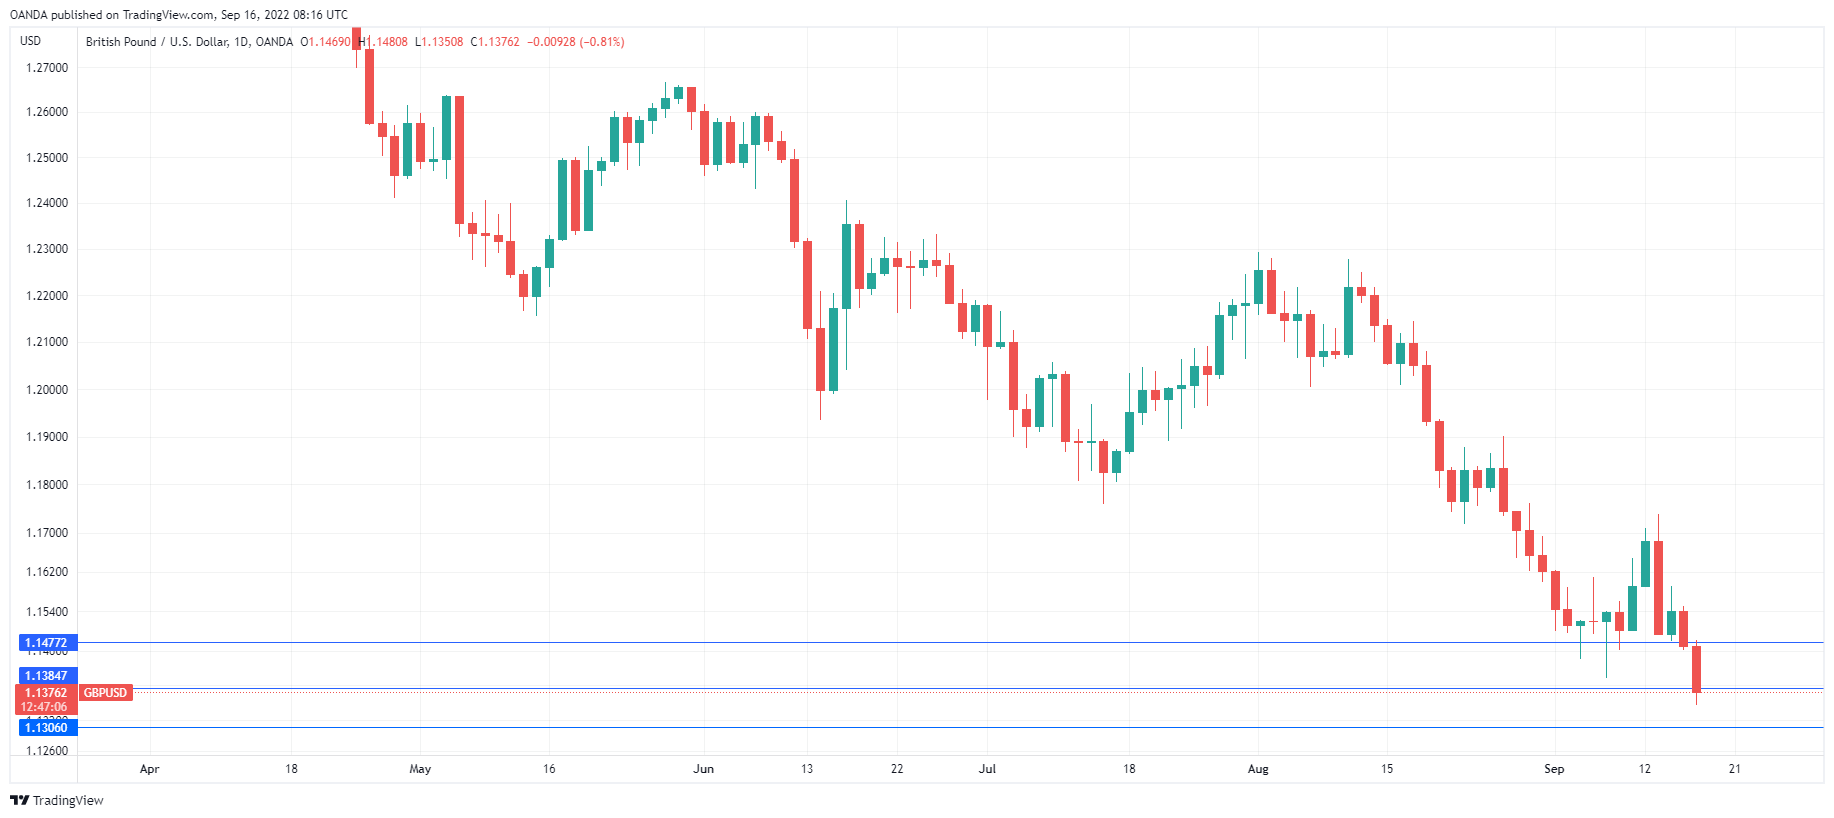
The British pound continues to lose ground after a brutal retail sales report. The pound dropped as low as 1.1350 earlier today, its lowest level since March 2020. GBP/USD is trading at 1.1373 in the European session, down 0.73%.
UK retail sales decline
The week wrapped up on a sour note in the UK, as retail sales for August were sharply lower. The headline reading declined by 5.4% YoY, lower than the July release of -3.2% and missing the forecast of -4.2%. It was a similar story with core retail sales, which declined by 5.0%, below the July reading of -3.1% and shy of the estimate of -3.4%. On a monthly basis, retail sales slid by 1.6%, missing the consensus of -0.7% and marking the sharpest decline in eight months.
The markets were braced for a weak retail sales report and the only surprise was how sharply consumer spending is falling. The cost-of-living crisis has hammered UK consumers who are in a sour mood and are cutting on disposable spending. Wage growth has not kept up with hot inflation and a YouGov survey found that consumer confidence fell into negative territory in August for the first time since the Covid lockdown in mid-2020. The weak data is another sign that the UK economy is tipping into a recession.
The Bank of England meets on September 22nd, a day after the Fed, and is expected to hike rates by 0.75%. The current rate of 1.75% is well below the Fed and other major banks, as the BoE has been slow to tighten, despite spiralling inflation. Governor Bailey has been criticized for throwing in the towel and not doing enough to combat inflation. The BoE is playing catch-up with inflation and could raise rates up to 4.5% next year if inflation does not ease significantly.
GBP/USD Technical
- GBP/USD is testing resistance at 1.1548. Next, there is resistance at 1.1689
- There is support at 1.1417 and 1.1306
Eurozone CPI finalized at 9.1% yoy in Aug, core CPI at 4.3% yoy
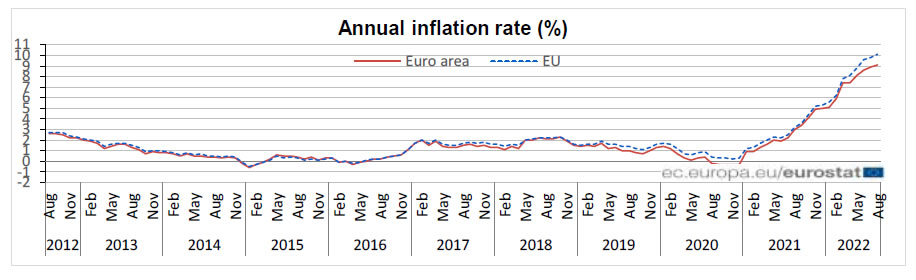
Eurozone CPI was finalized at 9.1% yoy in August, up from 8.9% yoy in July. A year earlier, the rate was only 3.0% yoy. CPI core (all item ex-energy, food, alcohol and tobacco) was finalized at 4.3%, up from prior month's 4.0% yoy. The highest contribution to the annual Eurozone inflation rate came from energy (3.95%), followed by food, alcohol & tobacco (2.25%), services (1.62%) and non-energy industrial goods (1.33%).
EU CPI was finalized at 10.1%, up from 9.8% a month ago. The lowest annual rates were registered in France (6.6%), Malta (7.0%) and Finland (7.9%). The highest annual rates were recorded in Estonia (25.2%), Latvia (21.4%) and Lithuania (21.1%). Compared with July, annual inflation fell in twelve Member States and rose in fifteen.
USDCAD Storms to Fresh 22-Month High
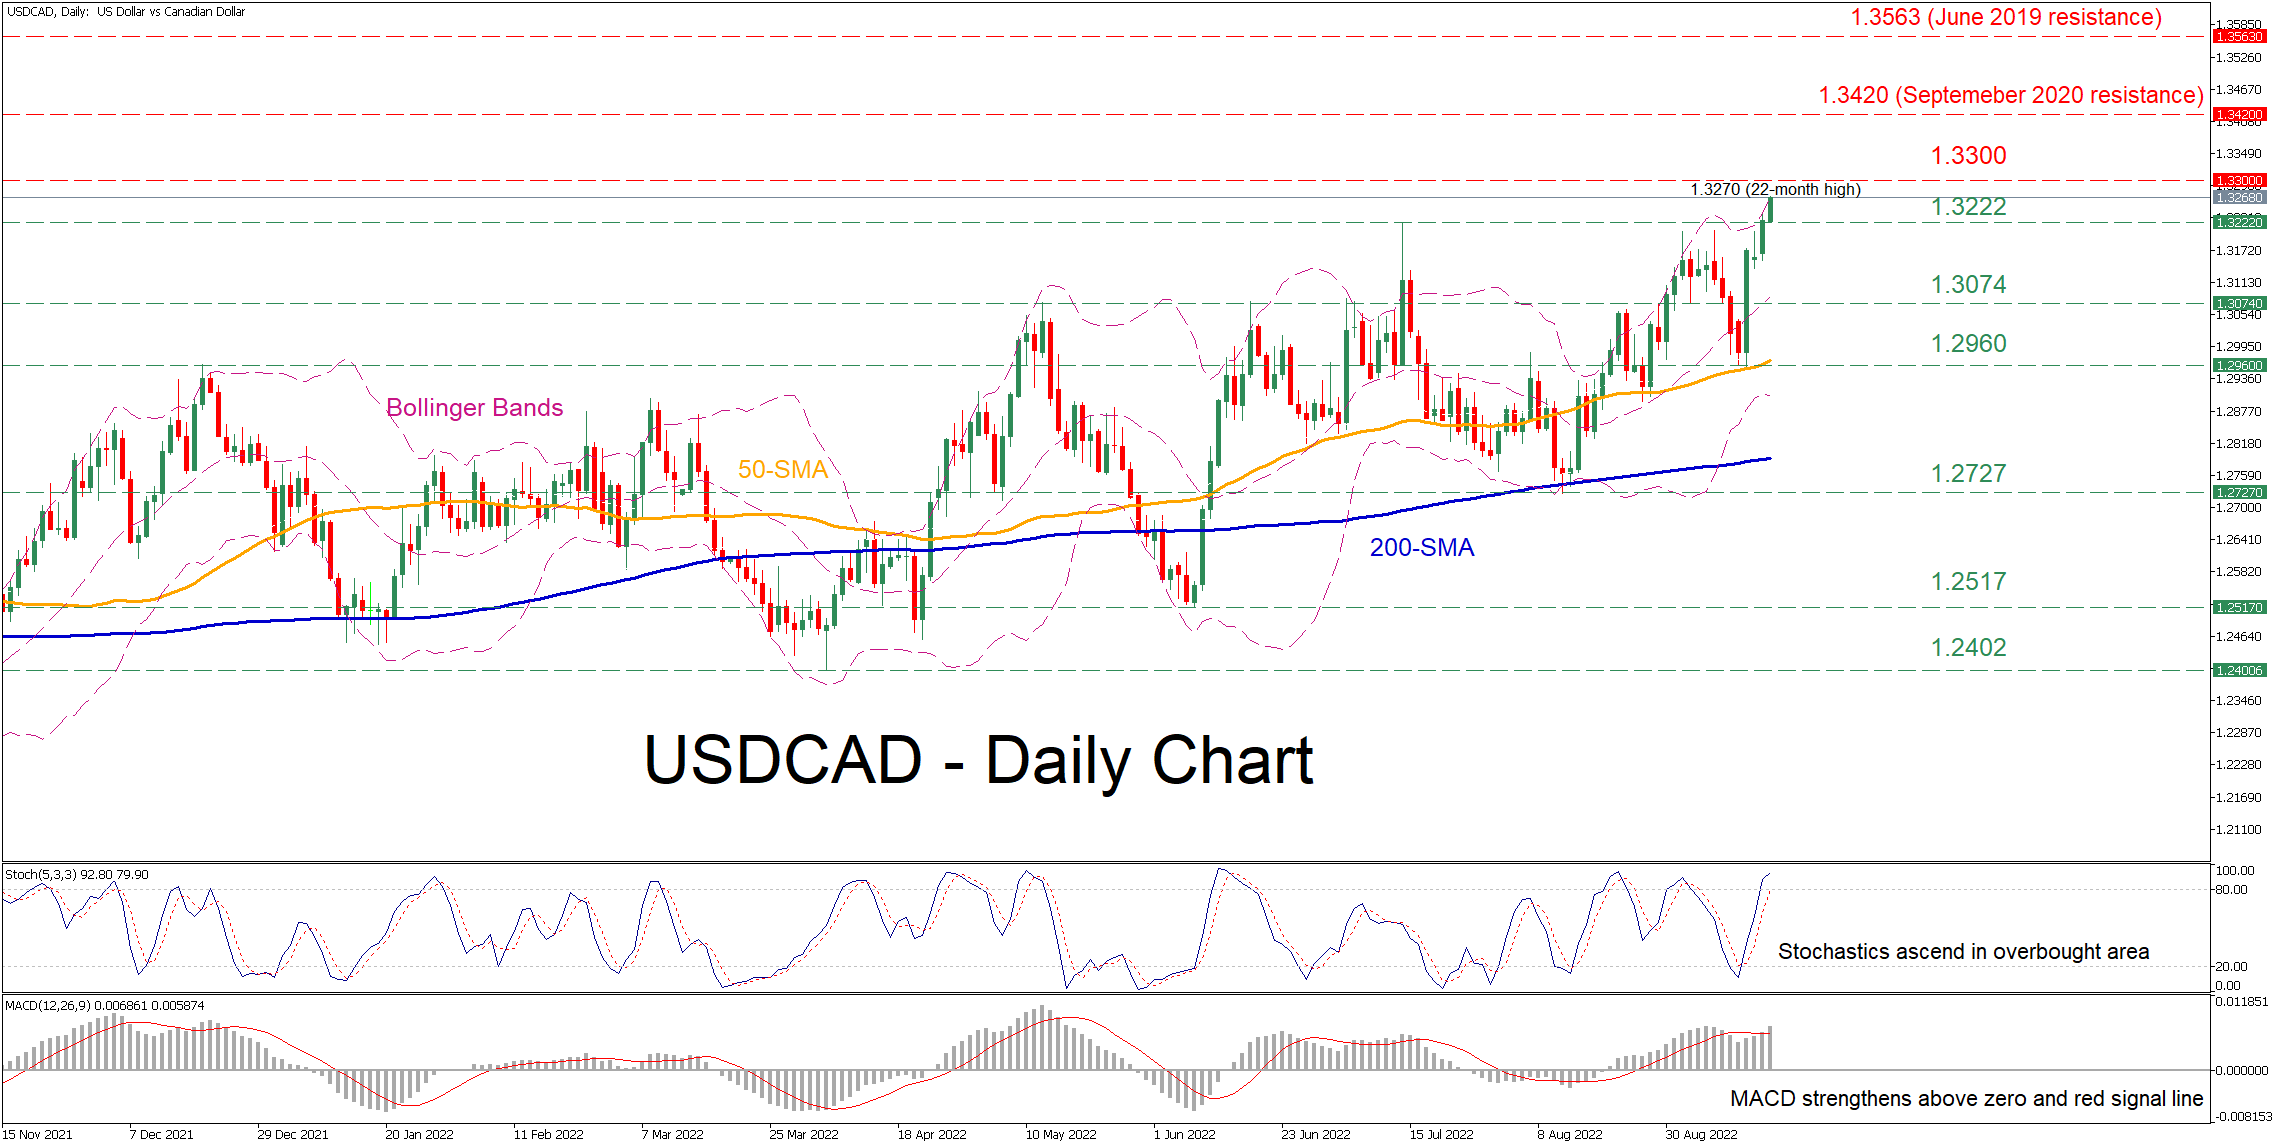
USDCAD has been in an uptrend since early August when the price encountered strong support at the 200-day simple moving average (SMA). Moreover, in the past few sessions, the technical picture has improved even further, with the price recording a fresh 22-month high of 1.3270 and currently trading above its upper Bollinger band.
The momentum indicators also suggest that near-term risks are tilted to the upside. Specifically, the stochastic oscillator is sloping upwards in the overbought area, while the MACD histogram has been strengthening above both zero and its red signal line.
Should buying interest intensify further, the price could ascend to test the 1.3300 psychological mark. Conquering this barricade, the bulls could then target the September 2020 resistance territory of 1.3420. Even higher, any further advances may then halt at the June 2019 resistance of 1.3563.
On the flipside, bearish actions could encounter initial support at the previous peak of 1.3222. Sliding beneath that floor, the pair could challenge the 1.3074 barrier, which has acted both as resistance and support in the past few months. Failing to halt there, the 1.2960 support might prove to be the next obstacle for sellers to overcome.
Overall, USDCAD appears to have the necessary momentum to push even higher and form new multi-year highs. Nevertheless, a downside correction cannot be ruled out as the short-term oscillators are indicating that the pair is approaching overbought levels.
GBPJPY Eases for the Fourth Straight Day; Neutral Bias
GBPJPY is retreating for the fourth consecutive red day, following the pullback from the 167.50 resistance level. Currently, the market is neutral in the medium-term, as it failed several times to post a higher high above the more-than-six-year peak of 168.65.
The pair is approaching the recent bullish crossover within the 20- and 50-day simple moving averages (SMAs) that is suggests more gains in the short-term. However, the technical oscillators show contradicting signals. The RSI is pointing downwards in the positive area, while the MACD is ready to fall beneath its trigger line above the zero level.
If the pair breaks the 163.90 support level as well as the short-term SMAs, then the next target could come from the 200-day SMA, which overlaps with the 160.00 psychological mark. More downside pressures may change the neutral outlook to bearish, meeting the 157.80 and the 155.55 support levels.
On the flipside, a bounce off the bullish cross of the SMAs may drive the market higher, towards the 167.50 resistance and the multi-year high of 168.65. Even higher, the market will endorse a long-term bullish bias, resting near the 175.00 handle, taken from inside swing low in April 2015.
In the broader picture, the market is awaiting a climb above the 168.65 barrier for brighten the bullish outlook. Only a decline beneath the 200-day SMA may switch the view to bearish.

Japanese Yen – Calm Before the Storm?
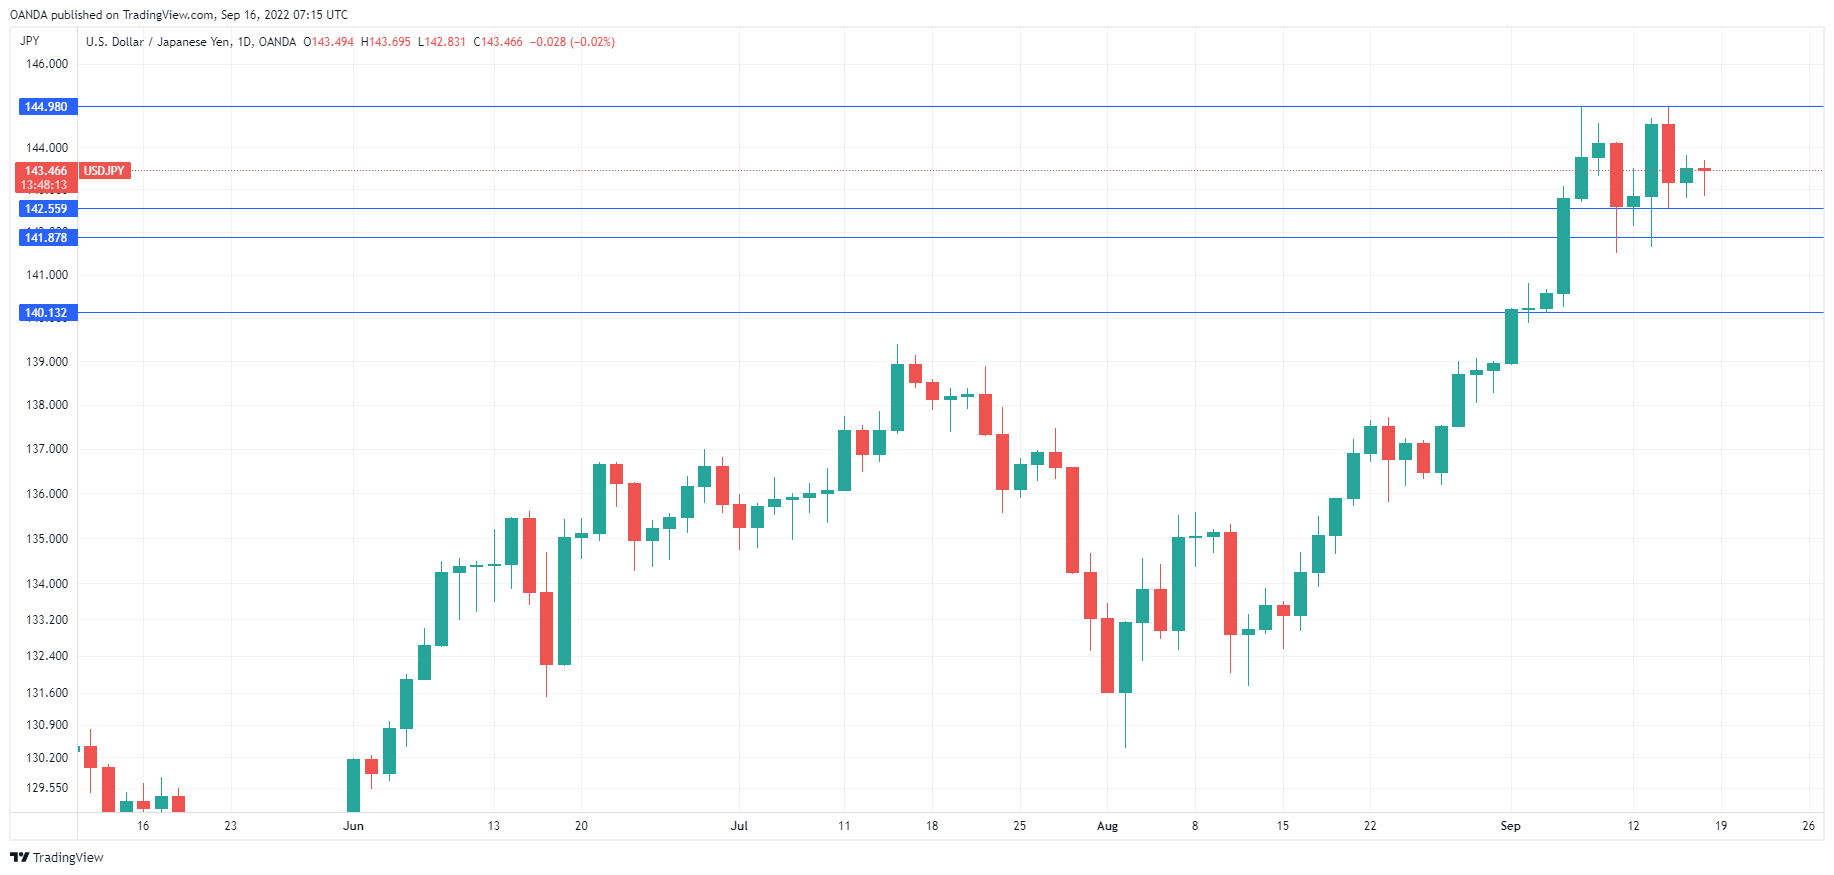
After some mid-week volatility, USD/JPY has settled down. In the European session, the yen is trading quietly at 143.59.
Markets eye BoJ meeting
For anyone following the Japanese yen, next week promises to be interesting, at the very least. The Federal Reserve will hold its policy meeting on September 21st, with the Bank of Japan officials meeting the next day. The Japanese yen continues to lose ground against the dollar, and fell to 144.99 earlier this month, a new 24-year low. Japanese officials have responded with well-worn rhetoric about how Tokyo is concerned about the yen’s depreciation and warning that all options are on the table. We’ve heard this all before, but is this time different? Is Japan seriously contemplating a currency intervention to prop up the ailing yen? There has been some speculation that 145 could be a line in the sand for the MOF, but in fairness, there was similar talk when yen hit 130 and then 135, and the MOF and BoJ stayed on the sidelines.
The likelihood is that Tokyo will avoid such a dramatic move, which last occurred in 2011. The Ministry of Finance (MOF) and the Bank of Japan are not happy with the rapid descent of the yen, but an intervention would require the consent of the G-20, which is unlikely to give its consent. The BoJ made waves this week after a report that it had conducted a rate check, which was viewed as a possible prelude to an intervention. Finance Minister Suzuki has been coy about what moves he might make, and refused to comment on whether the BoJ had made a rate check.
The BoJ has rigidly maintained its ultra-loose monetary policy in order to stimulate Japan’s fragile economy. As part of this policy, the BoJ has kept a firm hand on its yield curve control, and the price for this stance has been a freefall in the yen, which is done an astounding 30% against the dollar this year. With the Fed looking to hike next week by 75 basis point, and an outside chance of a massive full-point increase, the yen’s downtrend is likely to continue, barring a spectacular response from Japanese officials.
USD/JPY Technical
- 1.4363 is the next line of resistance, followed by 144.81
- USD/JPY has support at 142.56, followed by 141.88
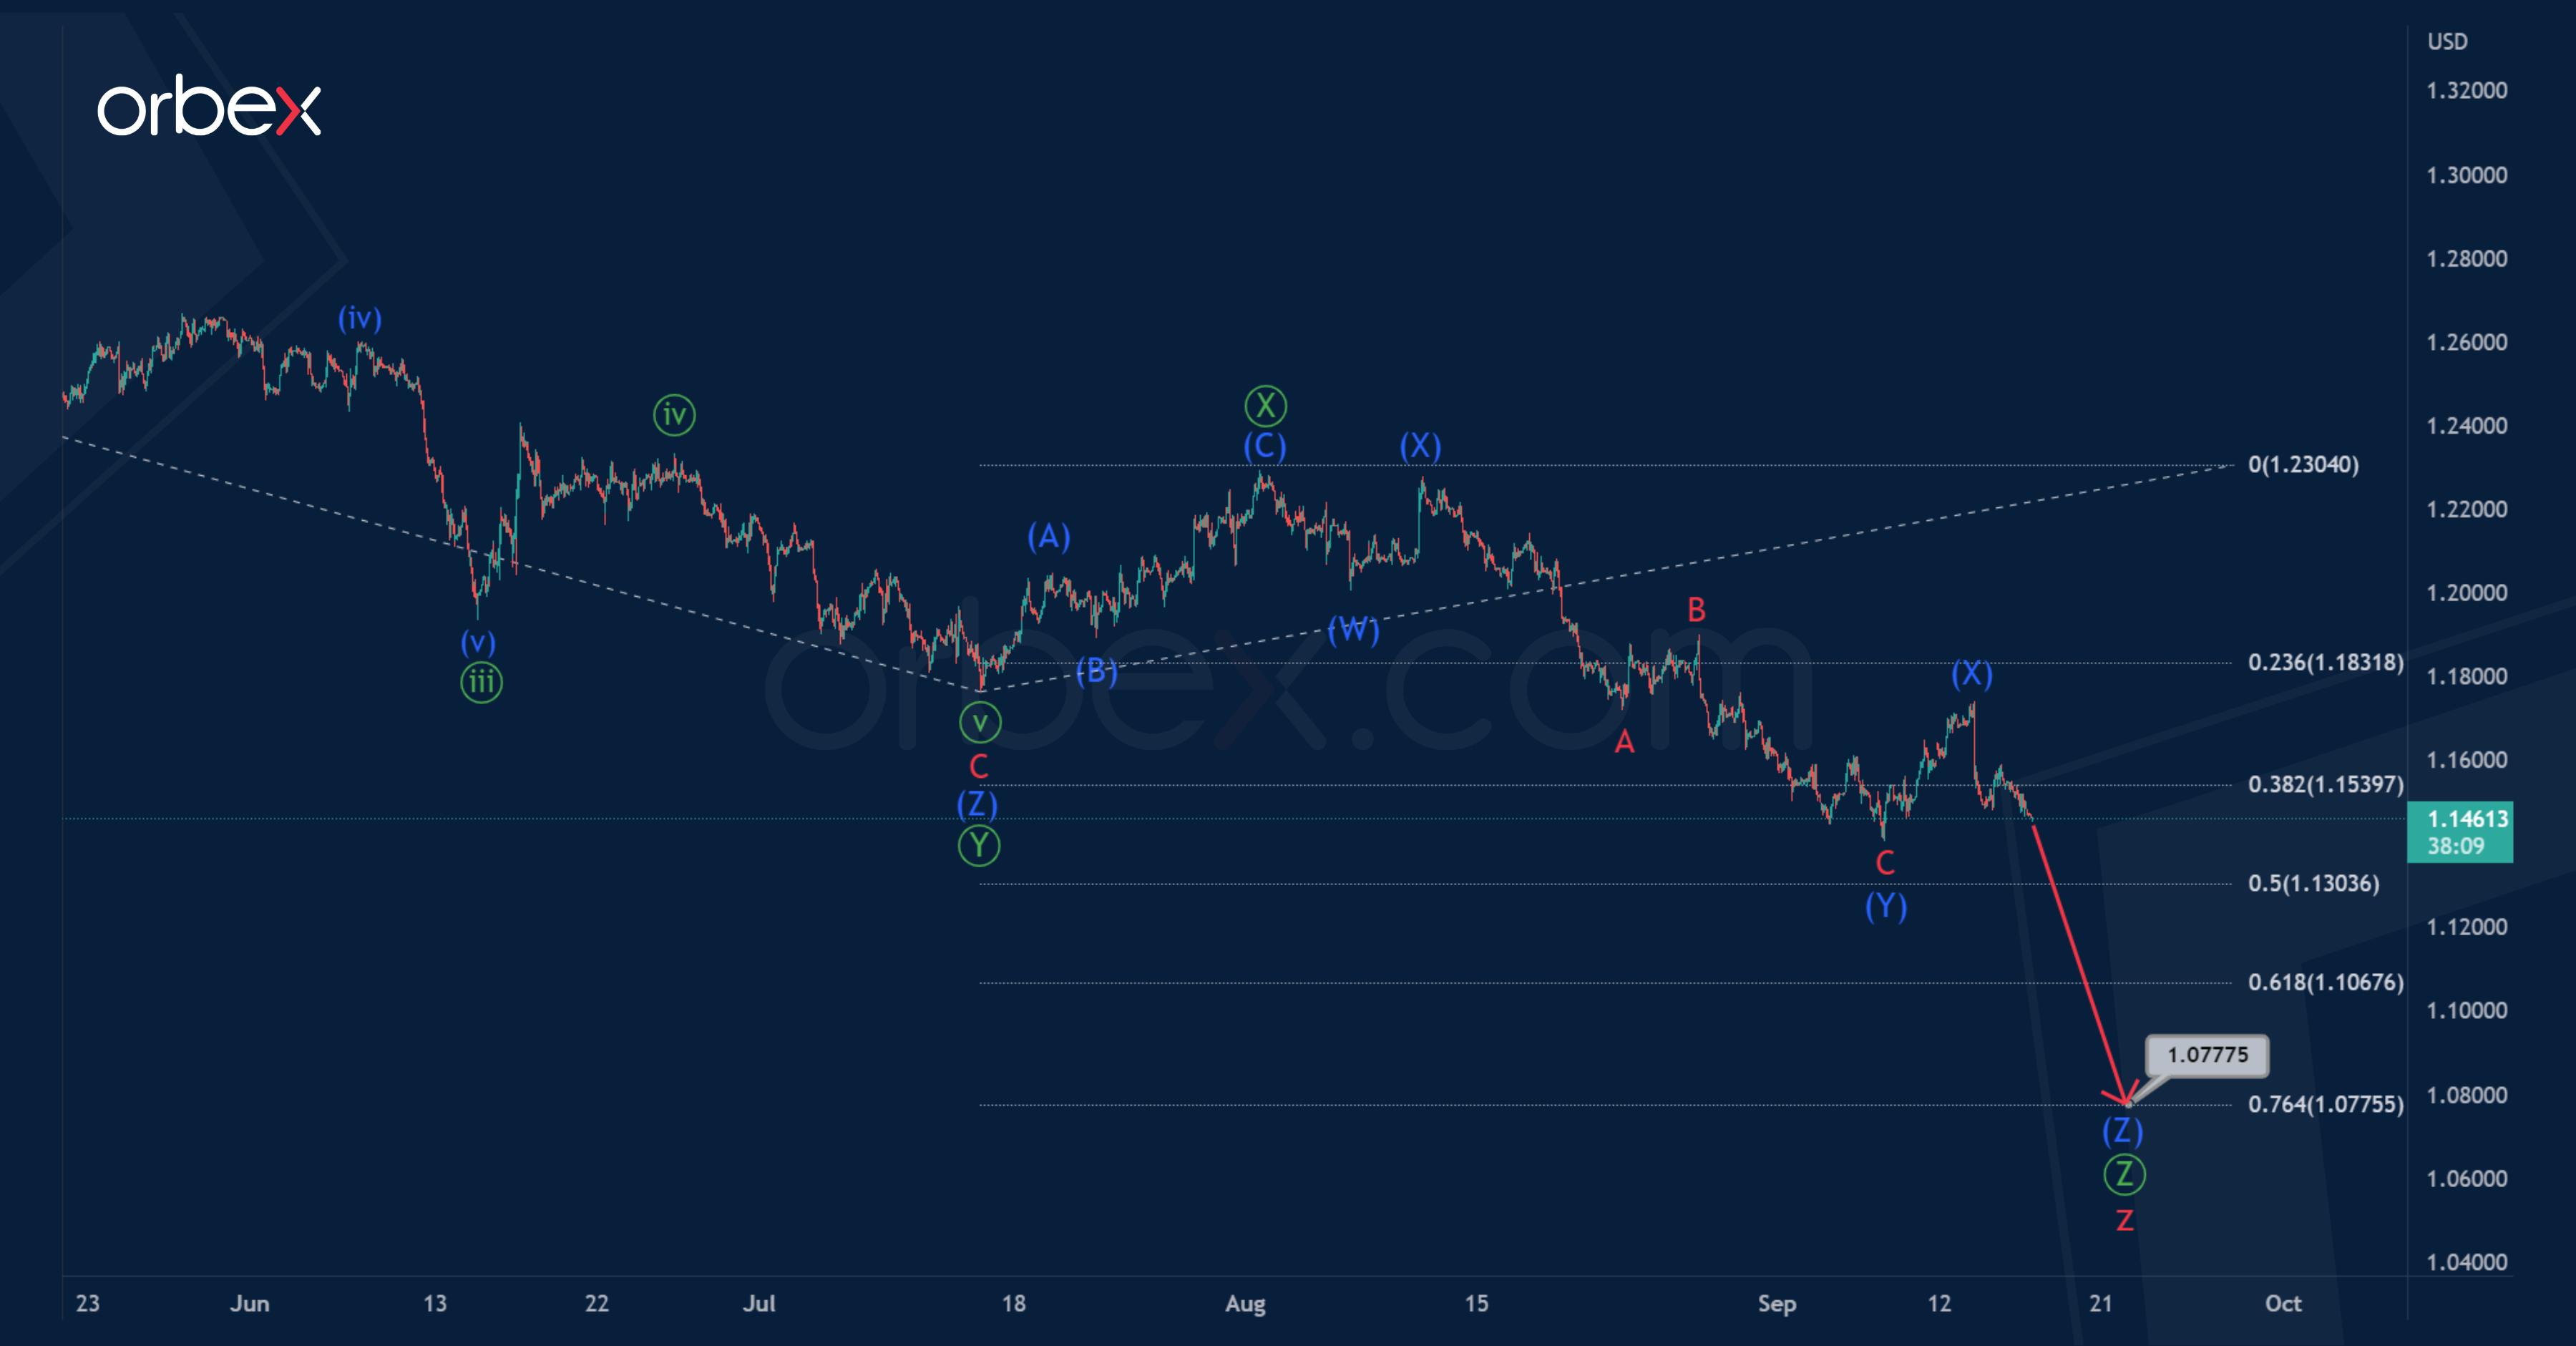
GBP/USD: Primary Triple Zigzag Likely to Complete Near 1.077
The internal structure of the GBPUSD currency pair suggests the formation of a global corrective trend – a triple zigzag w-x-y-x-z. On the 1H timeframe, we see the final actionary wave z of the cycle degree.
The wave z most likely takes the form of a primary triple zigzag Ⓦ-Ⓧ-Ⓨ-Ⓧ-Ⓩ. At the beginning of August, the bullish price movement within the primary intervening wave Ⓧ apparently ended, it took the form of an intermediate zigzag (A)-(B)-(C).
It is likely that in the near future the bearish trend will continue to develop in the primary wave Ⓩ, which may complete its intermediate triple zigzag pattern (W)-(X)-(Y)-(X)-(Z) near 1.077.
At that level, wave Ⓩ will be at the 76.4% Fibonacci extension of previous actionary wave Ⓨ.
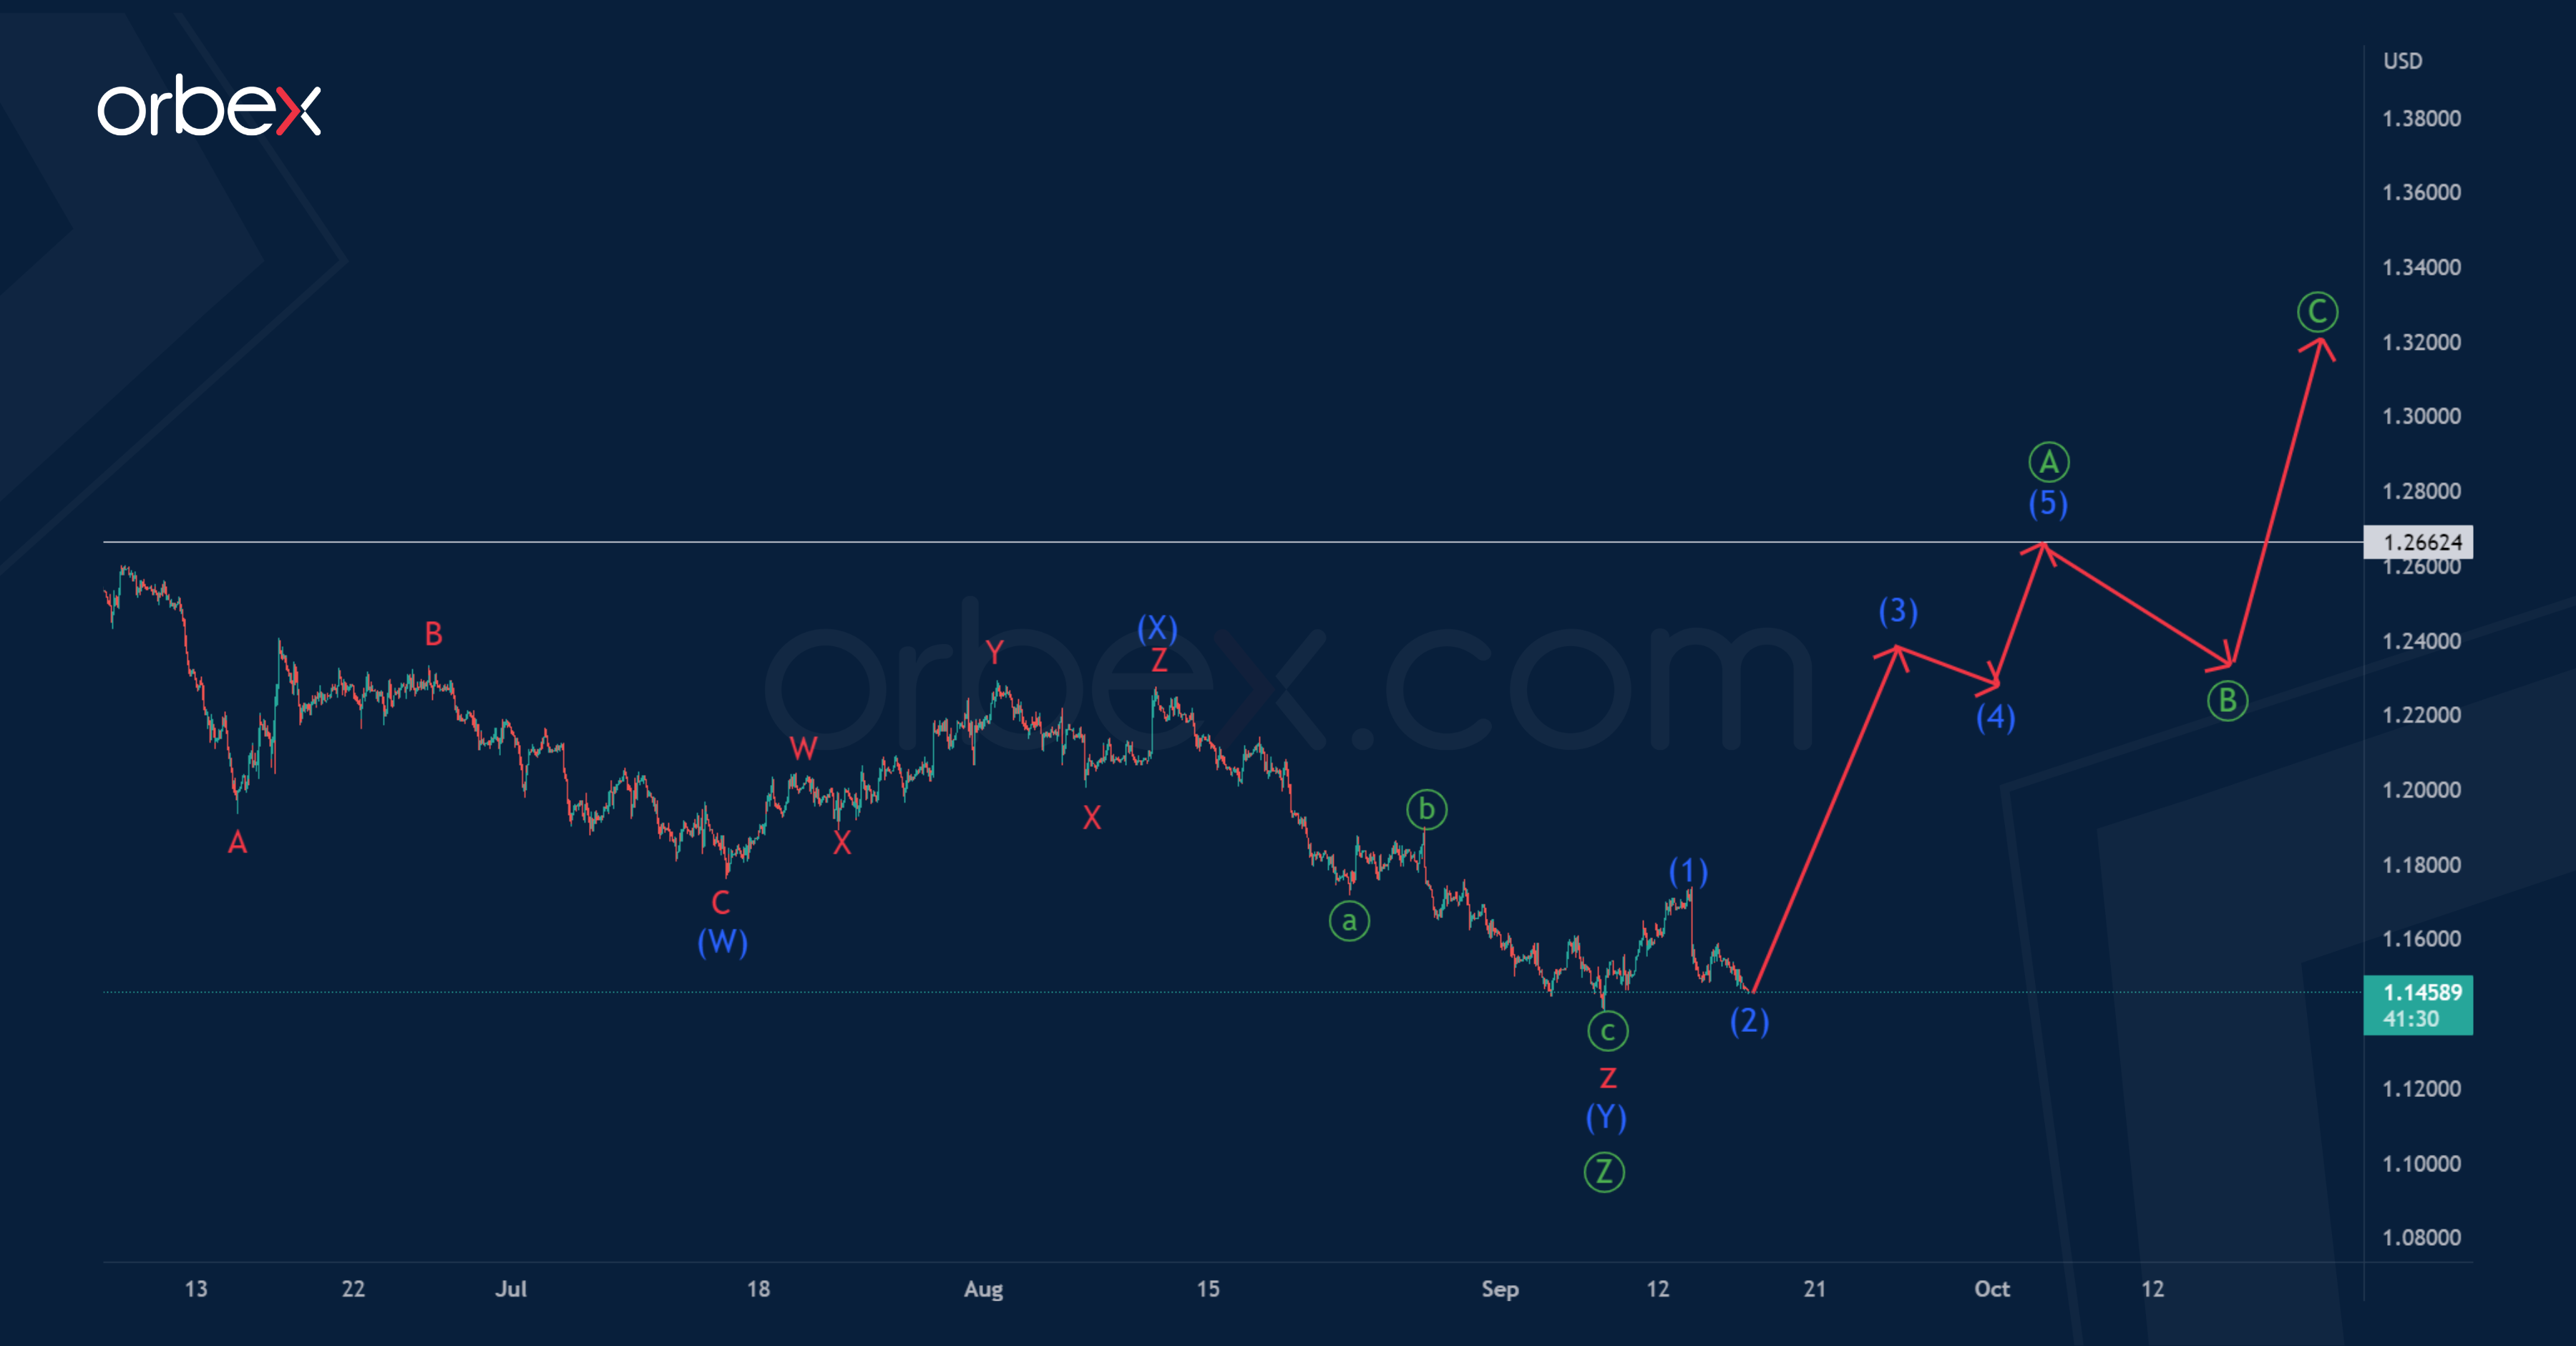
However, the cycle wave z could be fully completed. As in the main version, it has the form of a primary triple zigzag.
Thus, to confirm the second scenario, it is necessary that the bulls are strong enough to start moving the price within the new trend.
Perhaps in the next coming trading weeks, market participants will observe the construction of the first impulse wave of a potential zigzag of the primary degree.
The price may rise to the previous high of 1.266, and then even higher.
GBP/JPY Daily Outlook
Daily Pivots: (S1) 164.09; (P) 164.92; (R1) 165.35; More...
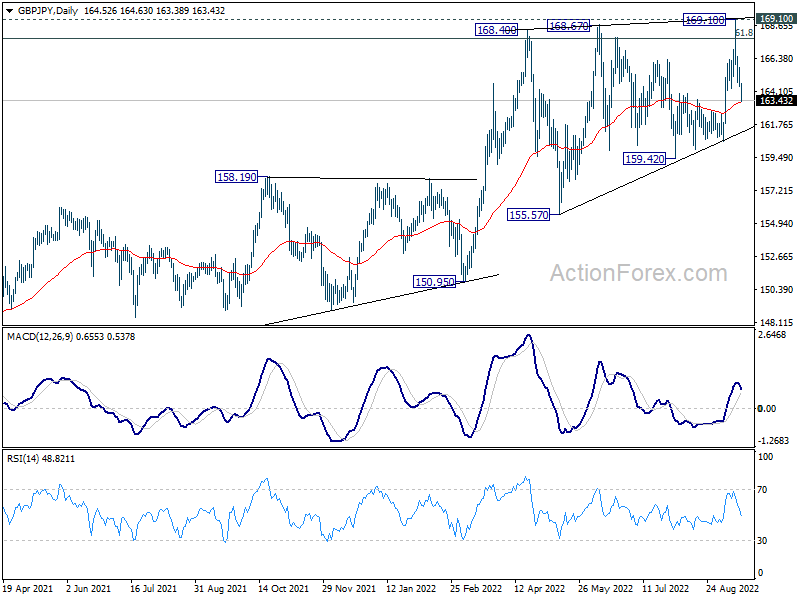
GBP/JPY's break of 163.91 support suggests that corrective pattern from 168.40 is extending with another falling leg. Intraday bias is back on the downside for 159.42 support. But downside should be contained there to bring rebound. Firm break of 169.91 will resume larger up trend. However, break of 159.42 support will now be a sign of bearish reversal and target 155.57 support next.
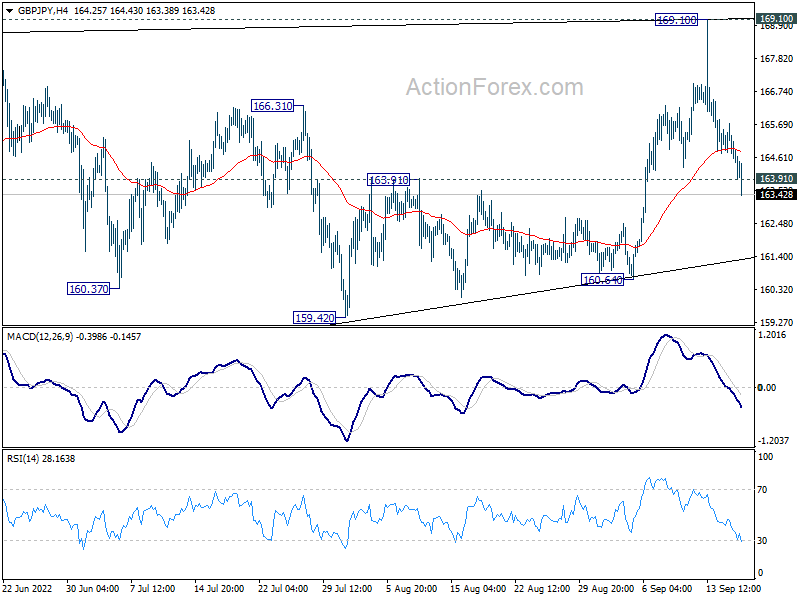
In the bigger picture, up trend from 123.94 (2020 low) is still in progress. Sustained break of 61.8% retracement of 195.86 (2015 high) to 122.75 (2016 low) at 167.93 will be a long term bullish signal, and could pave the way back to 195.86 high. This will remain the favored case as long as 155.57 support holds, even in case of deep pull back.
EUR/JPY Daily Outlook
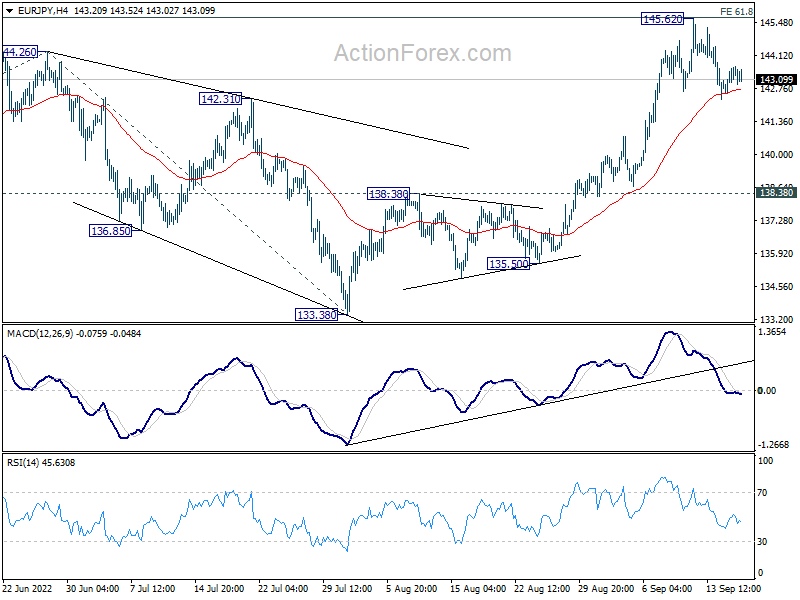
Daily Pivots: (S1) 142.78; (P) 143.23; (R1)143.89; More....
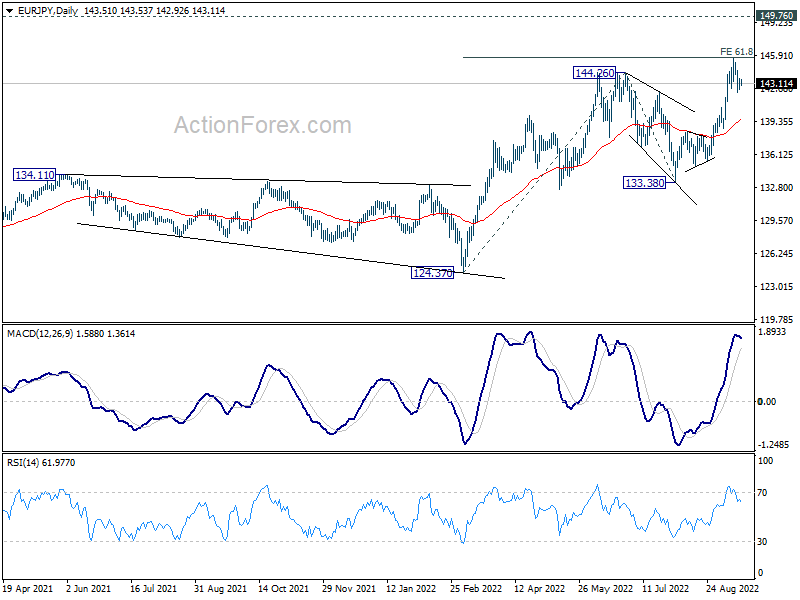
Intraday bias in EUR/JPY is staying neutral as consolidation from 145.62 is extending. Deeper pull back cannot be ruled out. But downside should be contained above 138.38 resistance turned support bring another rally. On the upside, decisive break of 61.8% projection of 124.37 to 144.26 from 133.38 at 145.67 will pave the way to 149.76 long term resistance, and then 100% projection at 153.27.
In the bigger picture, up trend from 114.42 (2020 low) is seen as the third leg of the pattern from 109.30 (2016 low). Next target is 149.76 (2015 high). For now, outlook will remain bullish as long as 133.38 support holds, even in case of deep pull back.
EUR/GBP Daily Outlook
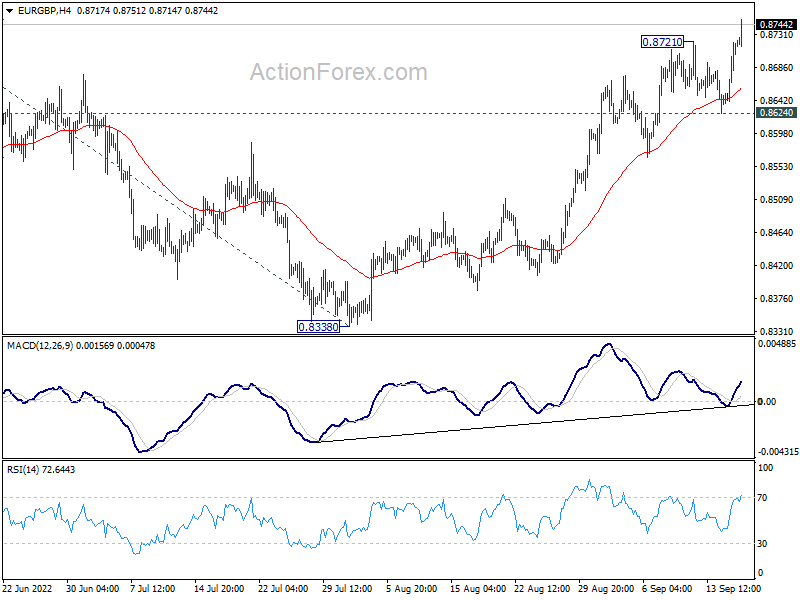
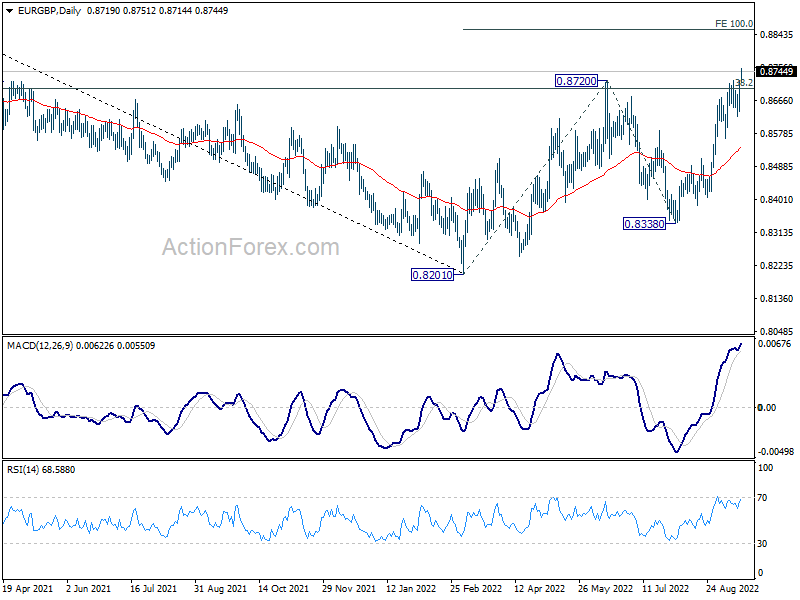
Daily Pivots: (S1) 0.8667; (P) 0.8694; (R1) 0.8745; More...
EUR/GBP surges to as high as 0.8751 so far. The firm break of 0.8720 resistance should confirm resumption of whole rise from 0.8201. Intraday bias will be back on the upside for 100% projection of 0.8201 to 0.8720 from 0.8338 at 0.8857. On the downside, break of 0.8624 support is needed to indicate short term topping. Otherwise, outlook will stay bullish in case of retreat.
In the bigger picture, sustained trading above 38.2% retracement of 0.9499 to 0.8201 at 0.8697 will argue that rise from 0.8201 is a medium term up trend, rather than a correction. Further rally would be seen back to 61.8% retracement at 0.9003. This will now be the favored case as long as 0.8338 support holds.
EUR/AUD Daily Outlook
Daily Pivots: (S1) 1.4798; (P) 1.4862; (R1) 1.4986; More...
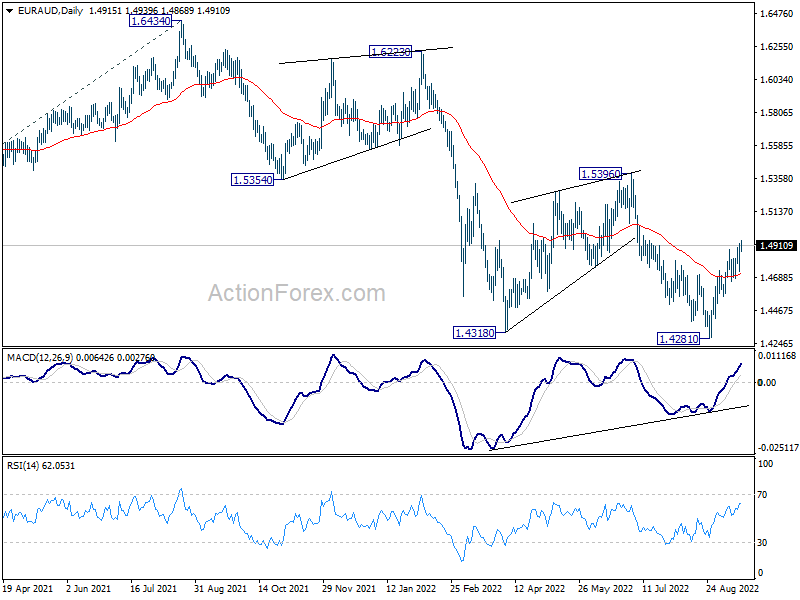
EUR/AUD's rally resumes again and intraday bias is back on the upside. Rise from 1.4281 short term bottom would target 1.5396 resistance. On the downside, however, break of 1.4663 minor support will turn bias back to the downside for retesting 1.4281 low.
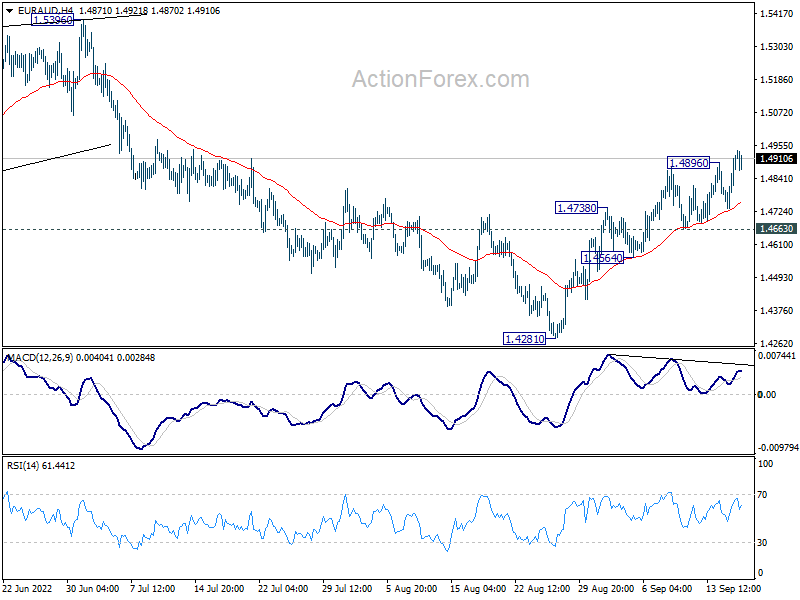
In the bigger picture, down trend from 1.9799 is still in progress. Break of 1.4318 low will target 61.8% projection of 1.9799 to 1.5250 from 1.6434 at 1.3623, which is close to 1.3624 long term support (2017 low). This will remain the favored case now as long as 1.5396 resistance holds.