Sample Category Title
Technical Outlook and Review
USD/JPY:
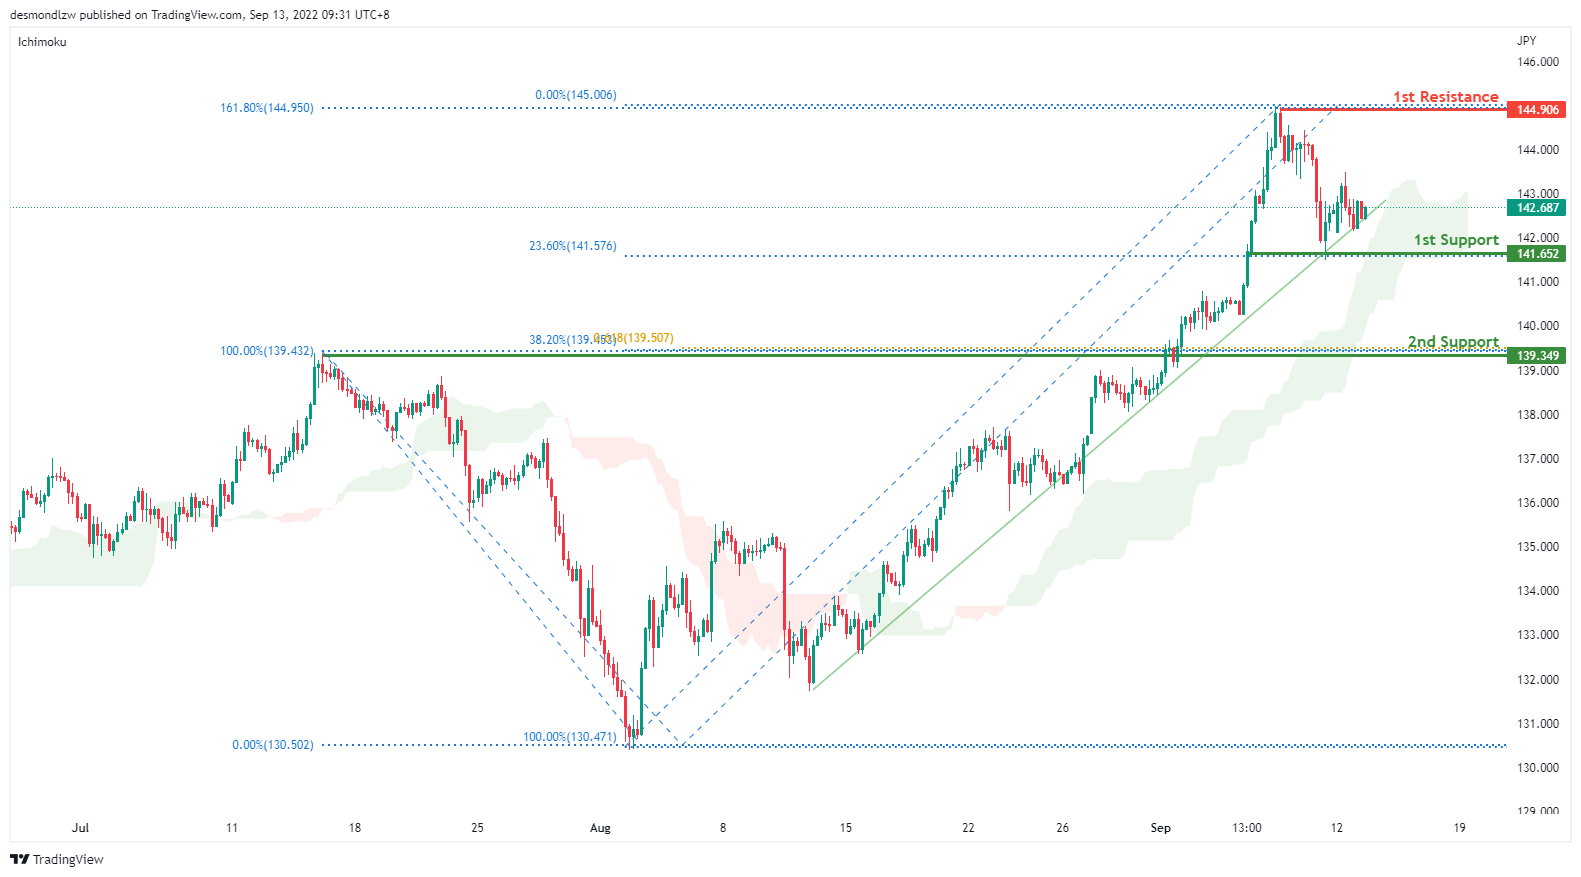
On the H4 chart, price is still respecting the ascending channel. We are still bullish bias- Price is currently testing along the trend line. If price continues with the bullish momentum, it should bring price to first resistance at 144.906 first where the 161.8% extension sits. Alternatively it could pull back to the first support at 141.652 where the 23.6% retracement sits then to the second support at 139.349 where the 38.2% retracement and overlapping support sits.
Areas of consideration:
- H4 time frame, 1st resistance at 144.906
- H4 time frame, 1st support at 141.652
DXY:
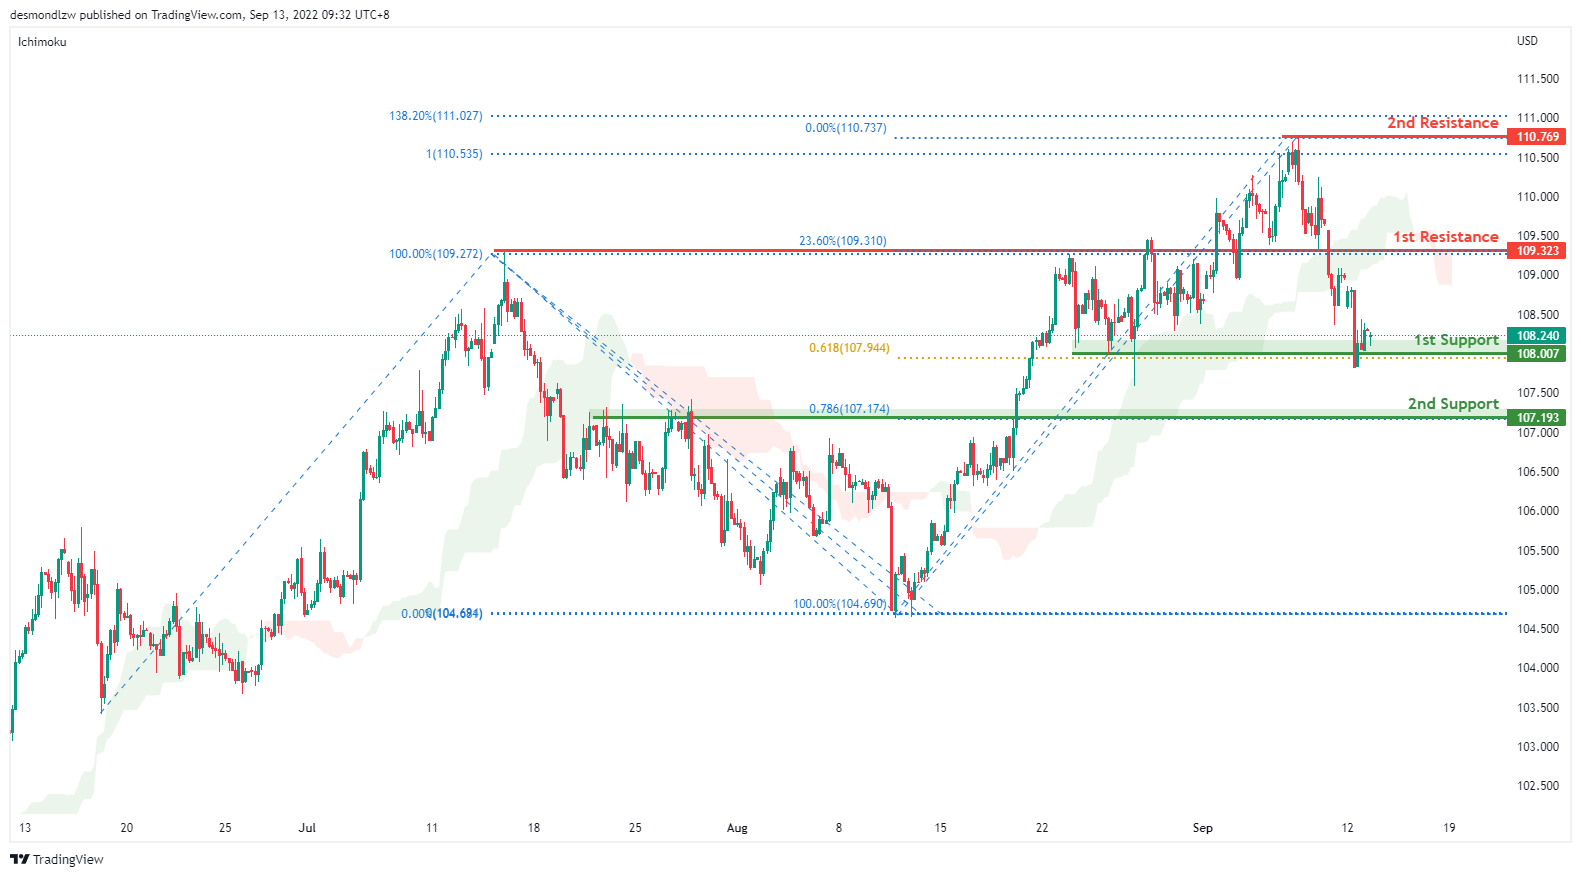
On the H4, prices have broken the ascending trend, we are bearish bias. Price has pulled back and is testing the first support at 108.007 where the 61.8% projection and previous swing low sits. If bearish momentum continues, it should bring price to the second support at 107.193 where the 78.6% projection sits. Alternatively, if price reverses from the first support, it should test first resistance at 109.323 where the 23.6% retracement sits and subsequently the second resistance at 110.769 where the previous swing high sits.
Areas of consideration:
- H4 time frame, 1st resistance at 109.323
- H4 time frame, 1st support at 108.007
EUR/USD:
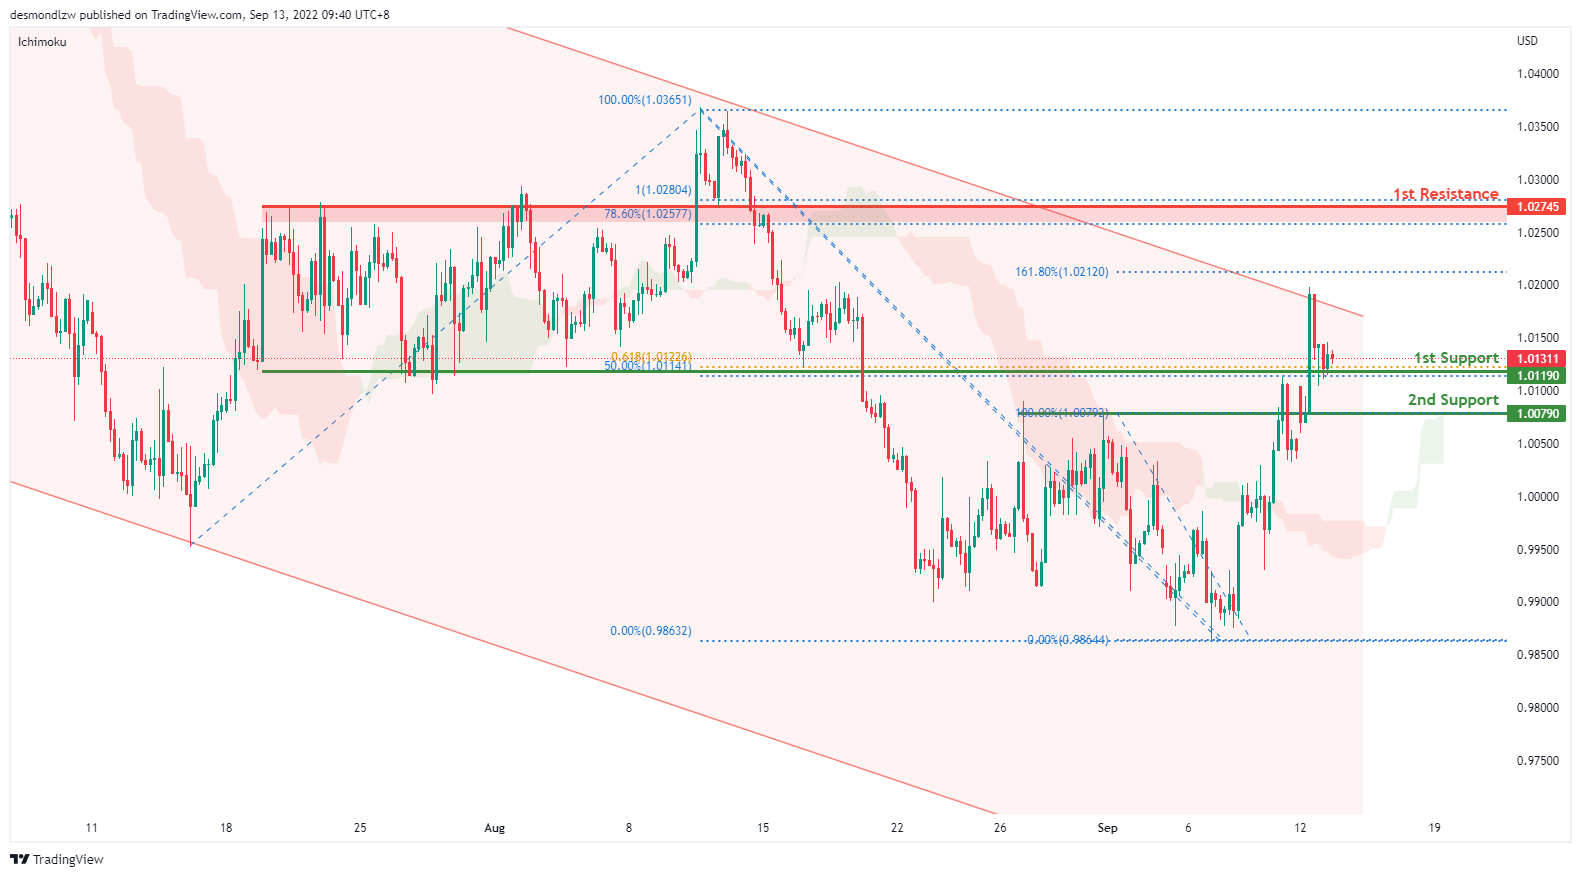
On the H4, price is moving in an ascending manner signalling bullish momentum – we are bullish bias. Price seems like it’s testing the first support at 1.0119 where the 50% retracement and 61.8% projection sits. If bullish momentum continues, it should bring price to the first resistance at 1.0274 where the 78.6% retracement and 100% projection sits. Alternatively, if price pulls back and breaks the first support, it should test the second support at 1.0079 levels where the overlapping support and previous swing high sits
Areas of consideration :
- H4 1st resistance at 1.0224
- H4 1st support at 1.0119
GBP/USD:
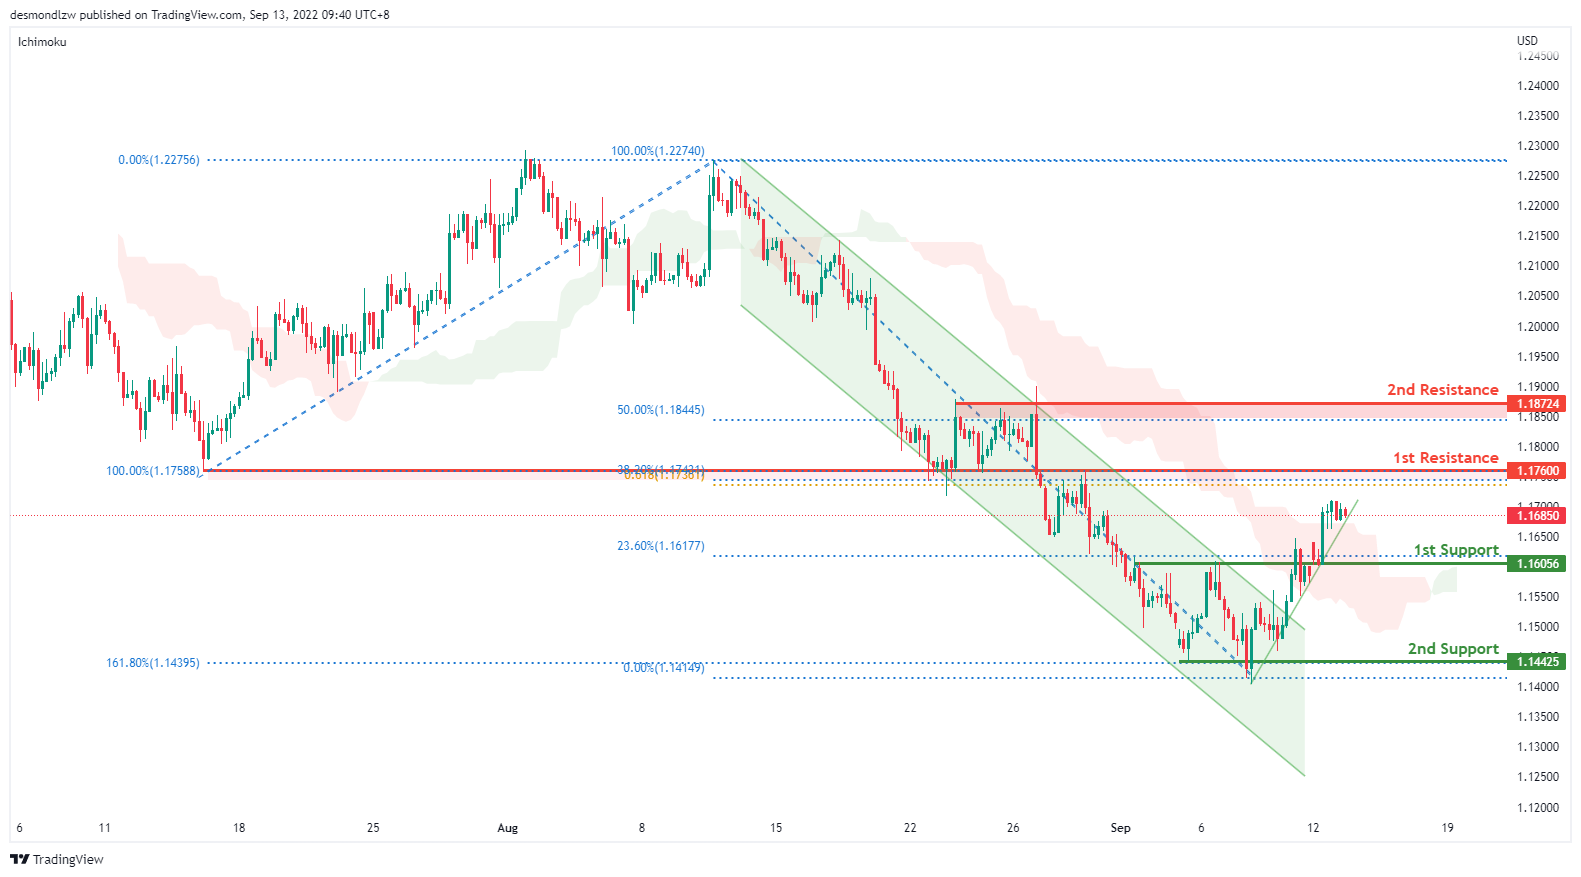
On the H4, prices have broken the descending channel and are moving in a bullish momentum- we are bullish biassed. Prices seem to be moving toward the first resistance at 1.1760 where the 38.2% retracement and 61.8% projection sits. If bullish momentum continues, it should bring prices to the second resistance at 1.1872 levels where the 50% retracement sits. Alternatively, if it fails to break the first resistance, it might look to test the first support at 1.1605 where the 23.6% retracement and overlapping support sits then the second support at 1.1442 where the 161.8% extension sits
Areas of consideration:
- H4 1st resistance at 1.1760
- H4 1st support at 1.1605
USD/CHF:
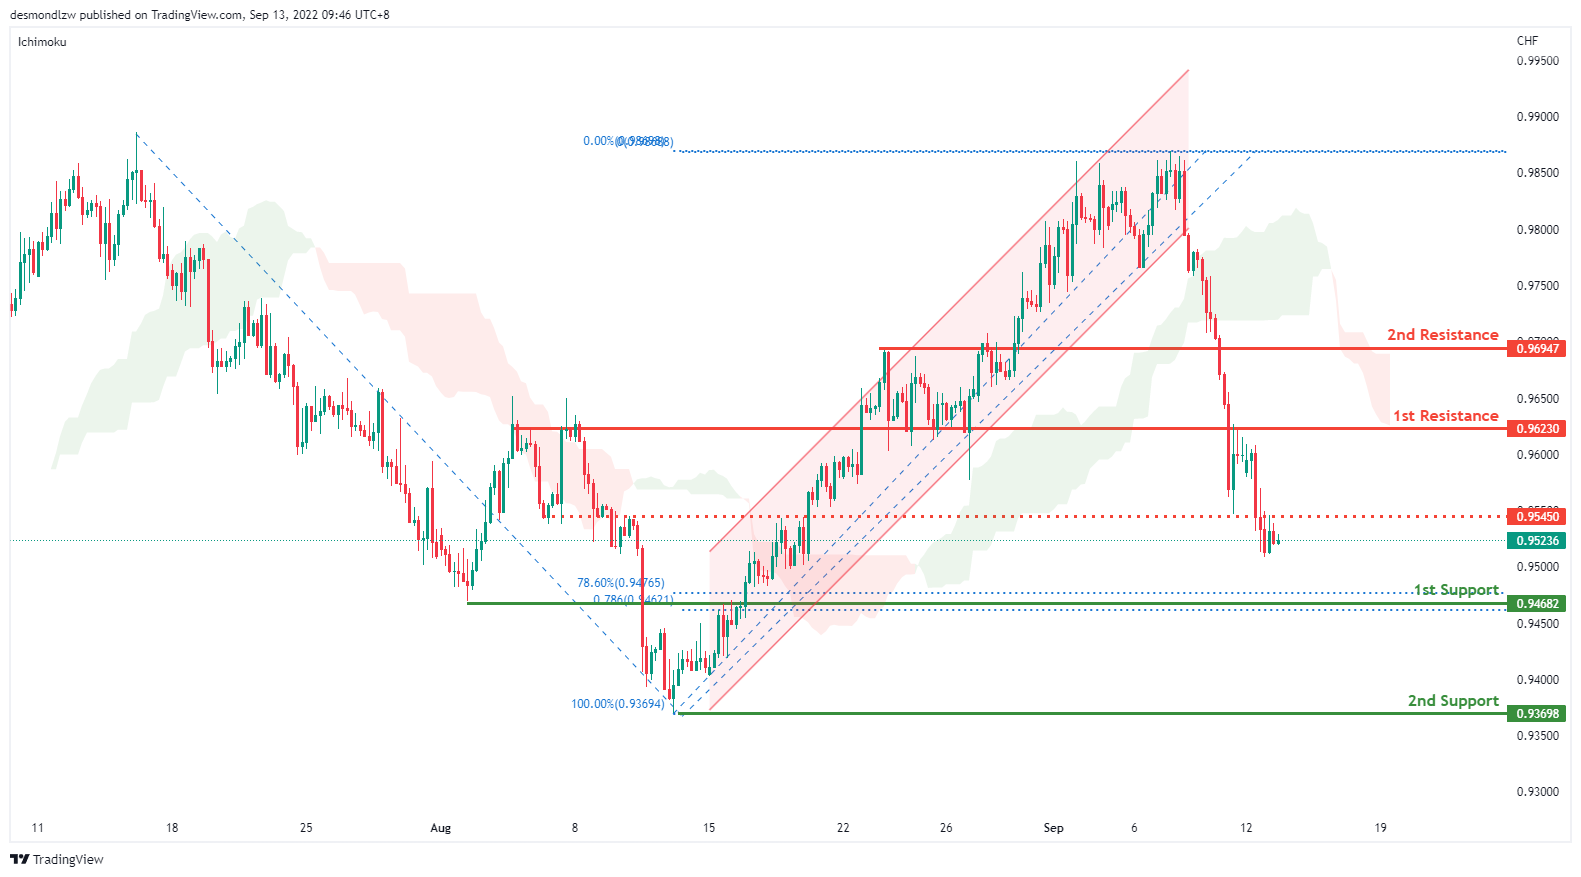
On the H4, prices have broken the ascending channel and we are currently bearish bias. Price is moving toward the first support around the 0.9468 levels where the 78.6% retracement and 78.6% projection sits. If bearish momentum continues, it should bring prices to the second support at 0.9369 levels where the swing low sits. Alternatively, price could pull back to test the first resistance at 0.9623 where the overlapping resistance and 50% retracement sit and then second resistance at 0.9694 where the 38.2% retracement sits
Areas of consideration
- H4 1st support at 0.9468
- H4 1st resistance at 0.9623
XAU/USD (GOLD):
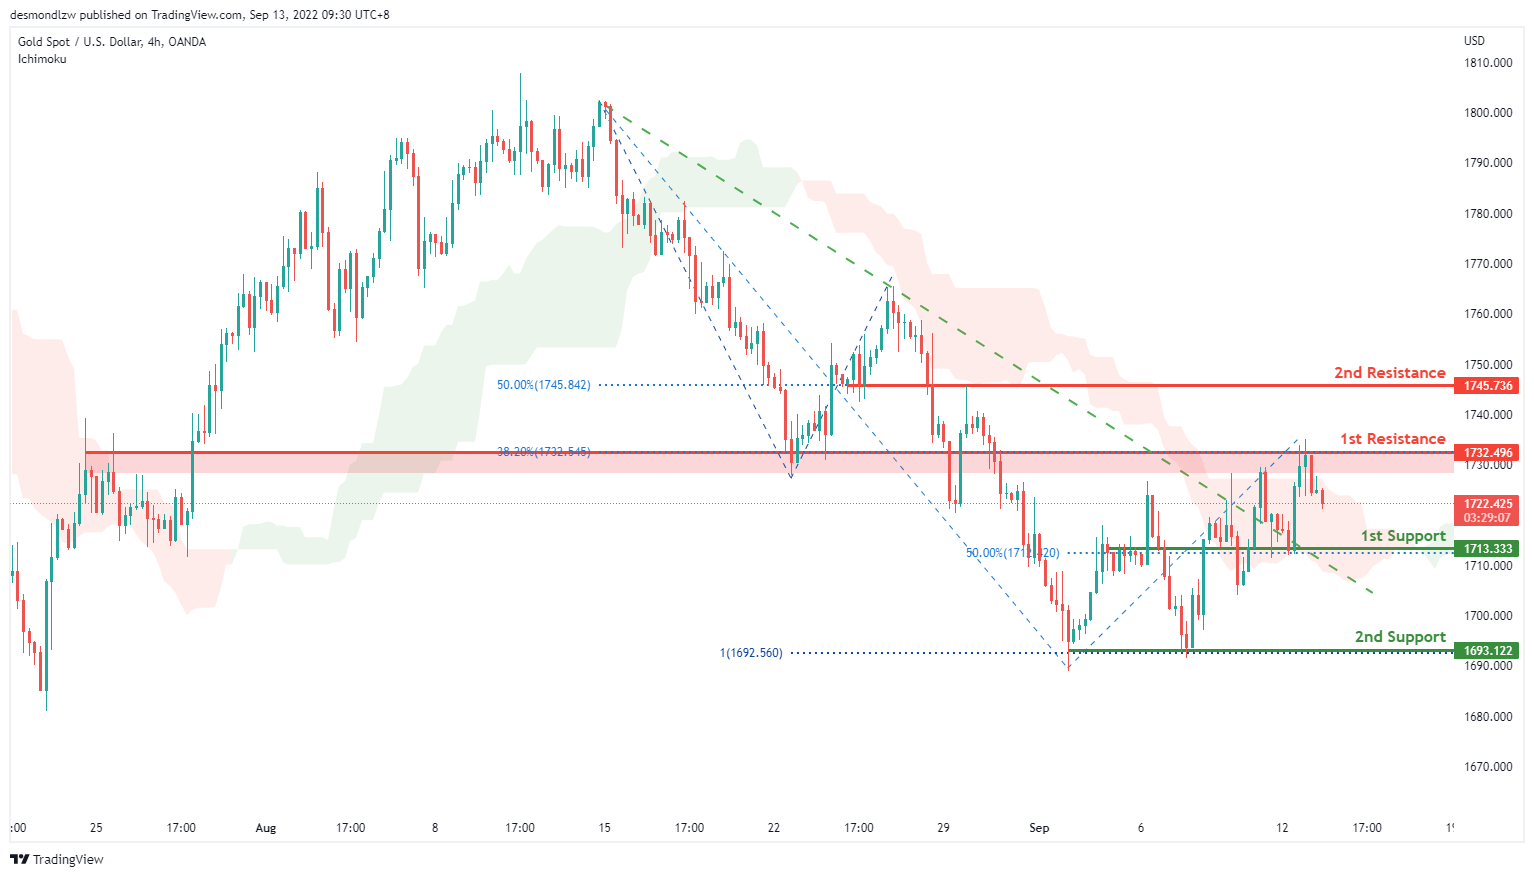
On the H4, with the price below ichimoku cloud, and dropping from the 1st resistance, we have a bearish bias that the price may drop to the 1st support at 1713.333, which is in line with the 50% fibonacci retracement and overlap support. If the price can break this level, the 2nd support could be at 1693.122, where the swing low and 100% fibonacci projection. Alternatively, the price may retest the 1st resistance at 1732.496, which is in line with the overlap resistance and 38% fibonacci retracement. If the price can break the 1st resistance, the 2nd resistance could be at 1745.736, where the 50% fibonacci retracement and overlap resistance are.
Areas of consideration:
- H4 time frame, 1st resistance at 1732.496
- H4 time frame, 1st support at 1713.333
AUD/USD:
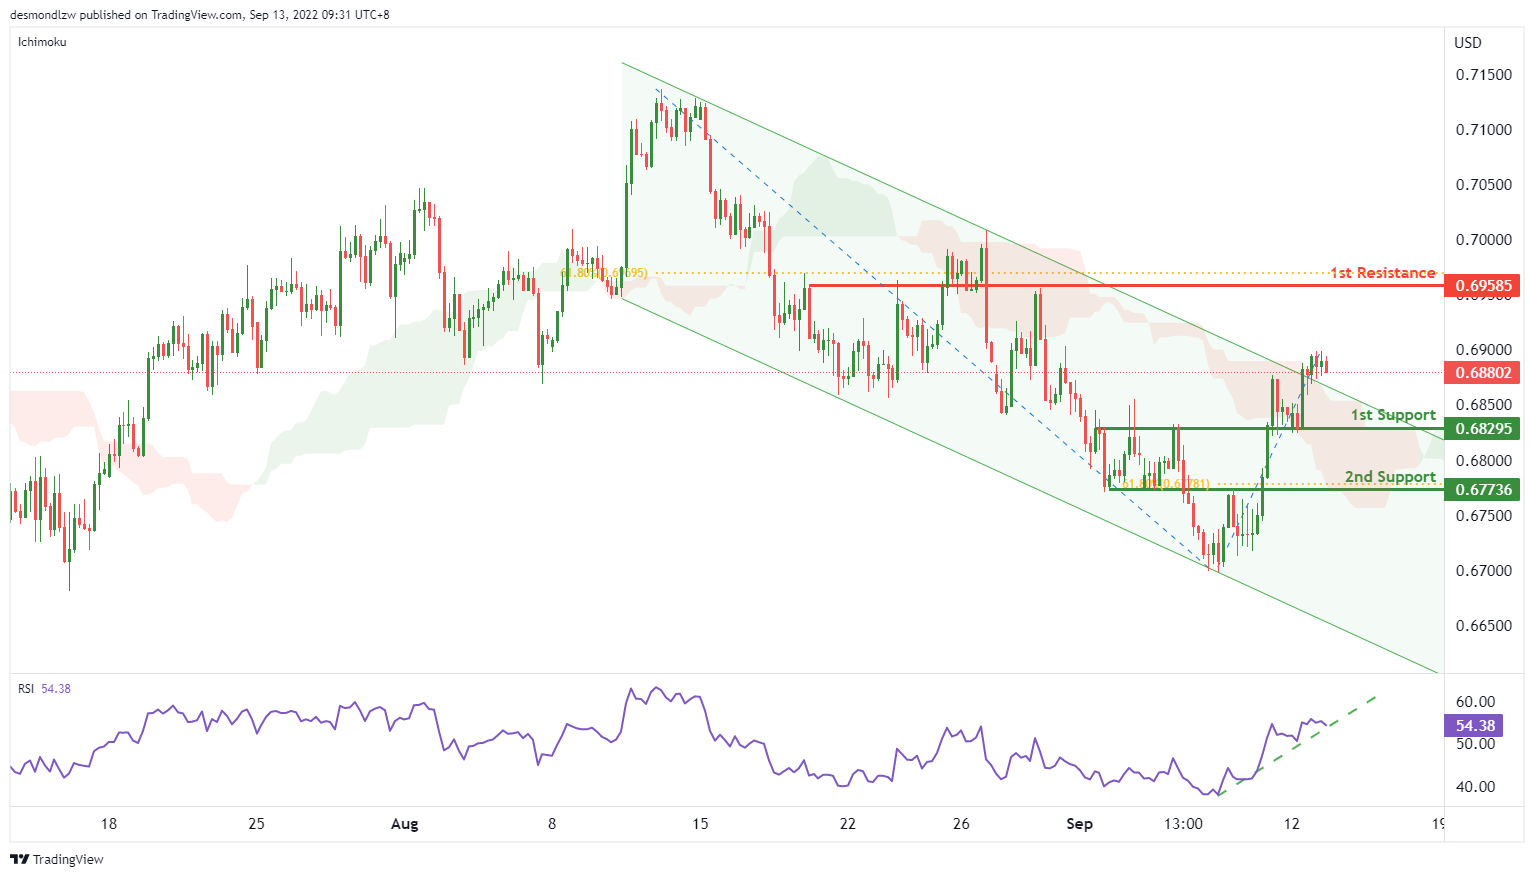
On the H4, with the price breaking the descending channel, ichimoku cloud and RSI is showing the ascending trend, we have a bullish bias that the price may rise to the 1st resistance at 0.69585, which is in line with the 61.8% fibonacci retracement and overlap resistance. Alternatively, the price may drop to the 1st support at 0.68295, which is in line with the overlap support. If this support level is broken, the next support level could be at 0.67736, where the swing lows and 61.8% fibonacci retracement are.
Areas of consideration
- H4 1st support at 0.68295
- H4 1st resistance at 0.69585
NZD/USD:
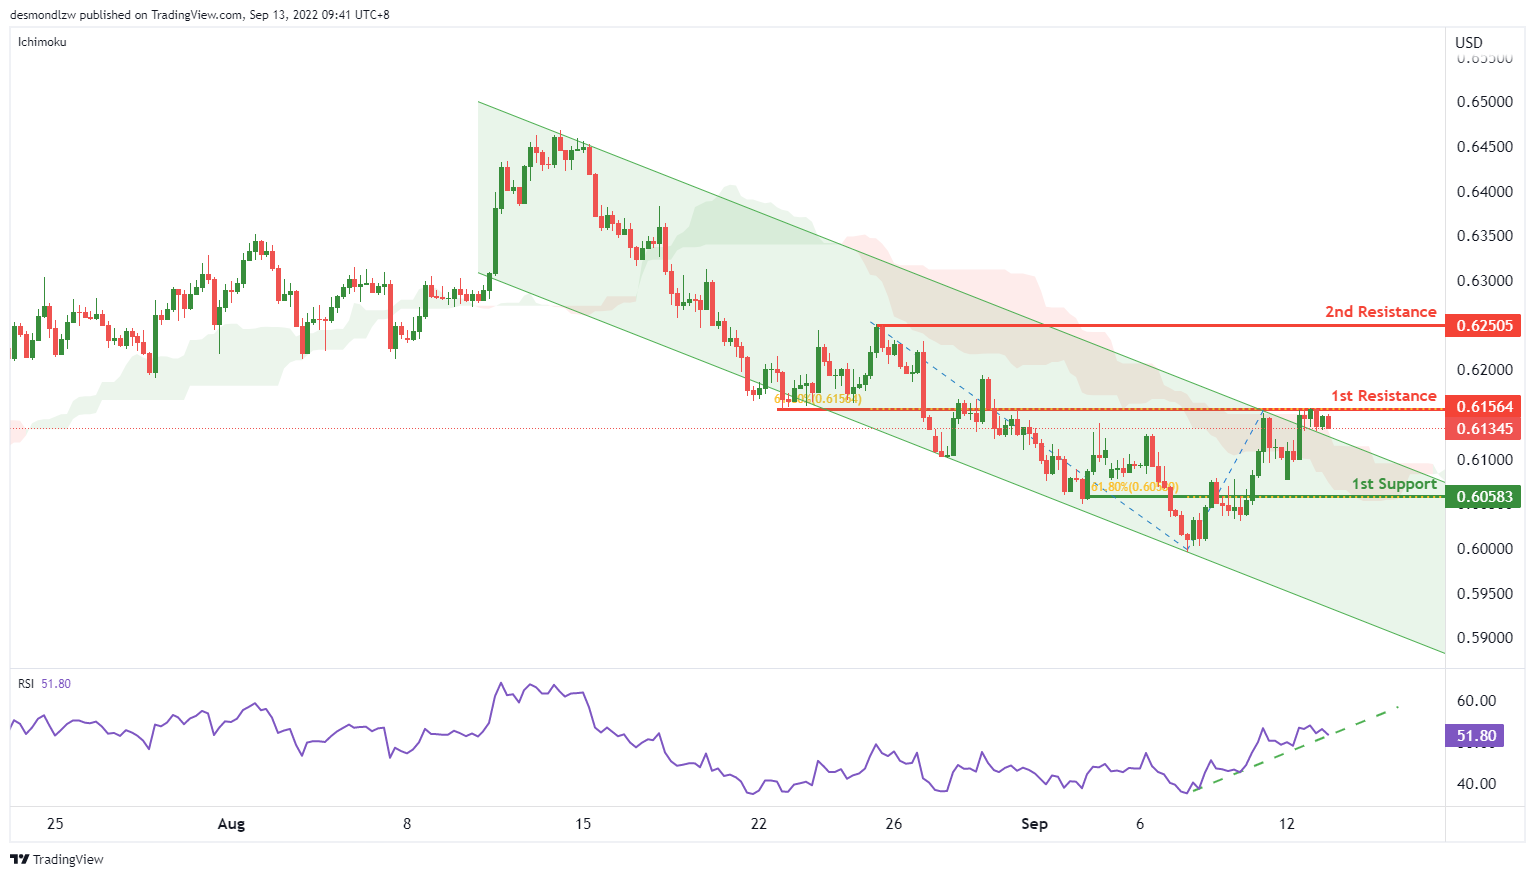
On the H4, with the price breaking the descending channel, ichimoku cloud and RSI is showing a ascending trend, we have a weak bullish bias that the price may test the 1st resistance at 0.61564, which is in line with the 61.8% fibonacci retracement and overlap resistance. If the price can break the 1st resistance, the 2nd resistance could be at 0.62505, which is in line with the wing high. Alternatively, the price may drop to the 1st support at 0.60583, which is in line with the 61.8% fibonacci retracement.
Areas of consideration:
- H4 time frame, 1st resistance at 0.61564,
- H4 time frame, 2nd resistance at 0.62505
USD/CAD:
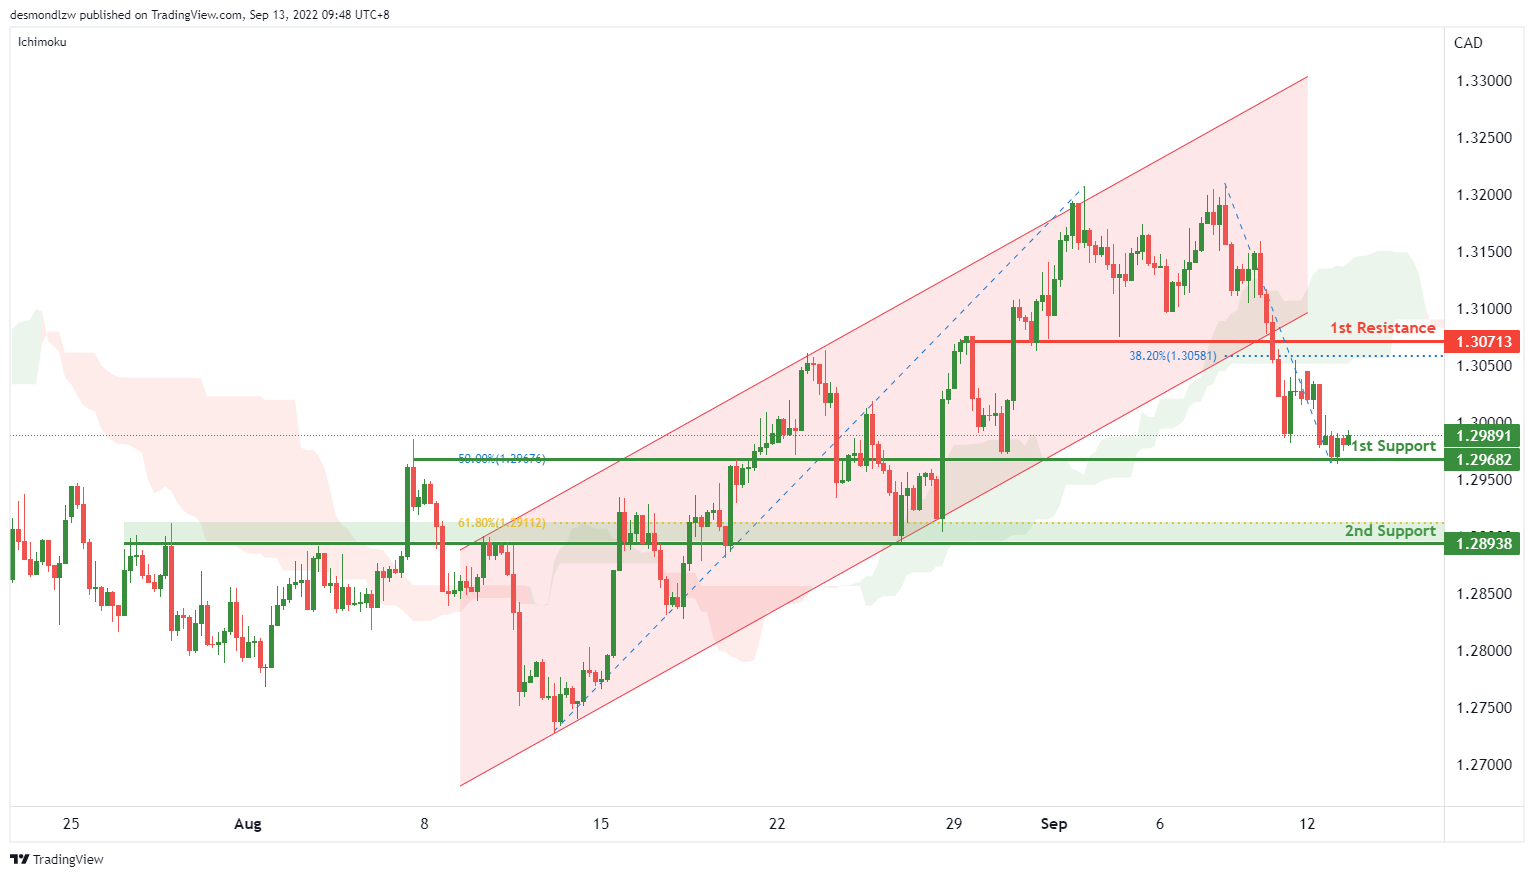
On the H4, with the price breaking the ascending channel, below the ichimoku cloud, and there’s a possible “double top” pattern, we have a bearish bias that the price may drop to the 1st support at 1.29682, which is in line with the overlap support and 50% fibonacci retracement. If the 1st support is broken, the 2nd support could be at 1.28938, where the overlap support and 61.8% fibonacci retracement are. Alternatively, the price may rise to the 1st resistance at 1.30713, where the “neckline” of the “double top” pattern and 38.2% fibonacci retracement are.
Areas of consideration:
- H4 time frame, 1st support at 1.29682
- H4 time frame, 2nd support at 1.28938
OIL:
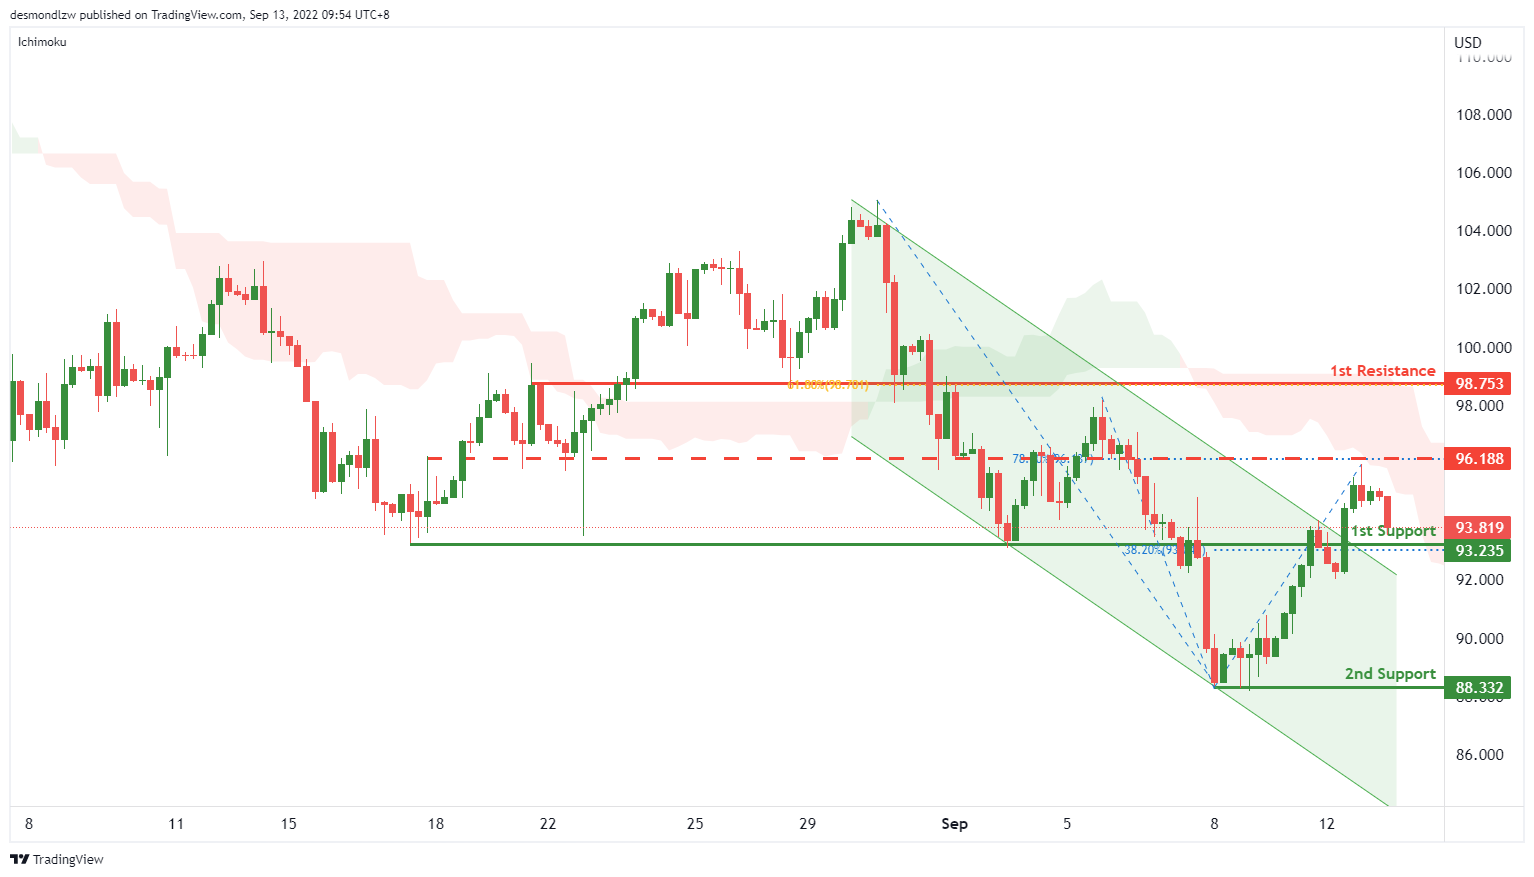
On the H4, with price below ichimoku and dropping from the intermediate resistance, we have a bearish bias that the price may drop to the 1st support at 93.235, where the overlap resistance and 38.2% fibonacci retracement are. If the price can break this resistance level, the next support level could be at 88.332, which is in line with the swing low. Alternatively, the price may rise to the 1st resistance at 98.753, which is in line with the 61.8% fibonacci retracement and overlap resistance. Take note the intermediate resistance could be at 96.188, which is in line with the 78.6% fibonacci retracement.
Areas of consideration:
- H4 time frame, 1st support at 93.235
- H4 time frame, 2nd support at 88.332
Dow Jones Industrial Average:
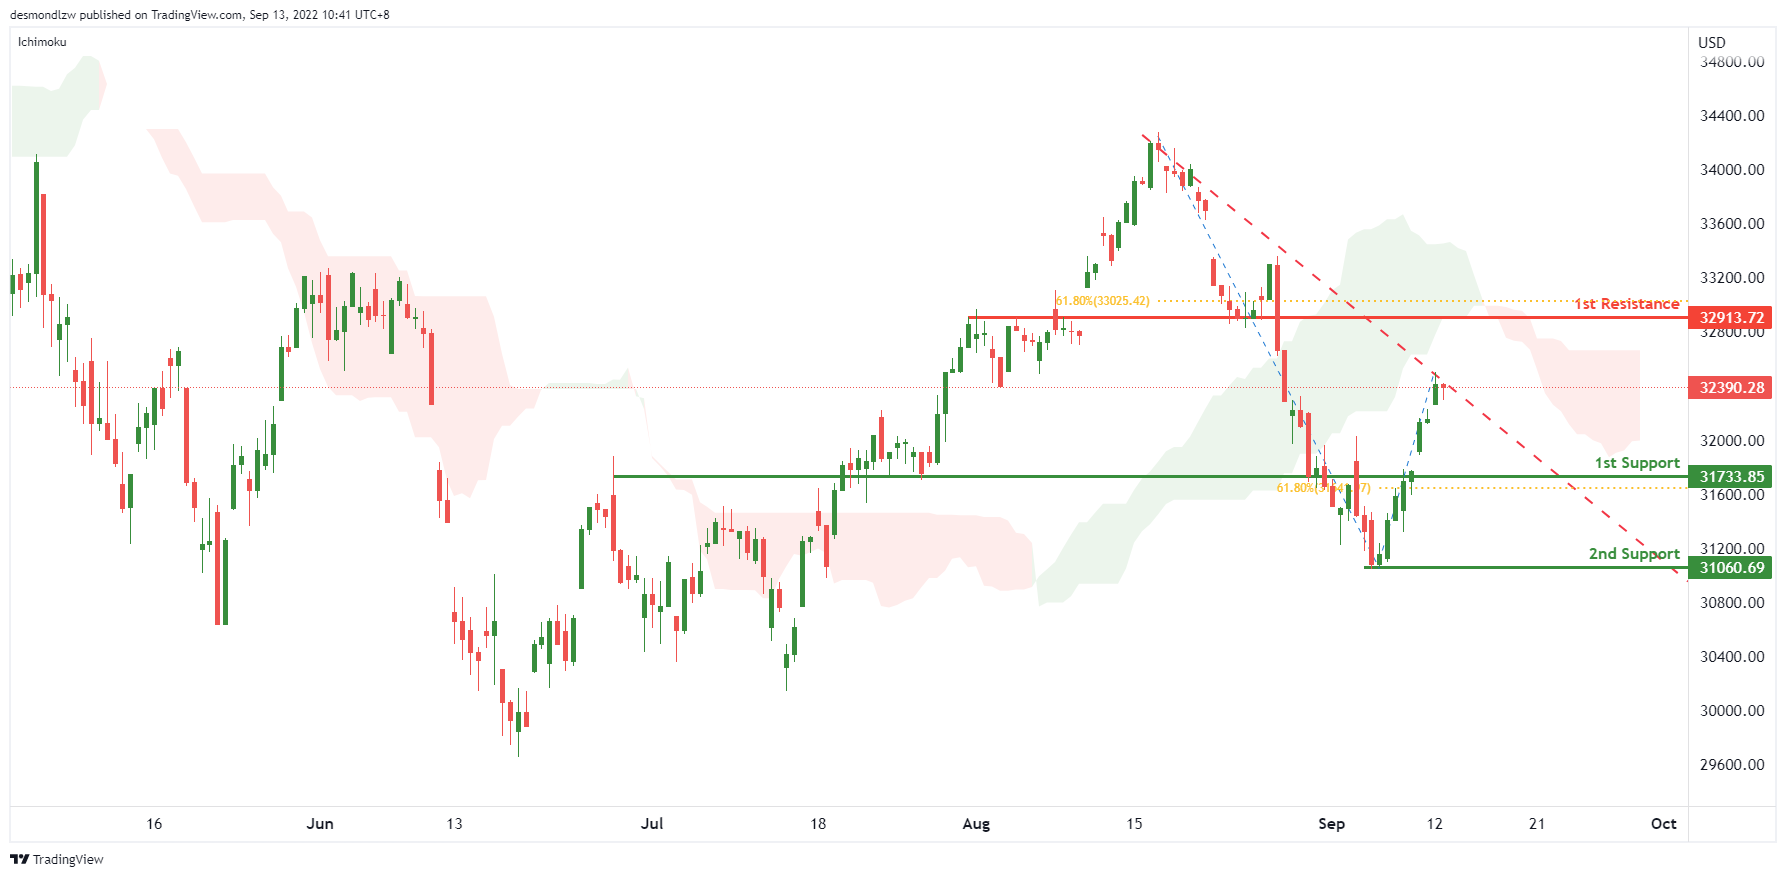
On the H4, with price moving within the descending trendline and below ichimoku cloud, we have a bearish bias that the price may drop to the 1st support at 31733.85, where the overlap support and 61.8% fibonacci retracement are . If the 1st support is broken, the 2nd support could be at 31060.69, which is in line with the swing low. Alternatively, the price may break the descending trendline and rise to the 1st resistance at 32913.72, which is in line with the overlap resistance and 61.8% fibonacci retracement.
Areas of consideration:
- H4 time frame, 1st support at 31733.85
- H4 time frame, 2nd support at 31060.69
DAX:
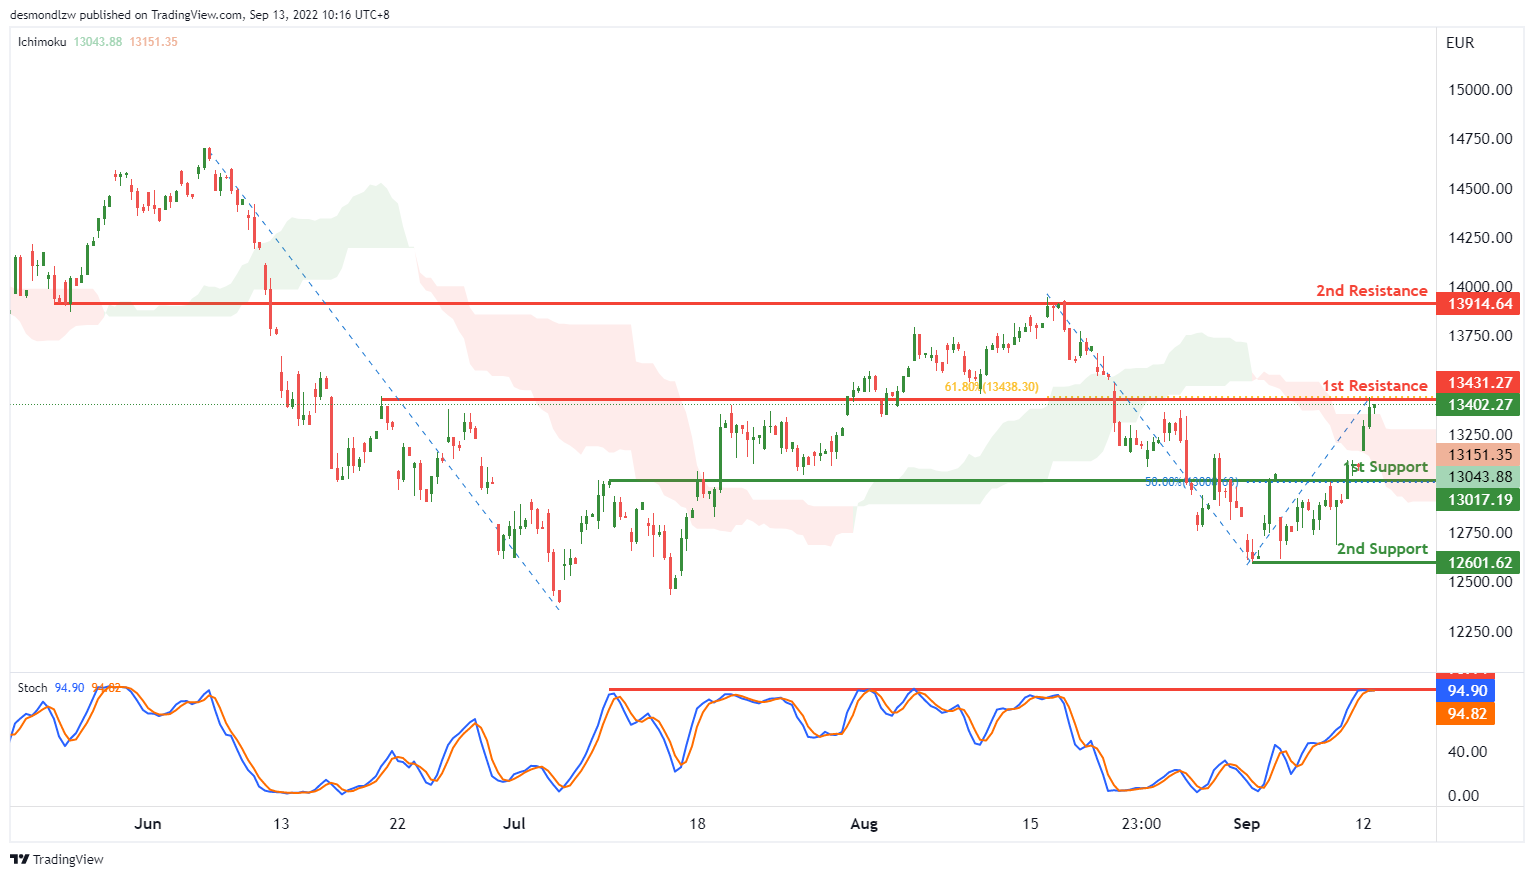
On the H4, with price moving above the ichimoku indicator, we have a weak bullish bias that the price may test the 1st resistance at 13431.27, which is in line with the overlap resistance and 61.8% fibonacci retracement. If the price can break the 1st resistance successfully, the next resistance could be at 13914.64, where the overlap resistance and swing high are. Alternatively, as the Stoch is reaching the resistance, the price may drop to the 1st support at 13017.19, where the 50% fibonacci retracement is. If the 1st support is broken, the 2nd support could be at 12601.62, where the swing low is.
Areas of consideration:
- H4 time frame, 1st resistance at 13431.27
- H4 time frame, 2nd resistance at 13914.64
ETHUSD:
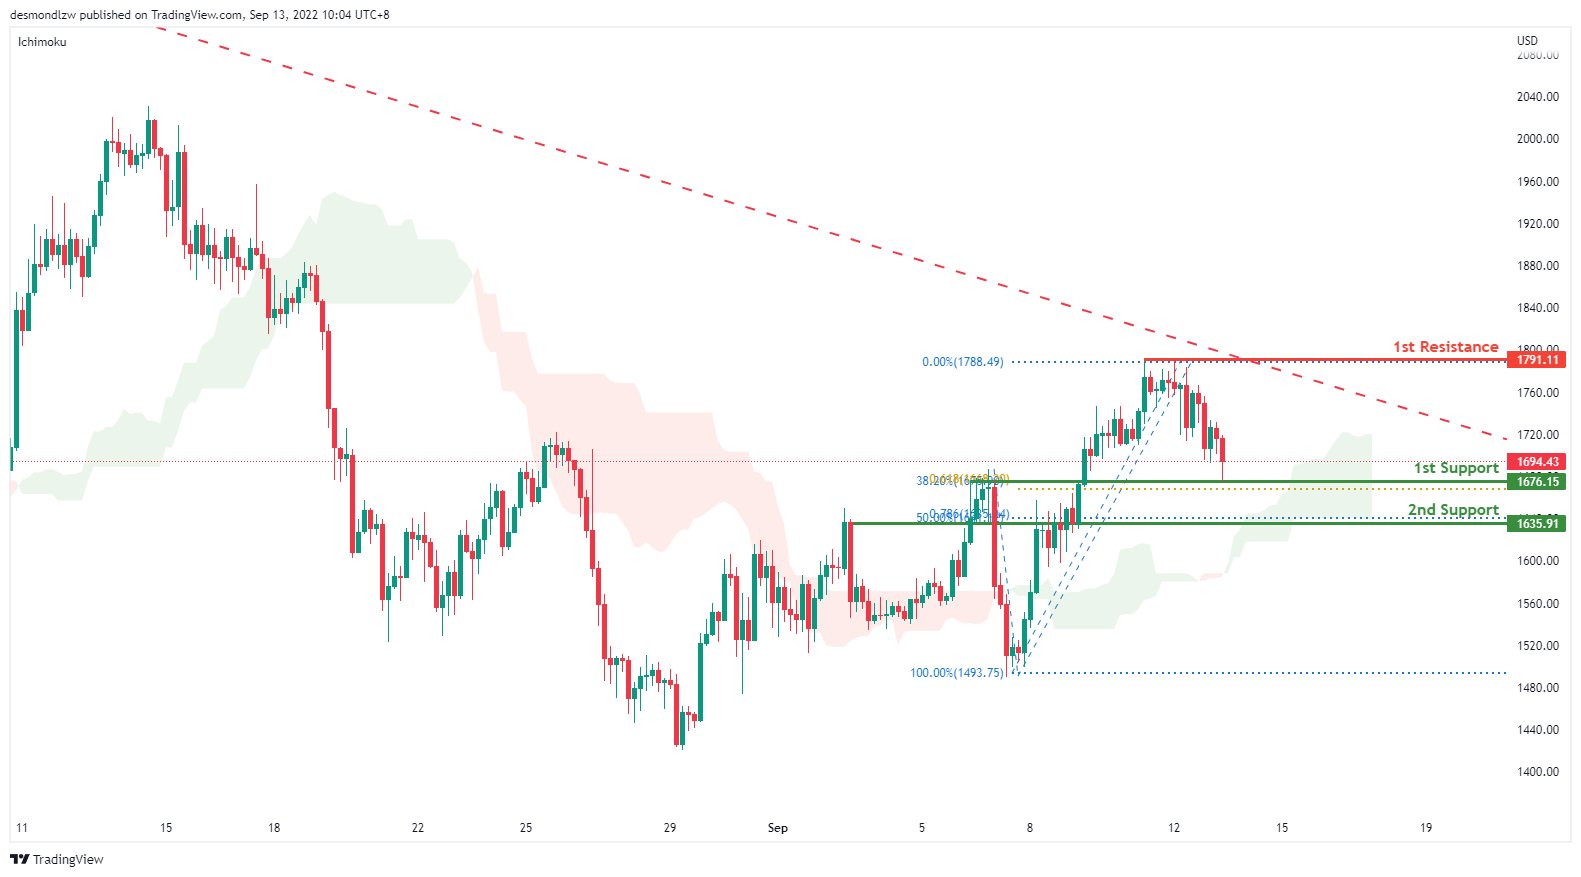
On the H4, with price moving above the ichimoku indicator, we have a bullish bias that price will rise to 1st resistance at 1791.11 where the 61.8% fibonacci retracement sits. Price is currently testing the first support at 1676.15 where the 38.2% retracement and 61.8% projection sits. If price were to break first support, it will bring it to the second support at 1635.91 where the 50% retracement and 78.6% projection sits
Areas of consideration:
- H4 time frame, 1st resistance of 1791.11
- H4 time frame, 1st support at 1676.15
BTCUSD:
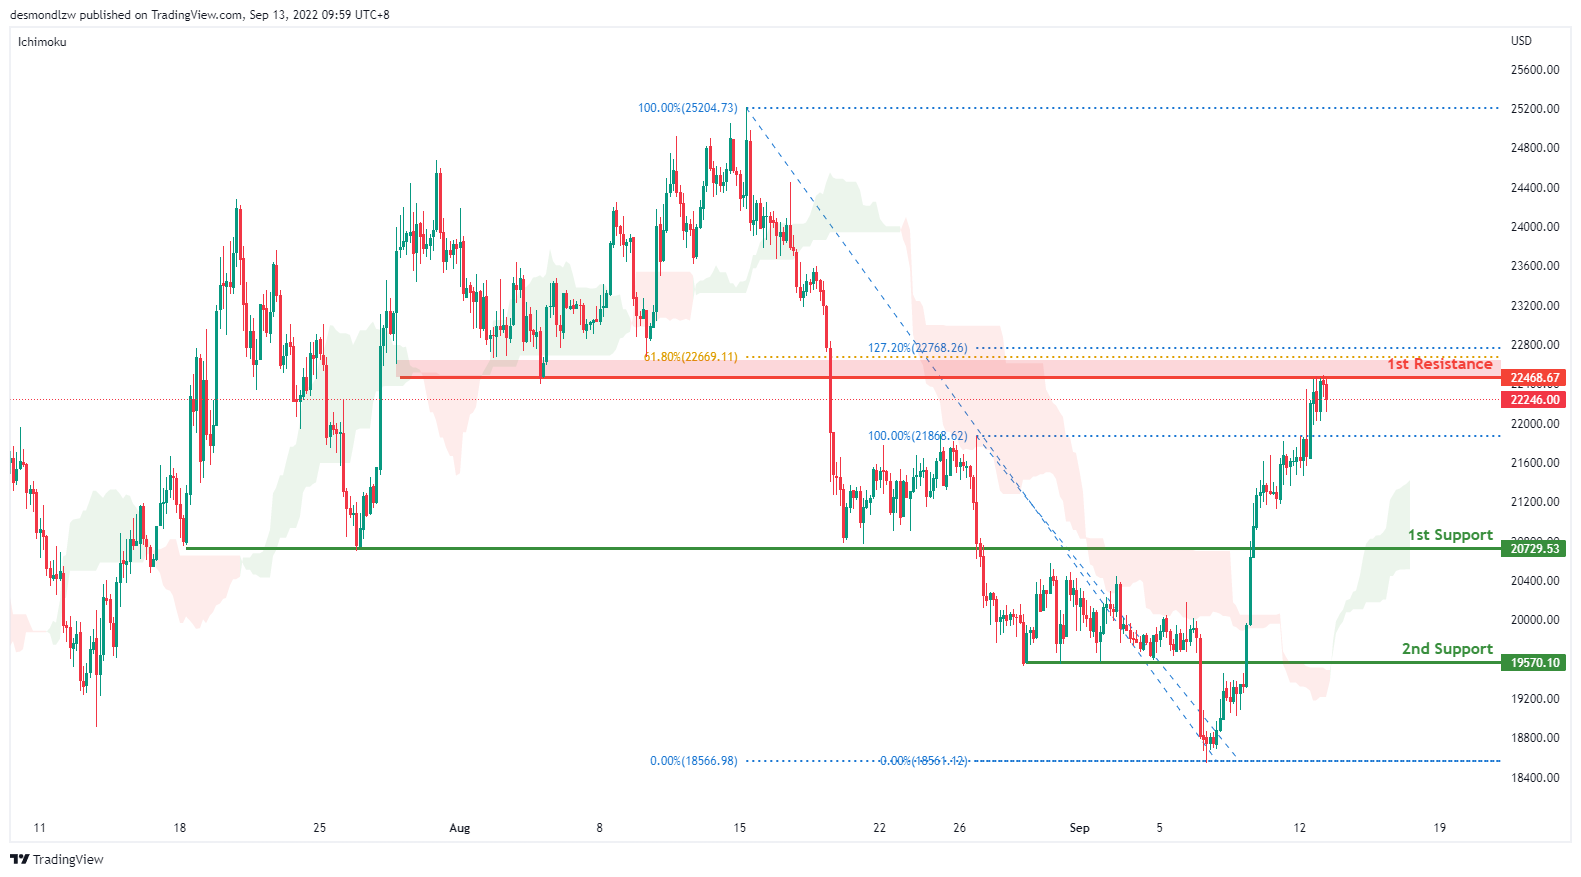
On the H4, with price breaking out of a descending channel and moving above the ichimoku indicator, we are bullish bias- that is testing the 1st resistance at 22468.67 where the pullback resistance and 61.8% fibonacci retracement sits. Alternatively, price could pull back to the first support at 20729.53 where the previous swing low sits and then the second support at 19570.10 levels
Areas of consideration:
- H4 time frame, 1st resistance of 22468.67
- H4 time frame, 1st support at 20729.53
S&P 500:
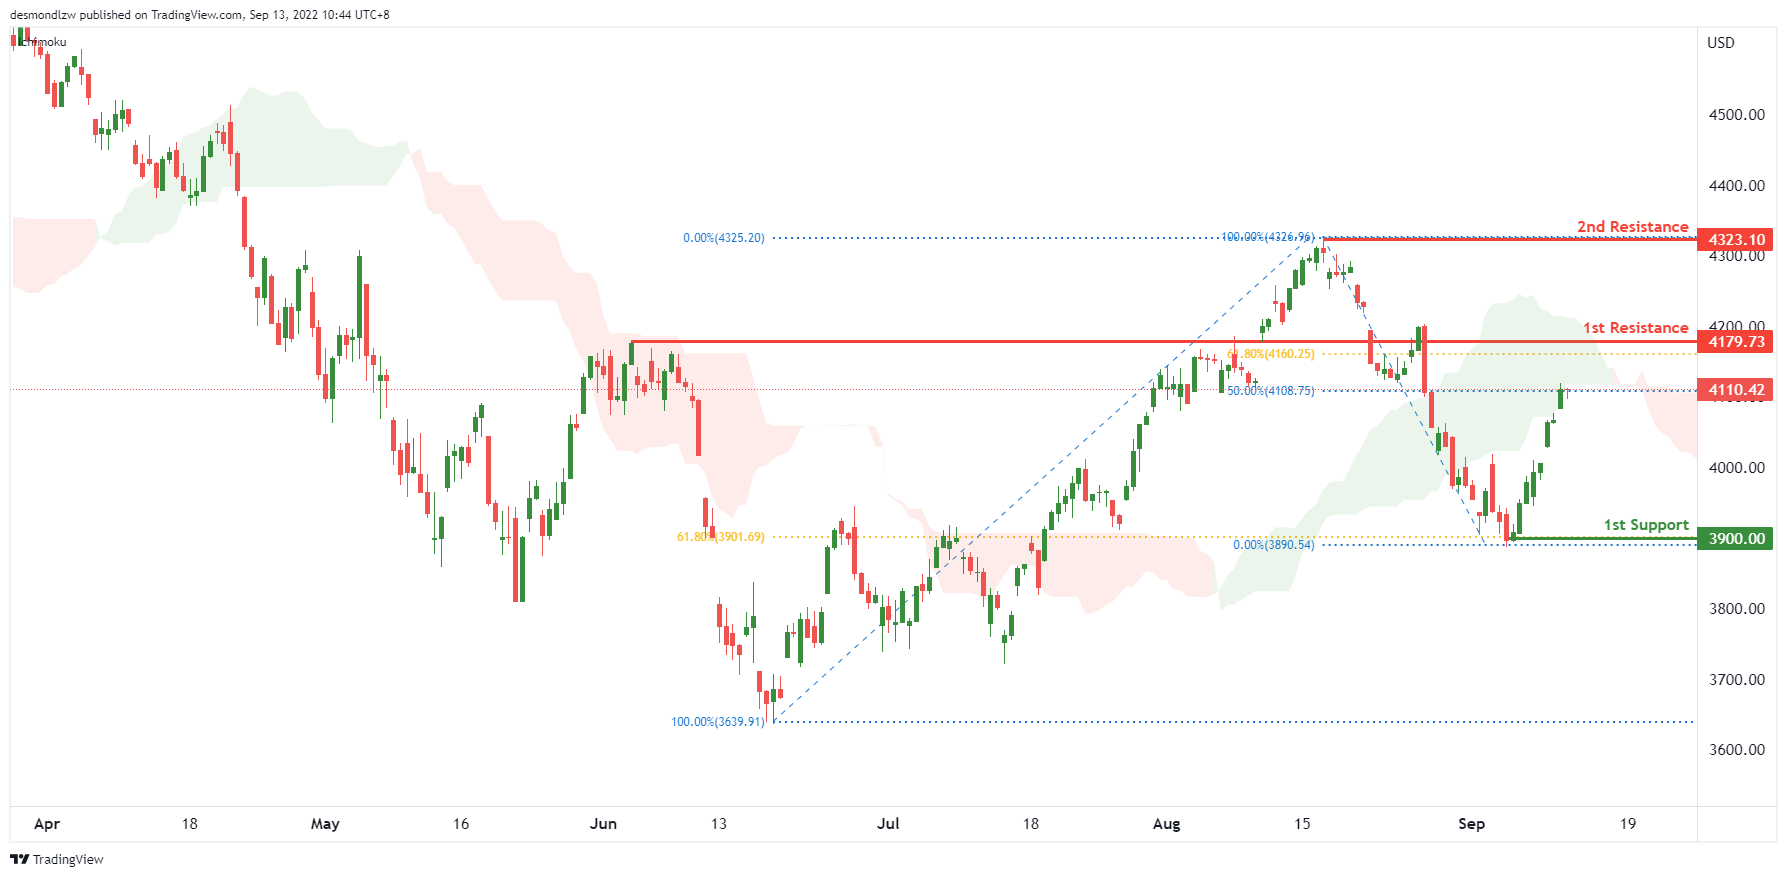
On the H4, price bounced from the 3900 support level earlier and is climbing steadily towards the 1st resistance of 4179. With price moving below the ichimoku indicator, our bearish bias is still valid, while looking for price to drop from the pullback resistance of 61.8% fibonacci retracement. If price rejects the resistance level, price could fall towards the 1st support of 3900 where the pullback support is. Alternatively, price could break 1st resistance structure and rise to 2nd resistance and pullback resistance of 4323.10.
Areas of consideration:
- H4 time frame, 1st resistance of 4179.73
- H4 time frame, 1st support at 3900
GBP/USD Daily Outlook
Daily Pivots: (S1) 1.1618; (P) 1.1665; (R1) 1.1728; More...
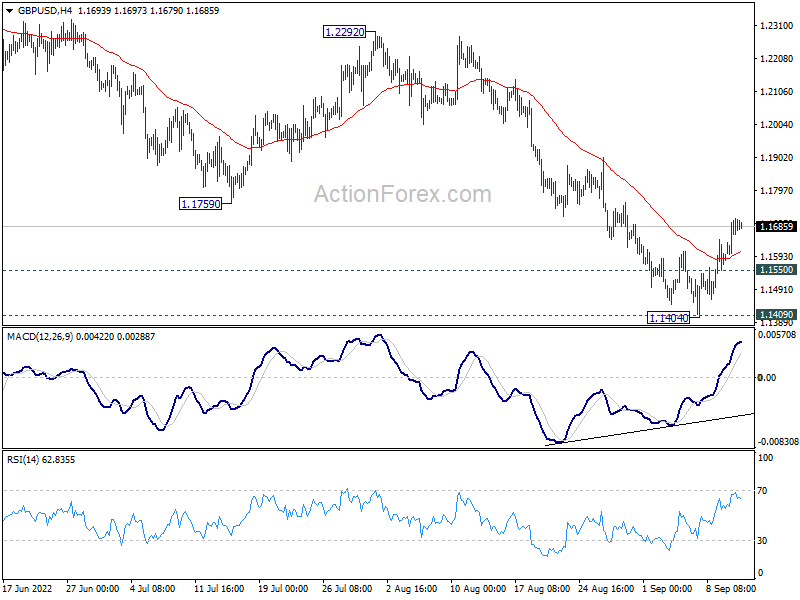
GBP/USD's rebound from 1.1404 short term bottom is in progress. Intraday bias stays on the upside for 55 day EMA (now at 1.1924). On the downside, below 1.1550 minor support will turn bias back to the downside. Decisive break of 1.1409 will resume larger down trend.
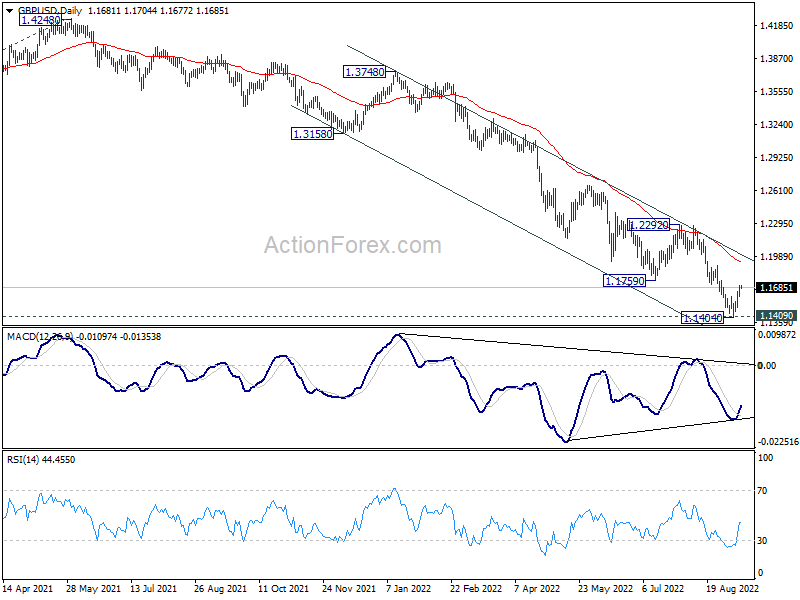
In the bigger picture, based on current momentum, fall from 1.4248 (2018 high) is probably resuming long term down trend from 2.1161 (2007 high). Sustained break of 1.1409 will target 61.8% projection of 1.7190 (2014 high) to 1.1409 (2020 low) from 1.4248 (2021 high) at 1.0675. This will remain the favored case for now as long as 1.2292 resistance holds.
Dollar and Yen Soft as US CPI Awaited
Dollar and Yen are staying as the weakest ones for the week as focus turns to US inflation data. European majors are the strongest ones so far, even though Euro's rise is losing some momentum. Commodity currencies are mixed for now, despite improving risk sentiment.
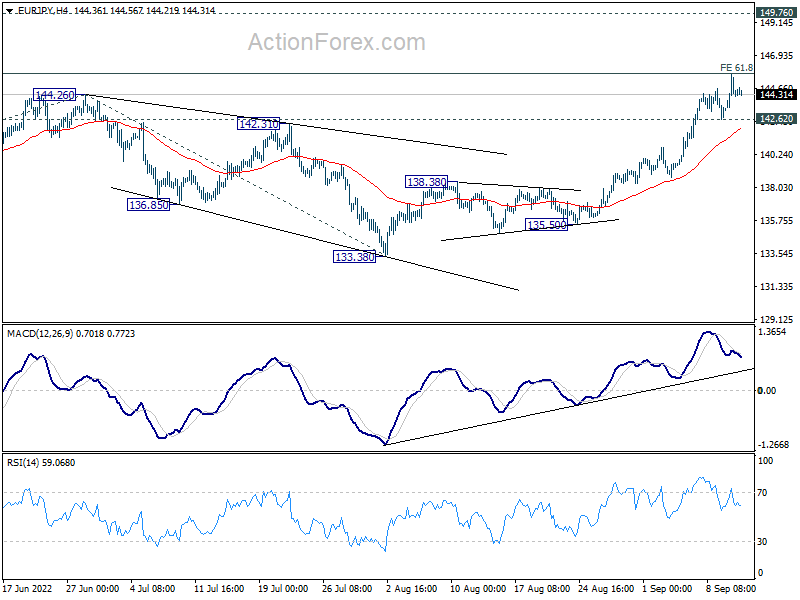
Technically, EUR/JPY's rally is slowing ahead of 61.8% projection of 124.37 to 144.26 from 133.38 at 145.67. For now, further rally is expected as long as 142.62 minor support holds. Firm break of 145.67 will pave the way to 149.76 long term resistance (2015 high). The next move could come as reaction to US CPI today.
In Asia, at the time of writing, Nikkei is up 0.21%. Hong Kong HSI is up 0.48%. China Shanghai SSE is up 0.33%. Singapore Strait Times is up 0.45%. Japan 10-year JGB yield is down -0.0029 at 0.248. Overnight, DOW rose 0.71%. S&P 500 rose 1.06%. NASDAQ rose 1.27%. 10-year yield rose 0.041 to 3.362.
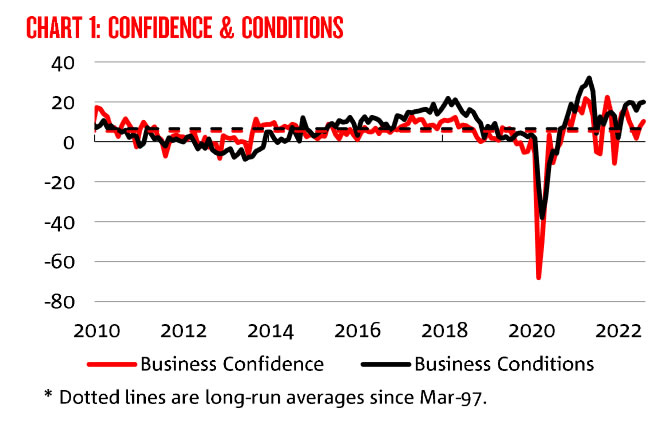
Australia NAB business confidence rose to 10, conditions rose to 20
Australia NAB business confidence improved from 8 to 10 in August. Business conditions rose from 19 to 20. Trading conditions rose from 26 to 30. Profitability conditions dropped from 18 to 16. Employment conditions also dropped from 18 to 16.
"The recent strength in business conditions carried into August," said NAB Group Chief Economist Alan Oster. "Official data for retail sales in July confirmed spending remained robust, as suggested by the previous survey, and today's release shows little sign that August was much different. Conditions are strong across most industries other than construction, where profitability remains a challenge."
"Confidence rose again in August, as did other forward indicators in the survey," said Oster. "Confidence took a hit around June as interest rates first began to rise but it seems that firms' initial concerns about the impact have eased and a more positive outlook is prevailing, at least for the time being."
US 10-year yield extending rally ahead of CPI
US consumer inflation data will catch all attention today. Headline CPI is expected to decline -0.1% mom in August, with annual rate slowed from 8.5% yoy to 8.1% yoy. On the other hand, core CPI is expected rise 0.3% mom, with annual rate accelerated from 5.9% yoy to 6.0% yoy.
Today's data is unlikely to alter Fed's decision on on September 21, where markets are pricing in 88% chance of another 75bps hike. While inflation is starting to slow, the decline in energy prices could free up some money for consumer to spend, which supports the economy. Fed's tightening will continue and there is a consensus that interest rate would reach 4% level by early next year.
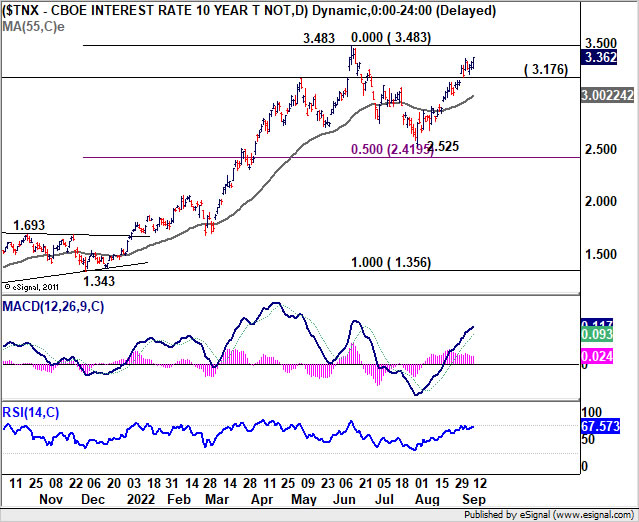
Regarding market reaction to the data, some attention will be on 10-year yield, which rose 0.041 to 3.362 overnight. Current rise form 2.525 is expected to continue as long as 3.176 support holds, to retest 3.483 high. Such development should give Yen crosses a lift in general. But the next big move would depend more on whether 3.483 could be taken out decisively, at a later stage.
Elsewhere
Japan PPI rose 9.0% yoy in August, above expectation of 8.9% yoy. BSI large manufacturing index rose from -9.9 to 1.7 in Q3, above expectation of -8.1.
UK employment, Germany CPI final and ZEW economic sentiment, Swiss PPI will be released in European session. Later in the day, US CPI is the main focus.
GBP/USD Daily Outlook
Daily Pivots: (S1) 1.1618; (P) 1.1665; (R1) 1.1728; More...
GBP/USD's rebound from 1.1404 short term bottom is in progress. Intraday bias stays on the upside for 55 day EMA (now at 1.1924). On the downside, below 1.1550 minor support will turn bias back to the downside. Decisive break of 1.1409 will resume larger down trend.
In the bigger picture, based on current momentum, fall from 1.4248 (2018 high) is probably resuming long term down trend from 2.1161 (2007 high). Sustained break of 1.1409 will target 61.8% projection of 1.7190 (2014 high) to 1.1409 (2020 low) from 1.4248 (2021 high) at 1.0675. This will remain the favored case for now as long as 1.2292 resistance holds.
Economic Indicators Update
| GMT | Ccy | Events | Actual | Forecast | Previous | Revised |
|---|---|---|---|---|---|---|
| 23:50 | JPY | PPI Y/Y Aug | 9.00% | 8.90% | 8.60% | 9.00% |
| 23:50 | JPY | BSI Large Manufacturing Index Q3 | 1.7 | -8.1 | -9.9 | |
| 01:30 | AUD | NAB Business Confidence Aug | 10 | 7 | 8 | |
| 01:30 | AUD | NAB Business Conditions Aug | 20 | 20 | 19 | |
| 06:00 | GBP | Claimant Count Change Aug | -9.2K | -10.5K | ||
| 06:00 | GBP | ILO Unemployment Rate (3M) Jul | 3.80% | 3.80% | ||
| 06:00 | GBP | Average Earnings Including Bonus 3M/Y Jul | 5.20% | 5.10% | ||
| 06:00 | GBP | Average Earnings Excluding Bonus 3M/Y Jul | 5.00% | 4.70% | ||
| 06:00 | EUR | Germany CPI M/M Aug F | 0.30% | 0.30% | ||
| 06:00 | EUR | Germany CPI Y/Y Aug F | 7.90% | 7.90% | ||
| 06:30 | CHF | Producer and Import Prices M/M Aug | 0.10% | -0.10% | ||
| 06:30 | CHF | Producer and Import Prices Y/Y Aug | 5.70% | 6.30% | ||
| 09:00 | EUR | Germany ZEW Economic Sentiment Sep | -60 | -55.3 | ||
| 09:00 | EUR | Germany ZEW Current Situation Sep | -50.5 | -47.6 | ||
| 09:00 | EUR | Eurozone ZEW Economic Sentiment Sep | -58.3 | -54.9 | ||
| 10:00 | USD | NFIB Business Optimism Index Aug | 90.6 | 89.9 | ||
| 12:30 | USD | CPI M/M Aug | -0.10% | 0.00% | ||
| 12:30 | USD | CPI Y/Y Aug | 8.10% | 8.50% | ||
| 12:30 | USD | CPI Core M/M Aug | 0.30% | 0.30% | ||
| 12:30 | USD | CPI Core Y/Y Aug | 6.00% | 5.90% |
US 10-year yield extending rally ahead of CPI
US consumer inflation data will catch all attention today. Headline CPI is expected to decline -0.1% mom in August, with annual rate slowed from 8.5% yoy to 8.1% yoy. On the other hand, core CPI is expected rise 0.3% mom, with annual rate accelerated from 5.9% yoy to 6.0% yoy.
Today's data is unlikely to alter Fed's decision on on September 21, where markets are pricing in 88% chance of another 75bps hike. While inflation is starting to slow, the decline in energy prices could free up some money for consumer to spend, which supports the economy. Fed's tightening will continue and there is a consensus that interest rate would reach 4% level by early next year.
Regarding market reaction to the data, some attention will be on 10-year yield, which rose 0.041 to 3.362 overnight. Current rise form 2.525 is expected to continue as long as 3.176 support holds, to retest 3.483 high. Such development should give Yen crosses a lift in general. But the next big move would depend more on whether 3.483 could be taken out decisively, at a later stage.
Australia NAB business confidence rose to 10, conditions rose to 20
Australia NAB business confidence improved from 8 to 10 in August. Business conditions rose from 19 to 20. Trading conditions rose from 26 to 30. Profitability conditions dropped from 18 to 16. Employment conditions also dropped from 18 to 16.
"The recent strength in business conditions carried into August," said NAB Group Chief Economist Alan Oster. "Official data for retail sales in July confirmed spending remained robust, as suggested by the previous survey, and today's release shows little sign that August was much different. Conditions are strong across most industries other than construction, where profitability remains a challenge."
"Confidence rose again in August, as did other forward indicators in the survey," said Oster. "Confidence took a hit around June as interest rates first began to rise but it seems that firms' initial concerns about the impact have eased and a more positive outlook is prevailing, at least for the time being."
GBP/USD Clears Barrier, 1.1820 Presents Resistance
Key Highlights
- GBP/USD started an upside correction above the 1.1650 resistance.
- It broke a major bearish trend line at 1.1580 on the 4-hours chart.
- The UK Claimant count could change -9.2K in August 2022.
- The US CPI might rise 8.1% in August 2022 (YoY), down from 8.5%.
GBP/USD Technical Analysis
The British Pound started a steady recovery wave from the 1.1405 low against the US Dollar. GBP/USD cleared the 1.1500 and 1.1550 resistance levels to gain bullish momentum.
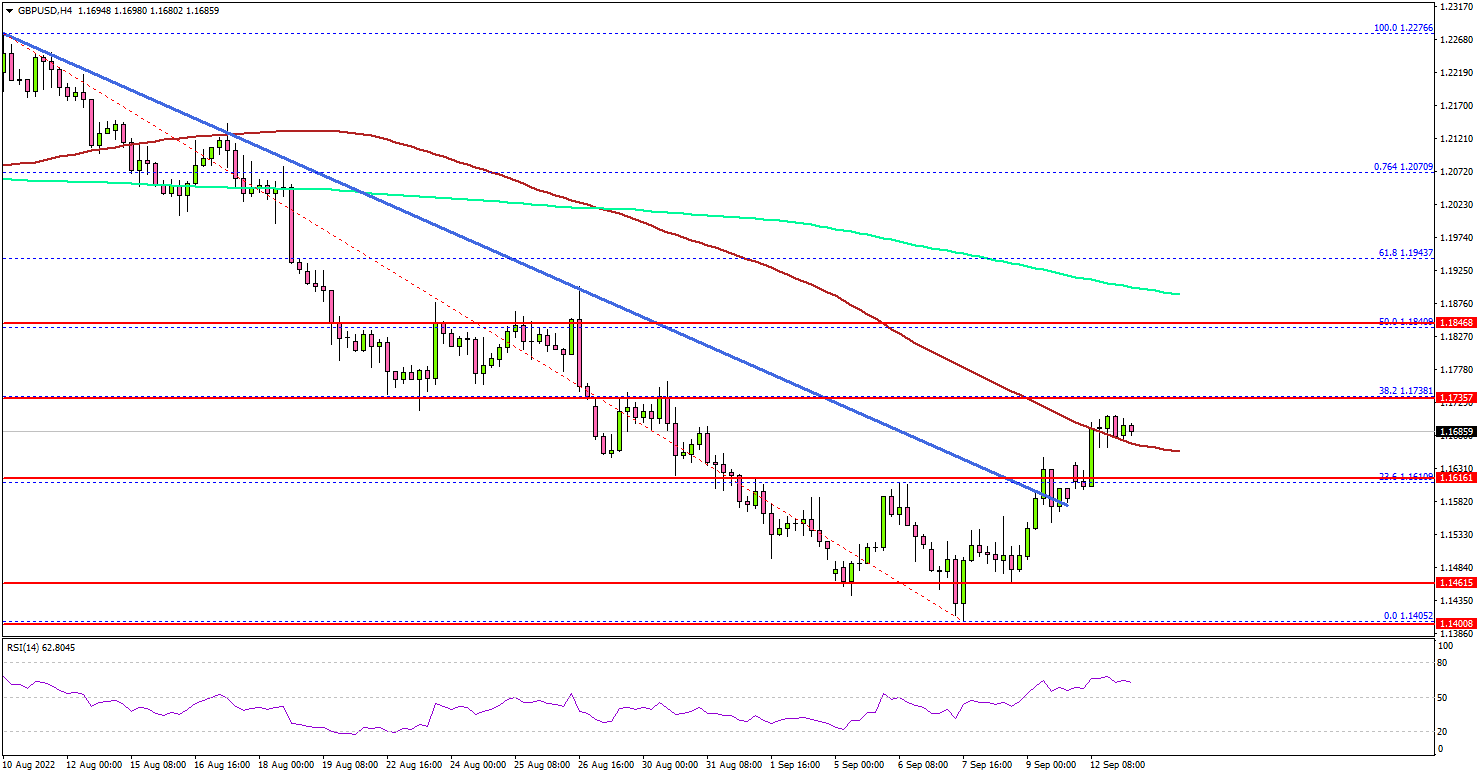
Looking at the 4-hours chart, the pair was able to clear the 1.1600 resistance zone and a major bearish trend line at 1.1580. There was a move above the 23.6% Fib retracement level of the downward move from the 1.2276 swing high to 1.1405 low.
The bulls were able to push the pair above the 1.1680 level and the 100 simple moving average (red, 4-hours). The pair is now facing resistance near the 1.1740 zone.
The next major resistance is near the 1.1840 level or the 200 simple moving average (green, 4-hours). It is near the 50% Fib retracement level of the downward move from the 1.2276 swing high to 1.1405 low.
Any more gains might send GBP/USD higher towards the 1.1940 resistance zone. The next major resistance is near 1.2000, above which the pair may perhaps rise towards the 1.2120 level.
If there is a fresh decline, the pair might find bids near the 1.1650 level. A downside break below the 1.1650 support might sent it to 1.1600. The next major support is near the 1.1550 level, below which the pair could even test the 1.1500 level.
Looking at EUR/USD, the pair was able to start a recovery wave above the 1.0050 and 1.0100 resistance levels. The next major resistance is near 1.0200.
Economic Releases
- UK Claimant Count Change for August 2022 – Forecast -9.2K, versus -10.5K previous.
- UK ILO Unemployment Rate for July 2022 (3M) – Forecast 3.8%, versus 3.8% previous.
- US Consumer Price Index for August 2022 (MoM) – Forecast -0.1%, versus 0% previous.
- US Consumer Price Index for August 2022 (YoY) – Forecast +8.1%, versus +8.5% previous.
- US CPI Ex Food & Energy for August 2022 (YoY) – Forecast +6.0%, versus +5.9% previous.
Brent is Stressed Again
The commodity market remains extremely volatile. On Monday, a Brent barrel is declining to 91.50 USD and looks unstable. Previously, the market was afraid that Russia will cut down on supply and pushed prices upwards, but risks of stable demand have become more serious now.
This week, investors will keep an eye on the flow of inflation statistics both from the EU and the US. In the latter case, the information will help to form clearer expectations from the results of the Fed’s meeting in September.
Baker Hughes statistics, published earlier, demonstrated a decline in the number of active oil rigs in the US – by 5 units to 591 rigs.
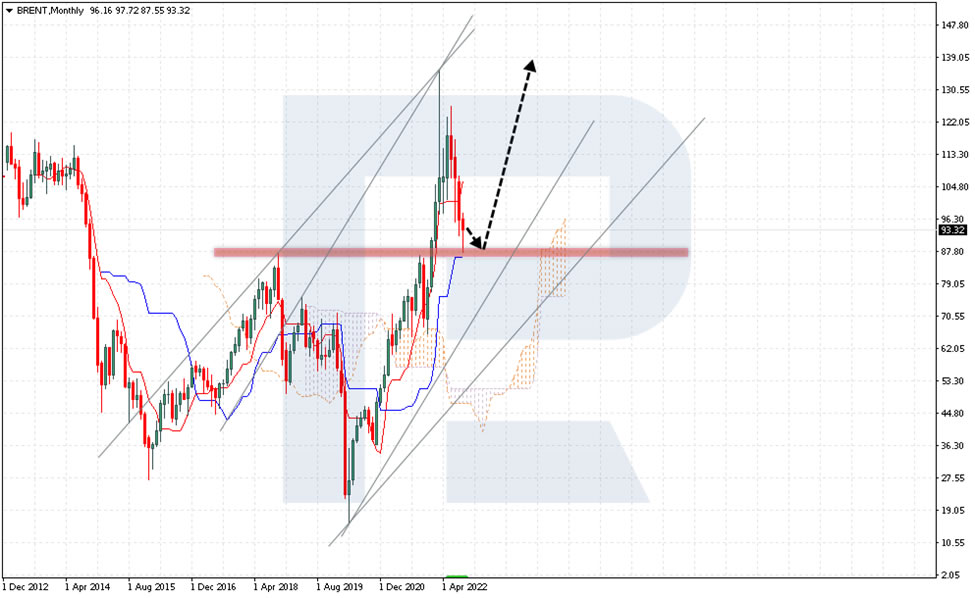
Regardless of Brent falling on, the current movement can still be interpreted as a correction of a mighty bullish trend. The quotes are now testing the support area that used to be a strong resistance level in 2018 and 2020. It was broken away only at the beginning of this year. The price pattern is a bullish 5-0. By this pattern, after a correction the price will head for renewing the high, so in the long run, the quotes may rise to 139.00. The downtrend may start again only if the lower border of the Cloud is broken and prices secure under 70.00.
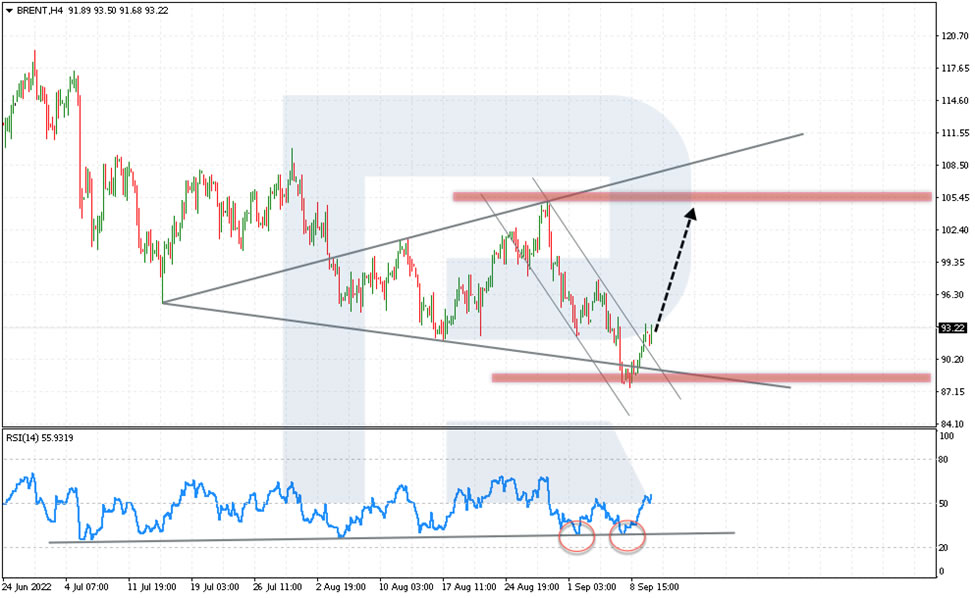
On H4, Brent has bounced off the lower border of a bullish Wolfe Wave. The goal of the movement is 105.45. A strong signal confirming the growth of the pair will be a breakaway of the upper border of the descending channel. With it, the descending movement that started at the end of August will be over. The second signal is a Double Bottom reversal pattern forming on the RSI. The indicator is already testing the upper border of the pattern, and as soon as it is broken away, they might hit 80. A negative scenario for the bulls will be another price decline and securing under 86.00, which will cancel the bullish pattern and indicate further falling.
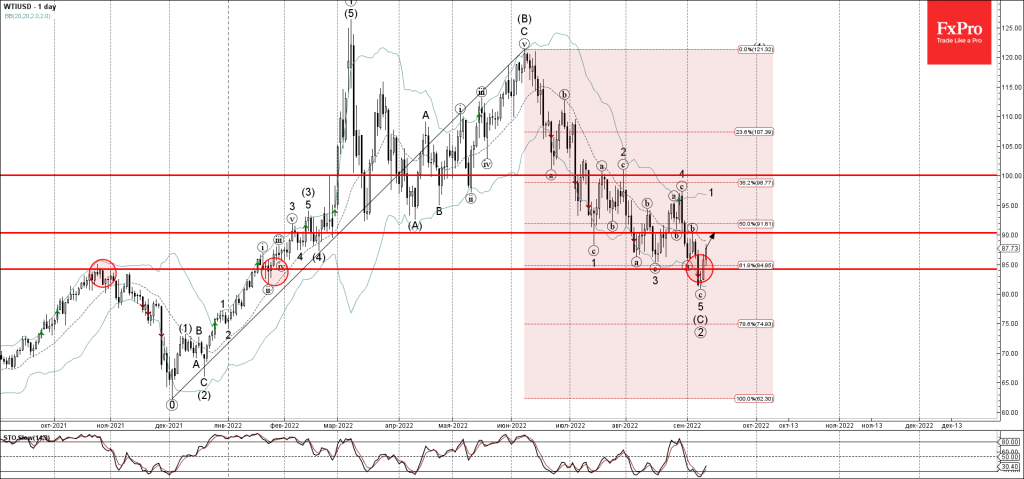
WTI Crude Oil Wave Analysis
- WTI reversed from key support level 85.00
- Likely to fall to resistance level 90.00
WTI crude oil recently reversed up from the key support level 85.00 (former multi-month high from October of 2021), intersecting with the 61.8% Fibonacci correction of the upward impulse from December.
The upward reversal from the support level 85.00 created the daily candlesticks reversal pattern Morning Star – which marked the end of the earlier primary ABC correction from March.
WTI crude oil can be expected to rise further toward the next round resistance level 90.00.
USDCAD Wave Analysis
- USDCAD falling inside short-term corrective wave (ii)
- Likely to fall to support level 1.2900
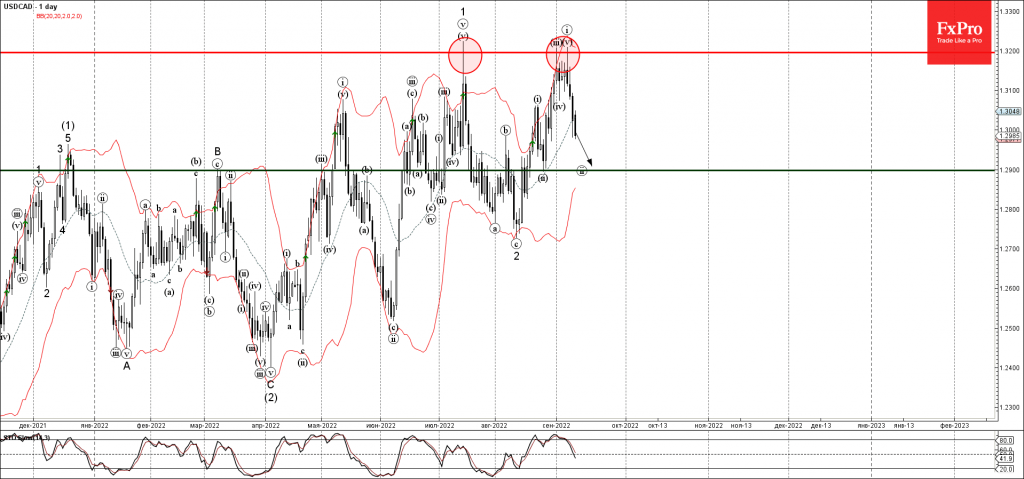
USDCAD currency pair continues to fall inside the short-term corrective wave (ii), which started earlier from the key resistance level 1.3200 (which stopped wave 1 in July).
Wave (ii) belongs to the higher-order impulse waves 3 and (3) from August and April respectively.
USDCAD can be expected to fall further toward the next support level 1.2900 (low of the previous correction (ii) from August and the target for the completion of the active wave (ii)).