

Sample Category Title
USD/CHF: Final Cycle Wave Z Could Take a Zigzag Structure
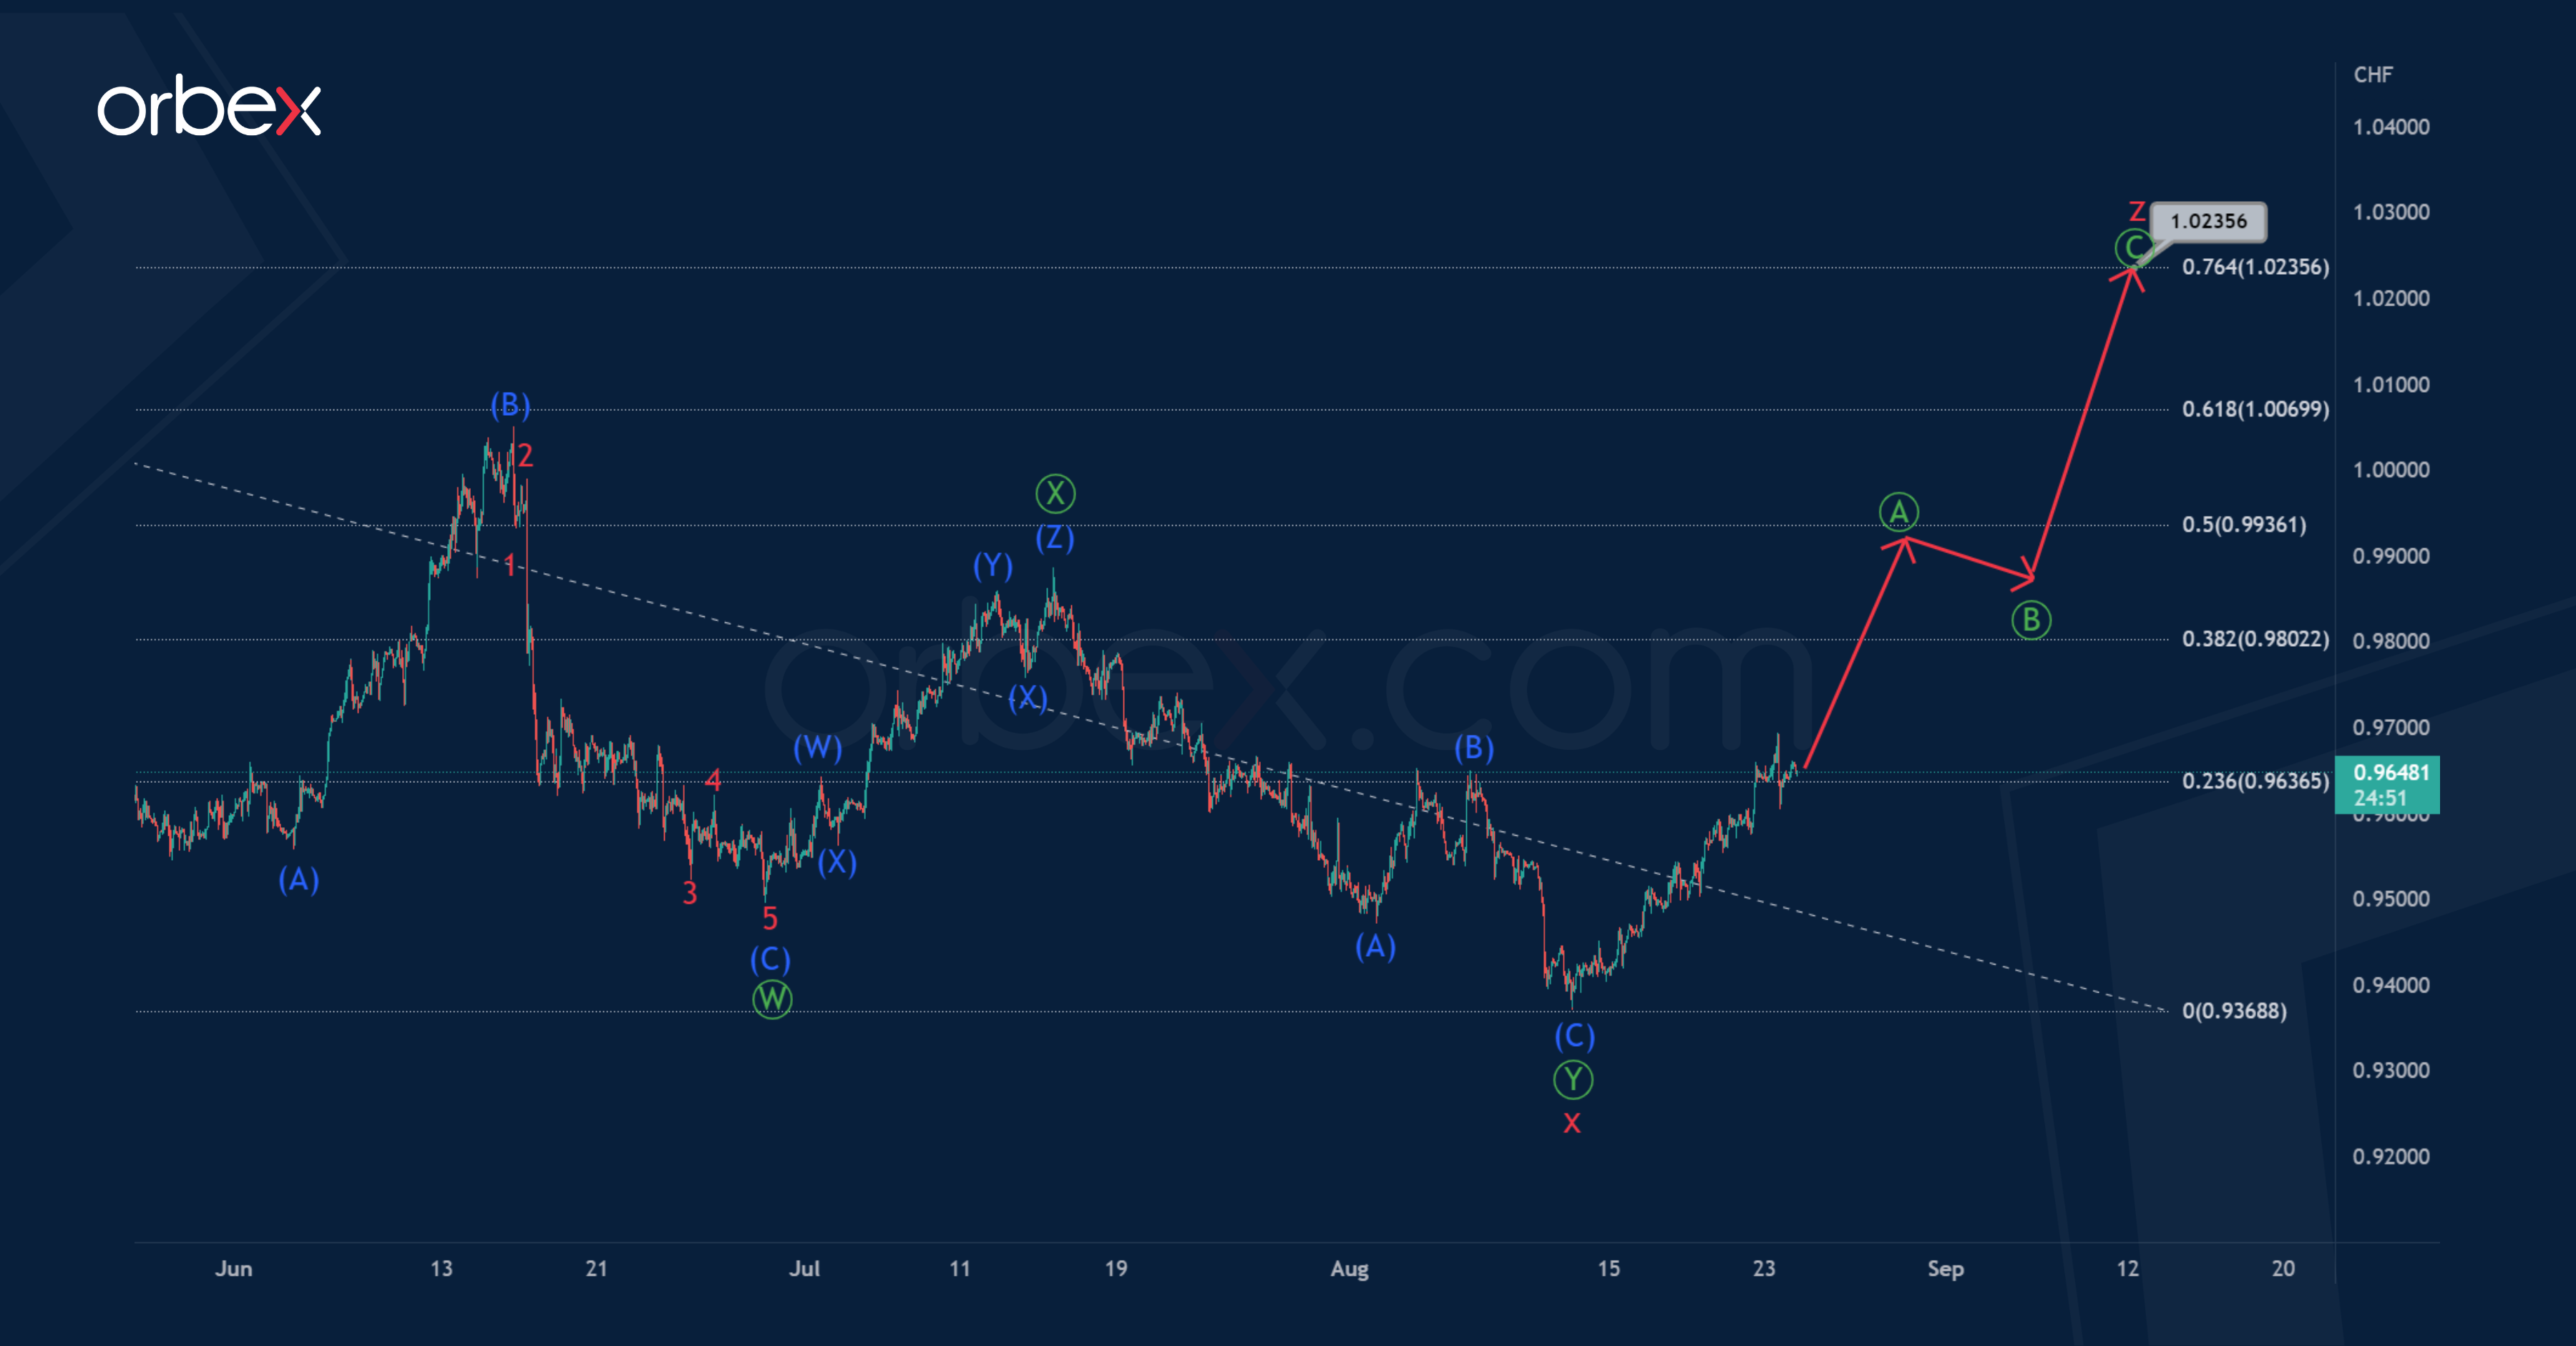
The current USDCHF structure on the 1-hour timeframe shows the final part of a large triple zigzag consisting of cycle sub-waves w-x-y-x-z.
It is possible that the price reduction in the intervening wave x, which is a double zigzag, has recently come to an end. Currently, there is a development of the actionary wave z of the cycle degree.
It is likely that the wave z will be a standard 3-wave zigzag of the primary degree.
It is assumed that in the next coming trading days, market participants could see the development of sub-waves, as shown on the chart, near 1.023.
At that level, cycle wave z will be at 76.4% of previous actionary wave y.
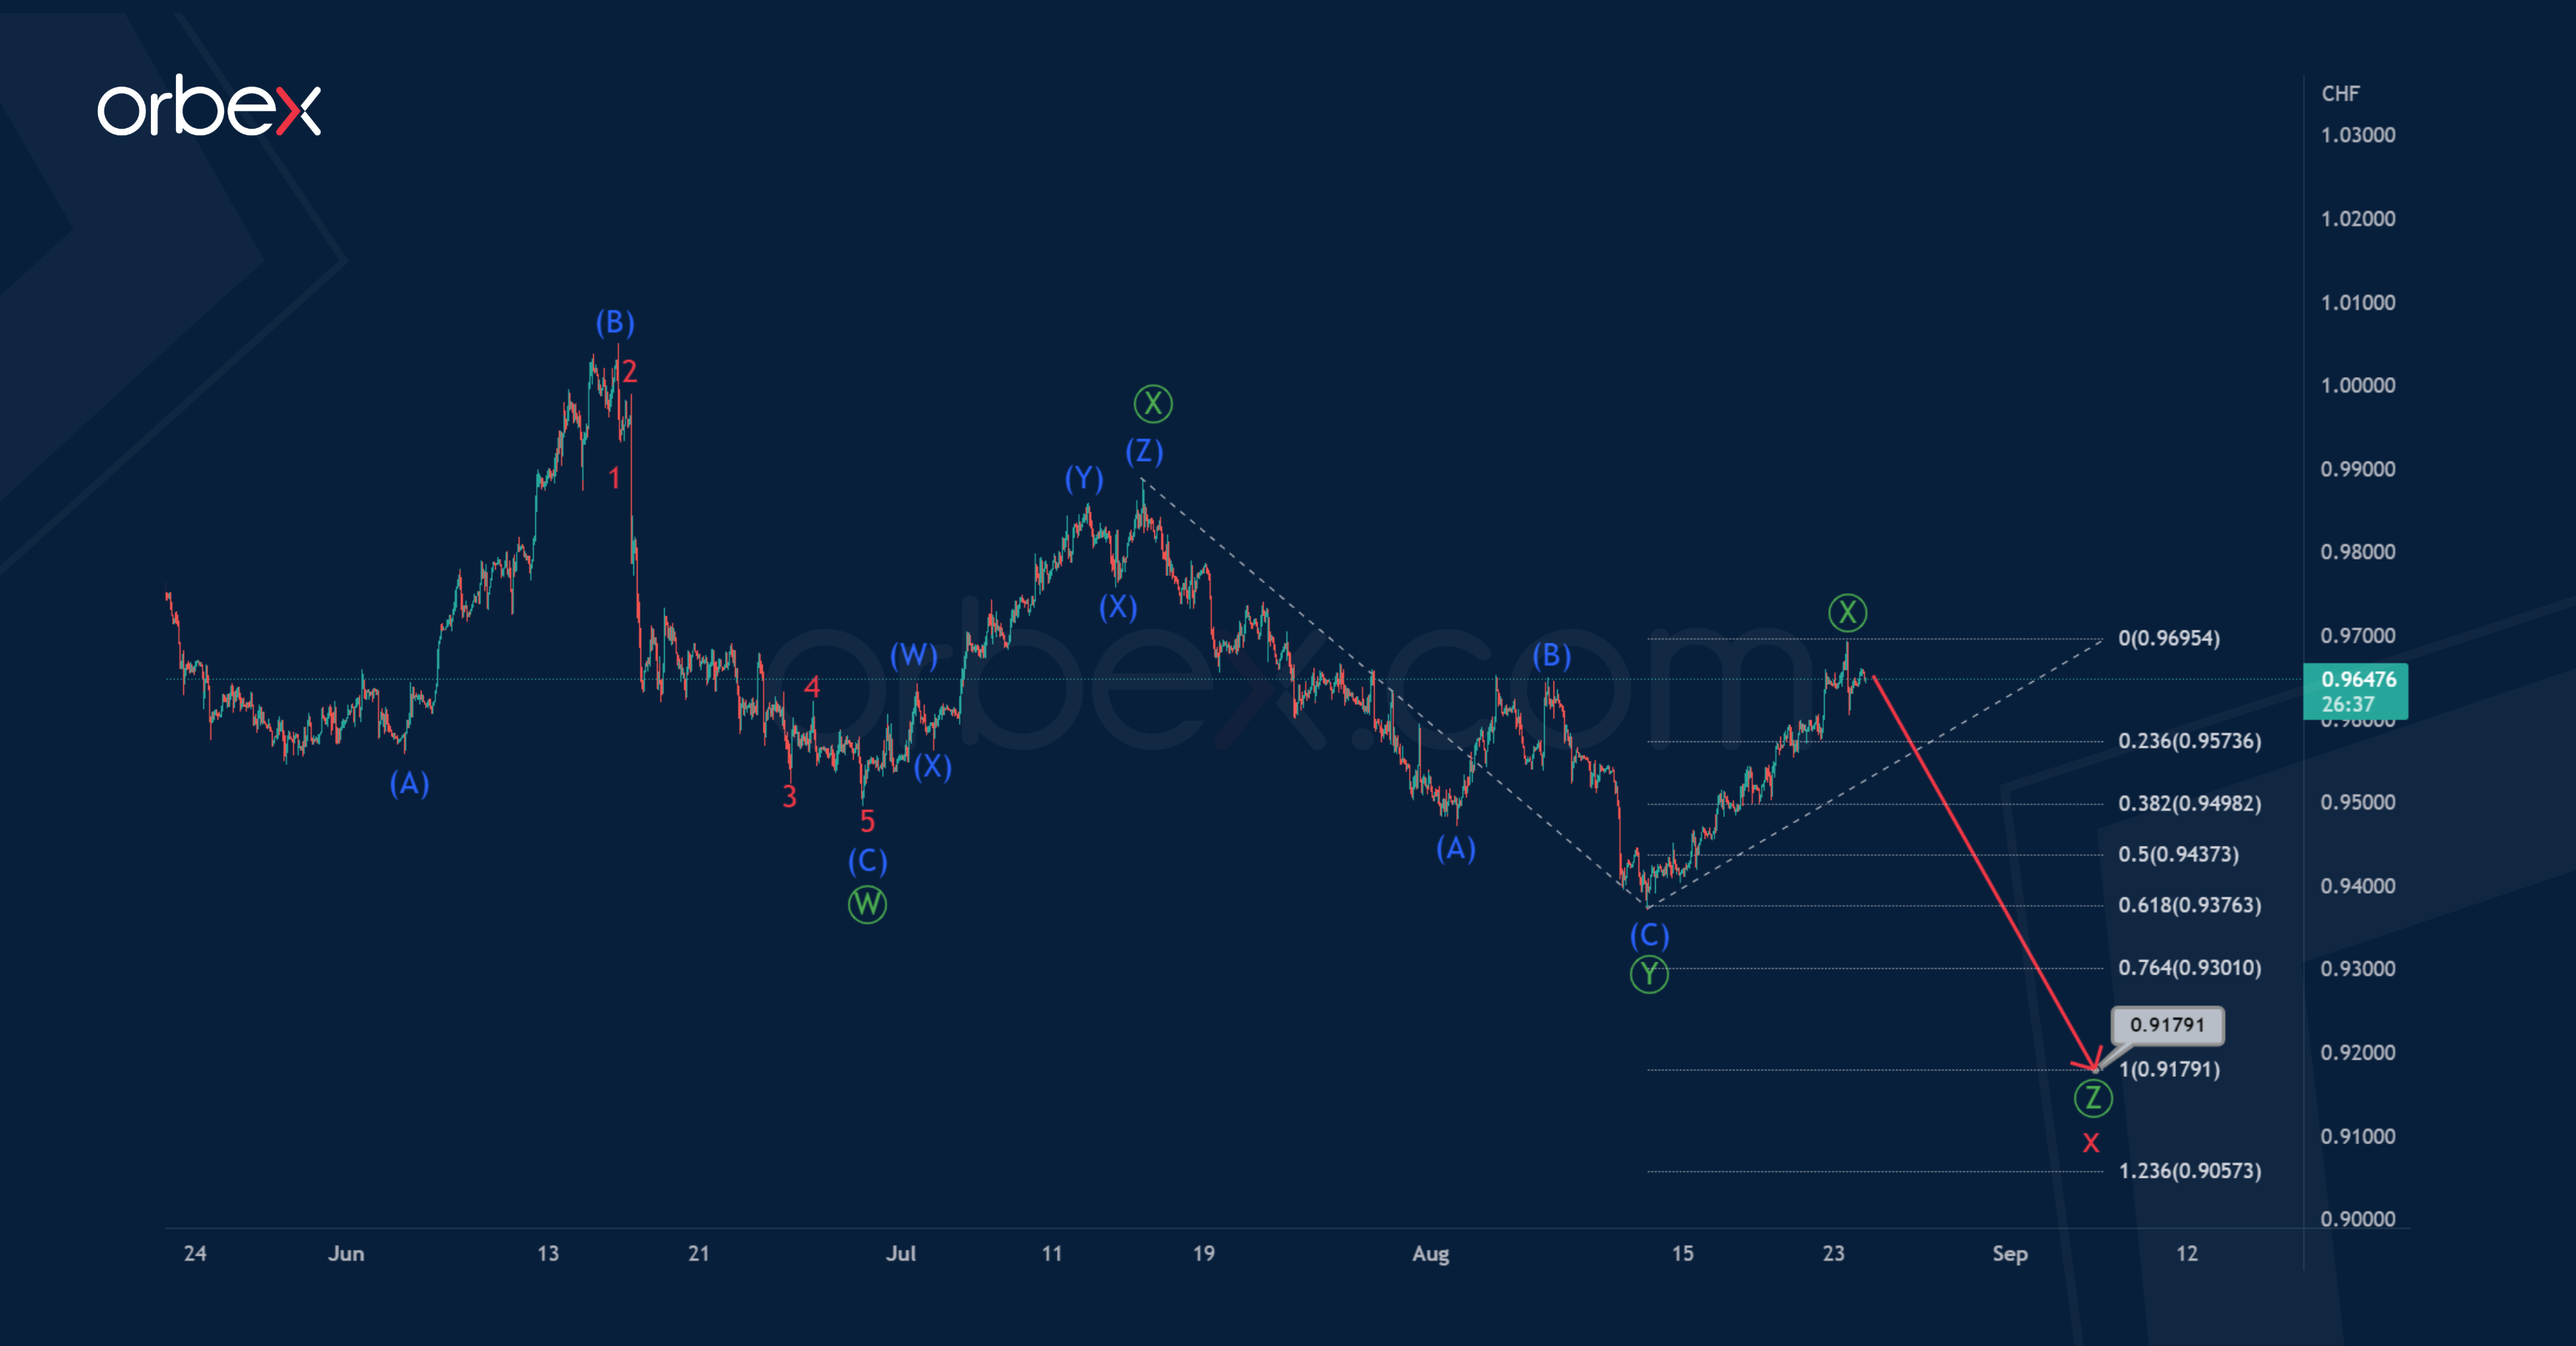
Alternatively, the construction of the bearish intervening wave x has not yet come to an end. This wave can be more complex in its form, that is, it may take the form of a triple zigzag rather than a double zigzag.
Thus, the confirmation of this option could be a reduction in the price and the construction of the final sub-wave.
It is possible that the wave will strive for equality with the previous actionary wave, and therefore its end is possible near the level of 0.917.
The probability of achieving this coefficient is high.
NAS 100 Struggles for Bids
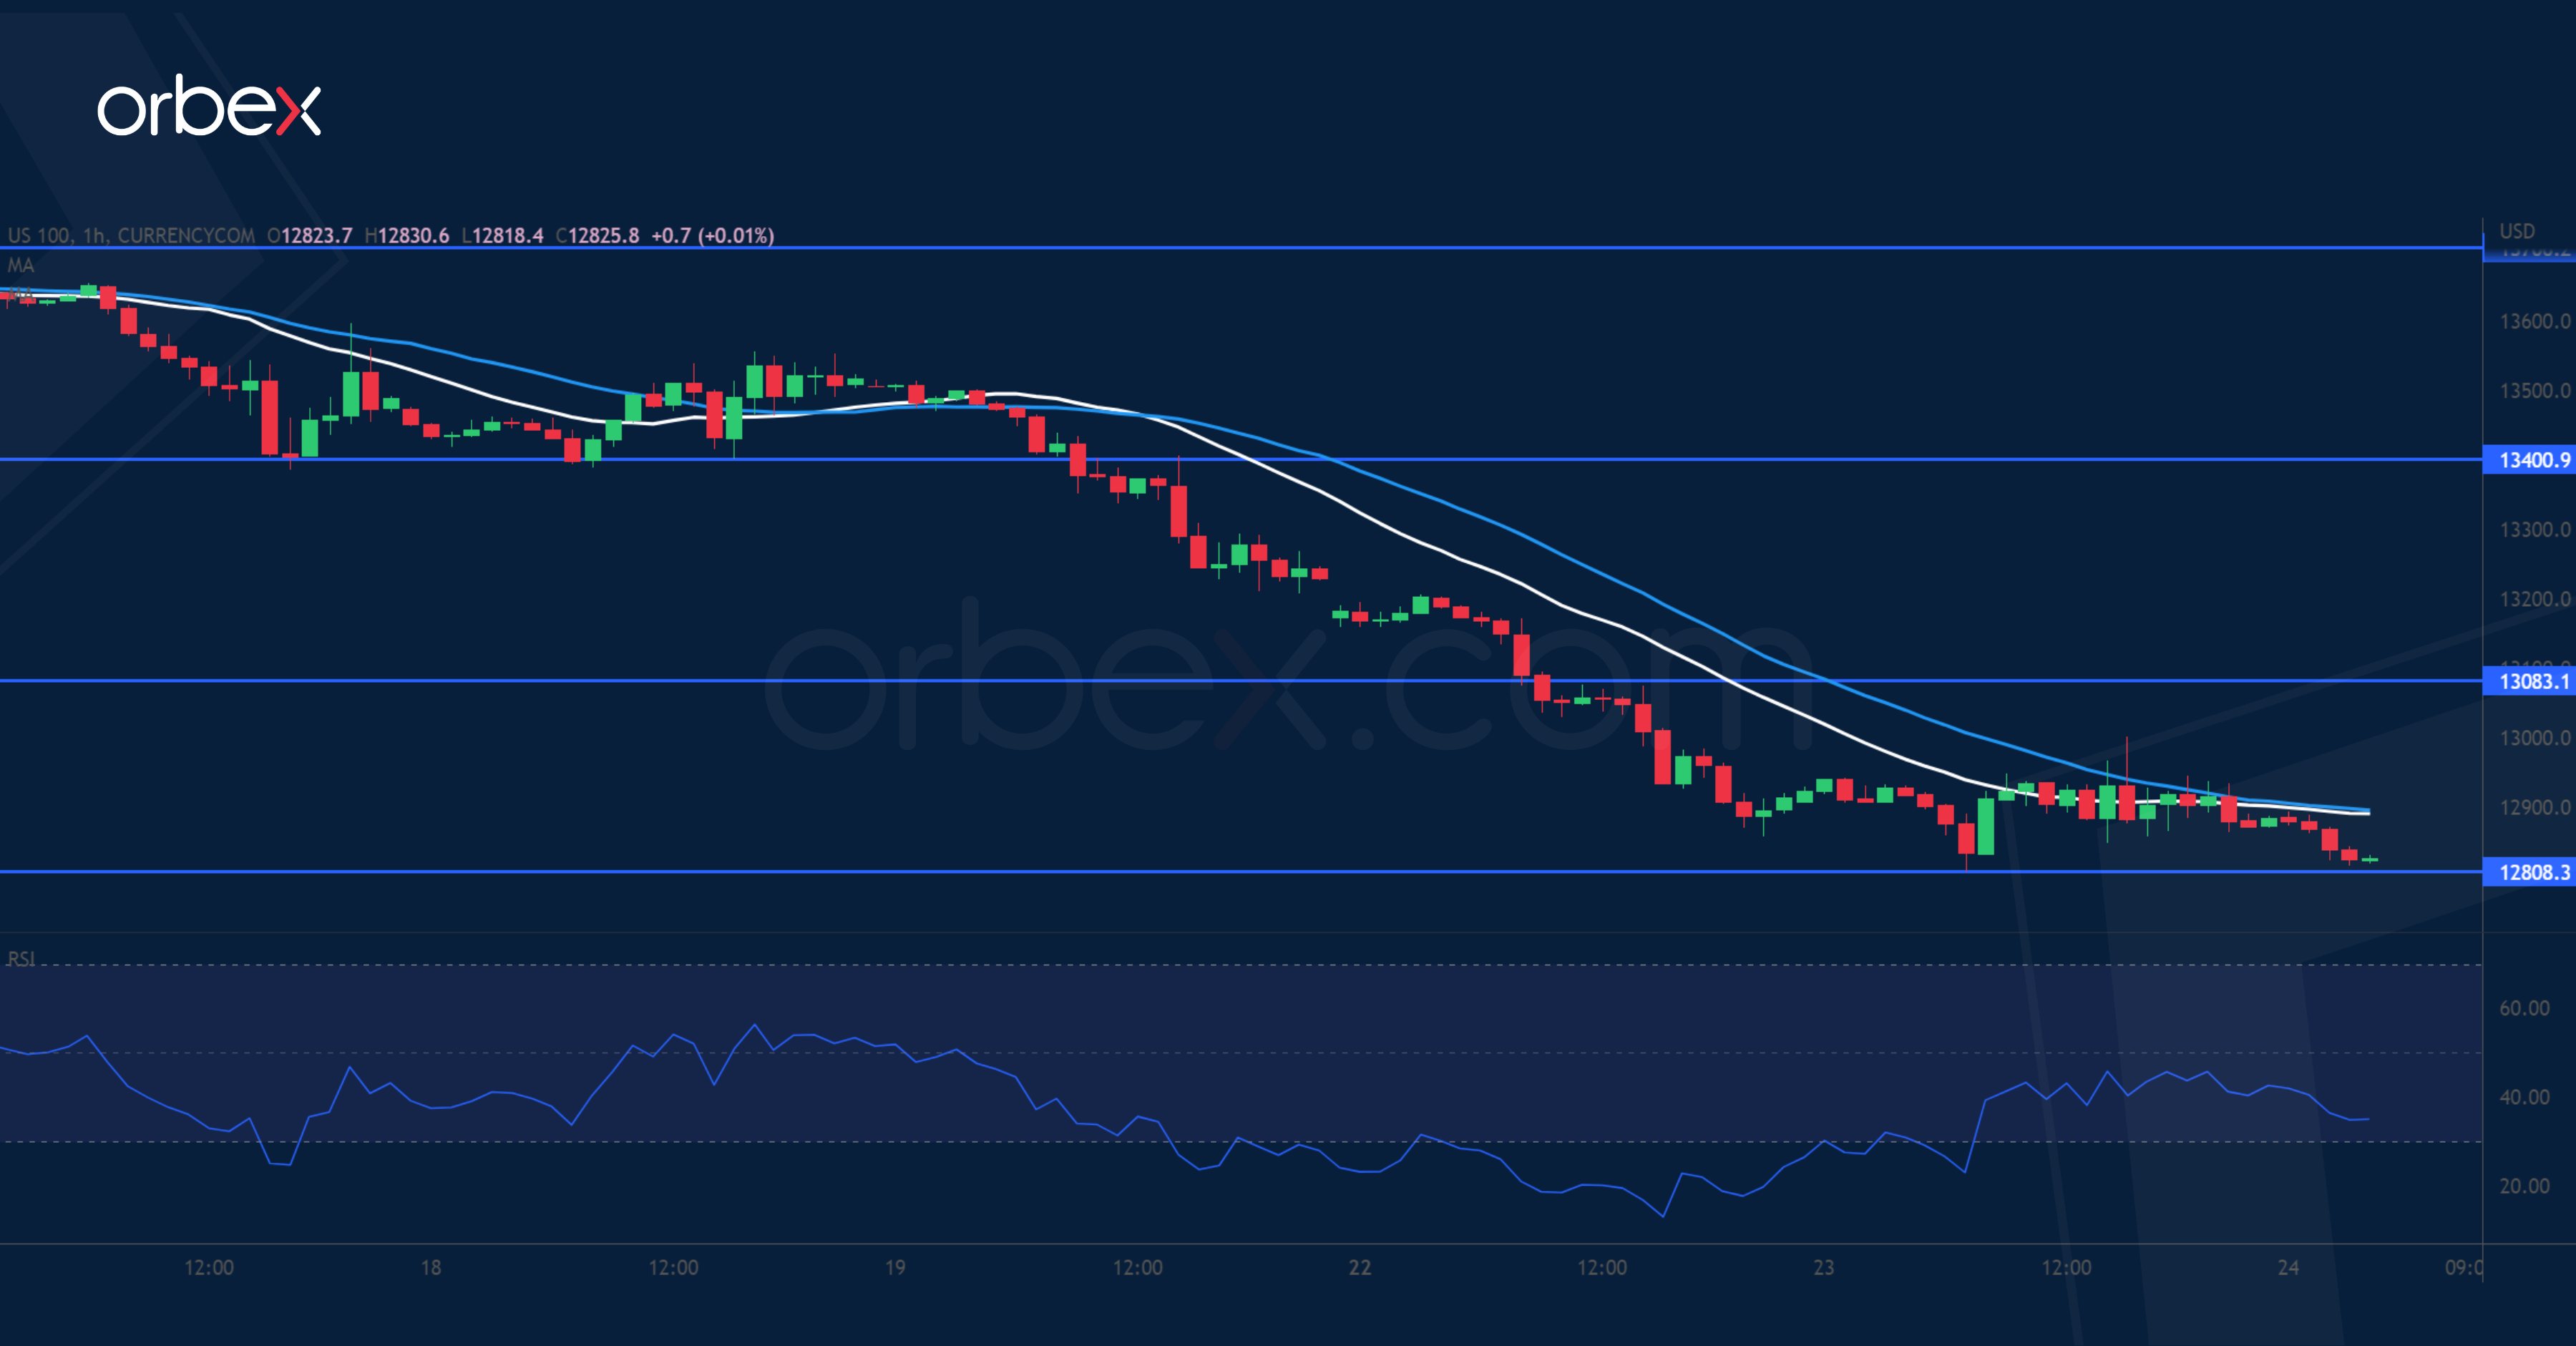
The Nasdaq 100 feels the pressure from signs of a slowing US economy. A break below the psychological tag of 13000 has put the bulls under pressure. 12800 on the 30-day moving average is another test of buyers’ resolve in the short term. 13080 has become a fresh supply area, and as the RSI recovers into the neutral area, renewed selling interest could cap a potential rebound. The bulls will need to reclaim 13400 before the index could secure a foothold again. Otherwise, it could be vulnerable to another round of sell-offs.
GBP/USD Breaks Daily Support
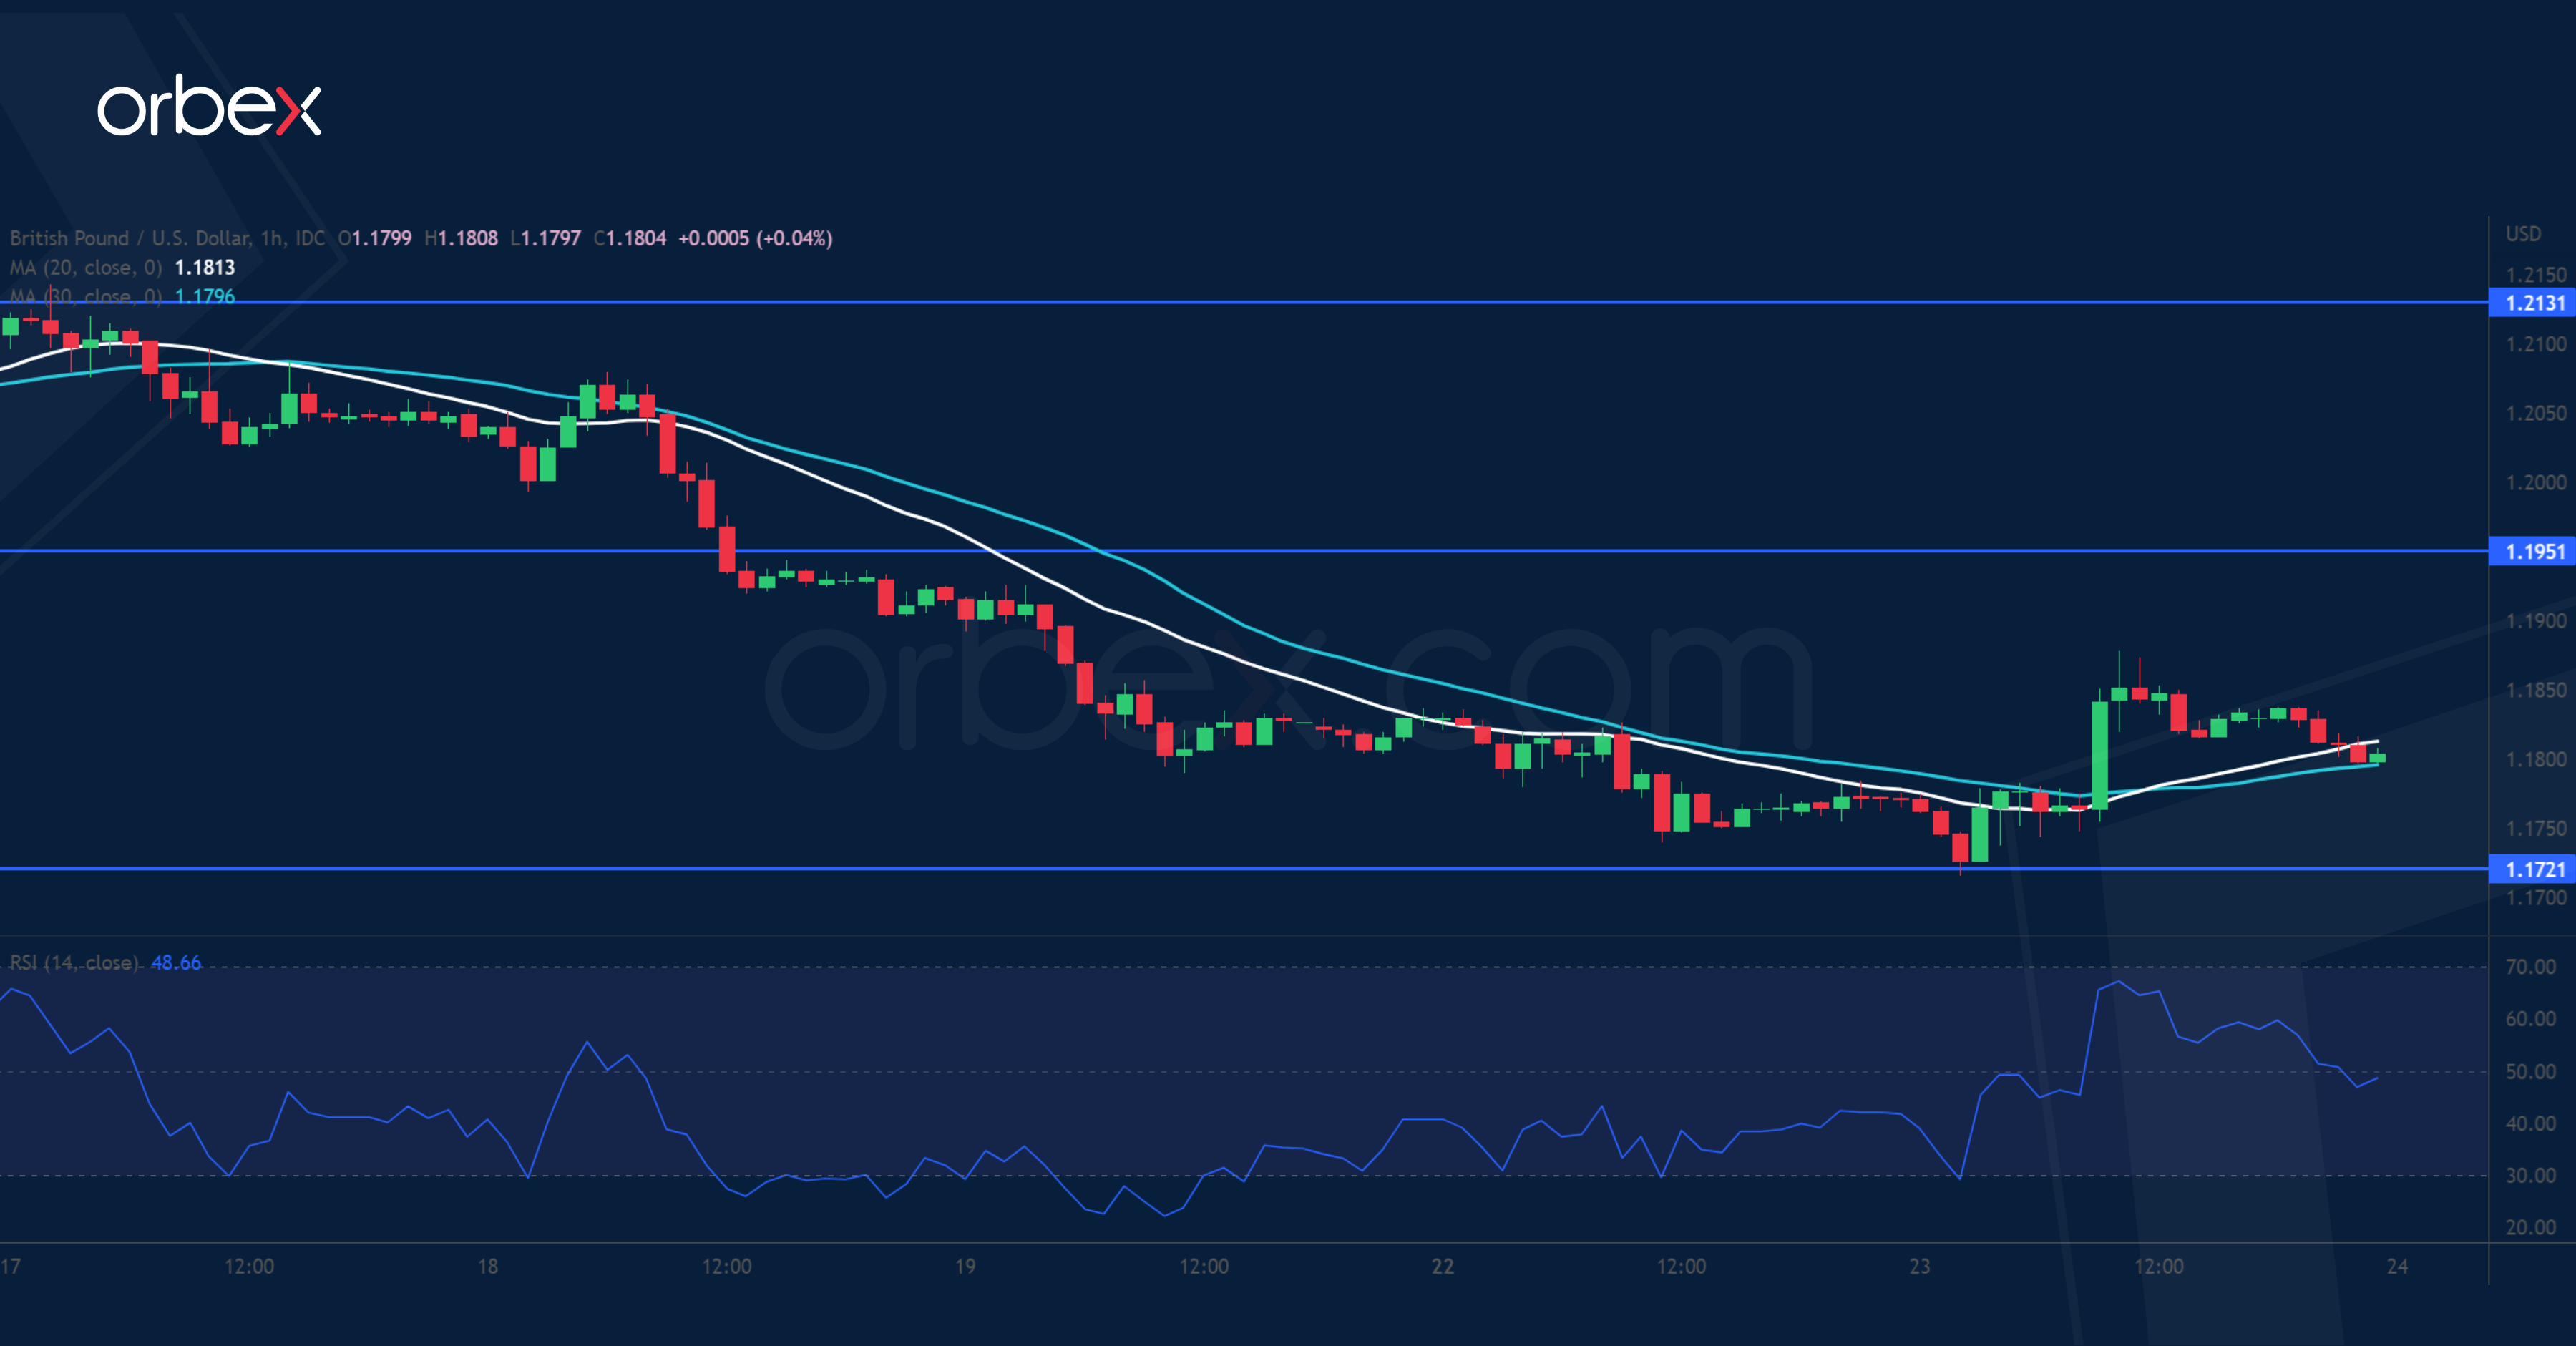
The pound bounces over upbeat services PMI. The pair had previously failed to clear the supply zone (1.2300) on the daily chart. The bears’ latest push below 1.1770 has invalidated the mid-July rebound. This is a confirmation that the downtrend could resume in the weeks to come, and the price action might be heading towards March 2020’s lows around 1.1400. 1.1720 is intermediate support in case of a brief consolidation. Stiff selling pressure could be expected at the support-turned-resistance at 1.1950.
EUR/USD Sees Limited Bounce
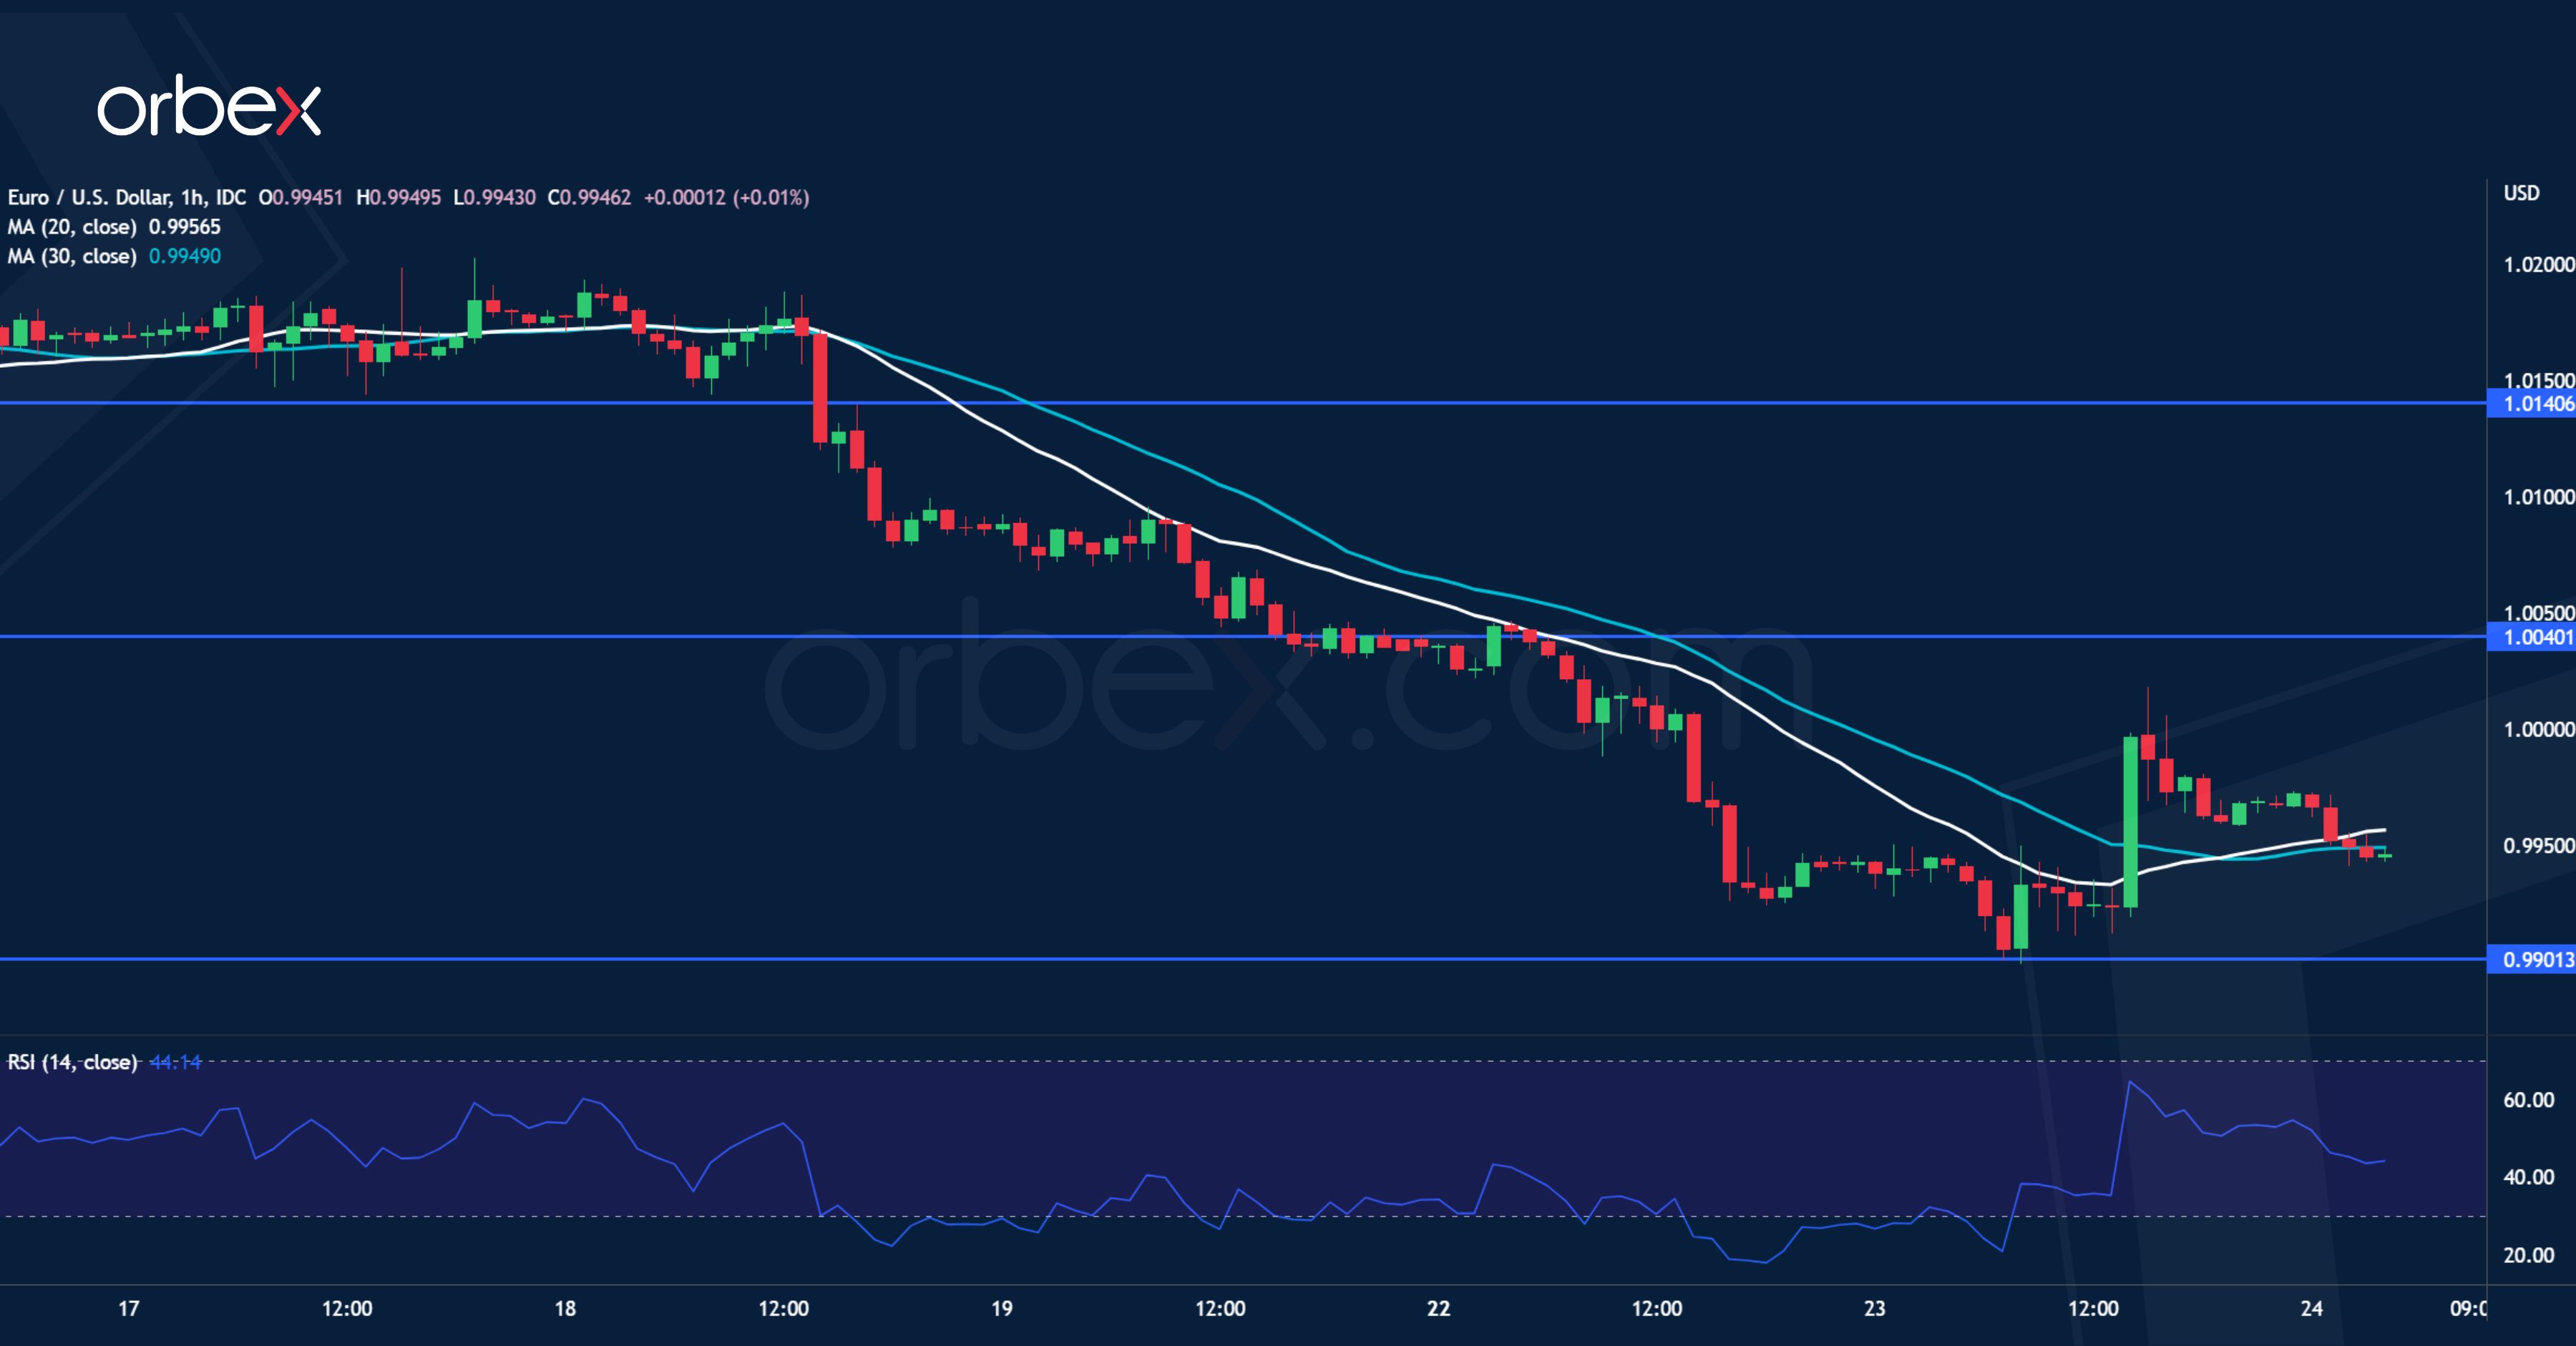
The US dollar retreated after PMI data showed a slowdown in business activity. However, the euro’s fall below parity and July’s low indicates that sellers are in control. As last month’s rally turned out to be a dead cat bounce, the path of least resistance would be down. After the RSI sank into oversold territory, 0.9900 from December 2002 saw some bargain hunting. Though the former demand zone around 1.0040 could be a tough level to crack. Renewed selling would send the single currency towards 0.9700.
Daily Technical Analysis
EUR/USD
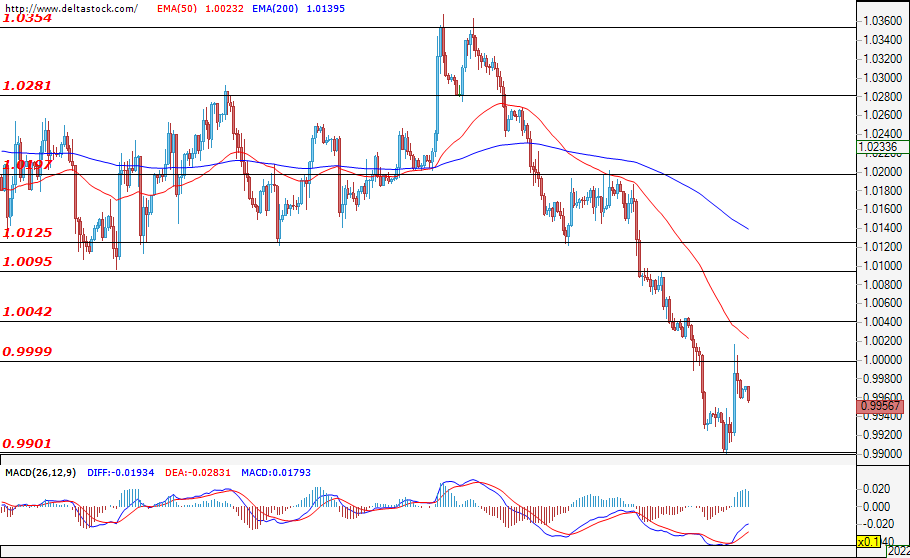
After successfully breaching the parity level at 1.0000, the euro continued to lose ground against the dollar, reaching the support at 0.9900. Apparently, during yesterday’s trading session, the pair managed to rebound from the mentioned support and recovered approx. 100 pips from its losses. Afterwards, the bulls made an unsuccessful attack on the critical resistance at 1.0000 and trading remained slightly below this critical zone. This impulsive upward move was a good opportunity for the sellers to take short positions at better entry levels in this falling market. The downtrend is expected to continue, but only a confirmed breach of the support at 0.9900 would strengthen the negative expectations for a further depreciation of the euro against the U.S. dollar. This scenario could also possibly suggest a stronger bearish presence that may head the price towards the bottom at 0.9800. Despite the positive sentiments for an appreciation of the dollar, a slight correction may develop and the pair may enter a consolidation phase in the range of 0.9900 – 1.0000. Market participants are not likely to aggressively take positions аs fake breakouts of the range are highly possible in these uncertain conditions. The support at 0.9900 may be considered as a good opportunity for the buyers to take short-term positions and wait for the pair to consolidate in the range of 0.9900 – 1.0000, gaining profits at the middle of this range. However, limiting losses closely below the support at 0.9900 via stop orders is highly recommended in case such positions are taken.
USD/JPY
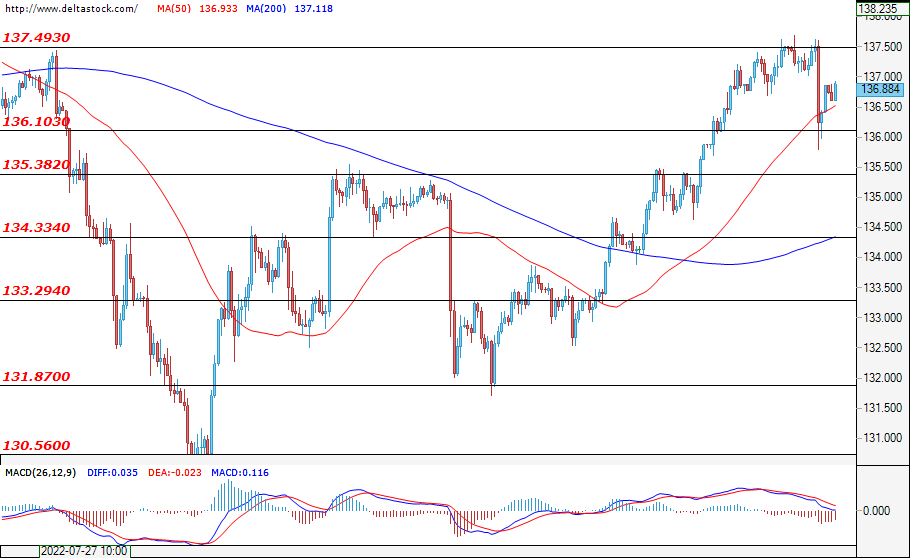
Since the beginning of the trading week, the bulls struggled to overcome the resistance at 137.50, but their attempts were unsuccessful and yesterday we witnessed an impulsive downward movement and a test of the support at 136.10. However, the mentioned support zone resisted the bears’ pressure and the pair is currently locked in the range of 136.10 – 137.50. Only a breach of either border of the range, however, would allow investors to decide on which positions to take next. If the resistance at 137.50 is breached, then we may witness a continuation of the uptrend towards the next support level lying at 138.00. In the opposite direction, if the bears manage to violate the support at 136.10, then the correction would continue downward towards the next one at 135.38.
GBP/USD
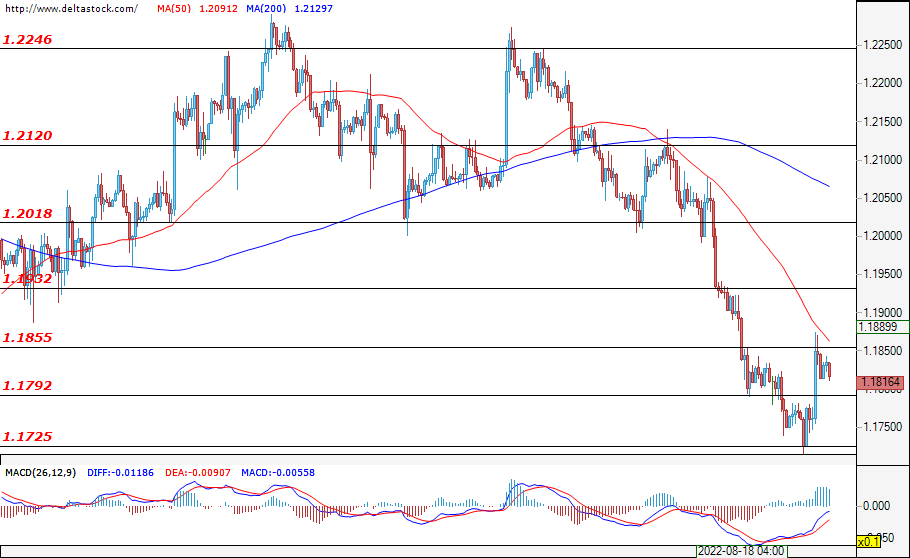
During the previous trading session, we witnessed an impulsive corrective move towards the resistance at 1.1855, but this level managed to resist the bulls’ attack and the pair is currently holding just below this level. The expectations are for the downtrend to continue and it is highly likely that the bears could make another attempt to overcome the support at 1.1725. A successful breach of this level may suggest a resumption of the downtrend, with the next target for the sellers being the psychological level at 1.1700. A consolidation in the range of 1.1725 – 1.1855 may be considered a highly possible scenario for today's trading session. On the other hand, a successful breach of the resistance at 1.1855 may lead to a deeper correction, which could pave the way for the pair towards the next critical resistance at 1.1932.
EUGERMANY40
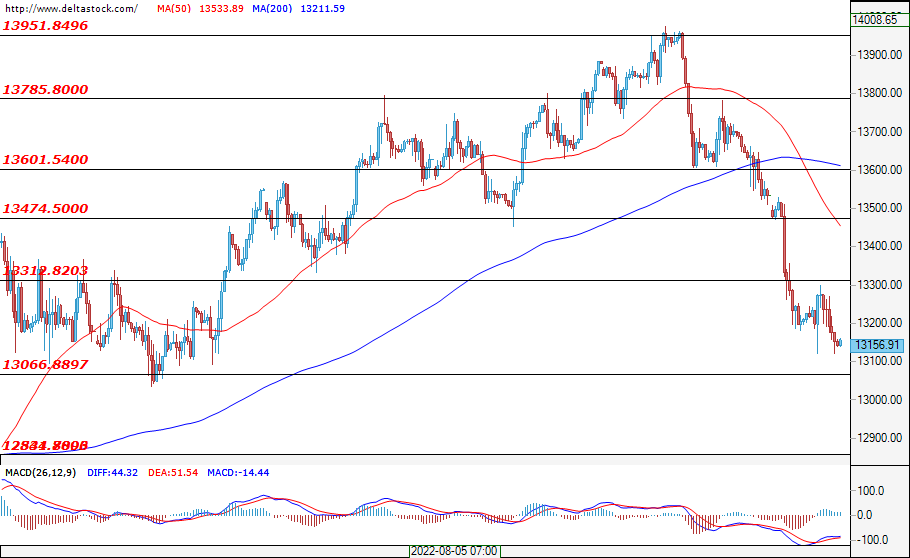
The sell-off for the German index has been going on since last week, and in the early hours of today's trading session, the depreciation is still in full swing. A successful breach of the support area at 13066 would encourage the bears and help them lead the price towards the next significant support at 12844. A deepening of the sell-off is not excluded as a consequence of the persistent negative expectations of investors. A successful breach of the mentioned support, followed by the strong sell-offs, may both result in a consolidation in the range of 12844 – 13066. On the other hand, if the price reached the resistance at 13312, then this may be considered as an opportunity for the bears to enter the market at better levels, but a violation of the mentioned level would easily pave the way for the bulls towards the resistance at 13474.
US30
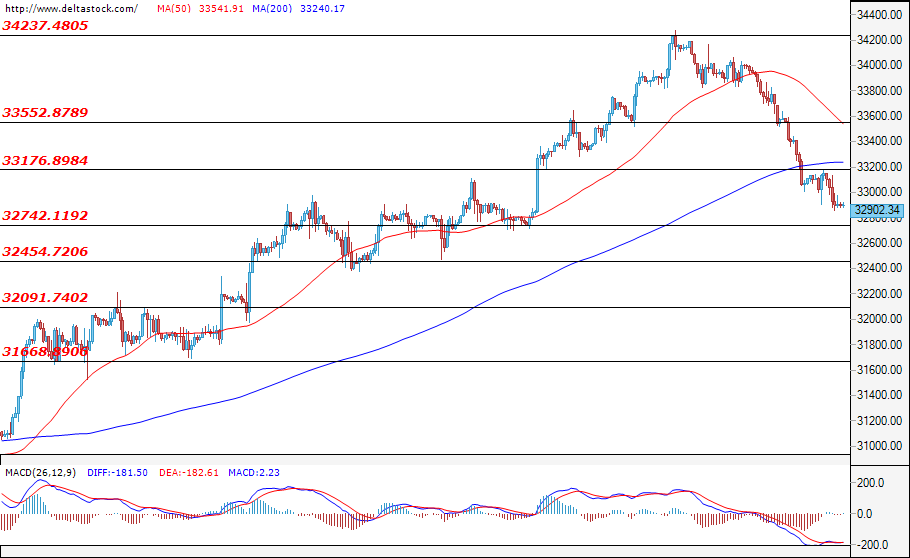
The U.S. blue-chip stock index continued to fall, resulting in a short-lived correction towards the resistance at 33176, but the price quickly rebounded from it. The index is currently headed towards the support at 32742 and a breach of this level would give the bears additional confidence to head the US30 towards the next significant support at 32454. However, if the bulls re-enter the market and successfully limit the sell-offs above the support at 32742, then it is highly possible to see a deepening of the correction that may lead the price in a positive direction. If this becomes the case and the bulls manage to overcome the resistance zone at 33176, then this could lead to a further appreciation and a test of the resistance at 33552. The sentiment at the moment remains rather negative, thus any possible correction would be considered as an opportunity for better entry levels for the sellers. In terms of economic events, market participants are currently looking forward to Fed Chair Jerome Powell's speech, as well as the Jackson Hole Symposium, both scheduled for Friday at 14:00 GMT.
US Services ISM Temporary Stopped USD-Rally
Markets
US PMI’s unexpectedly turned out to have the biggest intraday market impact yesterday. Traditionally, they don’t carry that much weight with main focus on monthly ISM surveys. A significant setback in the August US services ISM (44.1 from 47.3 vs 49.8 expected) temporary stopped the USD-rally while providing (minor) intraday relief for US Treasuries. Especially as they were followed by a huge drop in new home sales (see below) and bigger than expected decline of the Richmond Fed Manufacturing Index (-8 from 0 vs -2 expected). In the end, they didn’t alter the technical pictures though. EMU PMI’s earlier on the day fell as well, but the setback was modest and largely in line with consensus. The US treasury yield curve eventually steepened with daily yield changes ranging between -1 bp (2-yr) and +3 bps (30-yr). The German yield curve steepened as well with yield changes varying between -4 bps (2-yr) and +3.5 bps (30-yr). The long end of the yield curves probably suffered from a late spike in oil prices which needed some time to soak the Saudi hint on an OPEC production cut. Brent crude touched $100/b for the first time since early August. EUR/USD closed at 0.9970 following a volatile day in between 0.9901 (new low) and 1.0018. Sterling recovered some additional ground against the euro following last week’s failed test of the EUR/GBP 0.85 area. Gilt underperformance for now beats dismal eco numbers. European and US stock markets managed to limit the losses to around 0.5%. Today’s eco calendar is thin with only US durable goods orders and pending home sales. They probably won’t have any intraday market impact. Following yesterday’s price action (intraday attempt to correct on ruling trends), this setting might set the stage for some consolidation. Since early last week, markets went to a more neutral positioning going into Friday’s key note address at the Jackson Hole symposium by Fed Chair Powell. Minneapolis Fed Kashkari overnight strengthen the Fed’s guide line that it’s “very clear” that the Fed needs to tighten monetary policy further. The very worse outcome is an unanchoring of inflation expectations which would ask a Vocker-esque response by the Fed. Therefore, frontloading is the way to go, even as the economy shows signs of slowing.
News Headlines
US new home sales in July dropped to the lowest level since 2016. Sales declined 12.6% M/M to reach an annualized pace of 511 000. The June figure was also downwardly revised to 585 000. Sales of New homes in July were 29.6% lower compared to the same month last year. The peak of the current cycle was set in January of 2021 (993k). The slowdown is sales is caused by an ongoing rise in mortgage rates. Still, homes prices continue to rise. The average US new house price in July rose 18.3% Y/Y. At the same time, the inventory of new homes available for sale rose to 464 000, the highest level since 2008. While construction of most of these house still had to be finished, the high inventory gradually might slow prices rises over time. According to a report of CTK news service, the Czech government and the labor unions agreed on a 10% pay increase from September for a group of 365 000 public sector employees. The increase applies to civil servants and non-teaching staff in education. The pay rise is calculated to have an additional budgetary cost of CZK 1.1bn this year. 2022 wage growth is still subject to a further agreement. The wage increase comes in a context where Czech inflation already printed at 17.5% Y/Y in July and is expected to near the 20% area later this year.
The Dollar Softens, Equities Extend Losses, But Energy Stocks Gain on Firmer Oil
The US dollar bounced lower, yesterday, following the weak economic data in the US, which showed that the new home slowed, and business contracted. The flash PMI figures showed that services in the US fell into a deeper contraction, while manufacturing slowed more than the market expectations. Both indices sank to the lowest levels since the first summer of the pandemic. Unfortunately, the weak data couldn’t revive the Federal Reserve (Fed) doves, yesterday.
US equity indices fell for the third day, as investors continued scaling back their long positions into the Jackson Hole meeting, where the Fed officials may not sound as dovish as many investors wish they would. The S&P500 slid another 0.22%, the Dow lost close to 0.50%, while Nasdaq was flat.
DAX gives half of summer gains as energy crisis deepen
The ugly PMI data also hammered the mood among the European stock traders, yesterday. The DAX is down more than 2% since the beginning of the week, and already gave back half of gains it recorded this summer. The softer euro could’ve normally given a boost to the European stocks, making them more affordable for foreign investors, but understandably, no one wants to stomach the risks of the deepening energy crisis in Europe. All the competitiveness that comes with the weaker euro is taken away by the increasing cost pressures due to the energy crisis, and the growing likelihood of a dark recession on the old continent.
And the euro is expected to dip further, and failure to stop the euro’s weakening will make the European imports, especially energy imports more expensive for the companies, and further boost inflation pressures. The European Central Bank (ECB) will have to tighten as much as it can, but of course, if the policy tightening can’t stop the euro’s depreciation, the Europeans will find themselves with rising inflation, rising interest rates and slowing economies.
FTSE benefits from solid exposure to energy, as crude rebounds
Situation in the British FTSE 100 is different, as the FTSE 100 has a solid exposure to energy and mining stocks, and having exposure to energy stocks is still one of the most interesting hedging options.
Oil stocks were boosted again yesterday, by firmer oil prices after crude rebounded past the $93 level on news that OPEC could cut production as they feel that the prices fell too much over the past two months. The FTSE slid along with its major European and US peers, yet BP added more than 2% and flirted with the 470p level yesterday.
Also, the latest API data came to support the oil and oil stock bulls, as the latest figures suggested another bigger-than-expected decline in the US oil inventories. The stockpiles fell more than 5 mio barrels last week, versus just 450’000-barrel fall expected by analysts.
We can now say that there are signs of a positive momentum building among the oil bulls despite the recession woes, and the first bullish target is the 200-DMA, which stands near the $96 per barrel, then the $100 psychological resistance.
The rebound in oil prices, along with the surge in nat gas futures could have two effects depending on the market’s actual mood. In one hand, the higher energy prices dampen the economic activity, and therefore could revive the Fed doves, and bring forward the idea that the Fed would soften its hand to support the economic growth. But on the other hand, the rebound in energy prices boost inflation and inflation expectations, and therefore could keep the Fed hawks alert, and underline the fact that the Fed will not soften its policy until inflation is meaningfully and sustainably down from the multi-decade high levels.
I believe that right now, the market mood suggests that the second option is most likely to be priced in: higher energy means higher inflation. Higher inflation means hawkish Fed, hawkish Fed means higher yields, and higher yields mean lower equity valuations.
Stagflation is Back in Focus
Market movers today
There are only few economic releases today. The only number of relative importance is the US July durable goods orders, which are expected to slow due to the financial tightening taking place on the back of the Fed tightening.
The 60 second overview
August PMIs point to weakening growth momentum: In the euro area services activity seems to be stagnating and manufacturing slipped further into recession territory. New business was down in both the manufacturing and service sectors, suggesting little prospect of an improvement in production ahead. On a positive note, businesses continue to see less rises in their costs and in turn are increasing their selling prices at a softer pace. The post-pandemic employment recovery continues, although firms are increasingly reluctant to hire new staff in light of weakening order books. Overall, pent-up services spending that boosted growth in Southern Europe during Q2 is increasingly running out of steam as persistently high inflation and rising interest rates are weighing on consumers' disposable income. Germany's manufacturing progress is under strain from both lingering supply constraints, a weakening demand outlook and rising cost pressures in light of the worsening energy crisis. With the threat of rationing and production cuts later this year still looming large, the near-term outlook for the euro area economy remains challenging and we think a recession in H2 22 will be difficult to avoid.
In the US, the manufacturing index declined more than expected but remains above 50, as new orders remained near previous levels. However, service sector growth appears to be slowing faster than expected, as firms' expectations of incoming new business and employment growth ticked lower. Overall price pressures continue easing, but input and output price growth remains at very elevated levels. All together the figures continue to support the 'stagflationary' narrative on both sides of the Atlantic. New home sales in the US were also disappointing. A downturn in homes sales is often an important leading indicator of a rise in unemployment rates in the US economy.
Equities proved surprisingly resilient despite poor macro data releases from the US. Equities admittedly drifted somewhat lower but with most cyclical sectors - materials, consumer discretionary, industrials - all higher. Real estate sector underperforming on the back of weak data combined with higher yields triggered some rotation out of growth/ quality stocks. Contrary to the mildly positive reaction from equities and bond investors, VIX continued to drift higher (currently 24) which to us marks the end of the positioning-driven rally over summer. S&P500 -0.2%, Dow -0.5%, Nasdaq -0.8% and Russell 2000 0.2% higher.
FI: After the European PMIs in the morning, rates traded mostly sideways through the day. Initially, the French PMI sent yields lower by 1-2bp, but the German manufacturing PMI just 15 minutes later - which was not as weak as expected - sent Bunds 4bp higher.
FX: US data-induced USD weakness proved short-lived in yesterday's session. EUR/USD temporarily broke above parity but closed back below the important threshold level. NOK had a strong session supported by higher oil prices and better-than-feared European PMIs. Also, continued NOK demand from elevated natural gas prices (tax payments) is supportive. EUR/SEK moved back below 10.60.
Credit: Credit spreads moved largely sideways yesterday. ITraxx main widened by 0.5bp ending in 110.6bp while Xover grinded 2.4bp tighter ending in 549.4bp.
GBP/USD Daily Outlook
Daily Pivots: (S1) 1.1740; (P) 1.1809; (R1) 1.1900; More...
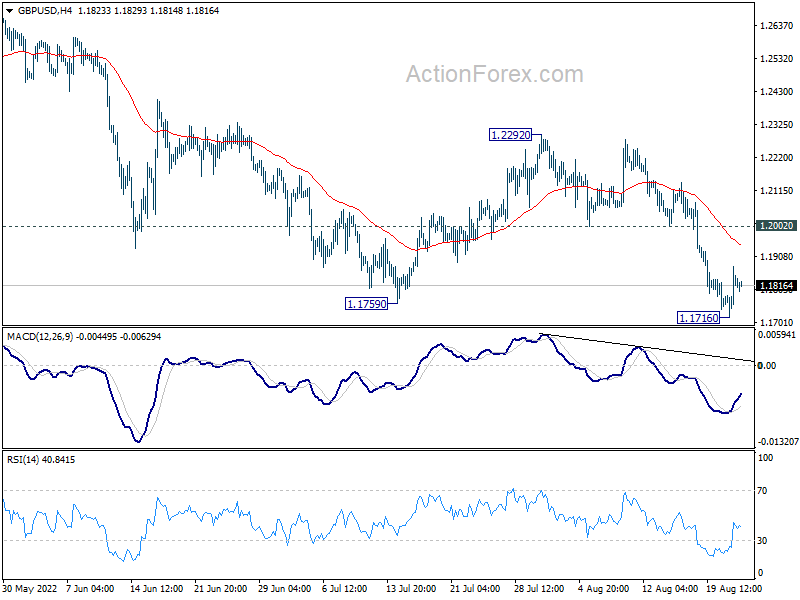
A temporary low is formed at 1.1716 with current recovery. Intraday bias in GBP/USD is turned neutral first. Upside of recovery should be limited by 1.2002 support turned resistance to bring another fall. Break of 1.1716 will resume larger down trend to 1.1409 long term support.
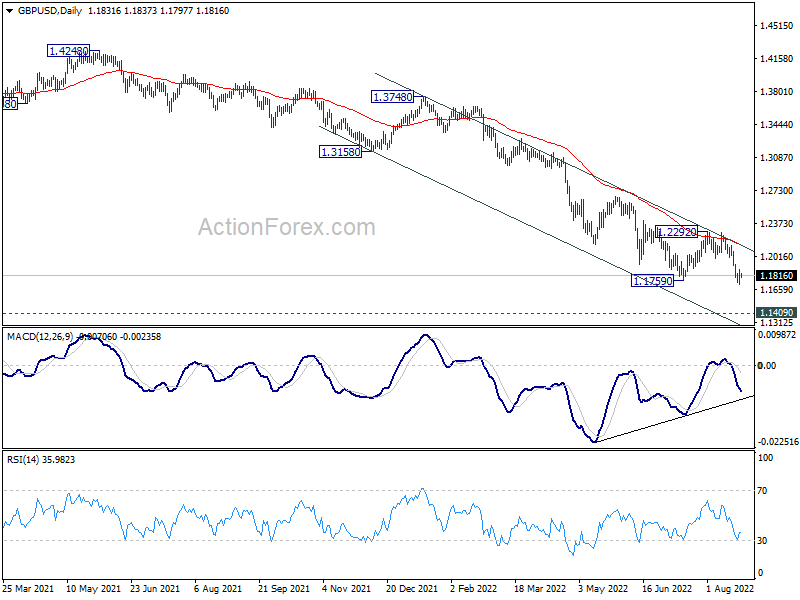
In the bigger picture, fall from 1.4248 (2018 high) could be a leg inside the pattern from 1.1409 (2020 low), or resuming the longer term down trend. Deeper decline is expected as long as 1.2292 resistance holds. Next target is 1.1409 low. However, firm break of 1.2292 will bring stronger rise back to 55 week EMA (now at 1.2859).
Dollar Rally Halted, Yen Picking Up Momentum
Dollar's rally was choked off by terrible PMI data, in particular services, overnight. But the greenback is trying to regain some footing in Asian session. It's too early to say that the bullish trend in Dollar has reversed. Traders are just holding their bets for now, awaiting more guidance from Fed Chair Jerome Powell at the Jackson Hole symposium. For now, Aussie and Kiwi are the stronger ones with Yen. Euro and Sterling are overwhelmingly weak. Dollar is mixed with Canadian.
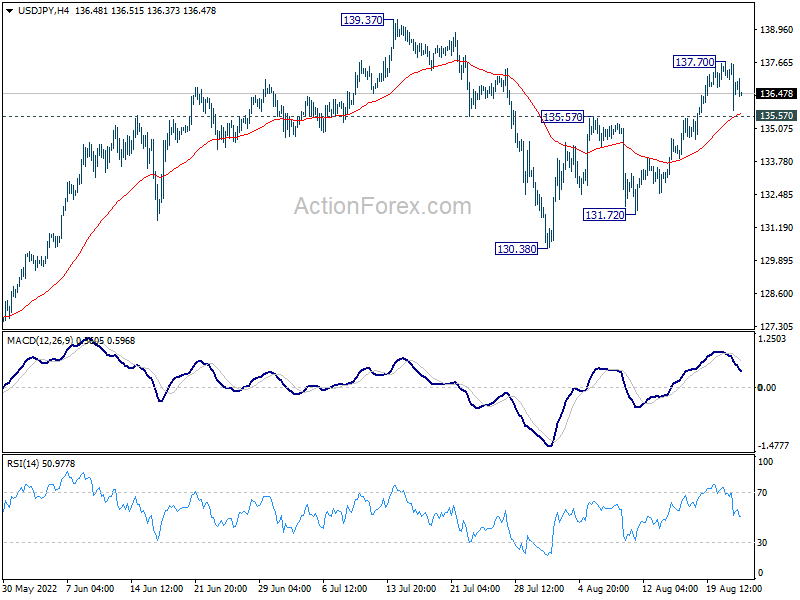
Technically, USD/JPY's rebound from 130.38 is seen as the second leg of the corrective pattern from 139.37. It might have completed with three waves up to 137.70 already. Firm break of 135.57 resistance turned support will argue that the third leg has started back towards 130.38 support. If happens, it's likely more of a boost to Yen then a drag on Dollar elsewhere.
In Asia, at the time of writing, Nikkei is down -0.45%. Hong Kong HSI is down -1.34%. China Shanghai SSE is down -1.29%. Singapore Strait Times is down -0.39%. Japan 10-year JGB yield is down -0.0011 at 0.221. Overnight, DOW dropped -0.47%. S&P 500 dropped -0.22%. NASDAQ dropped -0.00%. 10-year yield rose 0.017 to 3.054.
Fed Kashkari: US economy in a completely unbalanced situation
Minneapolis Fed President Neel Kashkari said yesterday that the US economy is in a "completely unbalanced situation" of "maximum employment" and "very high inflation". He said, "it's very clear: We need to tighten monetary policy to bring things into balance."
"When inflation is 8% or 9%, we run the risk of unanchoring inflation expectations and leading to very bad outcomes that would cause us to have to be very aggressive -- Volcker-esque -- to then re-anchor them," he said.
"We needed to err on making sure we are getting inflation and only relax when we see compelling evidence that inflation is well on its way back down to 2%," he added.
WTI oil ready for a bounce through 100
Oil prices rebounded this week on the prospect of production cut by OPEC+. Saudi Energy Minister Prince Abdulaziz bin Salman was quoted earlier that OPEC+ has the commitment, flexibility, and means to deal with challenges and provide guidance including cutting production at any time and in different forms. However, upside is so far capped as Reuters, based on information from nine OPEC sources, said productions cuts may not be imminent, and might coincide with Iran's return to the market.
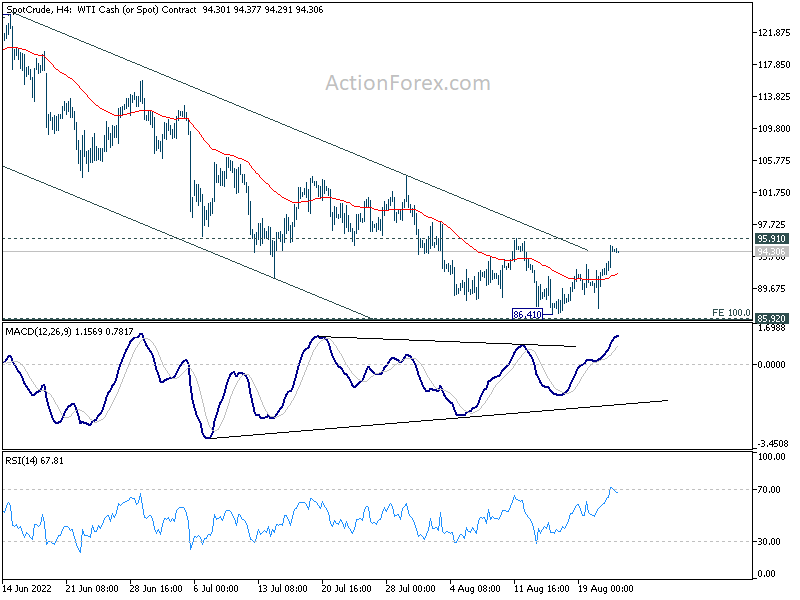
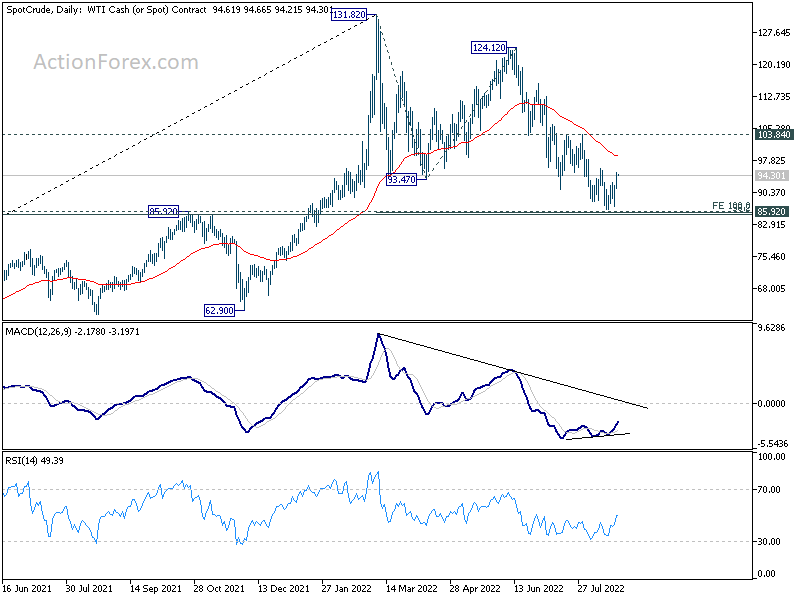
Technically, the conditions for a stronger bounce for WTI crude oil are there. Bullish convergence conditions are seen in both 4 hour and daily MACD. A near term falling channel resistance is already broken. More importantly, 86.41 is close enough to an important cluster support at 85.92, with 100% projection of 131.82 to 93.47 from 124.12 at 85.77.
Immediate focus is now on 95.91 resistance. Firm break there should confirm near term reversal for 103.84 resistance and possibly above. Also, in case of another fall, strong support is expected from 85.77/92 to contain downside.
Looking ahead
The economic calendar is empty in Europe. Main focuses are on US durable goods orders and pending home sales later in the day.
GBP/USD Daily Outlook
Daily Pivots: (S1) 1.1740; (P) 1.1809; (R1) 1.1900; More...
A temporary low is formed at 1.1716 with current recovery. Intraday bias in GBP/USD is turned neutral first. Upside of recovery should be limited by 1.2002 support turned resistance to bring another fall. Break of 1.1716 will resume larger down trend to 1.1409 long term support.
In the bigger picture, fall from 1.4248 (2018 high) could be a leg inside the pattern from 1.1409 (2020 low), or resuming the longer term down trend. Deeper decline is expected as long as 1.2292 resistance holds. Next target is 1.1409 low. However, firm break of 1.2292 will bring stronger rise back to 55 week EMA (now at 1.2859).
Economic Indicators Update
| GMT | Ccy | Events | Actual | Forecast | Previous | Revised |
|---|---|---|---|---|---|---|
| 12:30 | USD | Durable Goods Orders Jul | 0.60% | 2.00% | ||
| 12:30 | USD | Durable Goods Orders ex Transportation Jul | 0.20% | 0.40% | ||
| 14:00 | USD | Pending Home Sales M/M Jul | -2.50% | -8.60% | ||
| 14:30 | USD | Crude Oil Inventories | -7.1M |