Sample Category Title
GBP/USD Daily Outlook
Daily Pivots: (S1) 1.1740; (P) 1.1809; (R1) 1.1900; More...
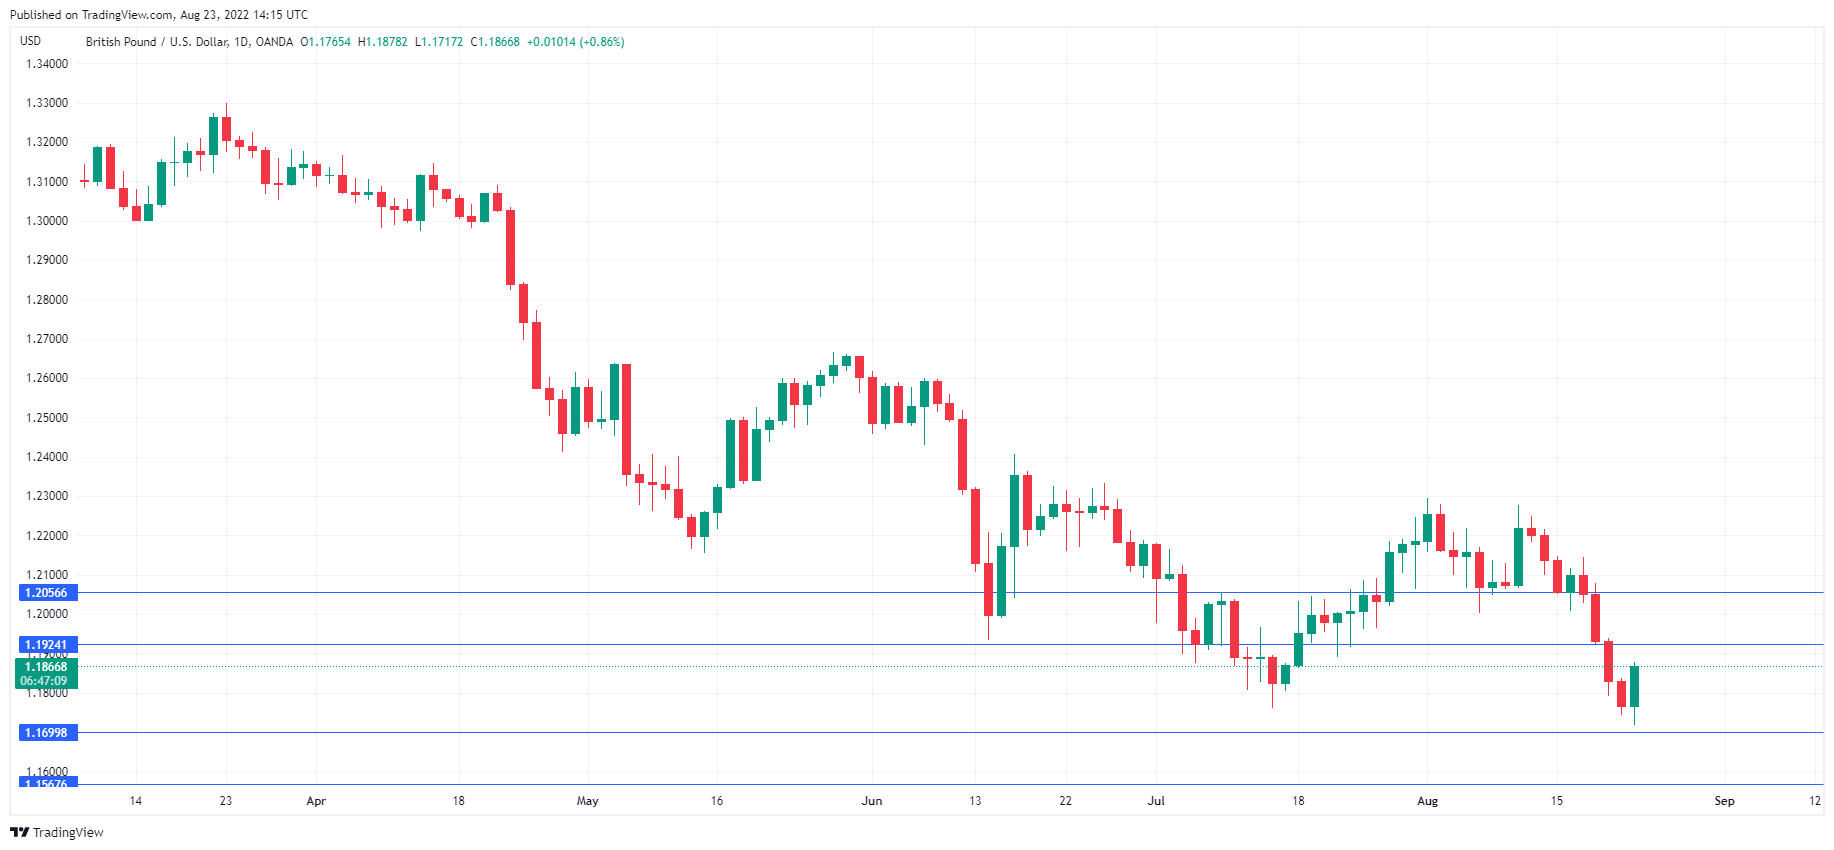
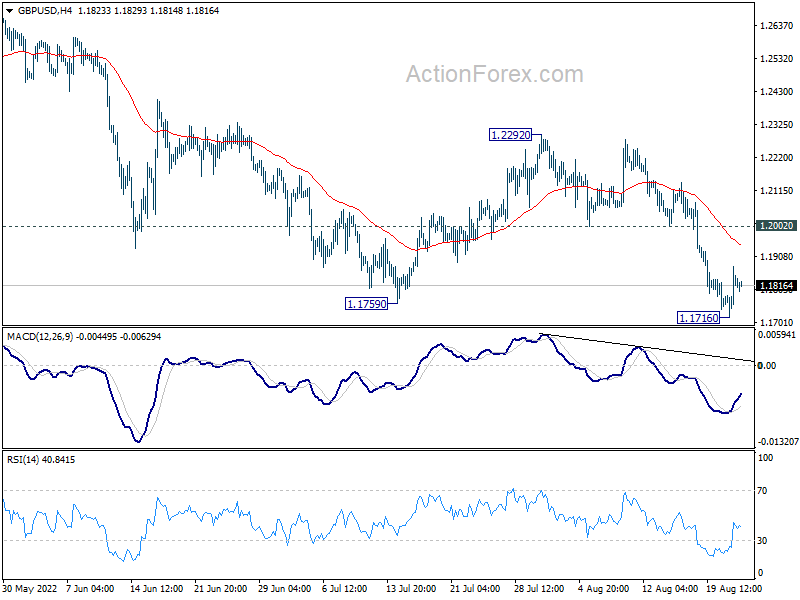
A temporary low is formed at 1.1716 with current recovery. Intraday bias in GBP/USD is turned neutral first. Upside of recovery should be limited by 1.2002 support turned resistance to bring another fall. Break of 1.1716 will resume larger down trend to 1.1409 long term support.
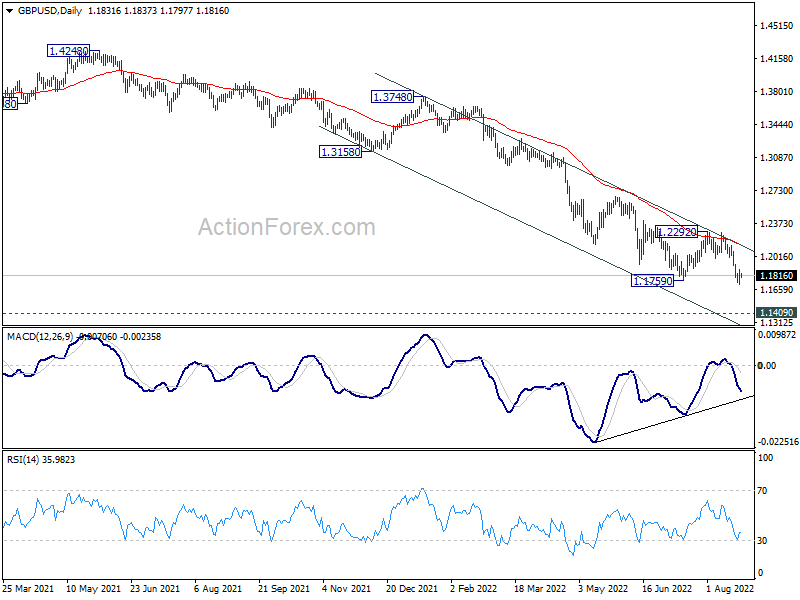
In the bigger picture, fall from 1.4248 (2018 high) could be a leg inside the pattern from 1.1409 (2020 low), or resuming the longer term down trend. Deeper decline is expected as long as 1.2292 resistance holds. Next target is 1.1409 low. However, firm break of 1.2292 will bring stronger rise back to 55 week EMA (now at 1.2859).
Dollar Rally Halted, Yen Picking Up Momentum
Dollar's rally was choked off by terrible PMI data, in particular services, overnight. But the greenback is trying to regain some footing in Asian session. It's too early to say that the bullish trend in Dollar has reversed. Traders are just holding their bets for now, awaiting more guidance from Fed Chair Jerome Powell at the Jackson Hole symposium. For now, Aussie and Kiwi are the stronger ones with Yen. Euro and Sterling are overwhelmingly weak. Dollar is mixed with Canadian.
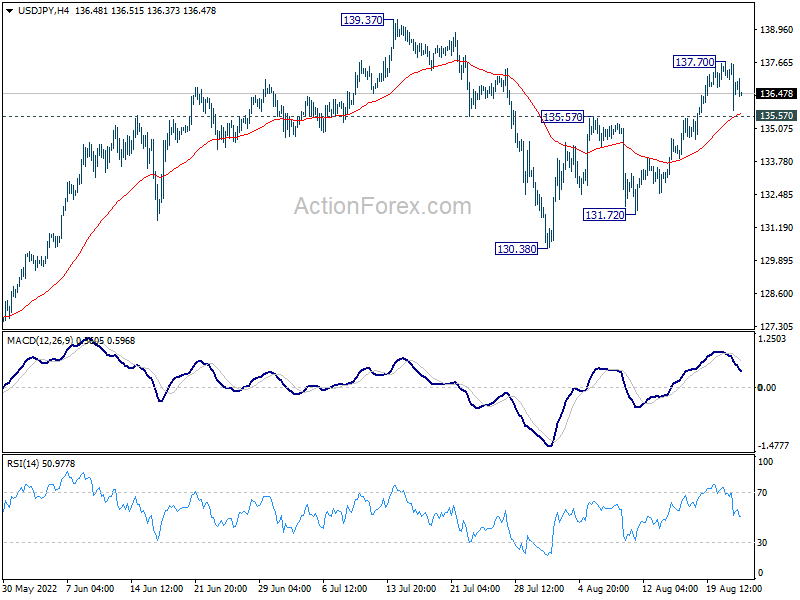
Technically, USD/JPY's rebound from 130.38 is seen as the second leg of the corrective pattern from 139.37. It might have completed with three waves up to 137.70 already. Firm break of 135.57 resistance turned support will argue that the third leg has started back towards 130.38 support. If happens, it's likely more of a boost to Yen then a drag on Dollar elsewhere.
In Asia, at the time of writing, Nikkei is down -0.45%. Hong Kong HSI is down -1.34%. China Shanghai SSE is down -1.29%. Singapore Strait Times is down -0.39%. Japan 10-year JGB yield is down -0.0011 at 0.221. Overnight, DOW dropped -0.47%. S&P 500 dropped -0.22%. NASDAQ dropped -0.00%. 10-year yield rose 0.017 to 3.054.
Fed Kashkari: US economy in a completely unbalanced situation
Minneapolis Fed President Neel Kashkari said yesterday that the US economy is in a "completely unbalanced situation" of "maximum employment" and "very high inflation". He said, "it's very clear: We need to tighten monetary policy to bring things into balance."
"When inflation is 8% or 9%, we run the risk of unanchoring inflation expectations and leading to very bad outcomes that would cause us to have to be very aggressive -- Volcker-esque -- to then re-anchor them," he said.
"We needed to err on making sure we are getting inflation and only relax when we see compelling evidence that inflation is well on its way back down to 2%," he added.
WTI oil ready for a bounce through 100
Oil prices rebounded this week on the prospect of production cut by OPEC+. Saudi Energy Minister Prince Abdulaziz bin Salman was quoted earlier that OPEC+ has the commitment, flexibility, and means to deal with challenges and provide guidance including cutting production at any time and in different forms. However, upside is so far capped as Reuters, based on information from nine OPEC sources, said productions cuts may not be imminent, and might coincide with Iran's return to the market.
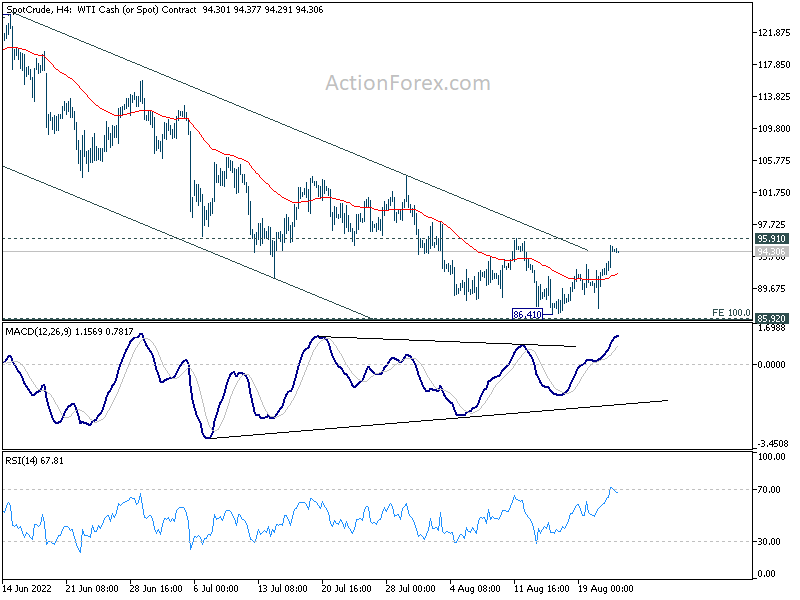
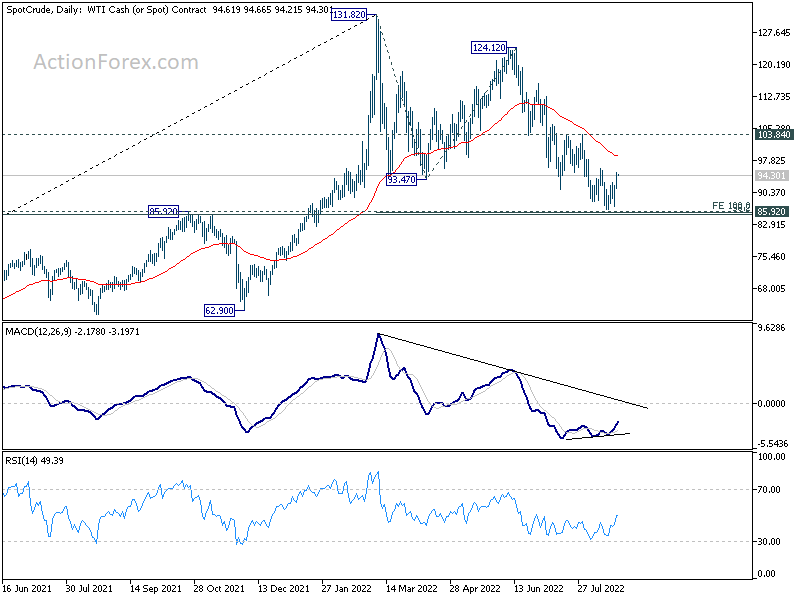
Technically, the conditions for a stronger bounce for WTI crude oil are there. Bullish convergence conditions are seen in both 4 hour and daily MACD. A near term falling channel resistance is already broken. More importantly, 86.41 is close enough to an important cluster support at 85.92, with 100% projection of 131.82 to 93.47 from 124.12 at 85.77.
Immediate focus is now on 95.91 resistance. Firm break there should confirm near term reversal for 103.84 resistance and possibly above. Also, in case of another fall, strong support is expected from 85.77/92 to contain downside.
Looking ahead
The economic calendar is empty in Europe. Main focuses are on US durable goods orders and pending home sales later in the day.
GBP/USD Daily Outlook
Daily Pivots: (S1) 1.1740; (P) 1.1809; (R1) 1.1900; More...
A temporary low is formed at 1.1716 with current recovery. Intraday bias in GBP/USD is turned neutral first. Upside of recovery should be limited by 1.2002 support turned resistance to bring another fall. Break of 1.1716 will resume larger down trend to 1.1409 long term support.
In the bigger picture, fall from 1.4248 (2018 high) could be a leg inside the pattern from 1.1409 (2020 low), or resuming the longer term down trend. Deeper decline is expected as long as 1.2292 resistance holds. Next target is 1.1409 low. However, firm break of 1.2292 will bring stronger rise back to 55 week EMA (now at 1.2859).
Economic Indicators Update
| GMT | Ccy | Events | Actual | Forecast | Previous | Revised |
|---|---|---|---|---|---|---|
| 12:30 | USD | Durable Goods Orders Jul | 0.60% | 2.00% | ||
| 12:30 | USD | Durable Goods Orders ex Transportation Jul | 0.20% | 0.40% | ||
| 14:00 | USD | Pending Home Sales M/M Jul | -2.50% | -8.60% | ||
| 14:30 | USD | Crude Oil Inventories | -7.1M |
WTI oil ready for a bounce through 100
Oil prices rebounded this week on the prospect of production cut by OPEC+. Saudi Energy Minister Prince Abdulaziz bin Salman was quoted earlier that OPEC+ has the commitment, flexibility, and means to deal with challenges and provide guidance including cutting production at any time and in different forms. However, upside is so far capped as Reuters, based on information from nine OPEC sources, said productions cuts may not be imminent, and might coincide with Iran's return to the market.
Technically, the conditions for a stronger bounce for WTI crude oil are there. Bullish convergence conditions are seen in both 4 hour and daily MACD. A near term falling channel resistance is already broken. More importantly, 86.41 is close enough to an important cluster support at 85.92, with 100% projection of 131.82 to 93.47 from 124.12 at 85.77.
Immediate focus is now on 95.91 resistance. Firm break there should confirm near term reversal for 103.84 resistance and possibly above. Also, in case of another fall, strong support is expected from 85.77/92 to contain downside.
Technical Outlook and Review
USD/JPY:
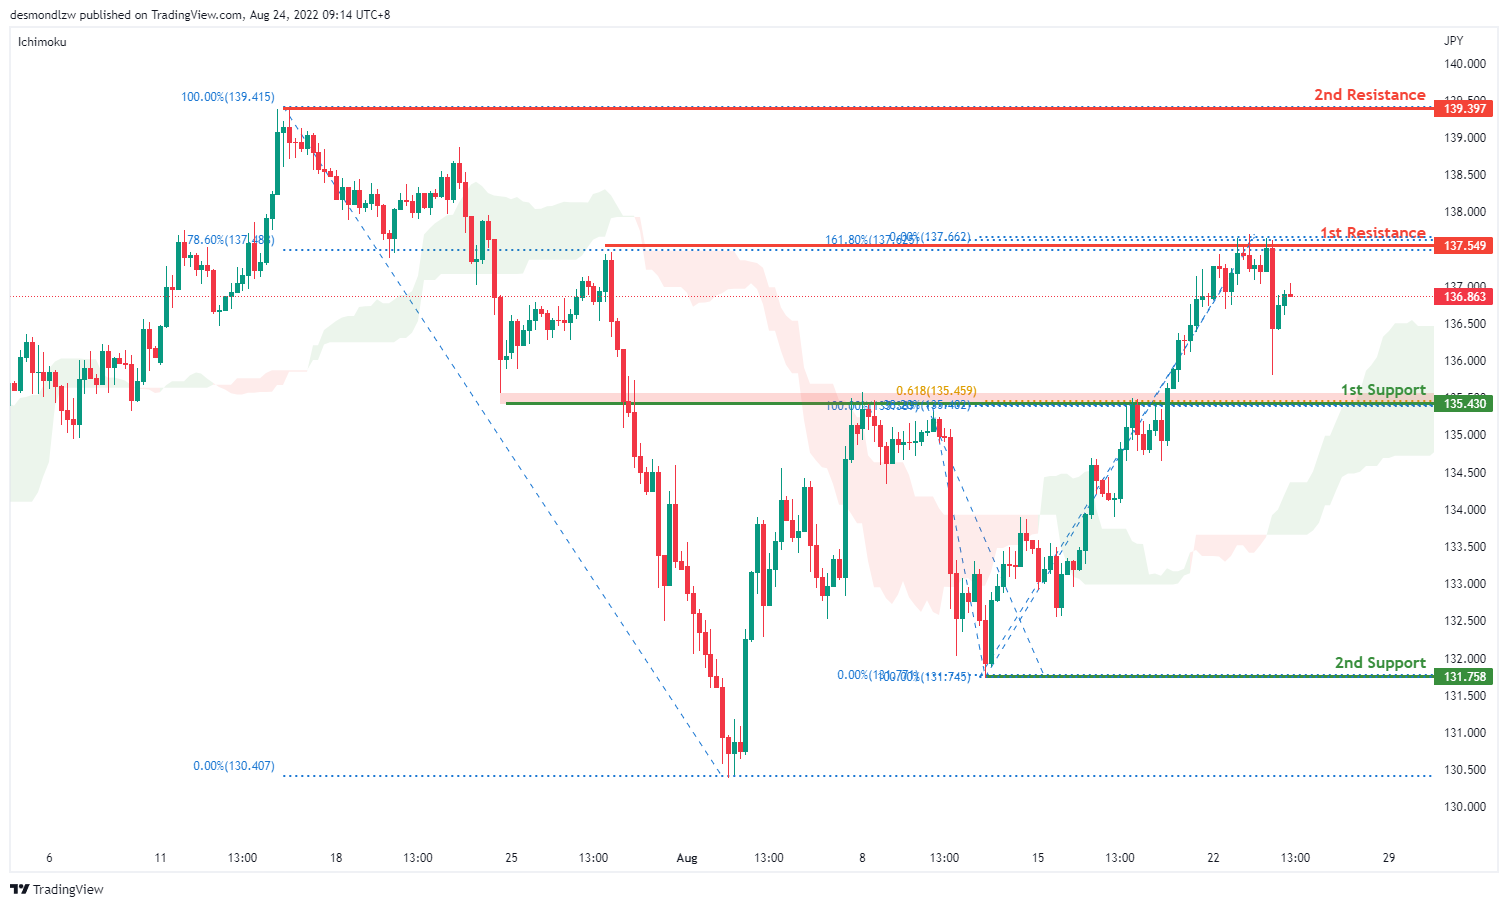
On the H4 chart, price has confirmed a bullish momentum breaking the previous high and tested the first resistance at 137.549 where the 78.6% fibonacci retracement and 161.8% extension sits. It has pulled back slightly but if bullish momentum continues, it will bring the price to 139.397 where the swing high sits. Alternatively if price pulls back, it should test the first support at 135.430 where the 61.8% projection sits and the second support at 131.758 where the swing low sits
Areas of consideration:
- H4 time frame, 1st resistance at 137.549
- H4 time frame, 1st support at 135.430
DXY:
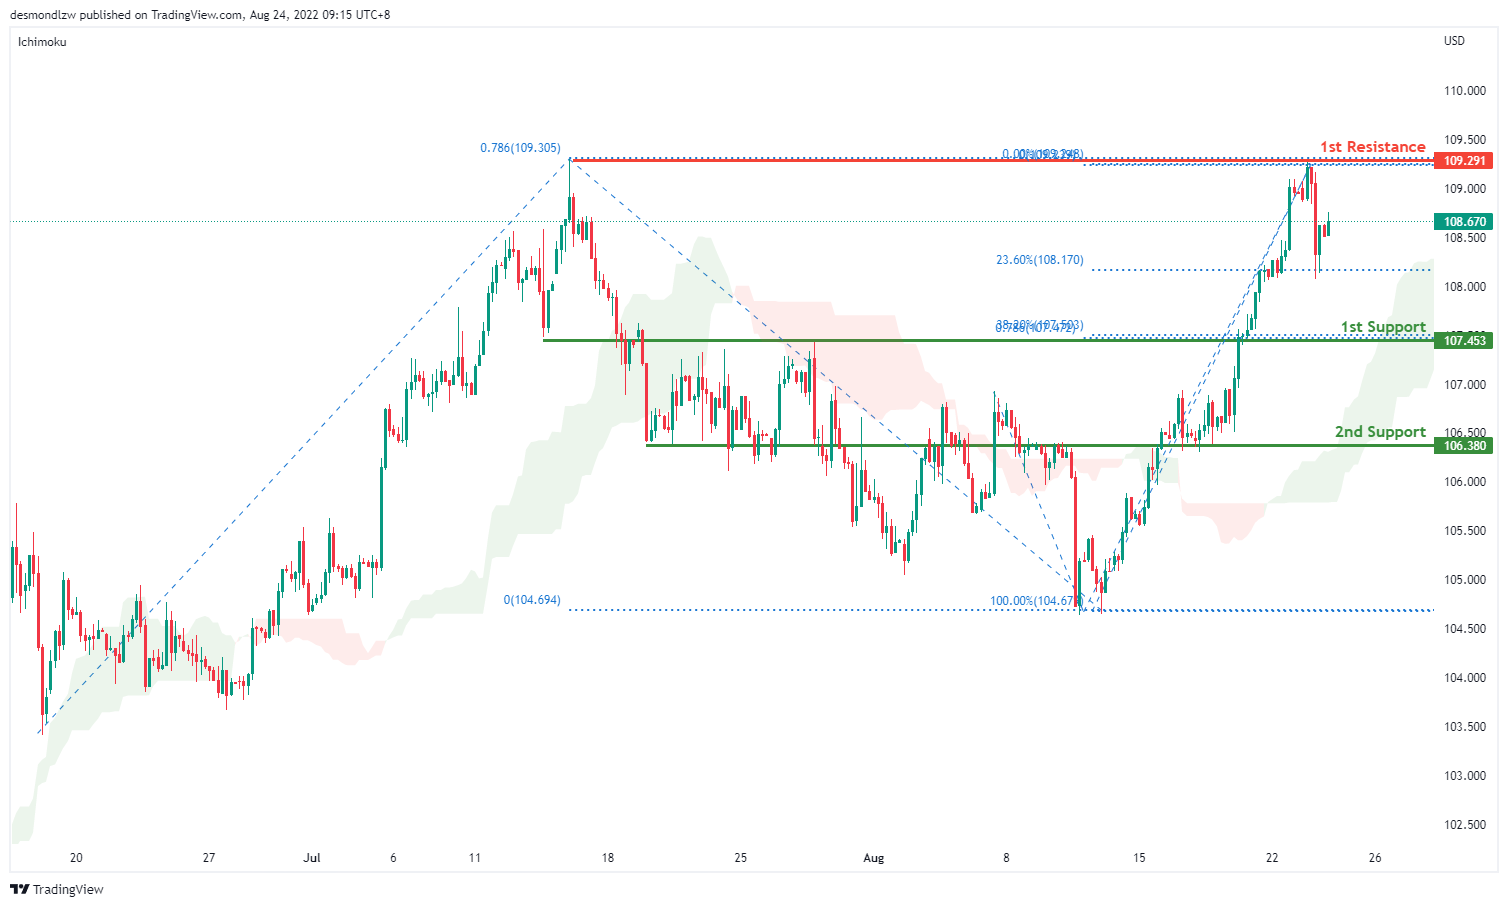
On the H4, prices seem to be moving in an ascending trend and is in a bullish momentum. Price has tested first resistance at 109.291 where the 78.6% Fibonacci projection and the previous swing high sits and has pulled back slightly to the 23.6% retracement levels. If price fails to break the first resistance, it should pull back to test the first support at 107.453 where the 38.2% retracement and 78.6% projection sits and subsequently the second support at 106.380 where the 61.8% retracement sits
Areas of consideration:
- H4 time frame, 1st resistance at 109.291
- H4 time frame, 1st support at 107.453
EUR/USD :
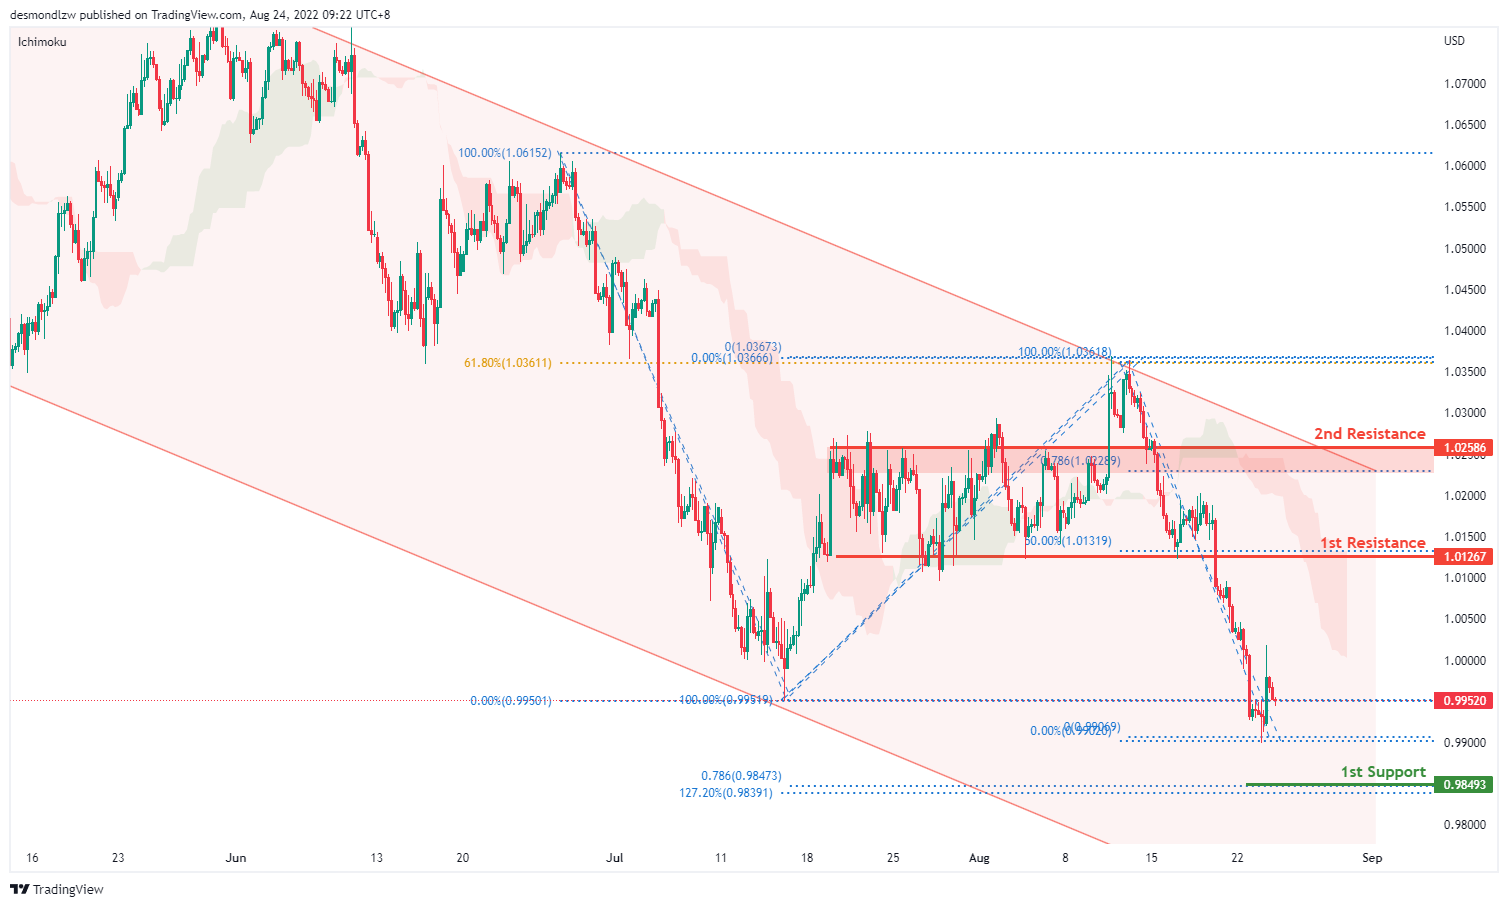
On the H4, prices have broken the ascending trend and are below the ichimoku indicator, we are bearish bias. Prices are testing the first support at 0.9955 where the 61.8% projection sits. Alternatively, prices could pull back to test the first resistance at 1.0116 where the previous swing low sits and subsequently the second resistance at 1.0353 where the 61.8% retracement and swing high sits
Areas of consideration :
- H4 1st resistance at 1.0116
- H4 1st support at 0.9955
GBP/USD:
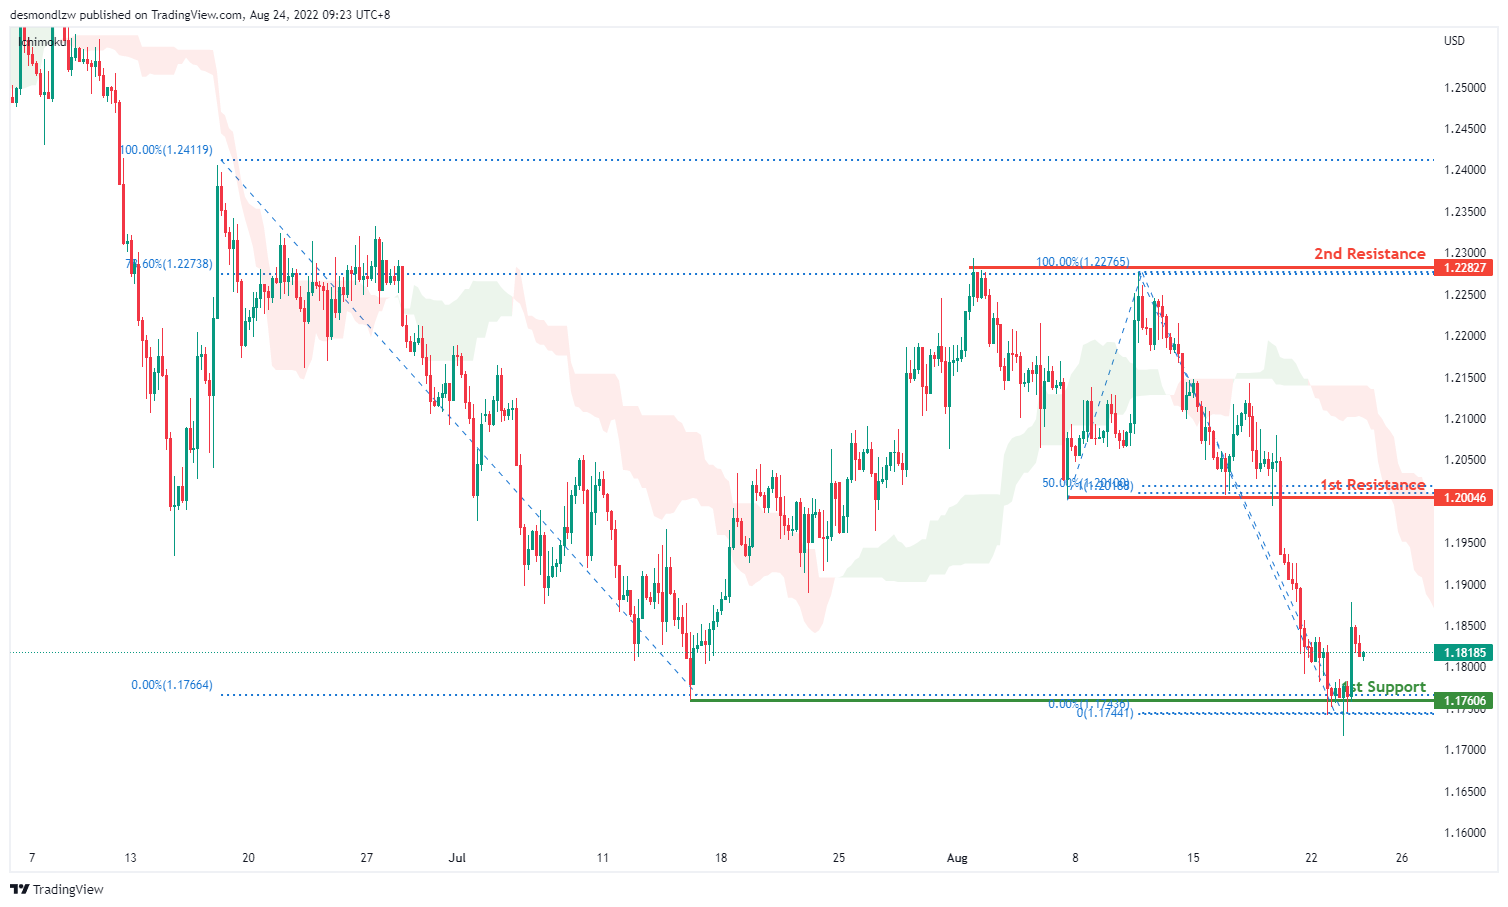
On the H4, prices seem to be in a bearish momentum. It is currently testing the first support at 1.1760 where the swing low sits. Alternatively, price can pull back to test the first resistance at 1.2004 where the 50% retracement and 100% projection sits. Subsequently testing the second resistance at 1.2282 where 78.6% retracement and the swing high sits
Areas of consideration:
- H4 1st resistance at 1.2004
- H4 1st support at 1.1760
USD/CHF:
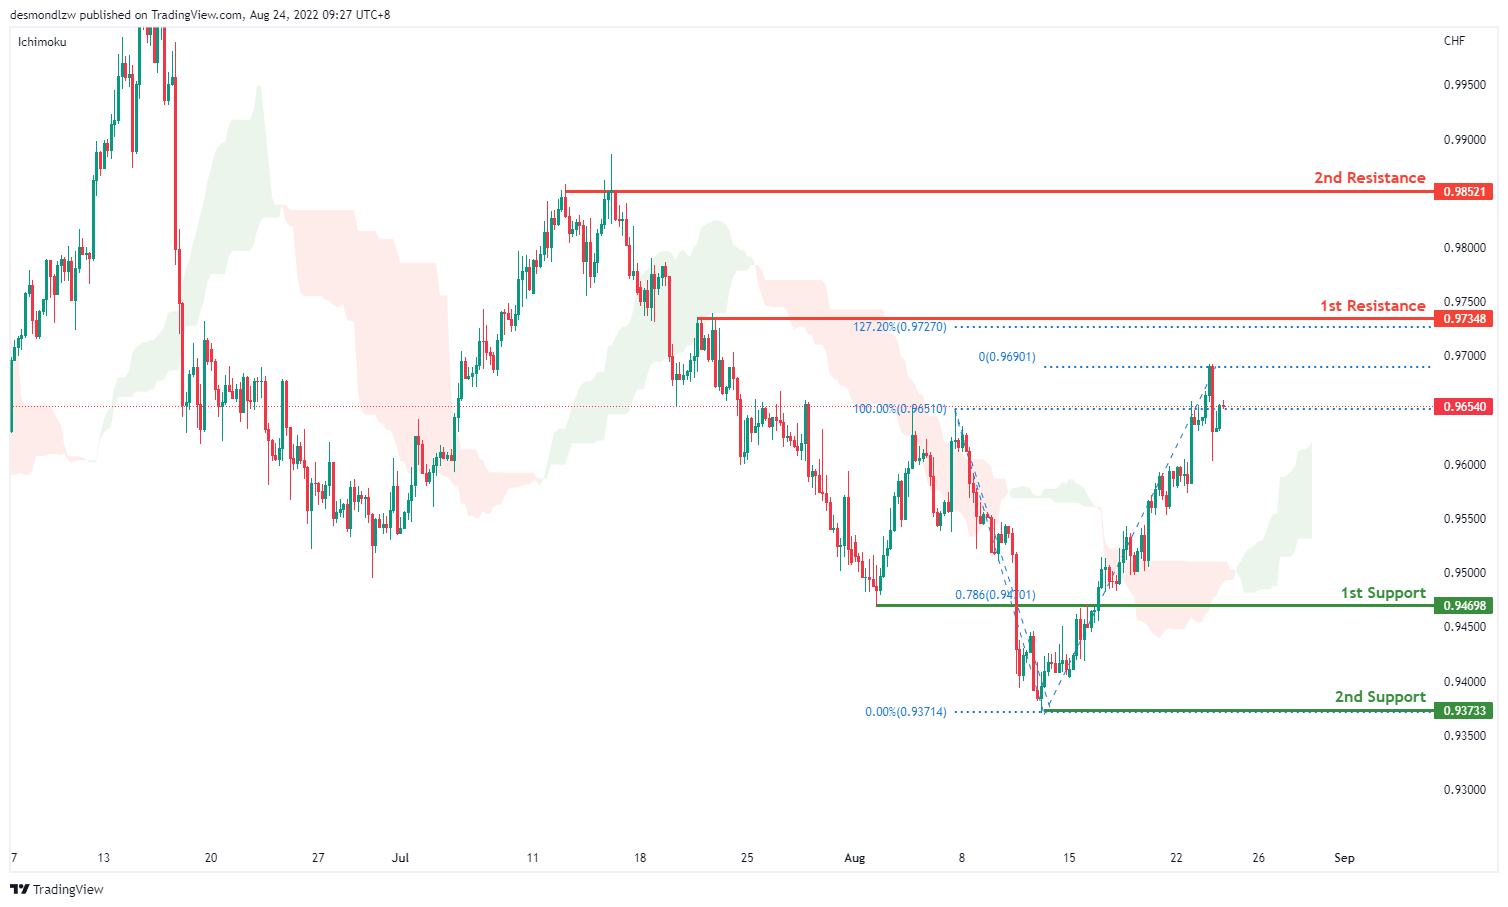
On the H4, with prices moving above the ichimoku cloud and breaking the descending trend, we are bullish bias. Price is testing the first resistance at 0.9657 where the previous swing high sits. If price continues with the bullish momentum it will test the second resistance at 0.9734. Alternatively, prices could test the intermediate support at 0.9469 where the swing low sits and then the first support at 0.9369 where the 78.6% fibonacci retracement sits
Areas of consideration
- H4 1st support at 0.9369
- H4 1st resistance at 0.9657
XAU/USD (GOLD):
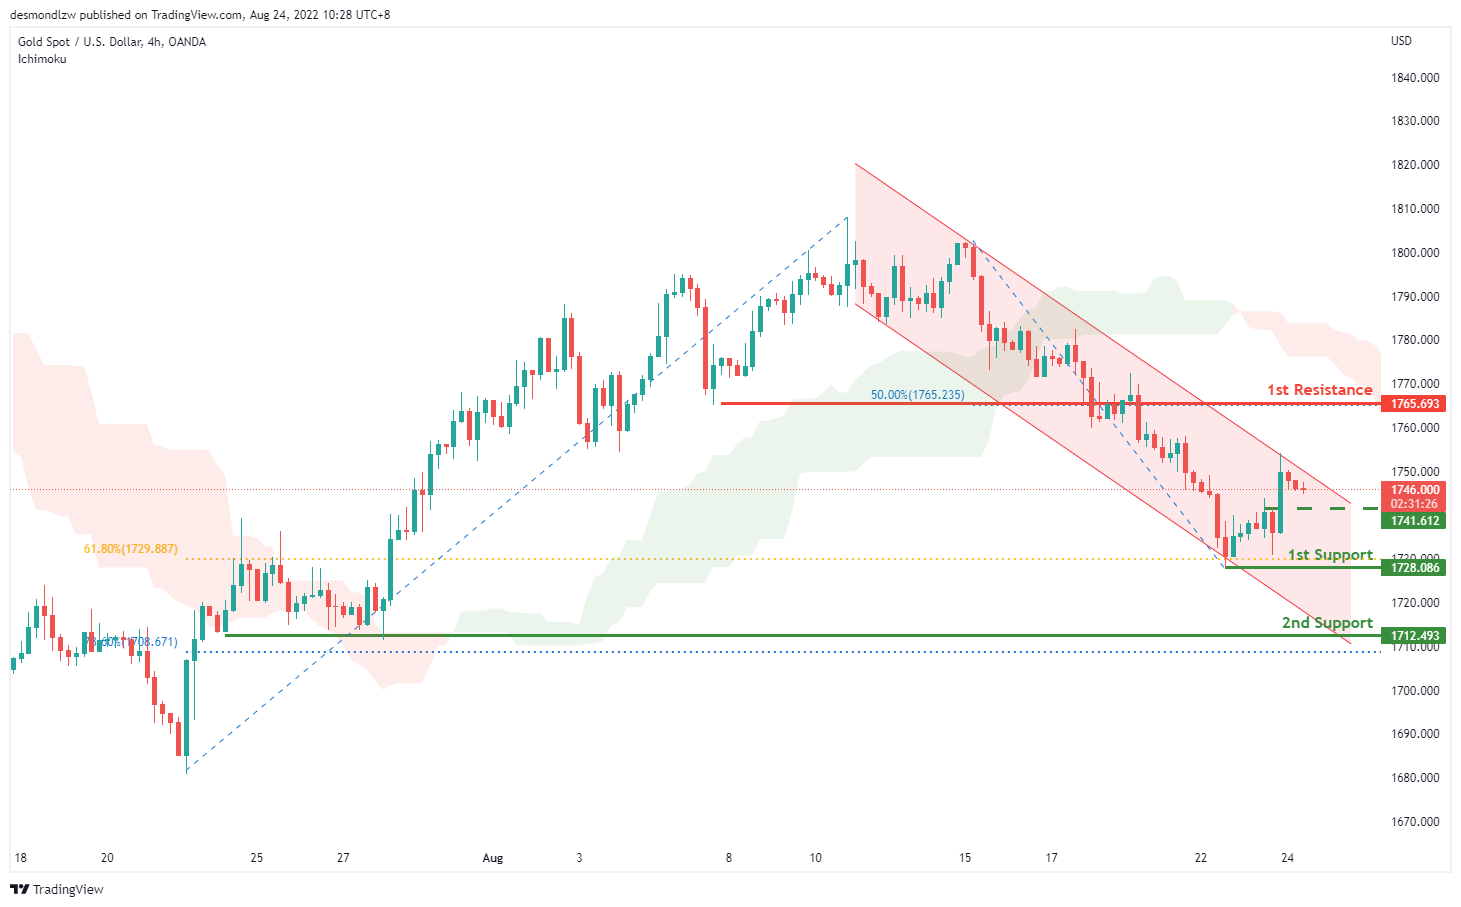
On the H4, with prices moving within the descending trendline, below ichimoku cloud, we have a bearish bias that the price may drop to the 1st support at 1728.086, which is in line with the 61.8% fibonacci retracement, if the price break this level, it may drop to the 2nd support at 1712.493, where the 78.6% fibonacci retracement and swing low are. Alternatively, the price may pullback and rise to the 1st resistance at 1765.693, where the 50% fibonacci retracement is. Take note the 1741.612 could be our intermediate support, which is in line with the pullback support.
Areas of consideration:
- H4 time frame, 1st support at 1728.086
- H4 time frame, 2nd support at 1712.493
AUD/USD:
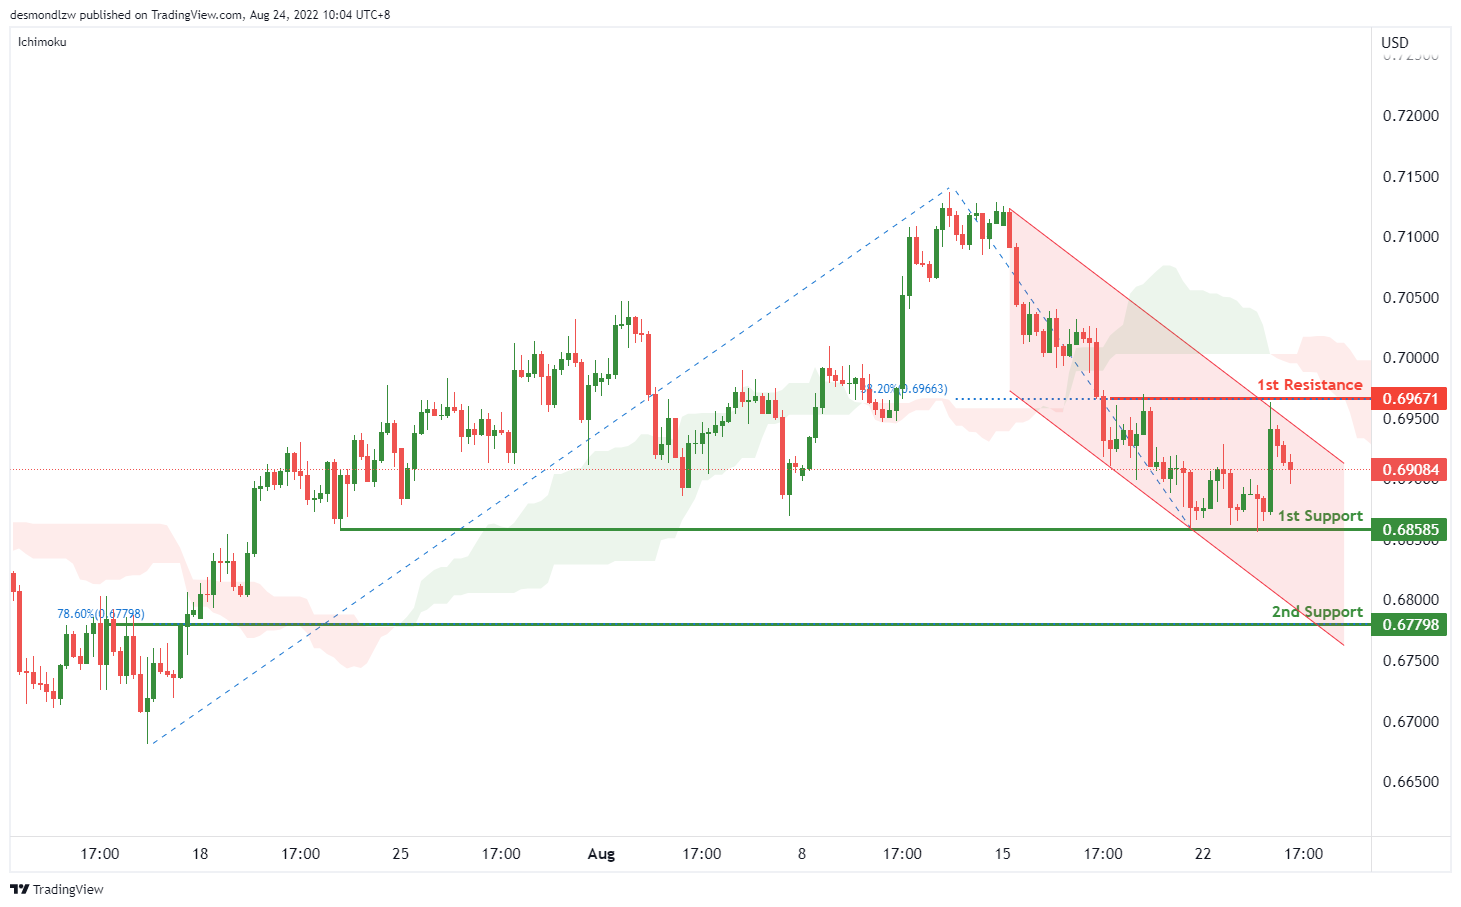
On the H4, with the price going within the descending channel and below ichimoku cloud, we have a bearish bias that the price may drop to the 1st support at 0.68585, which is in line with the previous swing low. If the price breaks the 1st support, we can expect it to drop to the 2nd support at 0.67798, where the 78.6% fibonacci retracement is. Alternatively, the price may rise to the 1st resistance at 0.69671, where the swing high and 38.2% fibonacci retracement are.
Areas of consideration
- H4 1st support at 0.68585
- H4 2nd support at 0.67798
NZD/USD:
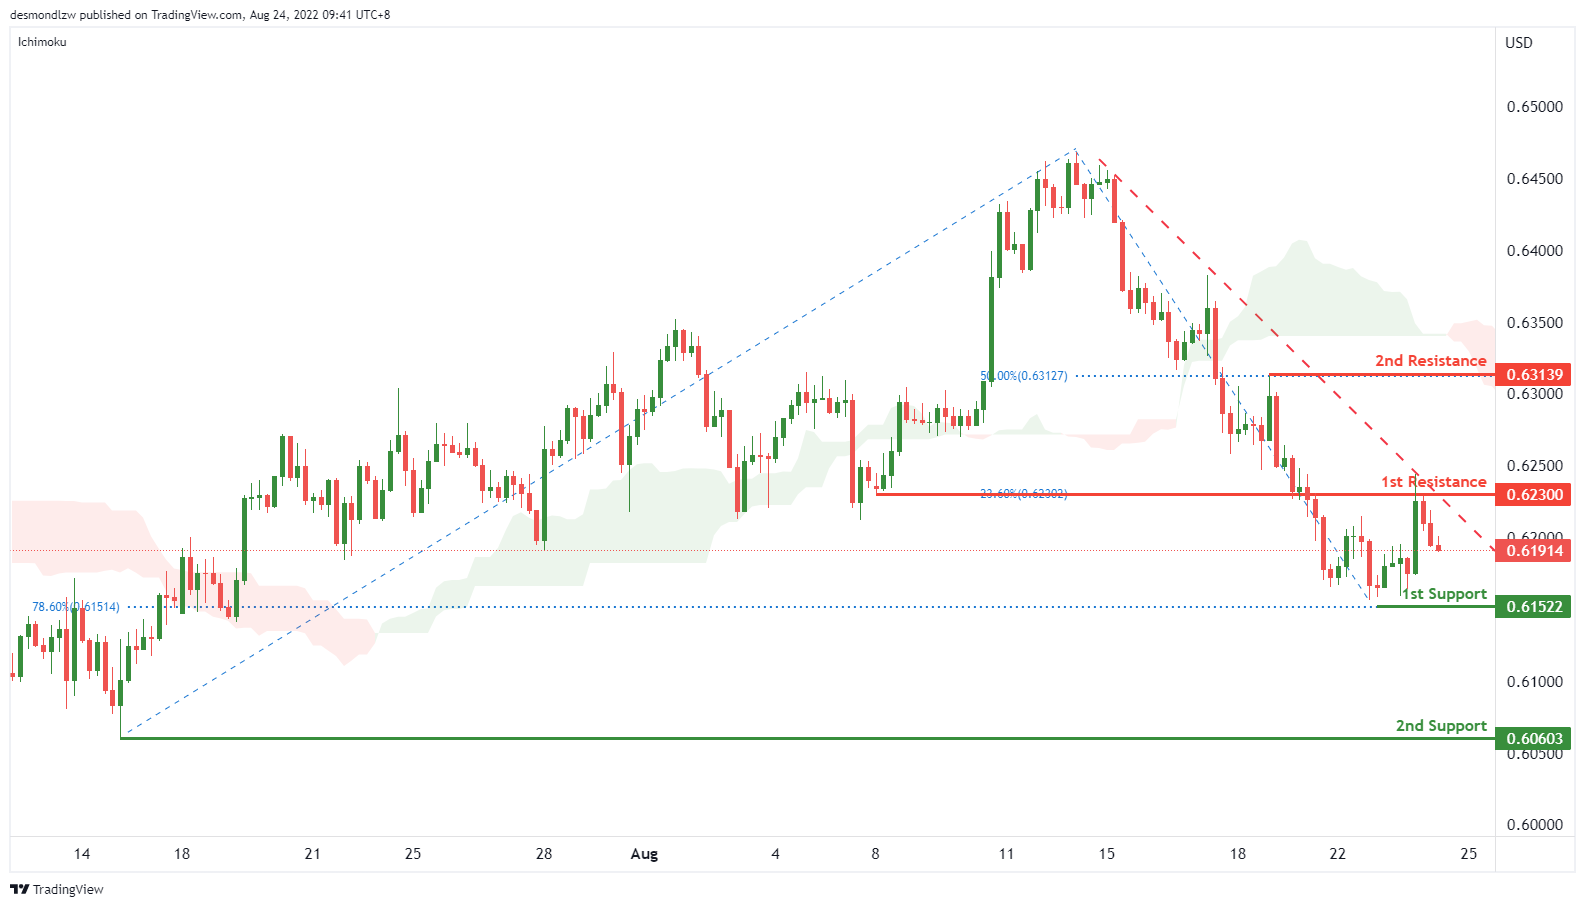
On the H4, with the price moving within the descending trendline, below ichimoku cloud, we have a bearish bias that the price may drop to the 1st support at 0.61522, which is in line with the 78.6% fibonacci retracement and pervious swing low, if the price continue dropping, the price may drop to the 2nd support at 0.60603, which is in line with the swing low. Alternatively, the price may rise to the 1st resistance at0.62300, where the 23.6% fibonacci retracement and overlap resistance are. If the price break this resistance level, we can expect the price rise to the 2nd resistance at 0.63139, which is in line with the swing high and 50% fibonacci retracement.
Areas of consideration:
- H4 time frame, 1st support at 0.61471
- H4 time frame, 2nd support at 0.60603
USD/CAD:
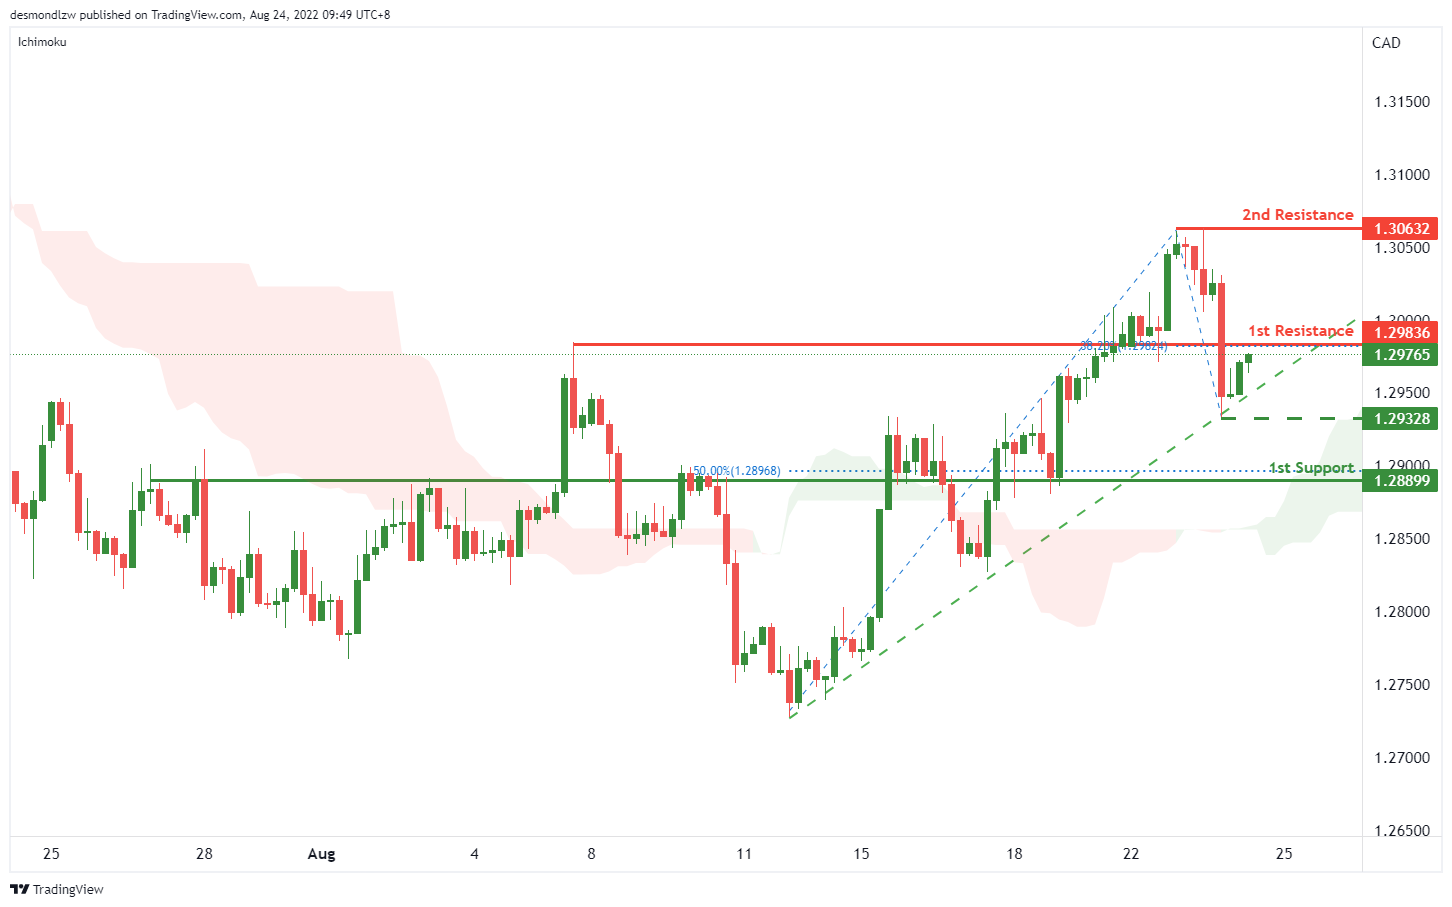
On the H4, with the price above the ichimoku cloud and moving within the ascending trendline, we have a bullish bias that if the price break the 1st resistance at 1.29836, which is the current swing high and 38.2% fibonacci retracement, the price may rise to the 2nd resistance at 1.30632, which is in line with the swing high. Alternatively, the price may drop to the 1st support at 1.28899, where the 50% fibonacci retracement is. Take note the price of 1.29328 could be the intermediate support, if the price breaks this support, the ascending trendline will be broken.
Areas of consideration:
- H4 time frame, 1st resistance at 1.29836
- H4 time frame, 2nd resistance at 1.30632
OIL:
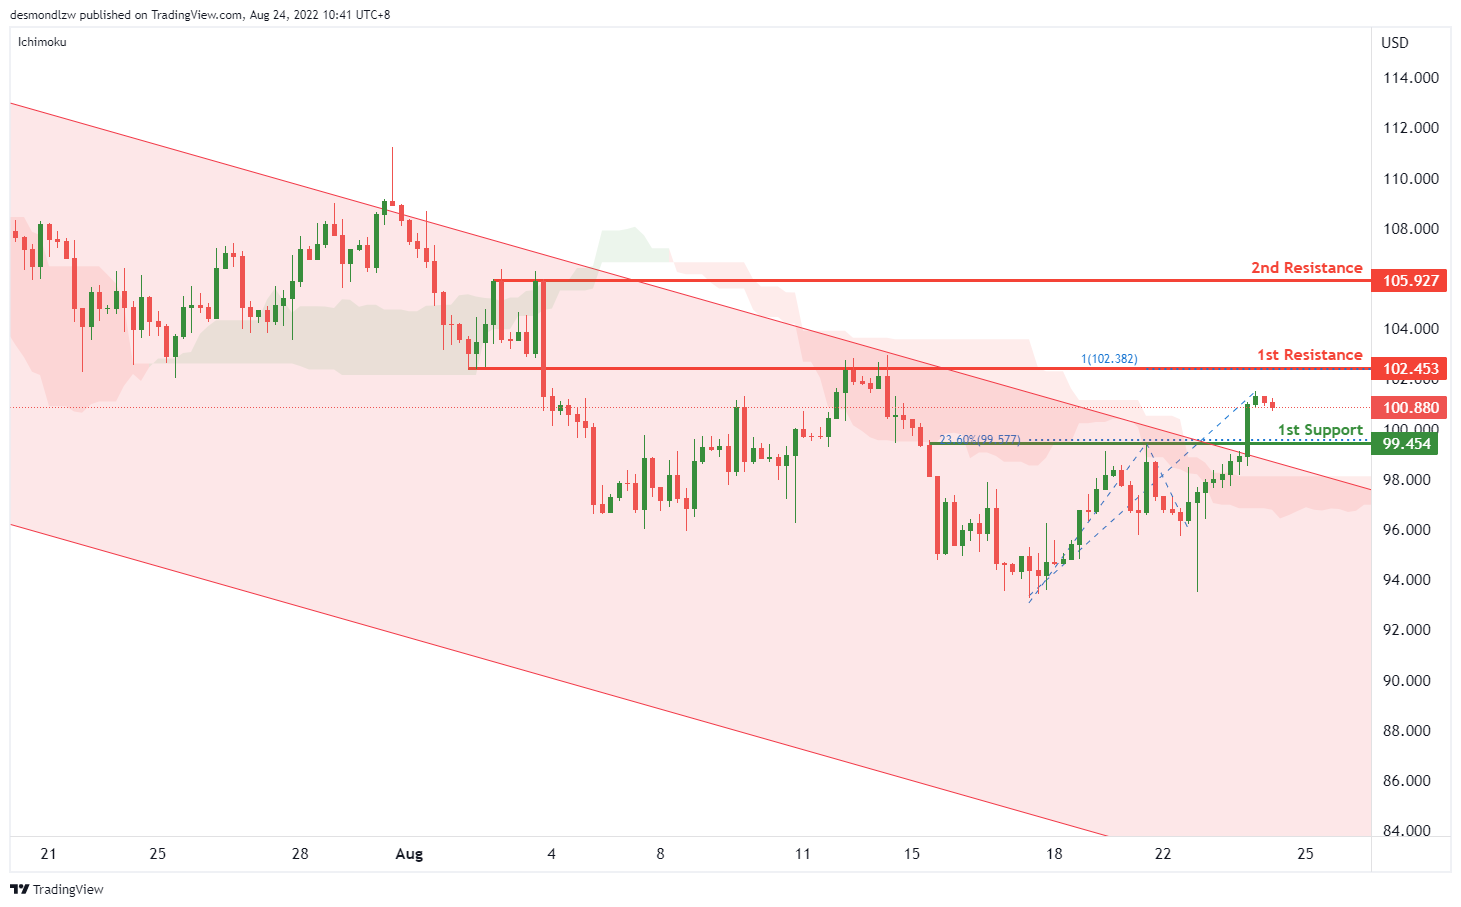
On the H4, with price breaking the descending channel and above ichimoku cloud, we have a bullish bias that the price may rise to the 1st resistance at 102.453, where the 100% fibonacci projection and overlap resistance are. If the price breaks this level, we can expect the price to rise to the 2nd resistance at 105.927, where the swing highs are. Alternatively, the price may drop to the 1st support at 99.454, where the 23.6% fibonacci retracement and pullback support are.
Areas of consideration:
- H4 time frame, 1st resistance at 102.453
- H4 time frame, 2nd resistance at 105.927
Dow Jones Industrial Average:
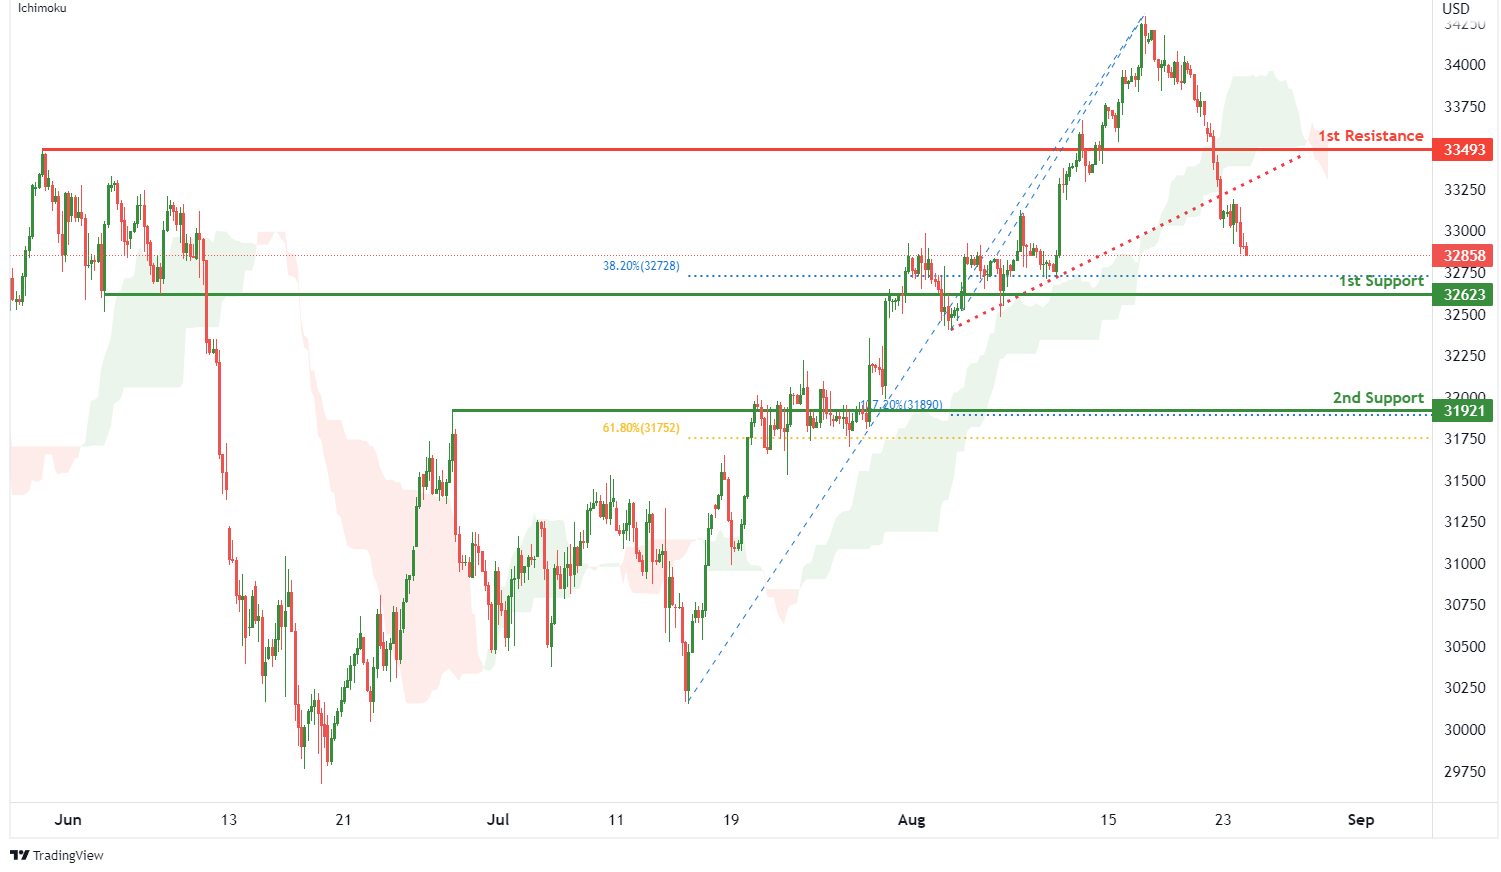
On the H4, with price breaking out of the ascending trendline and moving below the ichimoku indicator, we have a bearish bias that price will drop to 1st support at 32623 where the pullback support and 38.2% fibonacci retracement are. Once there is downside confirmation of price breaking 1st support, we would expect bearish momentum to carry price to 2nd support at 31921 where the pullback support, 61.8% fibonacci retracement and 127.2% fibonacci extension are. Alternatively, price could rise to 1st resistance at 33493 where the pullback resistance is.
Areas of consideration:
- H4 time frame, 1st resistance of 33493
- H4 time frame, 1st support at 32623
DAX:
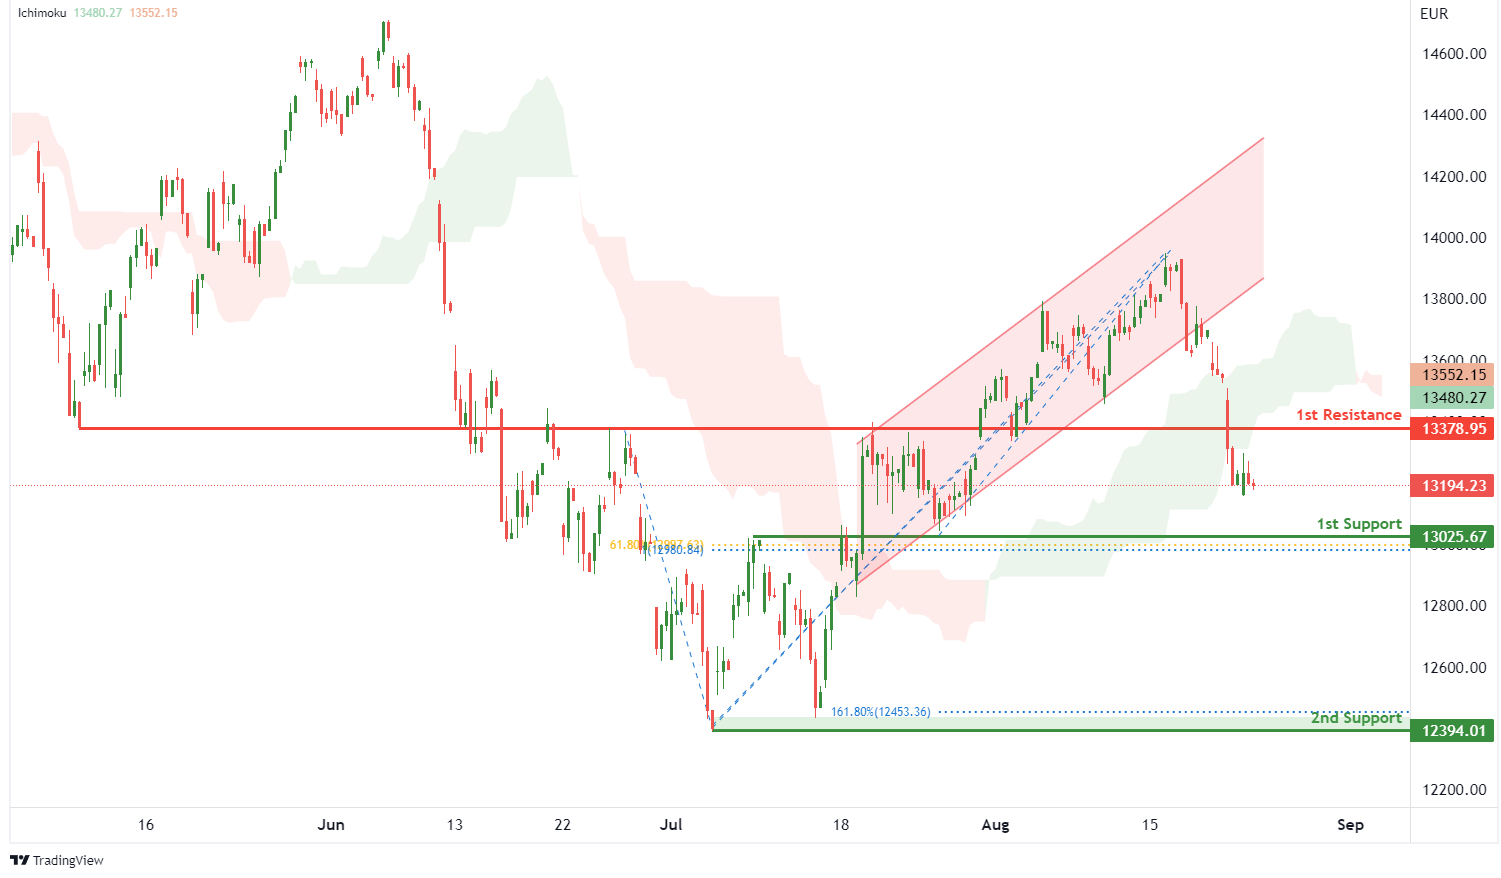
On the H4, with price breaking out of an ascending channel and moving below the ichimoku indicator, we have a bearish bias that price will drop to the 1st support at 13025.67 where the pullback support, 61.8% fibonacci retracement and 100% fibonacci projection are. Once there is downside confirmation that price has broken 1st support, we would expect bearish momentum to carry price to 2nd support at 12394.01 where the swing low support and 161.8% fibonacci extension are. Alternatively, price could rise to 1st resistance at 13378.95 where the overlap resistance is.
Areas of consideration:
- H4 time frame, 1st resistance of 13378.95
- H4 time frame, 1st support at 13025.67
ETHUSD:
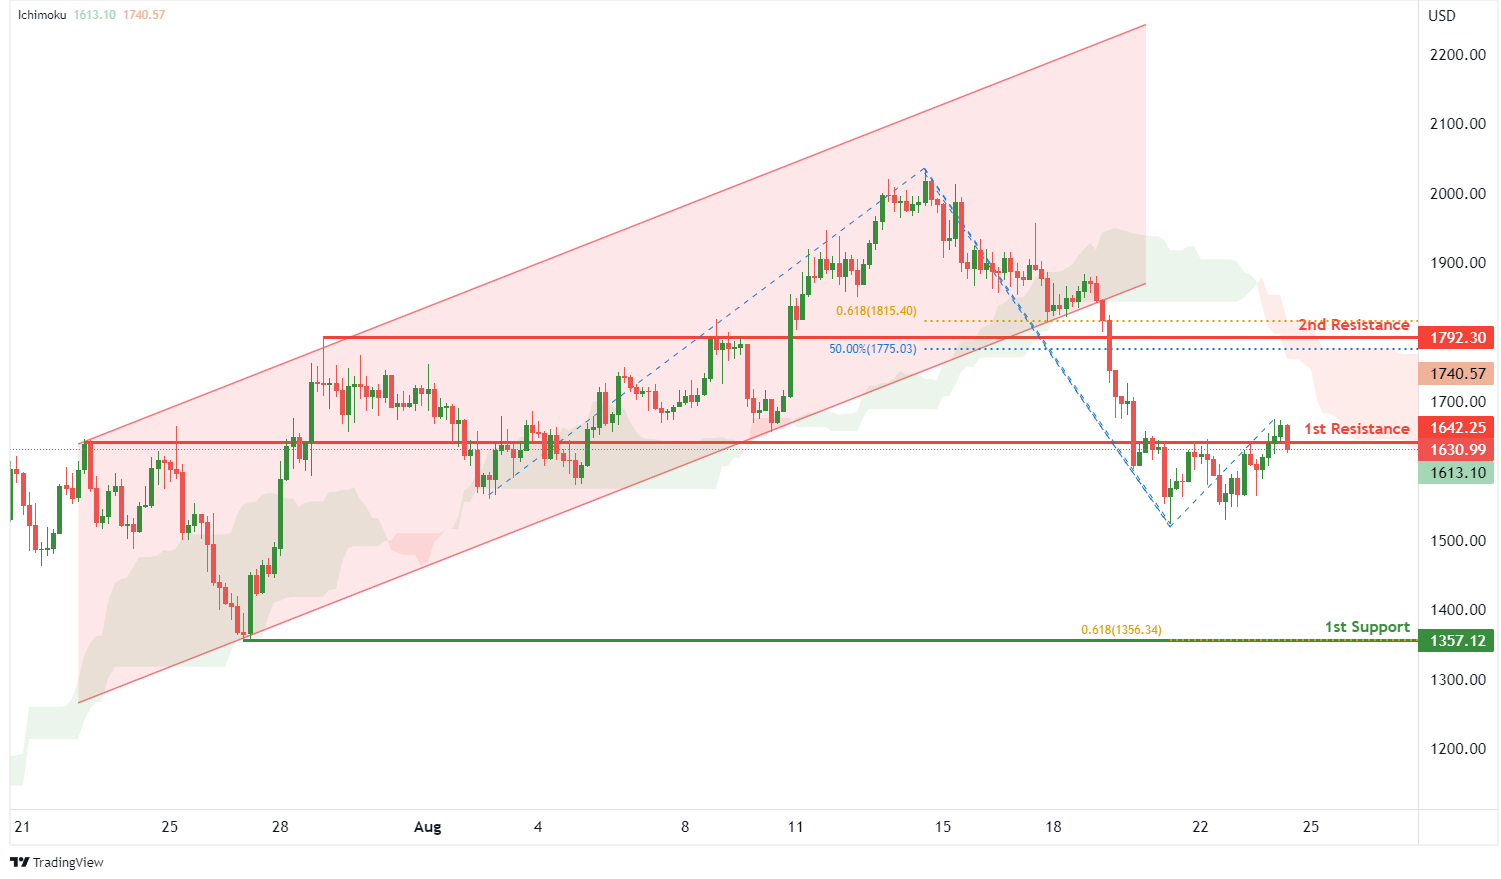
On the H4, with price breaking out of an ascending channel and moving below the ichimoku indicator, we have a bearish bias that price will drop from the 1st resistance at 1642.25 where the pullback resistance is to the 1st support at 1357.12 where the swing low support and 61.8% fibonacci projection are. Alternatively, price could break 1st resistance and rise to 2nd resistance at 1792.30 where the overlap resistance, 50% fibonacci retracement and 61.8% fibonacci projection are.
Areas of consideration:
- H4 time frame, 1st resistance of 1642.25
- H4 time frame, 1st support at 1357.12
BTCUSD:
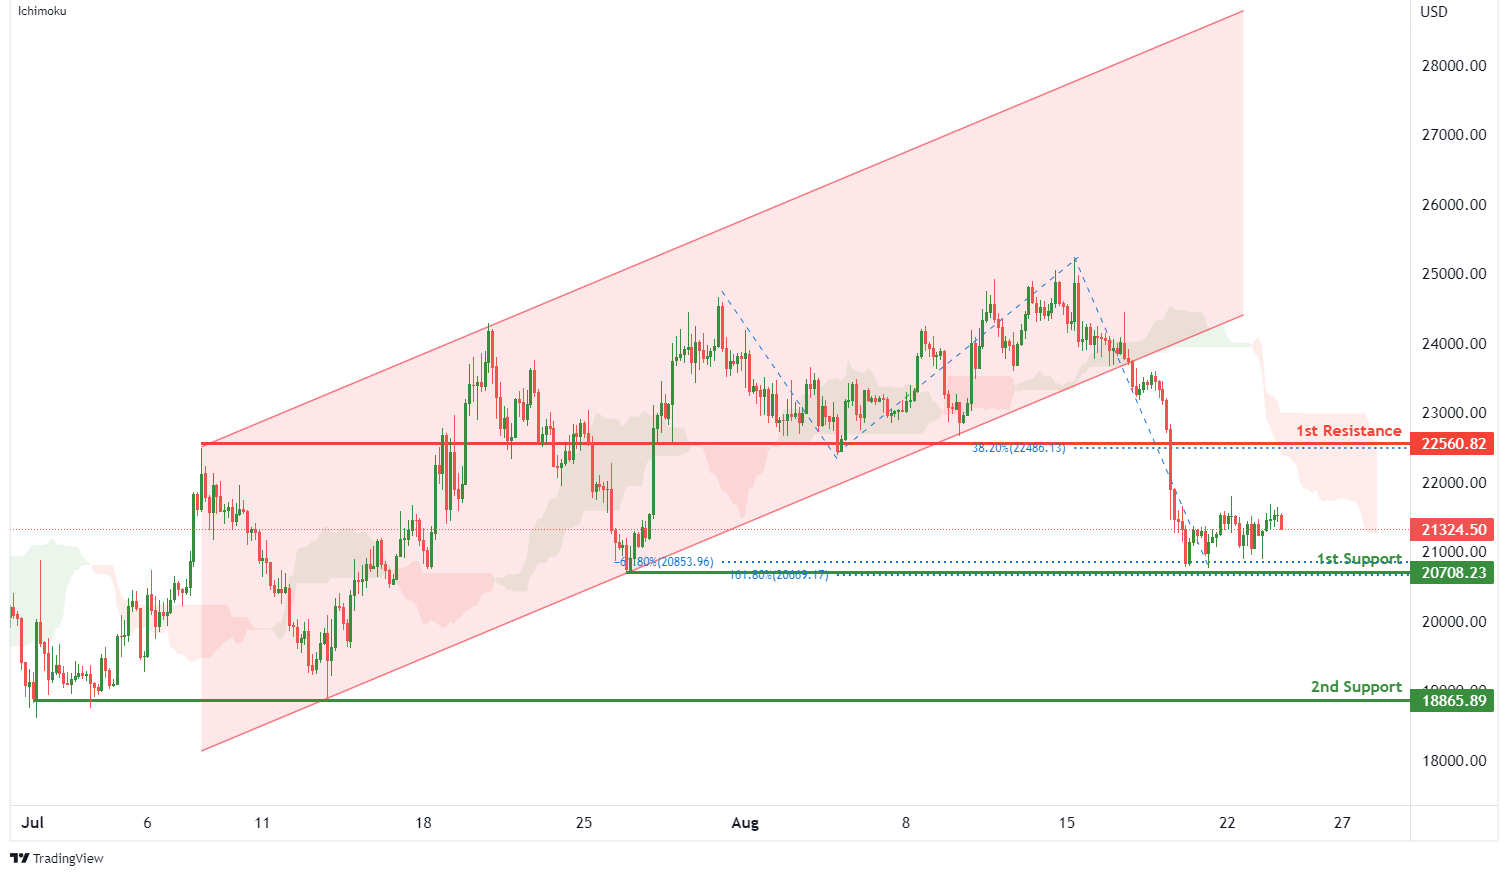
On the H4, with price breaking out of a bullish channel and moving below the ichimoku indicator, we have a bearish bias that price will drop to 1st support at 20708.23 where the -61.8% fibonacci expansion, 161.8% fibonacci extension and swing low support are. Once we have downside confirmation of price breaking 1st support structure,we would expect bearish momentum to carry price to 2nd support at 18865.89 where the swing low support is. Alternatively, price could rise to 1st resistance at 22560.82 where the pullback resistance and 38.2% fibonacci retracement are.
Areas of consideration:
- H4 time frame, 1st resistance of 22560.82
- H4 time frame, 1st support at 20708.23
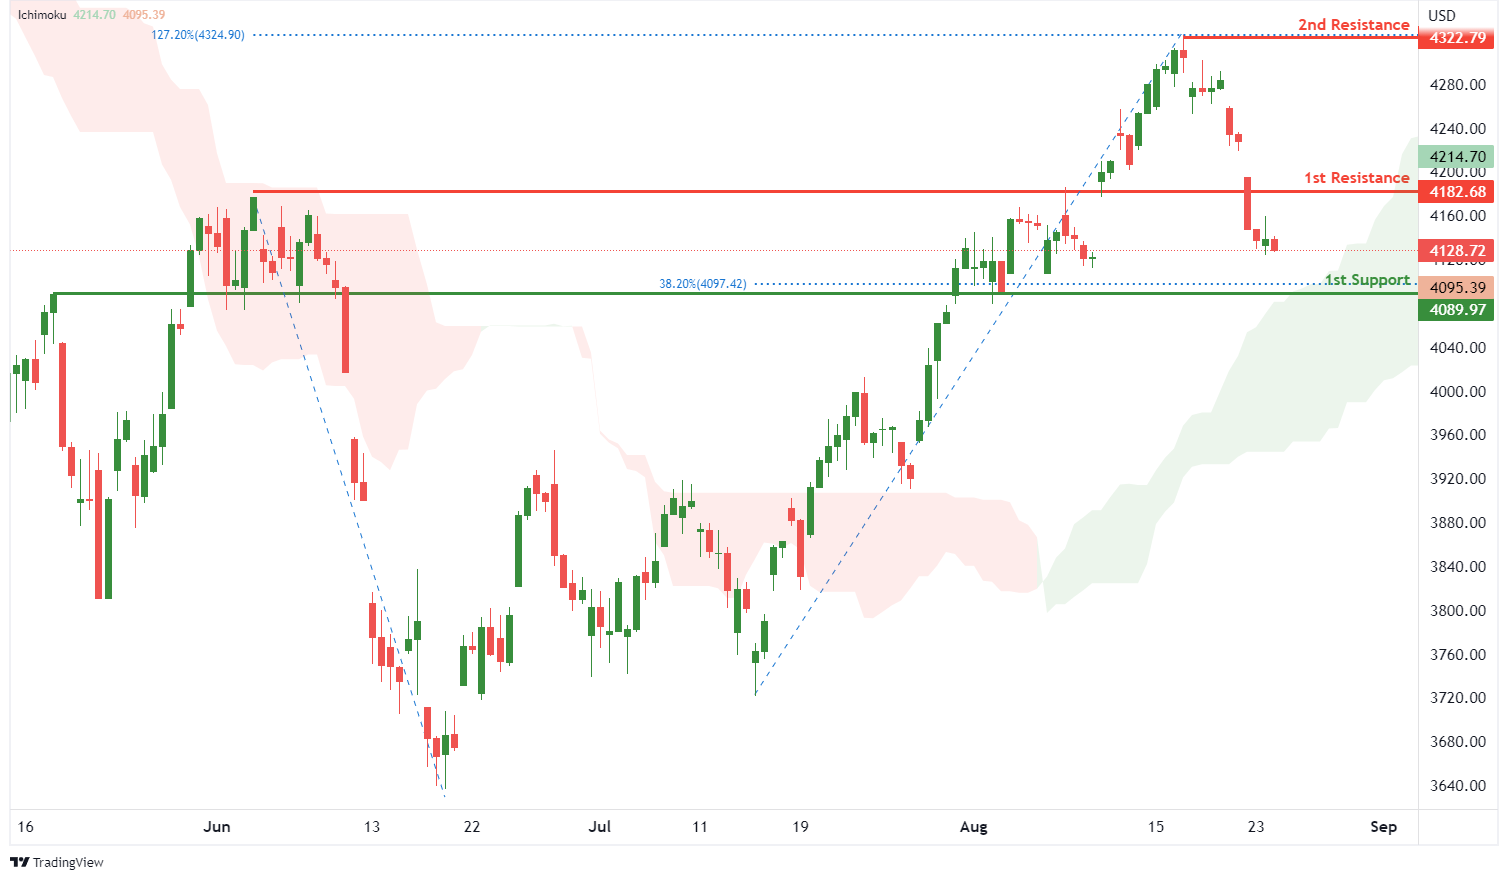
S&P 500:
On the H4, with prices moving above the ichimoku indicator, we have a bullish bias that the price will rise to 1st resistance at 4182.68 where the pullback resistance is. Once there is upside confirmation of price breaking 1st resistance structure, we would expect bullish momentum to carry price to 2nd resistance at 4322.79 where the swing high resistance and 127.2% fibonacci extension are. Alternatively, price could drop to 1st support at 4089.97 where the pullback support and 38.2% fibonacci retracement are.
Areas of consideration:
- H4 time frame, 1st resistance of 4182.68
- H4 time frame, 1st support at 4089.97
Fed Kashkari: US economy in a completely unbalanced situation
Minneapolis Fed President Neel Kashkari said yesterday that the US economy is in a "completely unbalanced situation" of "maximum employment" and "very high inflation". He said, "it's very clear: We need to tighten monetary policy to bring things into balance."
"When inflation is 8% or 9%, we run the risk of unanchoring inflation expectations and leading to very bad outcomes that would cause us to have to be very aggressive -- Volcker-esque -- to then re-anchor them," he said.
"We needed to err on making sure we are getting inflation and only relax when we see compelling evidence that inflation is well on its way back down to 2%," he added.
AUD/USD Revisits Key Support, Oil Price Recovers
Key Highlights
- AUD/USD declined sharply and tested the 0.6860 support zone.
- A key bearish trend line is forming with resistance near 0.6965 on the 4-hours chart.
- Crude oil price found support near $87.20 and recovered above $92.00.
- The US Manufacturing PMI declined from 52.2 to 51.3 in August 2022 (Preliminary).
AUD/USD Technical Analysis
The Aussie Dollar started a major decline from well above 0.7100 against the US Dollar. AUD/USD traded below the 0.7000 support zone to move into a bearish zone.
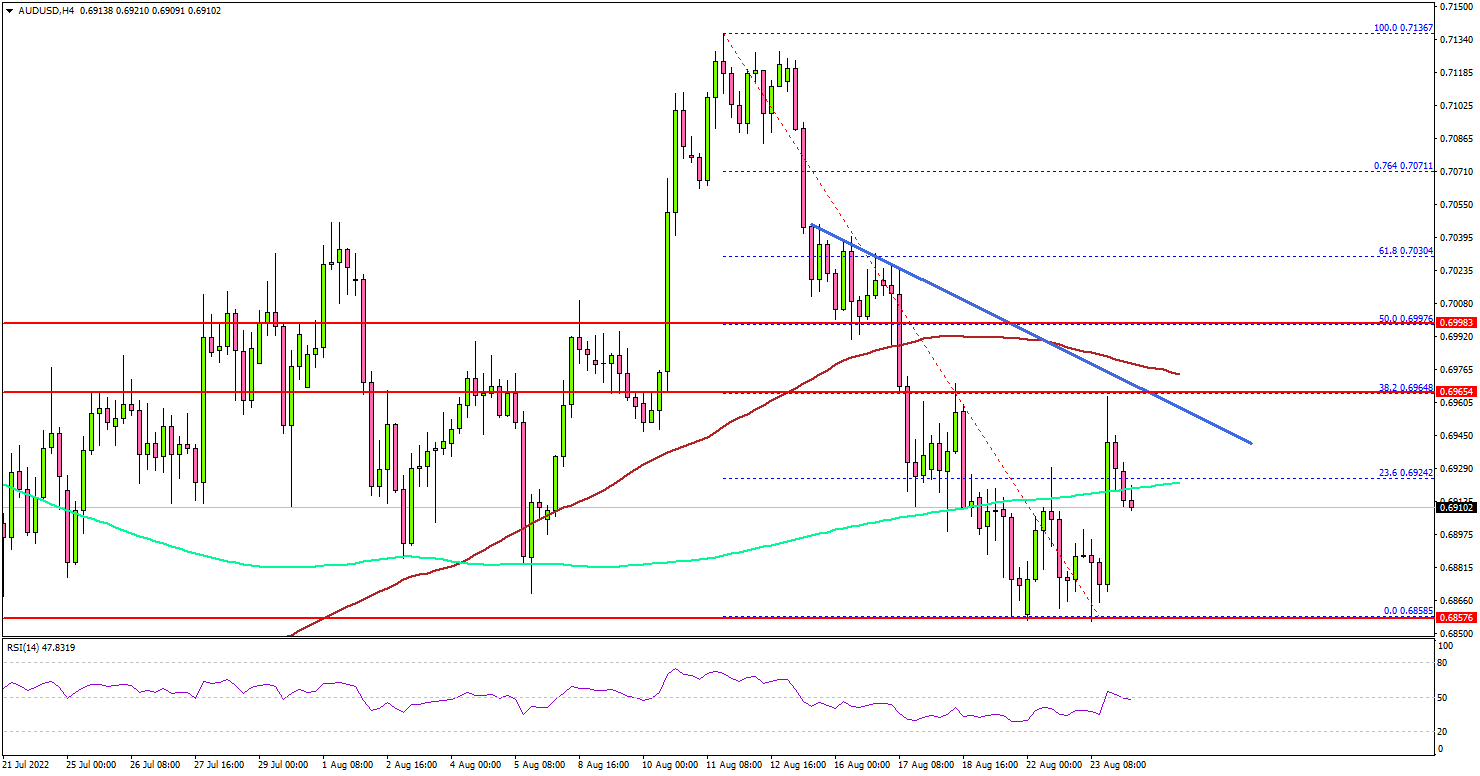
Looking at the 4-hours chart, the pair settled below the key 0.7000 support, the 100 simple moving average (red, 4-hours), and the 200 simple moving average (green, 4-hours). The decline gained pace below the 0.6920 support zone.
However, the bulls were active near a major support at 0.6860. A low was formed near 0.6858 and the pair is now consolidating losses.
There was a minor upward move above the 23.6% Fib retracement level of the key decline from the 0.7136 swing high to 0.6858 low. On the upside, the pair is facing resistance near the 0.6965 level.
There is also a key bearish trend line forming with resistance near 0.6965 on the same chart. The next major resistance is near the 0.7000 level. It is near the 50% Fib retracement level of the key decline from the 0.7136 swing high to 0.6858 low.
A clear move above the 0.7000 resistance might send the pair higher towards the 0.7120 level. If there is no upside break, the pair might resume its decline below the 0.6900 level.
The next major support is near the 0.6860 zone, below which the bears might gain strength. In the stated case, the pair may perhaps decline towards the 0.6720 level in the coming days.
Looking at crude oil price, there was a strong buying interest near the $87.20 zone and the price was able to recover above $90.00. However, there is a still a major hurdle near the $95.00 level.
Economic Releases
- US Durable Goods Orders for July 2022 – Forecast +0.6% versus +2% previous.
- Nondefense Capital Goods Orders ex Aircraft for July 2022 – Forecast +0.3% versus +0.7% previous.
- US Pending Home Sales for Feb 2022 (YoY) - Forecast -4.0%, versus -8.6% previous.
Fed Could Use Jackson Hole to Right the Ship
With Fed officials heading to Jackson Hole, market participants are bracing for turbulence. Despite raising rates with incredible force, US yields remain stubbornly low as markets speculate about rate cuts next year. That’s counterproductive for a central bank still fighting inflation, and if Chair Powell attempts to ‘right the ship’ in his speech on Friday, that could extend the retreat in stock markets but supercharge the dollar.
Unofficial meeting
Once per year, Fed officials gather at their summer retreat in Jackson Hole, Wyoming for a symposium to discuss monetary policy. This platform has been used in the past to signal significant strategy shifts, so traders view it as an unofficial Fed meeting. The message this year could be a little sobering.
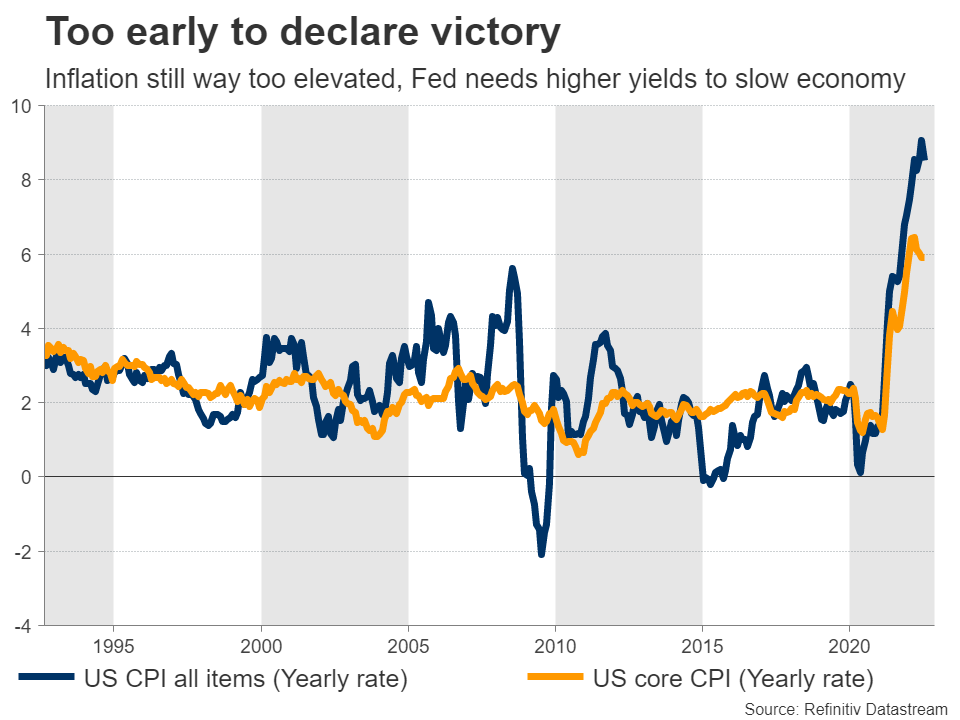
In a nutshell, markets aren’t behaving like the Fed needs them to. Yields on government bonds are simply not high enough to truly slow the economy and fight rampant inflation. As such, inflation expectations have started to creep higher again.
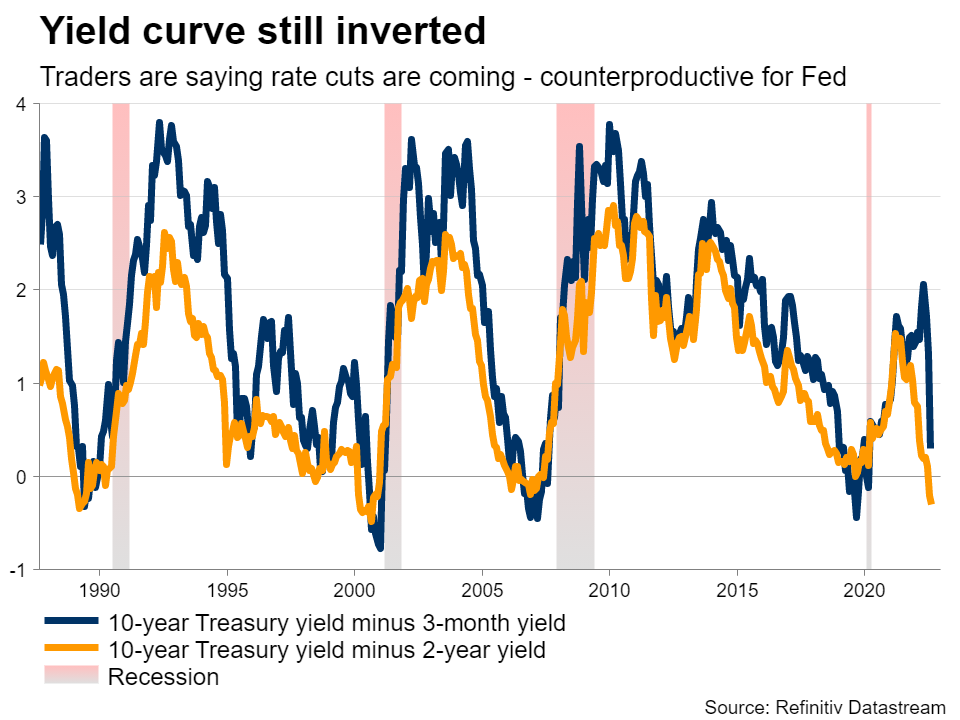
Bond traders are essentially saying the Fed can raise rates all it wants this year, but it will still be cutting them next year to deal with some crisis. This assumption is making the Fed’s job harder. Policymakers might need to raise interest rates even higher to compensate, putting unnecessary pressure on an economy that’s already losing steam according to business surveys.
Shock therapy
The desired outcome for the Fed would be to raise longer-dated yields without causing panic in the markets. One way to accomplish that would be to push back against speculation for rate cuts next year, stressing that rates will need to remain elevated for a prolonged period to bring down inflation, even if the economy stalls.
Another way would be through the balance sheet. The process to reduce the balance sheet has already started and will double in pace next month, with $95 billion in securities rolling off per month as they mature. Any hints that the pace can be ramped up if needed through the active sales of securities could do the trick.
In either case, the dollar would likely benefit. If so, euro/dollar could encounter initial support around 0.9860, a region defined by the lows of December 2002.
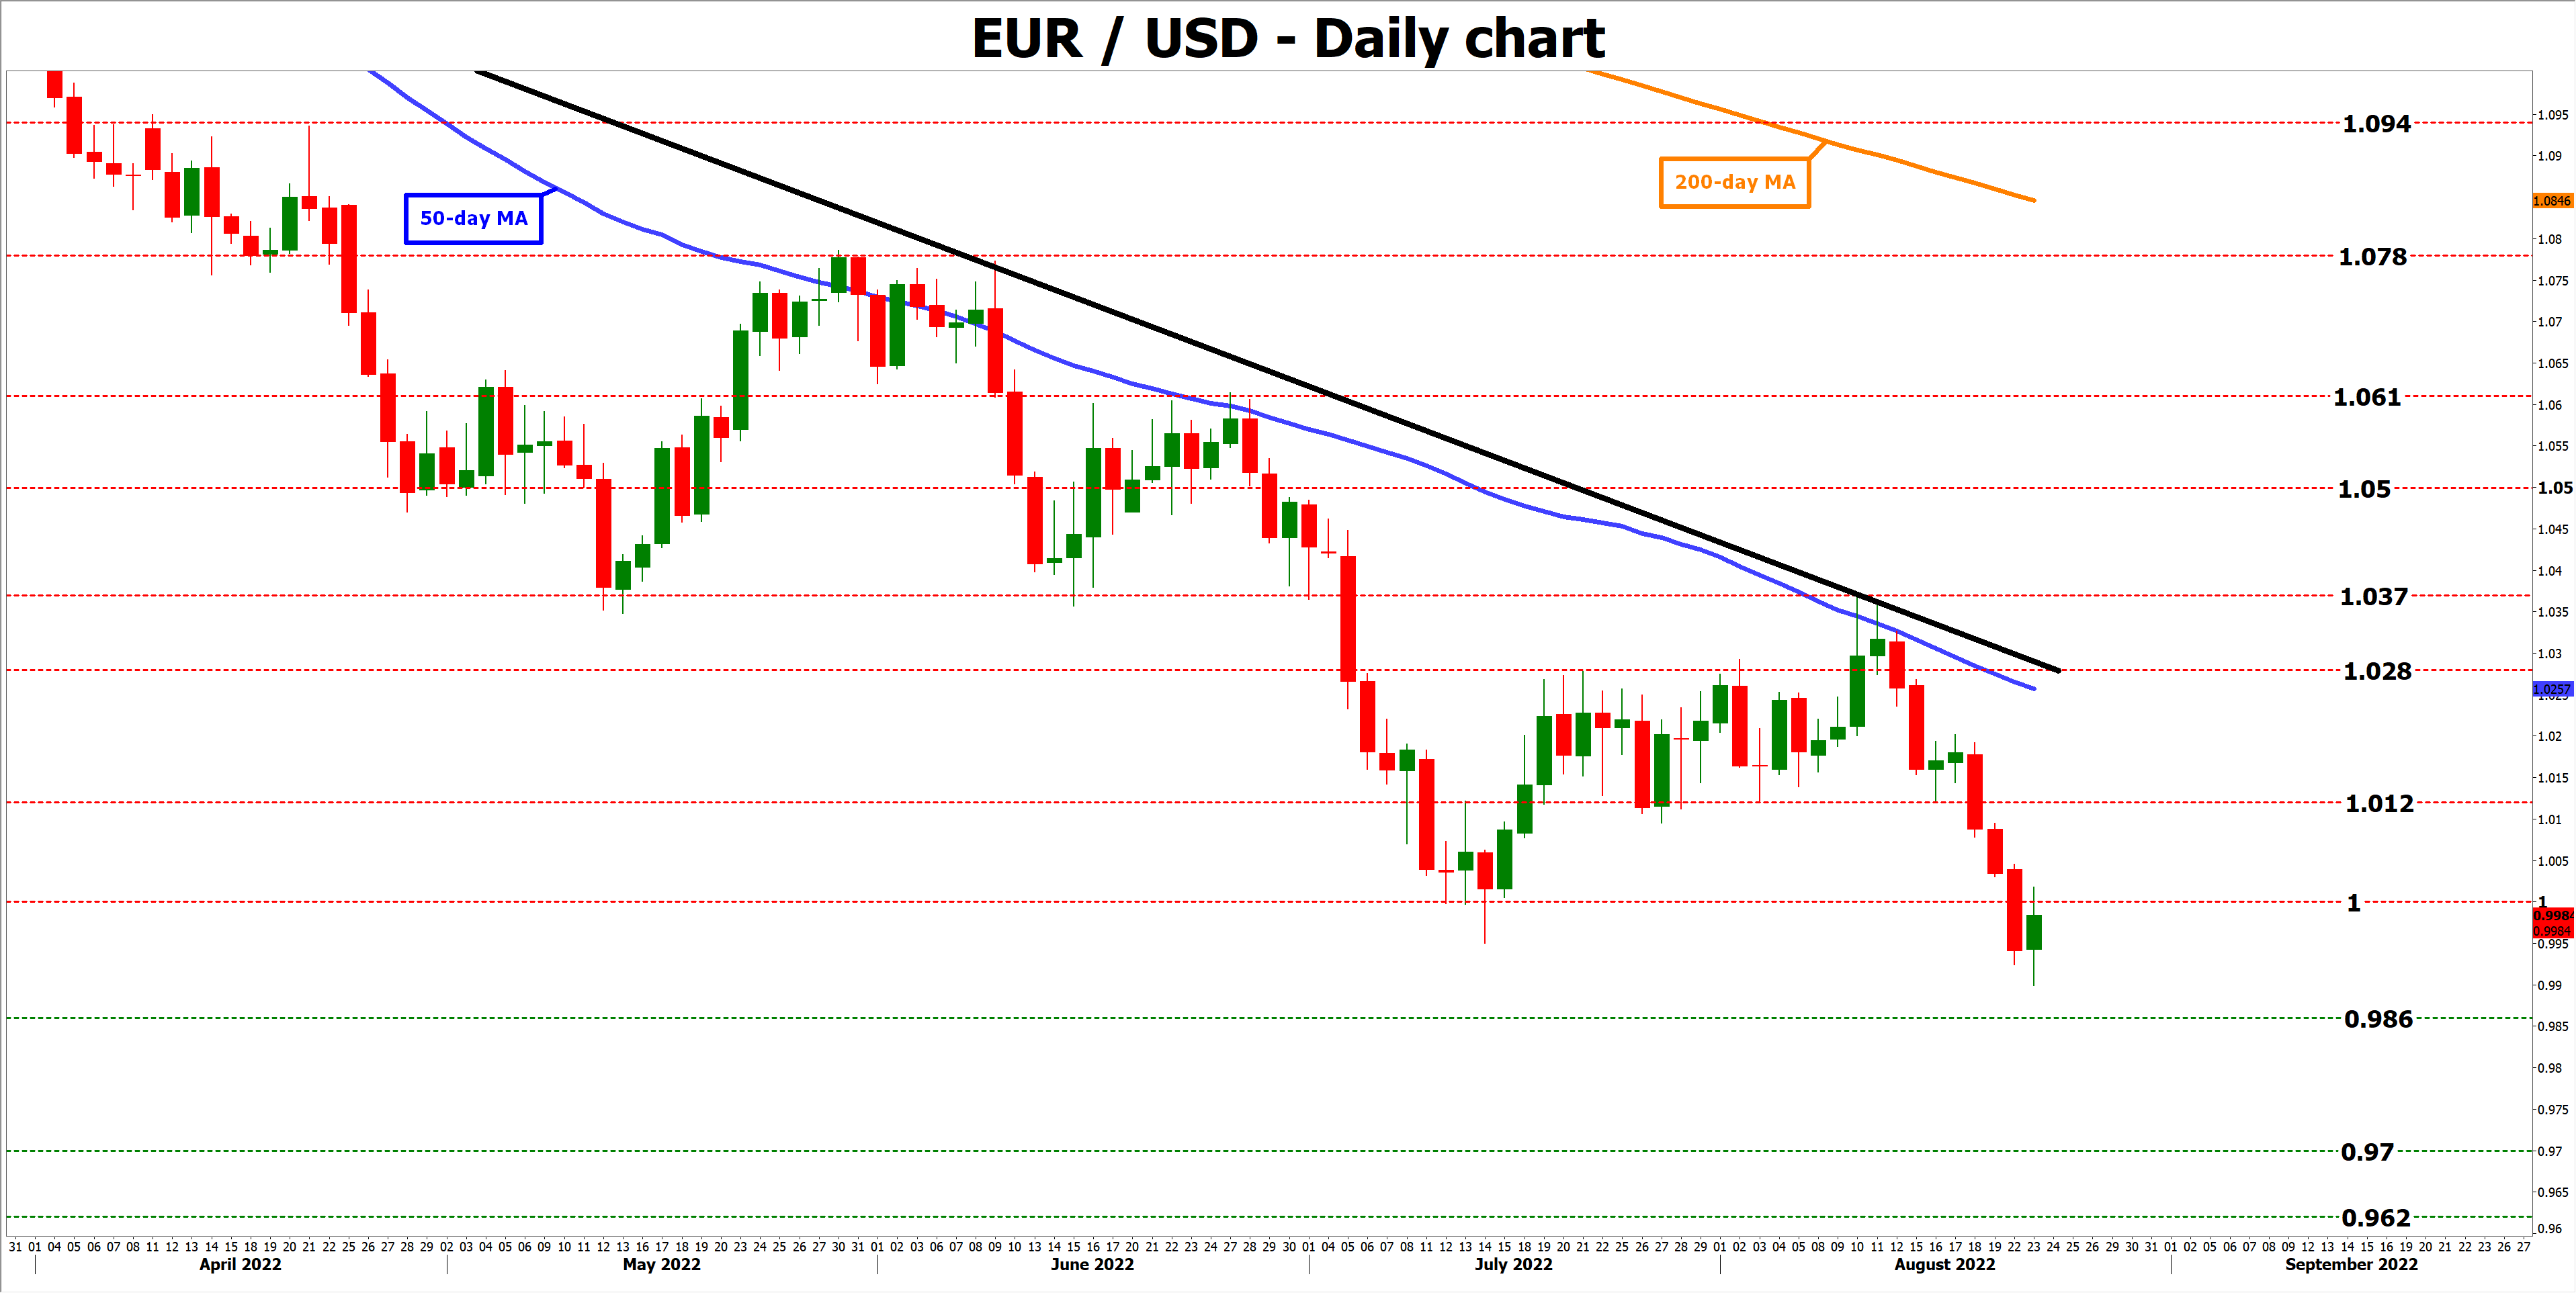
Of course the dollar has already come a long way and if Powell isn’t quite so forceful, that might spark a retracement, sending euro/dollar back above parity for a test of 1.0120. That said, any relief rally that stays limited below the trendline drawn from the February highs would keep the pair in a clear downtrend.
No reversals yet
In the big picture, it’s still difficult to call for any trend reversal in the US dollar while the outlook for the rest of the world remains even gloomier. A spiraling energy crisis in Europe has kneecapped heavy industry and consumers, almost ensuring a brutal recession that the European Central Bank cannot deal with because of its inflationary implications.
In Japan, the central bank refuses to even consider tighter policy, keeping the yen under heavy pressure as other nations raise interest rates. Meanwhile, the British pound is trading in lockstep with unsteady stock markets, and the implosion in China’s property sector has ravaged commodity-linked currencies like the Australian dollar.
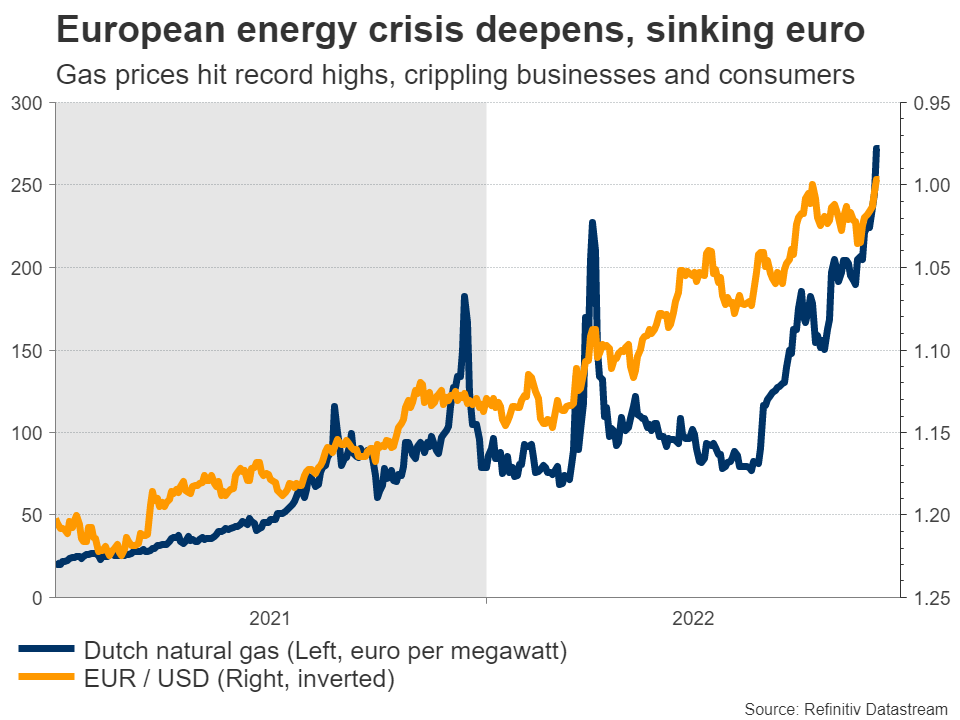
Therefore, there are no alternatives. And the darker the global outlook becomes, the more safe-haven flows the dollar can attract as traders seek shelter from the storm, even if the US economy is also losing power.
The only catalyst that could truly change this story is a ceasefire in the Ukraine war, which has been raging for six months now. Unfortunately, that doesn’t seem imminent.
GBP/USD: Bears May Pause at 2022 Low on Oversold Conditions
Cable is trading near new multi-month low (1.1717) posted today, keeping firm bearish stance, additionally boosted by terrible UK manufacturing PMI data for August that add to fears the economy is sliding into recession.
Bears probed below 2022 low (1.1760) but need a clear break here to confirm a double -top at 1.2293/1.2276 (Aug 1 /10 tops) and resume larger downtrend, though Monday’s failure to close below this level and today’s quick bounce from new low, warn that the action may hold for consolidation before bears regain full control.
Oversold daily studies support the notion, with limited upticks to be ideally capped at 1.1900 zone and keep intact upper breakpoint at 1.20.
Res: 1.1784; 1.1836; 1.1886; 1.1925.
Sup: 1.1717; 1.1700; 1.1634; 1.1556.

GBP/USD Jumps on Weak US Hhousing Data
The British pound has jumped 0.82% today, as the currency has rebounded somewhat from its worst week of the year. GBP/USD plunged 2.53% last week, as the US dollar has found its mojo after weeks of beating a retreat. GBP/USD has climbed today after US New Home Sales dropped to 511 thousand in July, down from 585 thousand in August and well below expectations.
UK manufacturing slides
The UK Manufacturing PMI crashed into contraction territory in August. The index fell to 46.0, down from 52.1 in July and shy of the estimate of 51.1. The dismal reading is part of a pan-European downward trend in manufacturing, which has been made worse by the prolonged war in Ukraine. Output has been hampered by higher costs, a drop in demand and supply chain problems.
CBI Manufacturing Output fell by 7% in the three months to August, according to the CBI, down from +6% in the three months to July. This was the first decline in output since February 2021. Manufacturers are also affected by rising energy bills and higher interest rates, and the situation is only expected to get worse. The energy cap will rise in October and the BoE will have to continue raising rates in order to defeat inflation.
There was better news from Services PMI, which was almost unchanged at 52.5, pointing to weak expansion (52.6 prior). Still, it’s hard to see how the UK can avoid a recession with weak growth and spiralling inflation. Business optimism is dropping, and that will likely lead to a cutback in spending, hiring and investment, which won’t help the economy one bit.
There is plenty of anticipation ahead of Jerome Powell’s speech at Jackson Hole on Friday, but investors shouldn’t overlook some key events prior to Powell’s speech. Durable goods orders will be published on Wednesday, with the headline reading expected to slow to 0.6% in July, down sharply from 2.0% in June. Thursday brings US GDP for Q2, which is expected to come in at -0.8% QoQ, after a 0.9% reading in the first quarter. With the Fed stating that US data will be critical in determining its rate policy, the dollar could show some movement after these releases, just as it fell sharply today after the soft New Home Sales reading.
GBP/USD Technical
- GBP/USD faces resistance at 1.1924 and 1.2005
- There is support at 1.1699 and 1.1568