Sample Category Title
UK PMI manufacturing dived to 46 in Aug, services ticked down to 52.5
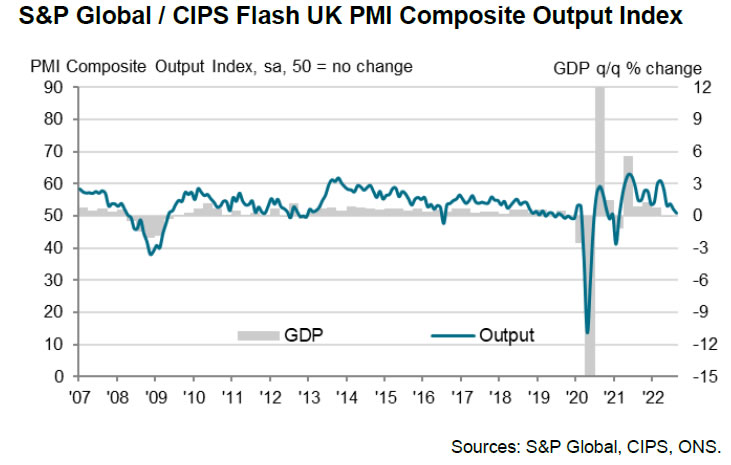
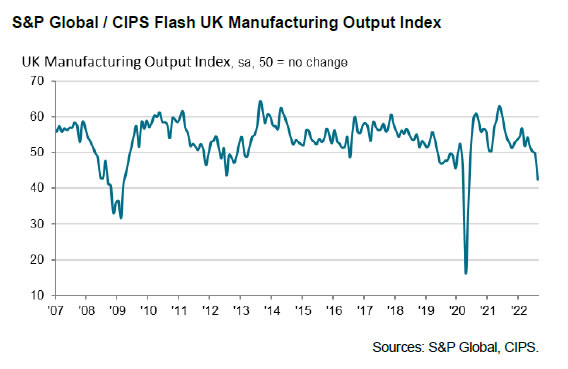
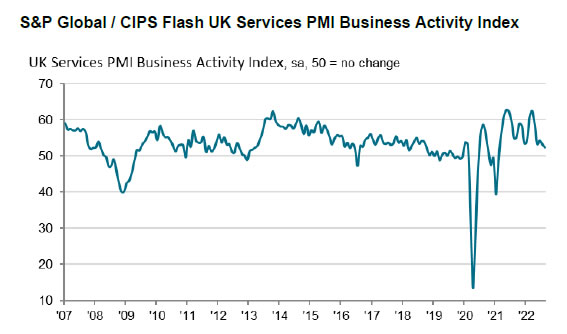
UK PMI Manufacturing dropped sharply from 52.1 to 46.0 in August, well below expectation of 51.3. That's also the lowest level in 27 months. PMI Services ticked down from 52.6 to 52.5, above expectation of 52.0, an 18-month low. PMI Composite dropped from 52.1 to 50.9, an 18-month low.
Annabel Fiddes, Economics Associate Director at S&P Global Market Intelligence said:
"The UK private sector moved closer to stagnation in August, as mild growth of activity across the service sector only just offset a deepening downturn at manufacturers. Waning customer demand amid the weaker economic outlook, and shortages of both staff and inputs, were reported to have hit goods producers hard, with firms registering the quickest drops in output and new work since May 2020.
Excluding the initial phase of the pandemic in early-2020, the reduction in manufacturing output was the quickest seen since the start of 2009. Meanwhile, the service sector registered the weakest increase in activity since the recovery began in early 2021."
Eurozone PMI composite dropped to 49.2 in Aug, economic contraction in Q3
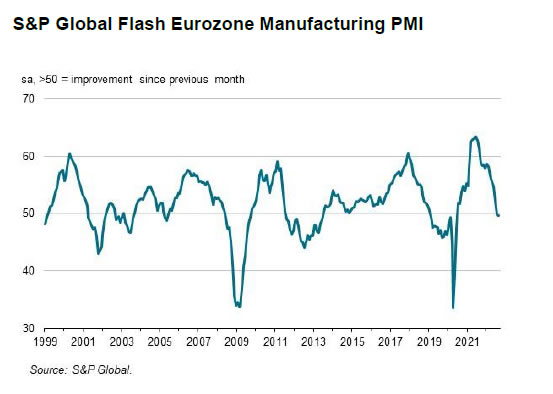
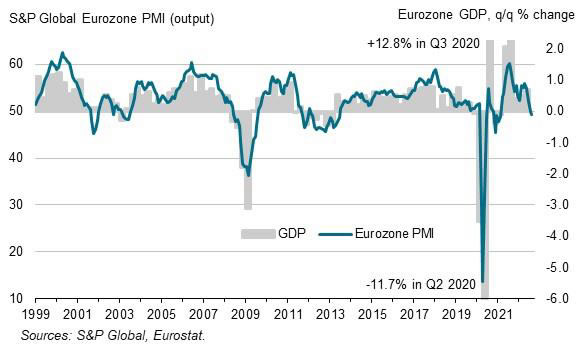
Eurozone PMI manufacturing dropped from 49.8 to 49.7 in August, above expectation of 49.0, a 26-month low. PMI Services dropped from 51.2 to 50.2, below expectation of 50.5, a 17-month low. PMI Composite dropped from 49.9 to 49.2, an 18-month low.
Andrew Harker, Economics Director at S&P Global Market Intelligence said: "The latest PMI data for the eurozone point to an economy in contraction during the third quarter of the year. Cost of living pressures mean that the recovery in the service sector following the lifting of pandemic restrictions has ebbed away, while manufacturing remained mired in contraction in August, seeing another record accumulation of stocks of finished goods as firms were unable to shift products in a falling demand environment. This glut of inventories suggests little prospect of an improvement in manufacturing production any time soon."
Germany PMI composite dropped to 47.6, continued weak manufacturing and slowdown in service
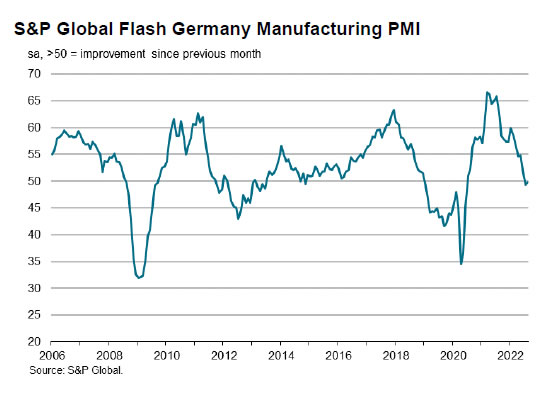
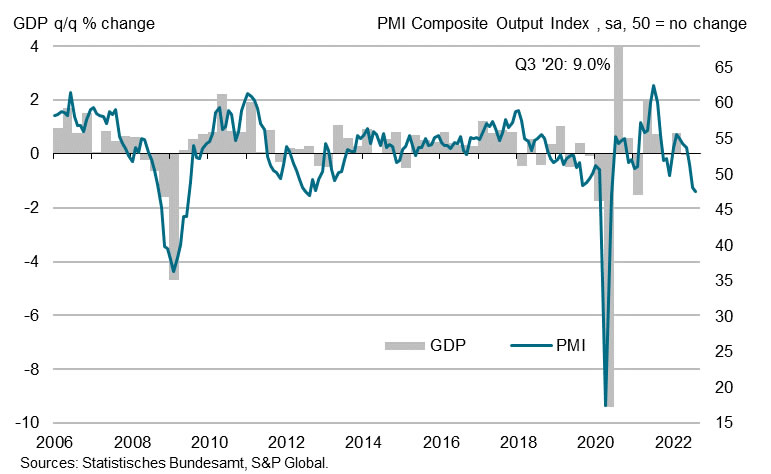
Germany PMI Manufacturing recovered from 49.3 to 49.8 in August, above expectation of 48.1.PMI Services dropped from 49.7 to 48.2, below expectation of 49.0, an 18-month low. PMI Composite dropped from 48.1 to 47.6, a 26-month low.
Phil Smith, Economics Associate Director at S&P Global Market Intelligence said: "The PMI data paint a bleak picture of the German economy midway through the third quarter, showing a deepening decline in private sector business activity. Continued weakness in manufacturing is being compounded by a slowdown in the service sector, with surveyed businesses reporting a growing strain on demand from high inflation and increased interest rates."
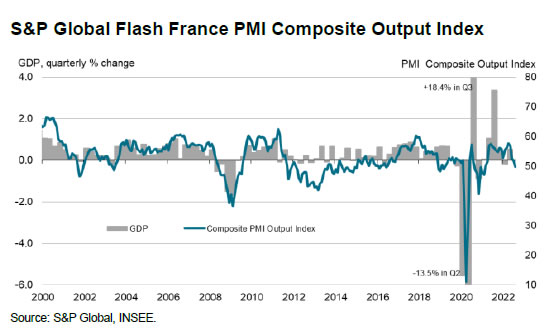
France PMI composite dropped to 49.8, entered into contraction
France PMI Manufacturing dropped from 49.5 to 49.0 in August, above expectation of 48.8, a 27-month low. PMI Services dropped from 53.2 to 51.0, below expectation of 53.5, a 16-month low. PMI Composite dropped from 51.7 to 49.8, an 18-month low.
Joe Hayes, Senior Economist at S&P Global Market Intelligence said: "August flash PMI data for France suggest the economy has now entered into contraction for the first time in a year-and-a-half as a sharp manufacturing downturn more than offset only a marginal increase in service sector activity...
"High inflation has squeezed purchasing power among consumers and businesses alike, although we saw further signs to suggest we have passed peak price pressures... The downward trend in the France PMI may well persist now demand for goods and services is falling."
GBPUSD Inches to 29-Month Low; Bears Dominate
GBPUSD inched to a new 29-month low of 1.1716 early on Tuesday, increasing the risk for a downtrend extension below July’s trough of 1.1758. The ongoing bearish correction follows the pullback from February’s resistance line.
The RSI is close to its 30 oversold level and the stochastics are near spring’s lows, making a rebound in the price possible. Yet, as long as the indicators keep sloping downwards and the MACD gains negative momentum below its red signal line, the base scenario is for the pair to keep diminishing.
Once the 1.1758 support gives way, the price could initially take a breather around 1.1670 last active in March 2020 before plummeting towards the channel's lower boundary and the 2020 bottom of 1.1500 – 1.1408. Additional declines from here may next pause near the 1.1300 psychological mark.
In the event of an upside reversal above the 1.1820 barrier, the spotlight will turn again to the resistance line currently around 1.2000. Slightly higher, the 20- and 50-day simple moving averages (SMAs) both at 1.2073 could then immediately tease any further improvement towards the previous high of 1.2292 and the 1.2300 number.
Summarizing, GBPUSD is still under bears' control in the short- and long-term picture. A decisive step below 1.1758 is expected to generate additional selling pressures.
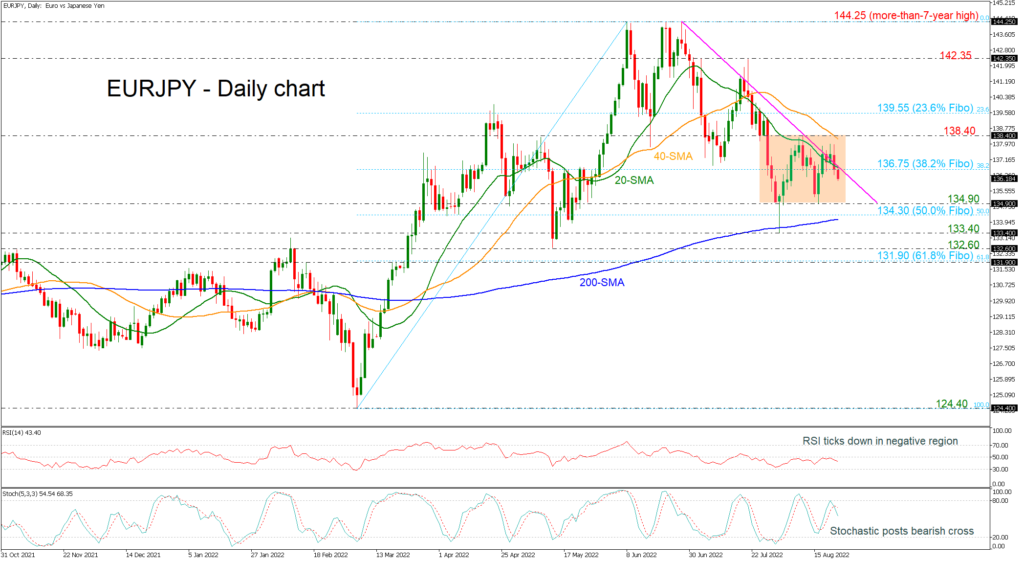
EURJPY Still Consolidating Below the Downtrend Line
EURJPY is diving back below the near-term falling trend line and the 38.2% Fibonacci retracement level of the down leg from 124.40 to 144.25 at 136.75. The neutral to bearish picture in the short-term looks to last for a while longer after prices failed to break above the descending line and the 138.40 resistance.
The negative bias in the near term is supported by the deterioration in the momentum indicators. The %K line of the stochastic oscillator has fallen sharply after the pullback from the overbought region and posted a bearish crossover with the %D line. The RSI is flatlining below the 50-neutral level, suggesting any upside correction will be weak.
If prices continue to head lower, support should come from the 134.90 barrier before tumbling to the 50.0% Fibonacci of 134.30 and the 200-day simple moving average (SMA) at 134.07. A drop below these lines would reinforce the bearish view and open the way towards the 132.60-133.40 support zone.
However, should an upside reversal take form, immediate resistance will likely come from the 38.2% Fibonacci of 136.75 ahead of the 40-day SMA at 138.40. A break higher could shift the bias to slightly bullish with the next resistance coming from the 23.6% Fibonacci of 139.55.
All in all, EURJPY has been neutral to bearish in the short-term timeframe and any moves beneath the 200-day SMA would endorse the bearish scenario.
Dollar Hits New Two-Decade High
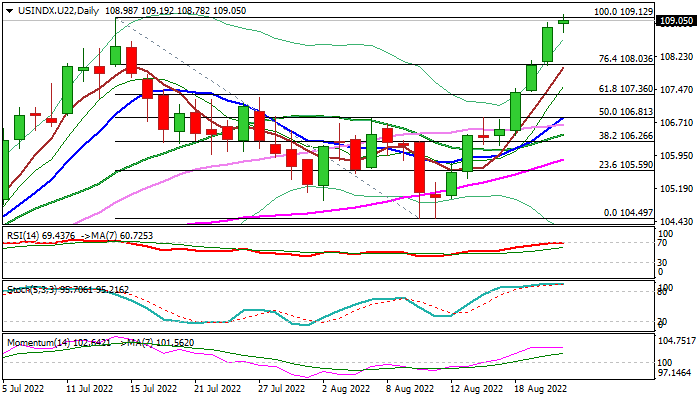
The dollar index extends steep ascend from Aug 10/11 double-bottom (104.49) to probe through previous top at 109.12 (July 14) and hit new highest since Sep 2002.
The greenback remains well supported by safe-haven flows on concerns about global growth and hawkish Fed, with completion of corrective phase (109.12/104.49) signaling continuation of larger uptrend from 2021 double-bottom at 89.15/90.42.
Weekly studies in full bullish setup and last week’s completion of bullish engulfing pattern (following 2.3% weekly advance, the biggest weekly rally since mid-March 2020) underpin the action, along with last week’s large bullish candle.
On the other side, overbought daily techs suggest bulls may take a breather for consolidation before resuming.
Shallow dips are likely scenario, ideally to be contained at 108 zone, though deeper pullback towards supports at 107.36/00 (broken Fibo 61.8% / daily cloud top) cannot be ruled out, but still expected to offer better buying opportunities.
Break of 109.12 pivot to expose initial targets at 110.00/22 (round-figure / Fibo 123.6% projection) with stronger acceleration to focus 111 zone.
Res: 110.00; 110.22; 110.90; 111.44
Sup: 108.78; 108.03; 107.36; 107.00
Daily Technical Analysis
EUR/USD
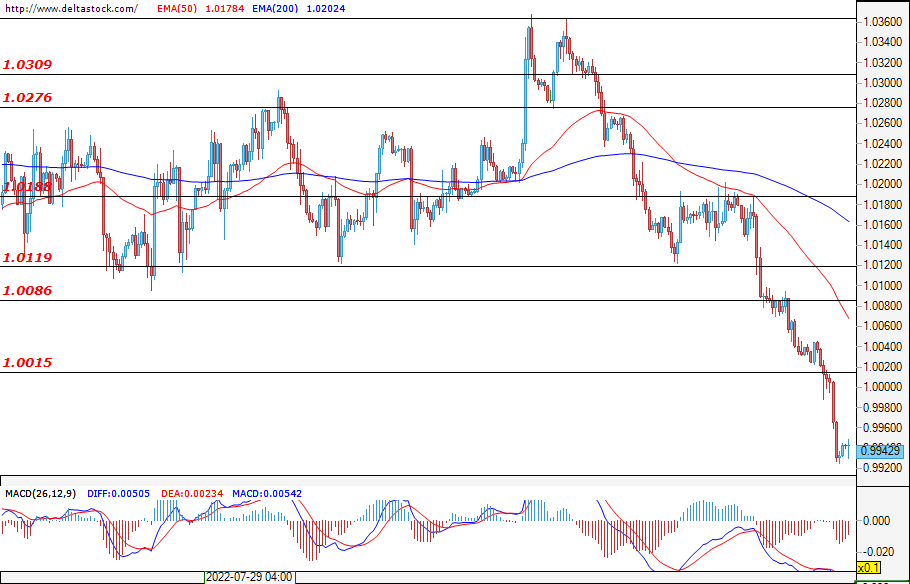
In less than a quarter, the U.S. dollar managed to reach parity with the euro for the second time. Unlike the previous time, where one euro traded for one dollar, the pair managed to confirm the breakthrough. This sell-off means that the bets for a more hawkish FED after the Jackson Hole symposium are on the rise. If the bears continue to dominate the market, then the pair will most likely target the support at 0.975 coming from the higher time frames. . The bulls, on the other hand, will have the difficult task to overcoming the resistance at 1.000 and then the next one at 1.011, if they are to have any chance of reversing the sell-off.
USD/JPY
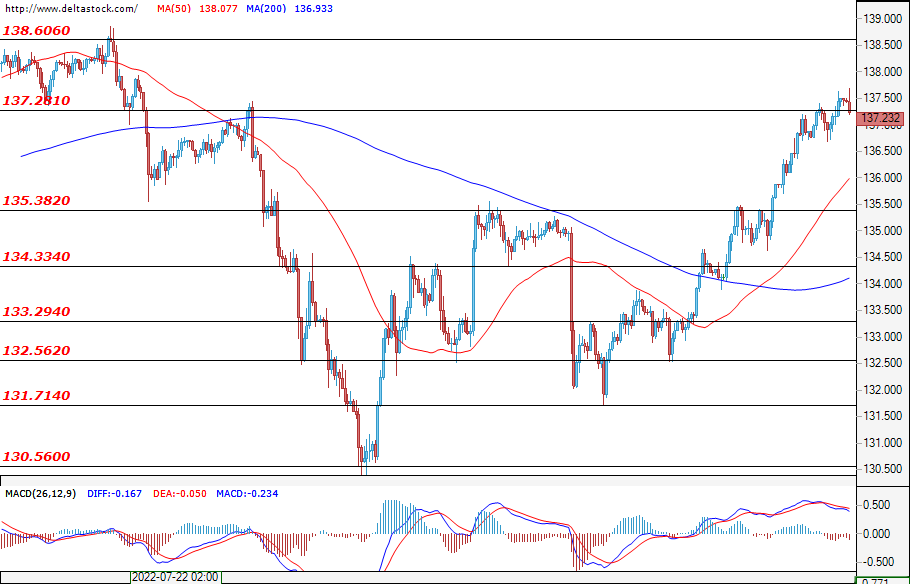
In the past trading session for the Ninja, the bulls made two attempts to breach the resistance at 137.28. The second breakout was solidified and investors took their first steps towards the next resistance at 138.60. If, however, the bears manage to reject the breakout, then they would try to reach the key support at 135.38. No important macroeconomic news is expected from Japan today.
GBP/USD
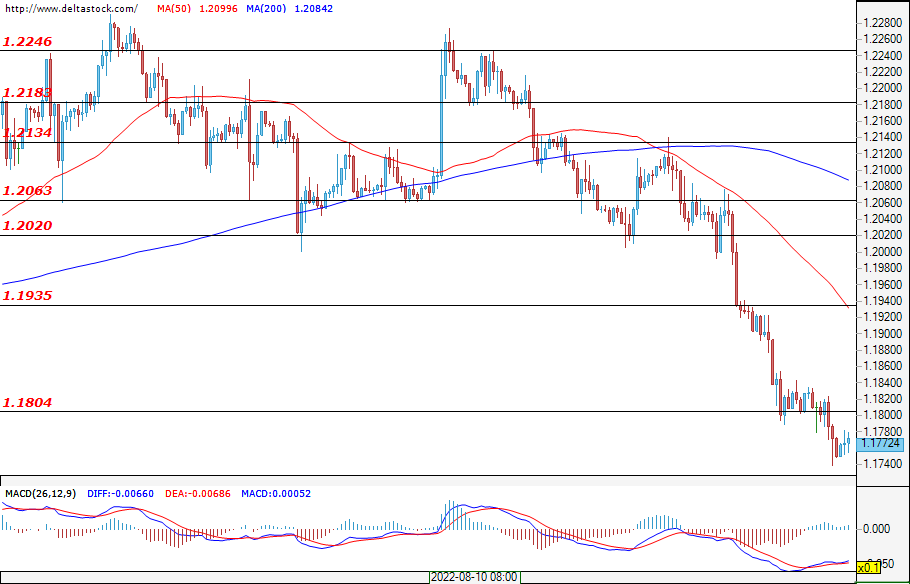
In the past week, Great Britain announced its highest inflation rate since 1982. This news encouraged the bears as they headed for the support at 1.1760. If, however, the bulls manage to turn the market around in their favour, then they will have to first breach the closest resistance at 1.1804, and only then consider the more distant one at 1.1935.
EUGERMANY40
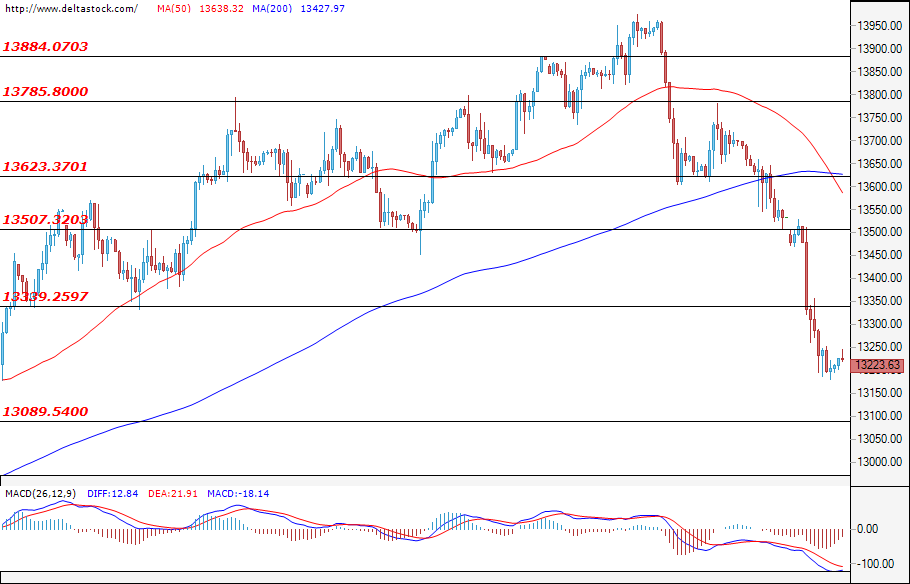
It took only yesterday's trading session for the bulls to overcome the two key supports at 13507 and at 13340. Today's session started with a slight success for the bulls and they managed to recover some of their lost positions, but not enough to breach the nearby resistance. Volatility is expected to remain elevated throughout the day, with the leading factor being the limited supply of Russian natural gas and the odds of a total shutdown of the pipeline rapidly rising as winter approaches. If this scenario materialises, then a recession scenario for Europe will be virtually inevitable.
US30
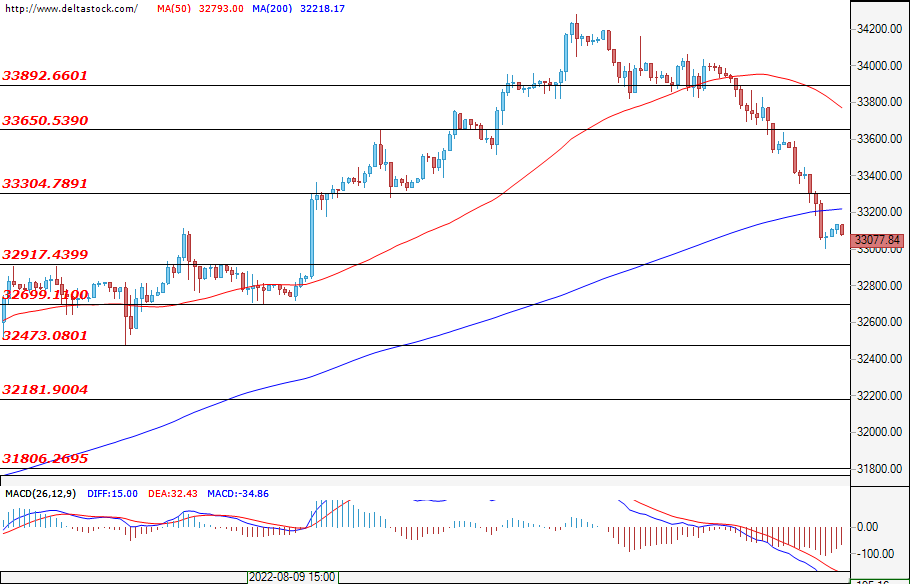
Looking at the U.S. blue-chip index, yesterday's trading session was marked by strong bearish success. The rising dollar aided the sell-off and the index fell below the support of 33300. Today's trading session started calmly – with a slight advantage for the bulls who are trying to recover their big losses from the past days. This calm state of the market is unlikely to continue throughout the session, but if it does, it could be disturbed at 14:00 GMT, when the U.S. new home sales numbers will be released. If the news negatively affects the index, then we may witness an attempt by the bears to breach the other important resistance at 32920.
US Oil: The Final Bullish Leg of Global Impulse is at the Start
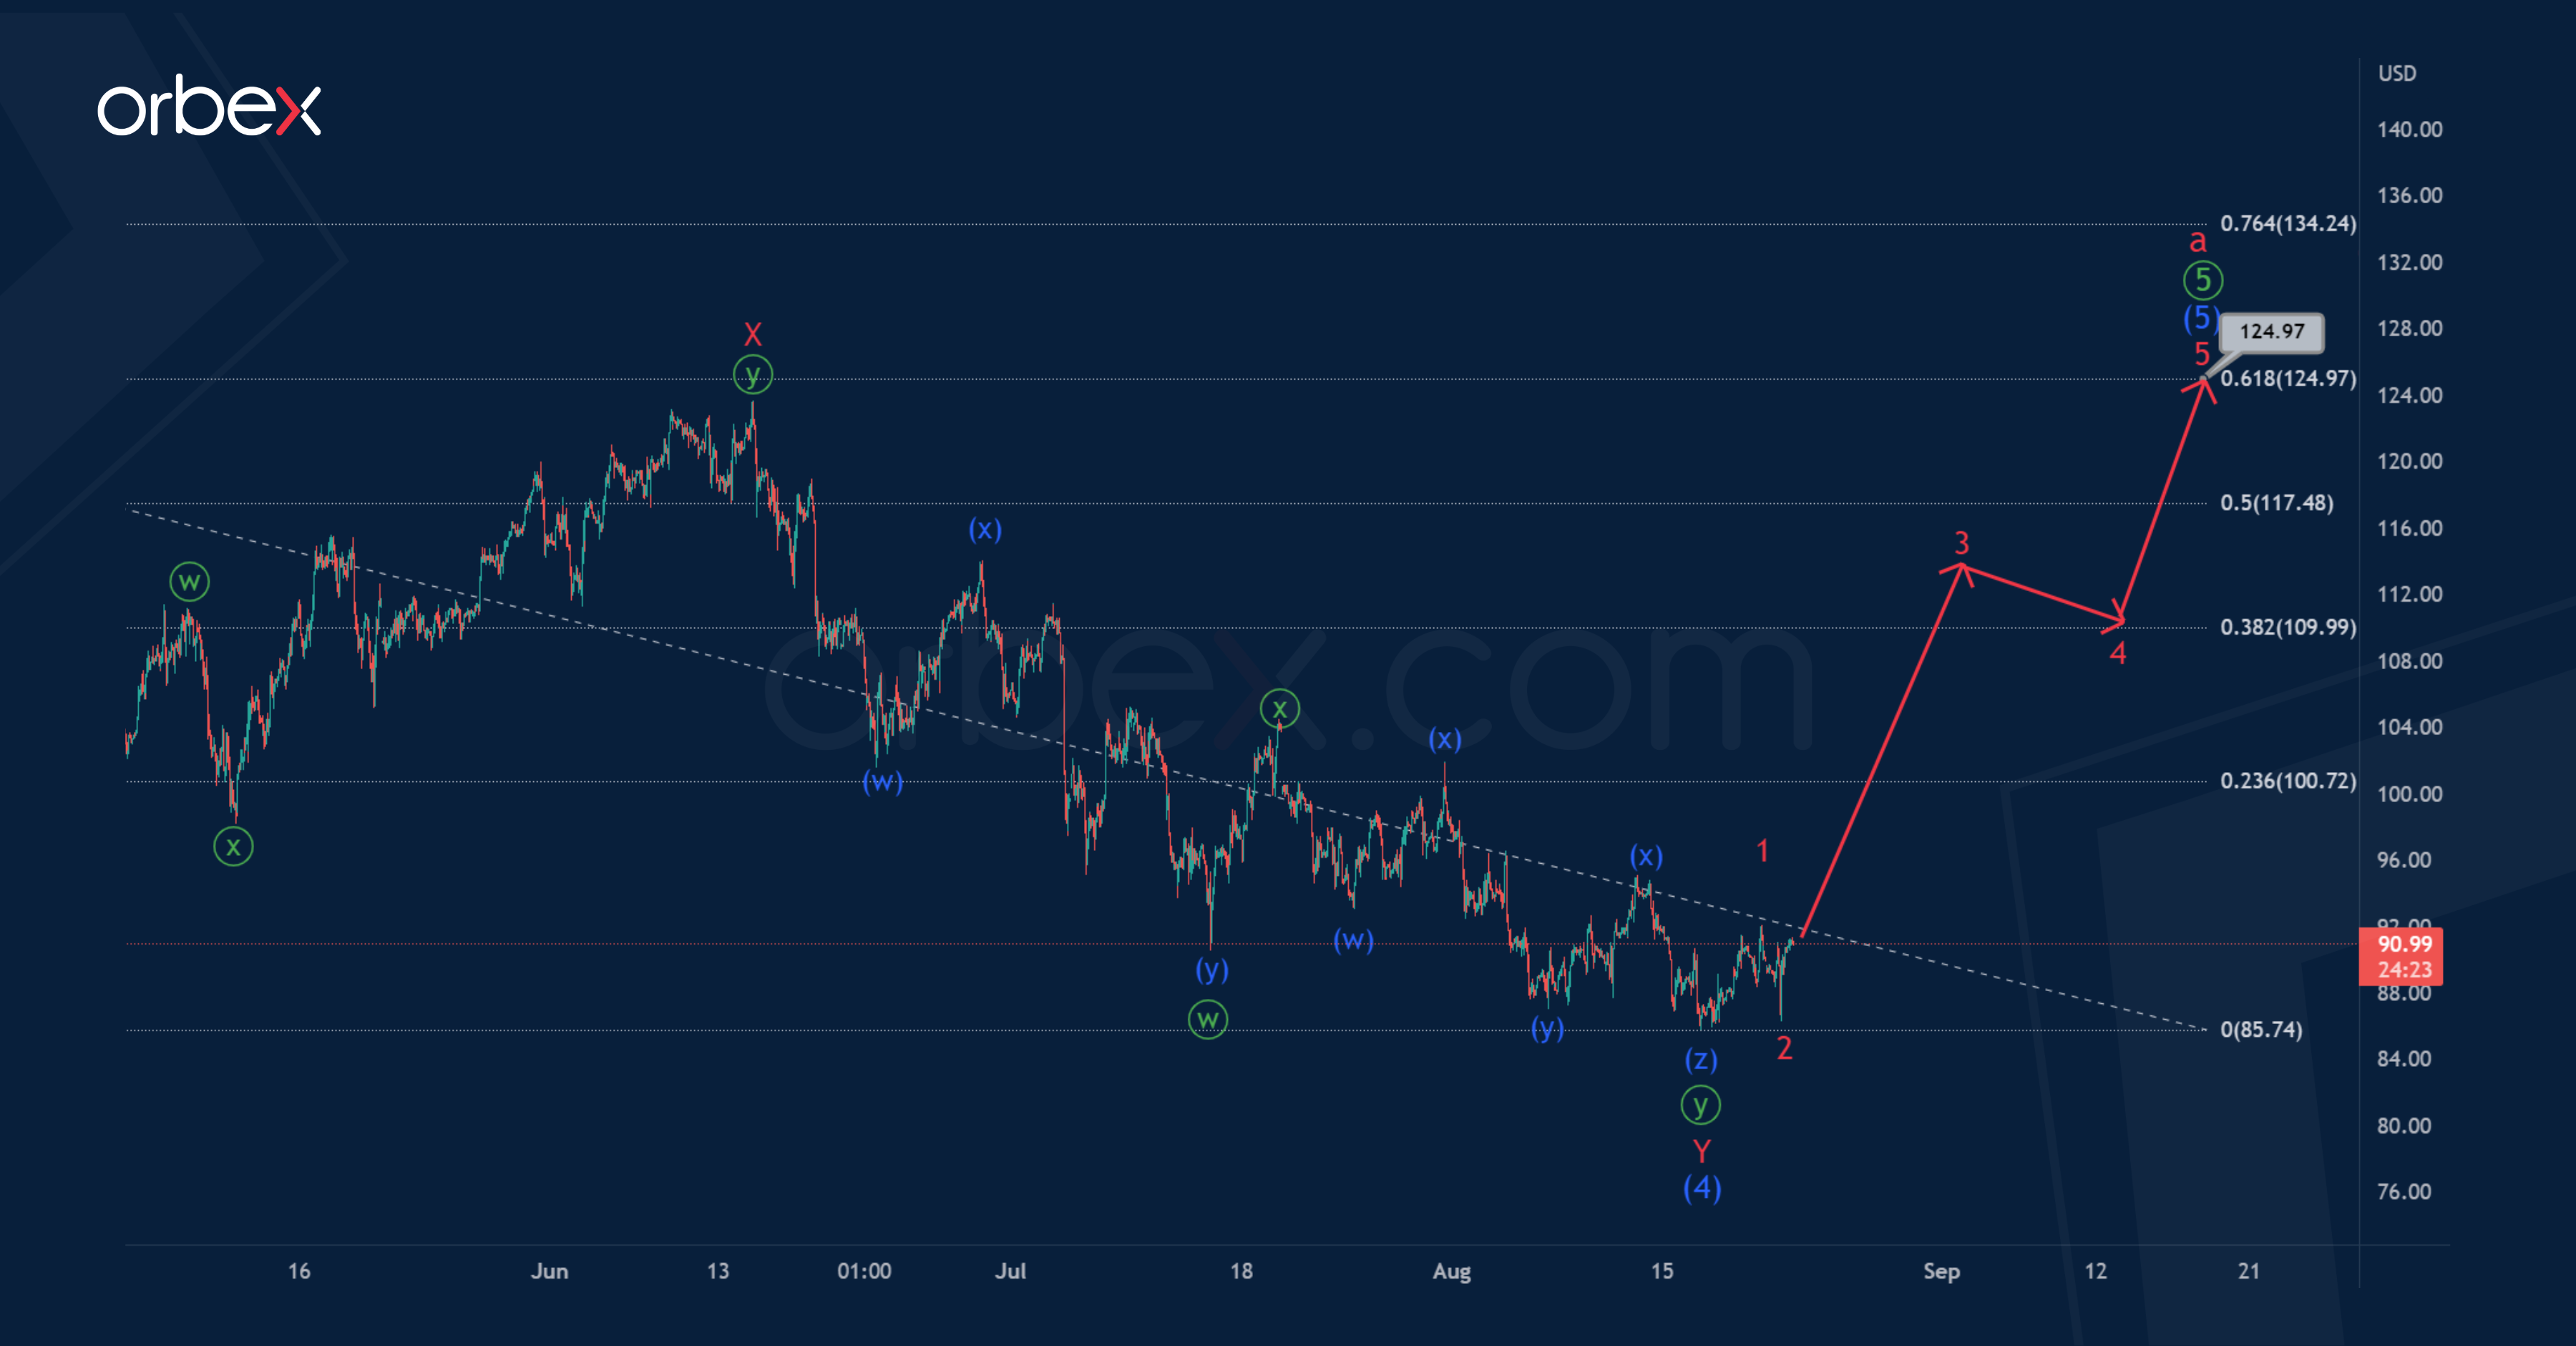
USOIL suggests the development of the final part of the global impulse wave a of the cycle degree.
The 1H timeframe shows the markup of the final primary wave ⑤, which takes the form of an intermediate impulse.
It is possible that an intermediate correction (4) in the form of a minor double zigzag was recently completed, then the price began to rise in the intermediate wave (5). It is assumed that the intermediate wave (5) will take the form of a standard minor impulse 1-2-3-4-5, as shown on the chart.
The end of the specified pattern is possible near 124.97. At that level, wave (5) will be at the 61.8% Fibonacci extension of impulse (3).
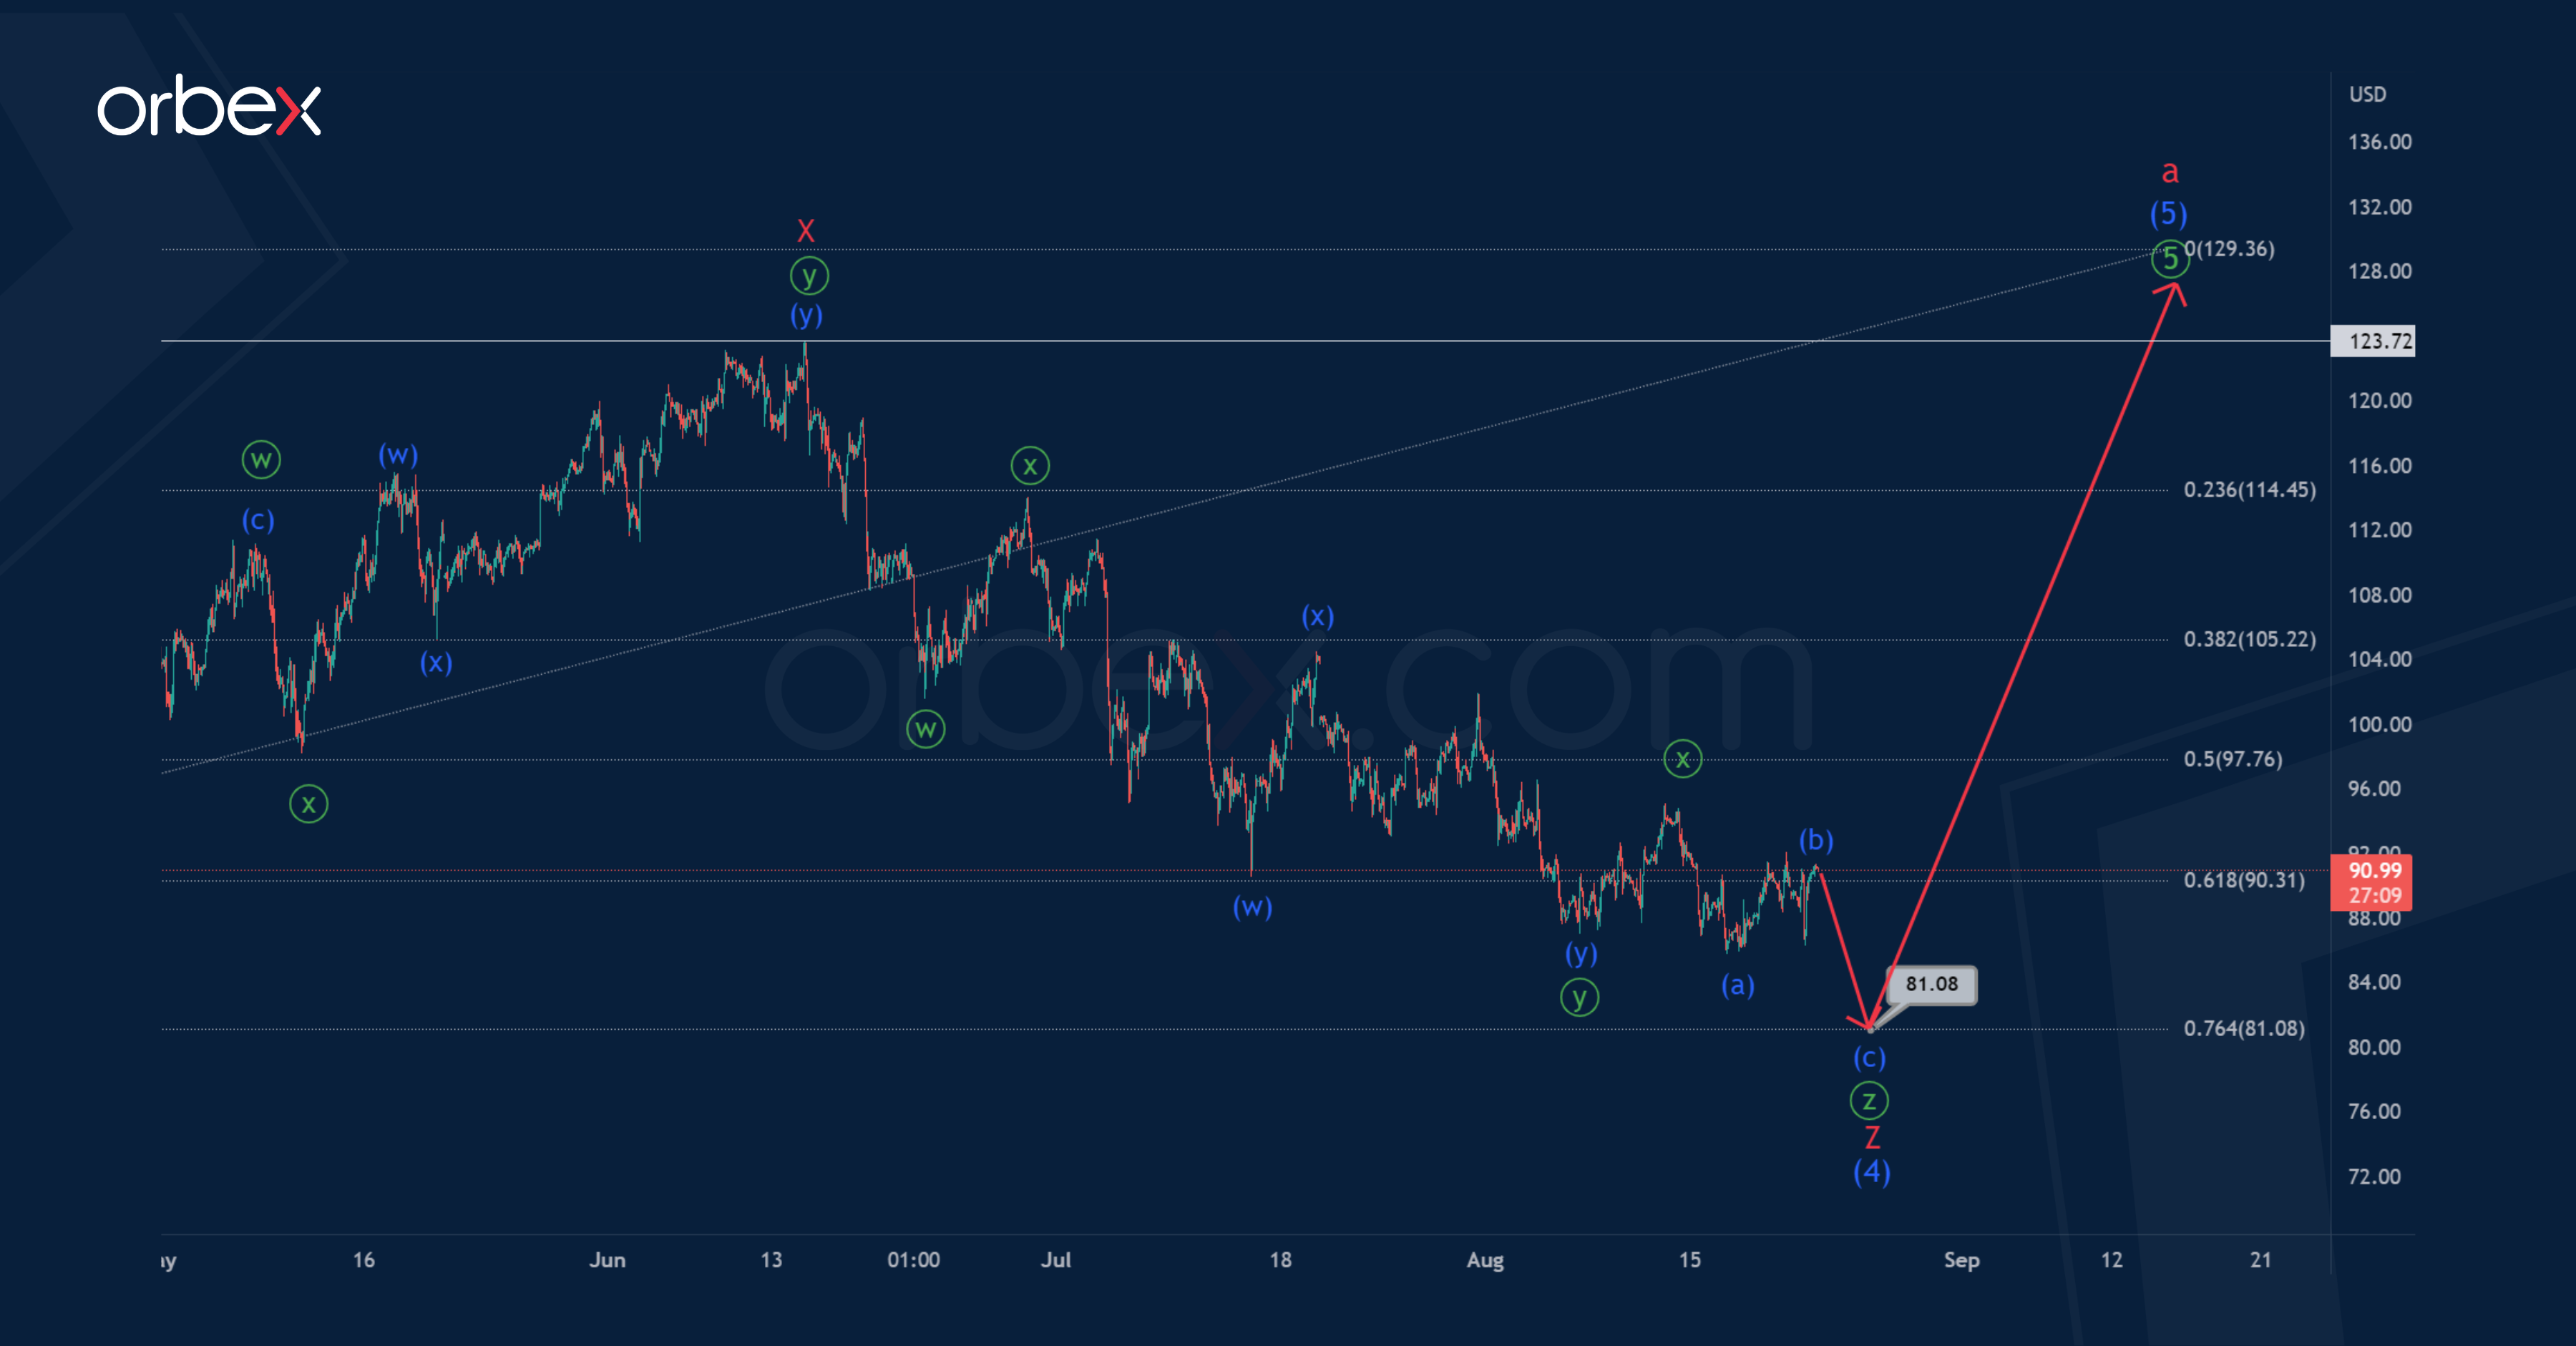
Let's consider the second option, where the construction of an intermediate correction (4) can be continued. Perhaps it will have the form of a triple zigzag W-X-Y-X-Z.
The minor sub-waves W-X-Y-X look finished. Thus, in the near future, the downward movement is expected to continue in the actionary wave Z, which can be completed in the form of a minute triple zigzag ⓦ-ⓧ-ⓨ-ⓧ-ⓩ.
The oil price may fall to 81.08. At that level, intermediate correction (4) will be at 76.4% of impulse (3).
After reaching this level, the market is expected to grow above the maximum – 123.72.
DAX 40 Struggles for Support
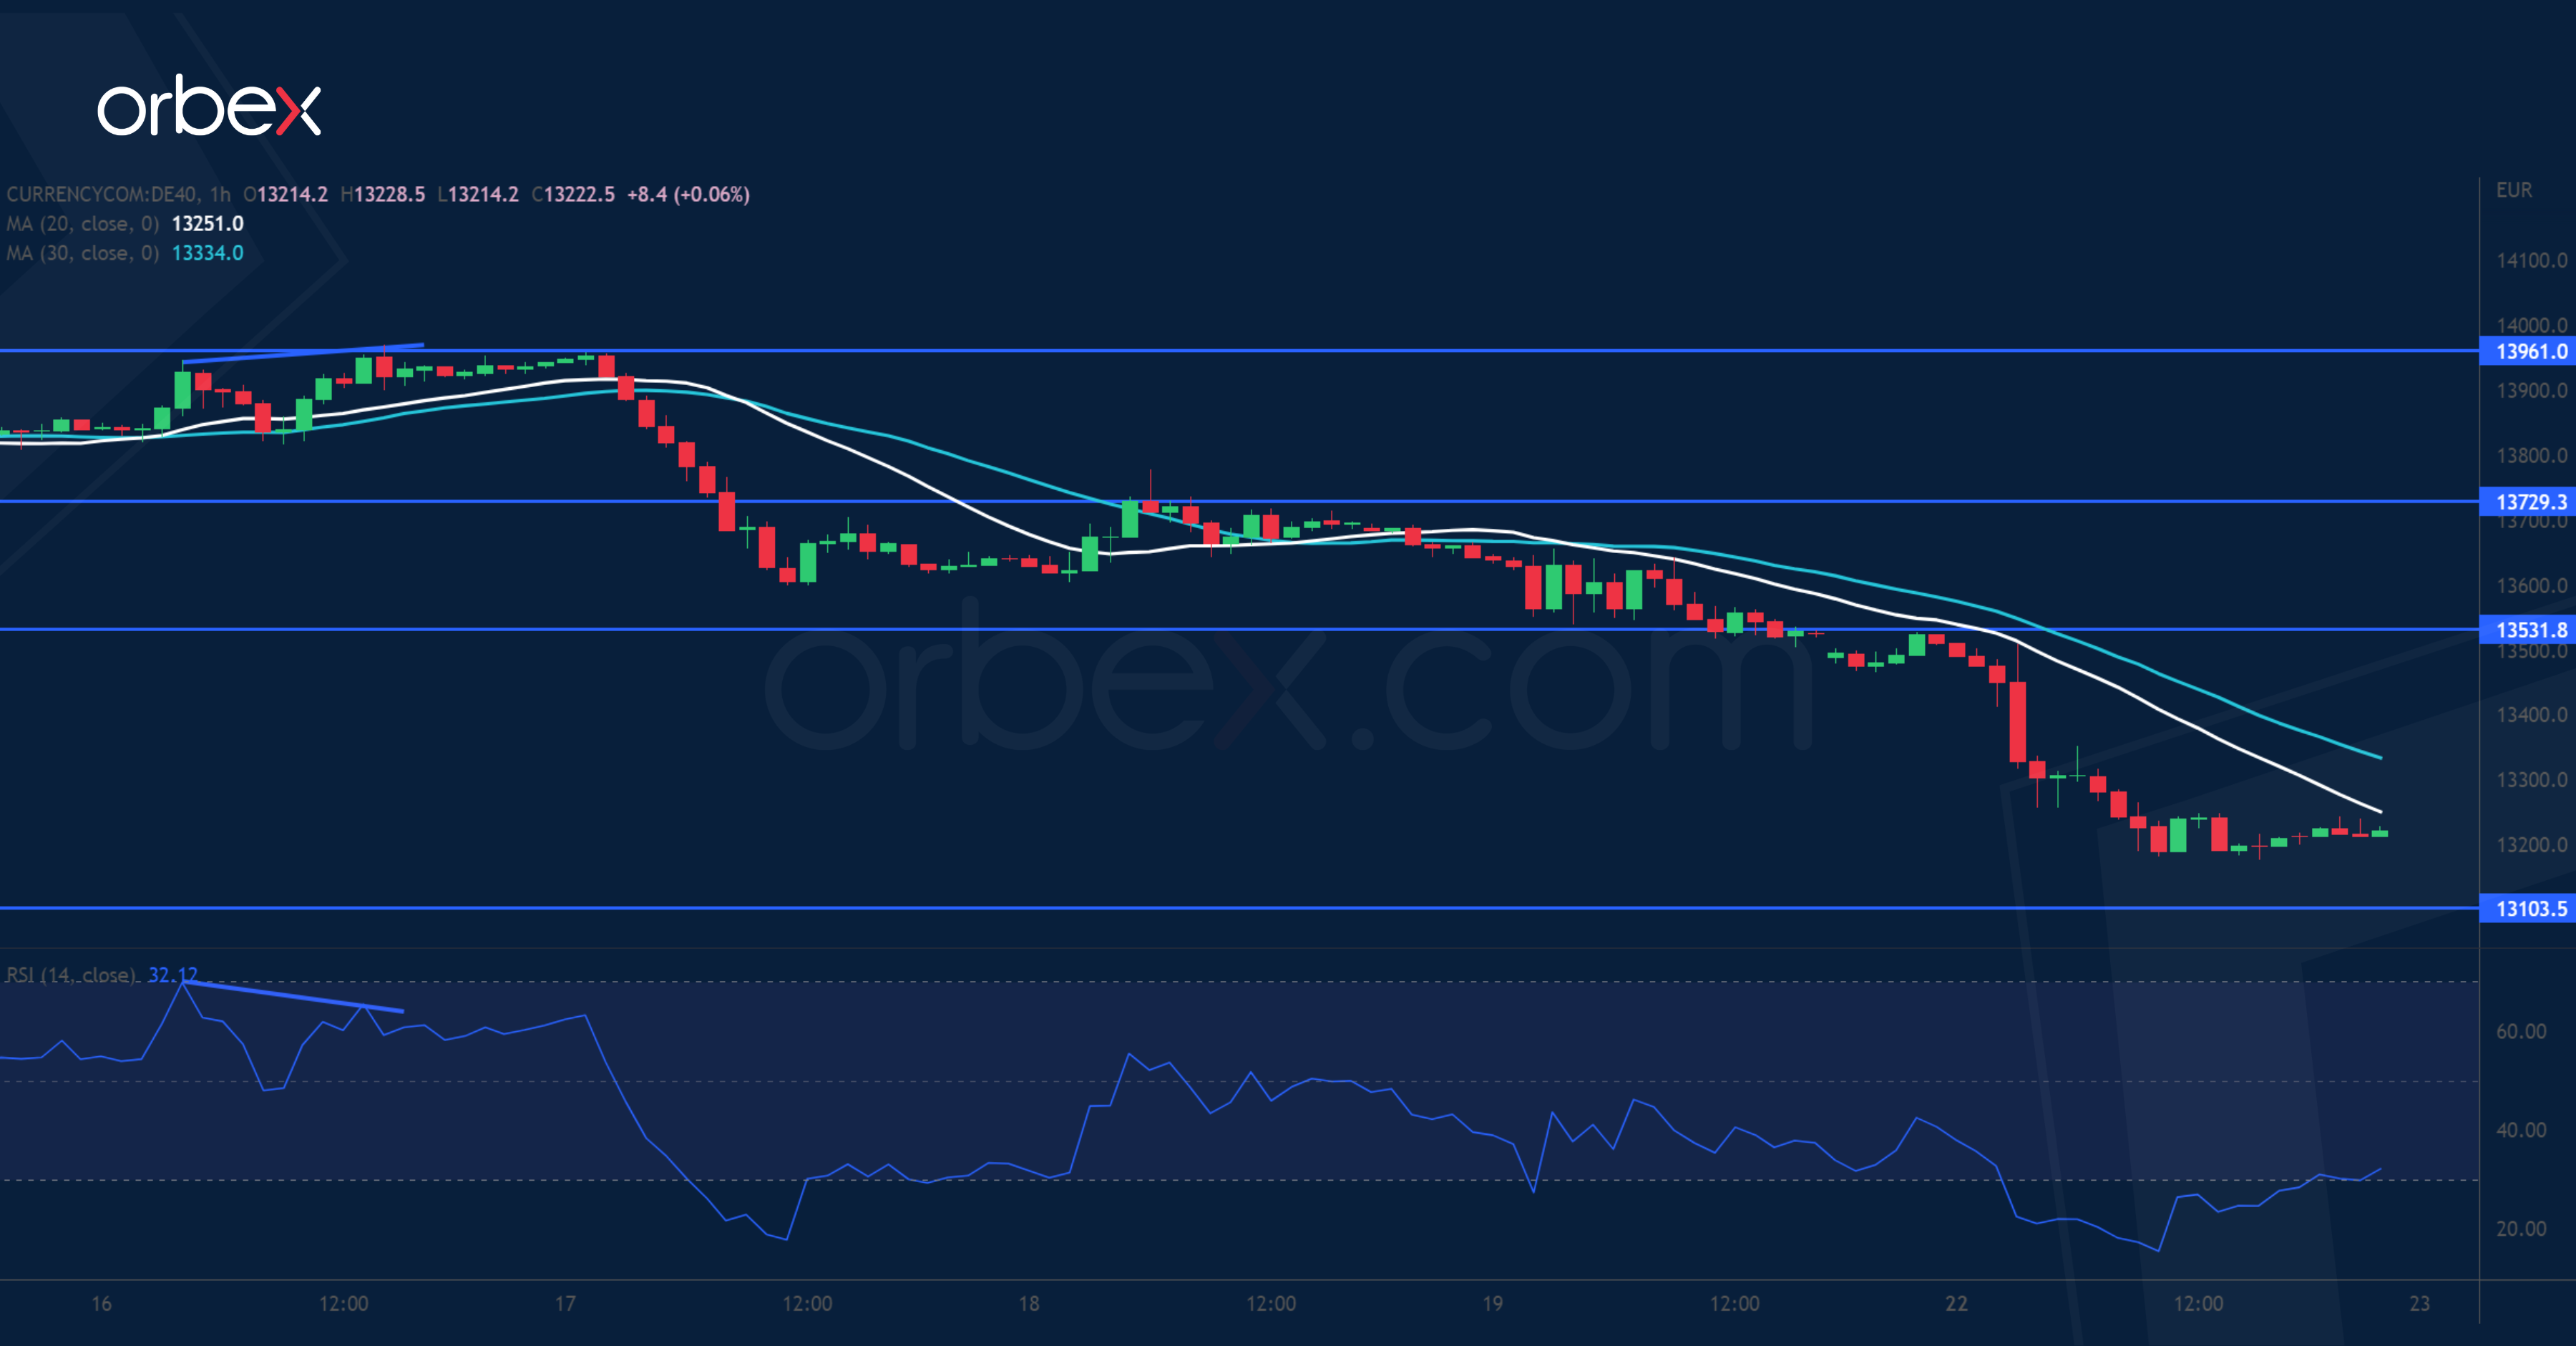
Equities plunge as investors fear that central banks could double down on their fight against inflation. The Dax 40 turned south at the start of a deep correction back in June (13960). As a sign of overextension, a bearish RSI divergence compounded the indicator’s repeated overbought conditions. An initial fall below 13730 forced out short-term positions. Then a dive below 13460 was a liquidation as more buyers bailed out. 13100 is a daily support and its breach could drive bids to 12700. 13530 has turned into a supply area.