Sample Category Title
The Unstoppable Dollar Rally
Monday blues kicked in following a $7 trillion rally since July, which was mainly fueled by the expectation that the recession rhetoric would convince the Federal Reserve (Fed) to stop raising the rates and even start thinking about cutting the rates.
Now that the Jackson Hole meeting approaches, those bets are vanishing, as there is no way the Fed will soften its tone while inflation still hangs around the 8.5% level. Plus, the US jobs market has been giving signs that it’s resilient to the policy tightening – with monthly NFP prints coming in way better than expectations each month. And the earnings season has been better than feared as well.
The unstoppable dollar rally
Yesterday’s equity selloff was escorted with a jump in the US 10-year yield to above 3%, and a rally in the US dollar. The dollar index hit the 109 level yet again, and the broad-based rally in greenback sent the major peers depressed.
The EURUSD sank below parity, even before the print of the PMI figures, which will anyway show that the economic activity in Europe is slowing to a point that the ECB cannot start hiking rates at the same speed than the Fed.
And even if it did, it wouldn’t really bring inflation down, knowing that most of the European inflation problem is triggered by the skyrocketing energy prices; instead of hiking the rates by more than necessary, Christine Lagarde would better beg Putin to restore the energy supply to Europe.
Nat gas prices are hard to watch
The Nordstream pipeline is again closed for maintenance for three days. The last time the pipeline was closed for maintenance, Russians restored the gas flow, but much less. The European nat gas prices took a lift, and are now around 20% higher than the March peak.
The soaring nat gas prices shift the energy demand from gas to oil, throwing support under the crude selloff. The barrel of American crude is consolidating a touch above the $90 per barrel, with growing prospects of further gains toward the $100 per barrel.
Saudi Arabia warned that OPEC+ could reduce its oil output to counter sharp declines in oil prices. Saudi Oil Minister Prince Abdulaziz bin Salman said that the extreme volatility and a lack of liquidity mean that the futures market is increasingly disconnected from fundamentals, and that OPEC+ may be forced to cut production.
At this point, the only hope is to see the Iranian oil hit the market again. If the US and Iran could agree on a nuclear deal, Iran could increase its daily oil production to around 4 mio barrels a day, which could give a much-needed relief to the market.
For now, the oil companies are cashing in. Occidental Petroleum jumped 10% on Friday as the US energy regulator gave an OK to Warren Buffett’s Berkshire Hathaway to acquire 50% stake in the company. But to be honest, oil companies don’t need Warren Buffett to feel the energy. BP is up by around 25% since mid-July, and the BP gains cannot be defined as a bear market rally.
Could the euro sink deeper?
Yes, the EURUSD could sink deeper below parity, but how far it could go will mostly depend on how much the dollar can rally from here?
It is increasingly likely we see the dollar index hit 110 mark, but whether it could extend gains meaningfully above that level is the million-dollar question.
Because if it did, we are all in trouble. Not only that the hawkish central bank expectations don’t live up to the hawkish Fed expectations, but the strong dollar will add to the inflationary pressures elsewhere in the world, leaving other countries in an accelerating inflation spiral due to higher import prices, and with tightening monetary policies that don’t even help getting their currency valuations right.
Pray for the dollar to soften
In precious metals, gold sank below the $1730 level yesterday on the back of a stronger dollar and rising US yields, that increase the opportunity cost of holding the non-interest-bearing gold. The yellow metal no longer acts like a good hedge against market selloffs, it sinks along with the risk assets instead. For that to reverse, we need the dollar to soften.
Risk Off
Market movers today
A key focus today will be the August flash PMIs out in most western countries. In Europe, further declines - as also signalled by ZEW - will probably be in store, as the energy crisis is taking its toll on demand in manufacturing and services, and recession fears are rising.
In the US, lower gasoline prices and a rebound in real incomes may support service sector demand while the manufacturing PMI may still be affected by waning goods demand in line with the New York Empire manufacturing survey last week, which dropped sharply.
In the euro area, we will furthermore get the preliminary consumer confidence number for August, which is set to decline further to record low levels on the back of the huge negative shock to real incomes in Europe from surging inflation.
The 60 second overview
Sour risk sentiment in financial markets: It was again a volatile day in the global financial markets with a solid decline in both equity markets and a significant rise in bond yields. Among other victims were the EUR/USD which fell below parity to its lowest level since 2002. Furthermore, the measure of equity market volatility, the so-called VIX index, jumped almost 15%. Asian equity markets are also in red this morning.
As the Fed is expected to stay hawkish: With no macro releases, the move was driven by the expectation that Fed Chairman Powell will state at the Jackson Hole symposium later this week that the rate hikes from the Federal Reserve are far from over even if the pace of the rate hikes is slowing down.
And the energy woes in Europe deepen: At the same time, the mood in Europe was hit by the announcement from Russia of a temporary closure of the Russian gas pipe to Europe, North Stream 1, from 31 August to 2 September due to an unscheduled maintenance from the Russian side. This led to further 19% spike in European gas prices, worsening the stagflationary outlook for Europe.
FX: The surge in European natural gas prices set the tone in the FX market yesterday with the notoriously vulnerable HUF, PLN, CZK and EUR posting significant losses. EUR/USD broke below parity and hit the lowest levels since 2002. SEK continues to trade poorly while NOK has held up remarkably well.
Credit: Yesterday was characterised by negative sentiment in the credit markets with substantial widening in both cash- and CDS indicies. iTraxx main widened 6.7bp to 110.2bp while Xover widened 26.1bp to 551.5bp. In spite of the weak sentiment, several new bond deals were announced, with issuers probably exploiting that the full European investor community is now back from holidays.
Nordic macro
HOX dipped significantly again in July as expected, down 2.9 % mom which puts the decline from peak in March to around 9.0 %. The decline was fairly broad based showing flats and villas declining by 3.5 % mom and 2.7 % mom respectively. Surely this adds to the notion that Sweden is heading for serious times.
EUR/USD Daily Outlook
Daily Pivots: (S1) 0.9897; (P) 0.9972; (R1) 1.0018; More...
EUR/USD's break of 0.9951 support confirms down trend resumption. Intraday bias stays on the downside for 61.8% projection of 1.0773 to 0.9951 from 1.0368 at 0.9860. Firm break there should prompt downside acceleration to 100% projection at 0.9546. On the upside, above 1.0045 minor resistance will turn intraday bias neutral and bring consolidations. But recovery should be limited well below 1.0368 resistance to bring fall resumption.
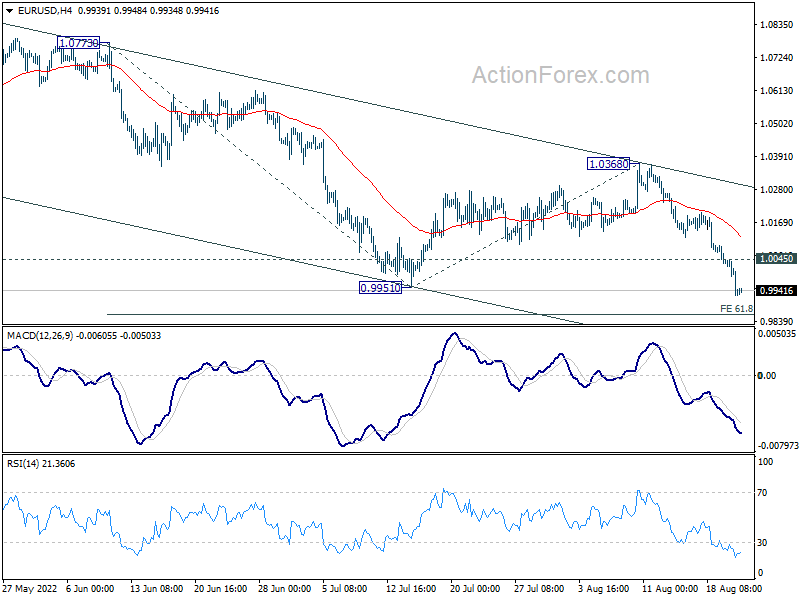
In the bigger picture, down trend from 1.6039 (2008 high) is still in progress. Next target is 100% projection of 1.3993 to 1.0339 from 1.2348 at 0.8694. In any case, outlook will stay bearish as long as 1.0368 resistance holds, in case of strong rebound.
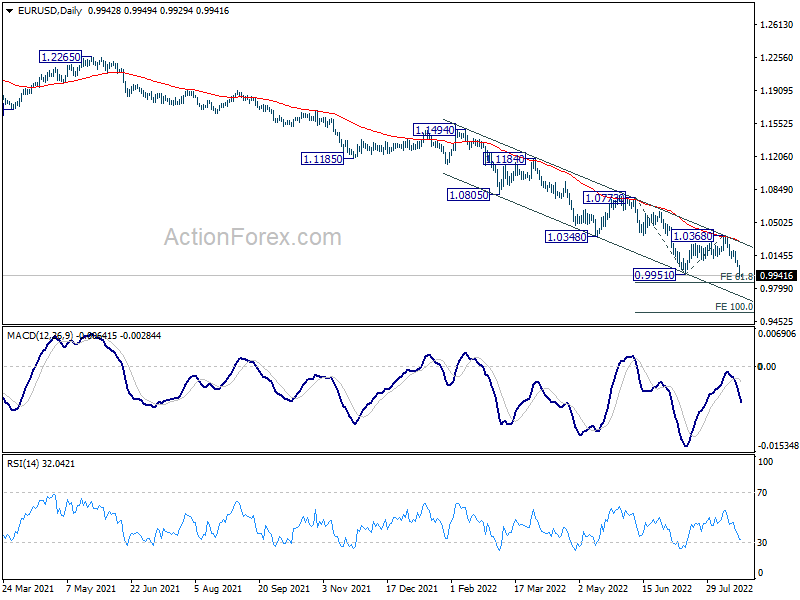
EUR/USD Breaks to New Low, Good Bye Parity
European majors, including the Swiss Franc, are under much selling pressure currently. EUR/USD dived through parity, and hit a new low. The development came on worries that Russia will further weaponize its natural gas supplies to Europe, adding further weight to the already troubled economy. Dollar is strong as supported by rising treasury yield, with 10-year yield back above 3% handle. But Aussie and Kiwi are so far also resilient. Yen is mixed with counter forces of risk-aversion and rising yields.
Technically, a focus for the week is US 10-year yield's reaction to 3.101 resistance, as reaction to Jackson Hole symposium too. Firm break there could prompt some upside acceleration towards 3.483 high before the end of the quarter. Such development, if happens, could also come with deeper selloff in stocks, and give support to the greenback. Anyway, a roller coaster is probably awaiting in September.
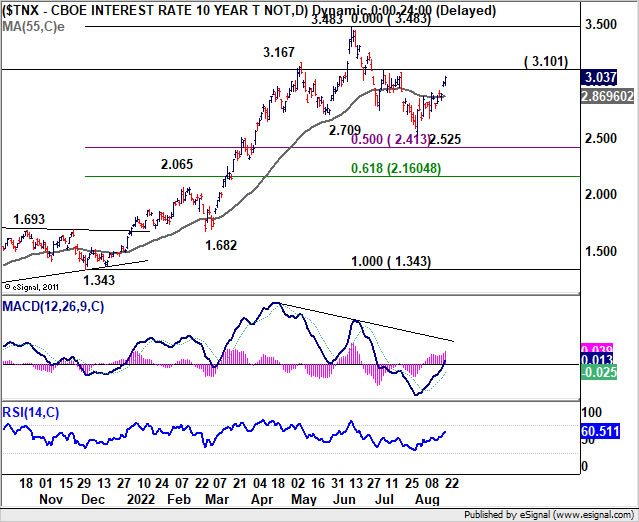
In Asia, at the time of writing, Nikkei is down -1.16%. Hong Kong HSI is down -0.49%. China Shanghai SSE is up 0.18%. Singapore Strait Times is down -0.61%. 10-year yield is down -0.0089 at 0.222. Overnight, DOW dropped -1.91%. S&P 500 dropped -2.14%. NASDAQ dropped -2.55%. 10-year yield rose 0.048 to 3.037.
Japan PMI manufacturing dropped to 51 in Aug, services down to 49.2
Japan PMI Manufacturing dropped from 52.1 to 51.0 in August, below expectation of 51.8. PMI Manufacturing Output dropped from 49.7 to 48.3. That's also the lowest level in 19 months. PMI Services dropped from 50.3 to 49.2, first contraction since March. PMI Composite dropped from 50.2 to 48.9, first contraction since February.
Usamah Bhatti, Economist at S&P Global Market Intelligence, said: "The latest Flash PMI data showed that Japanese private sector activity declined for the first time since February midway through the third quarter. Both manufacturing and services companies recorded a contraction in output in August, with the former falling at the fastest pace for 11 months.
"August data signalled the second-weakest reading in the composite index so far this year, though the rate of deterioration was only mild. Of concern was the amount of new business received by private sector firms, which reduced for the first time in six months and pointed to further weaknesses to come."
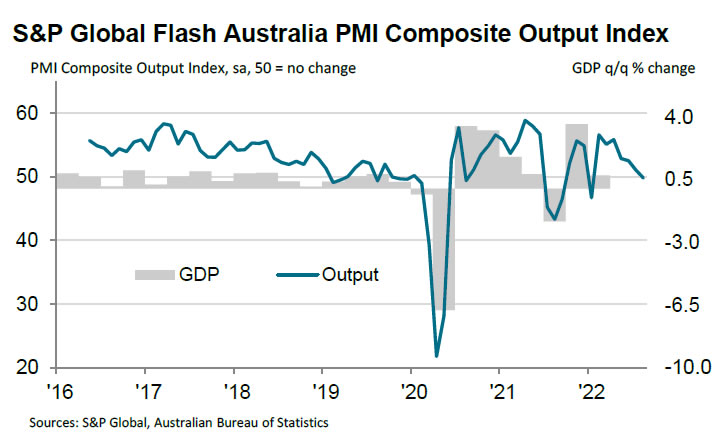
Australia PMI composite output dropped to 49.8, a renewed contraction
Australia PMI Manufacturing dropped from 55.7 to 54.5 in August, a 12-month low. PMI Services dropped from 50.9 to 49.6, a 7-month low. PMI Composite Output dropped from 51.1. to 49.8, a 7-month low.
Laura Denman, Economist at S&P Global Market Intelligence said: "A renewed contraction in Australia's private sector economy indicates that recent interest rate hikes made by the RBA, as well as sustained inflationary pressures, have begun to take a toll on overall demand levels.
"Should new order growth remain subdued, this may help reduce demand-pull inflation factors, but survey data continue to highlight the supply issues that remain prevalent globally, which will continue to keep price levels elevated for the foreseeable.
"As such, the RBA will likely continue along its rate-hiking path, which bodes ill for the wider economy given the latest survey data highlight clear signs of underlying weakness."
EUR/CAD downside breakout, 1.2812 projection level next
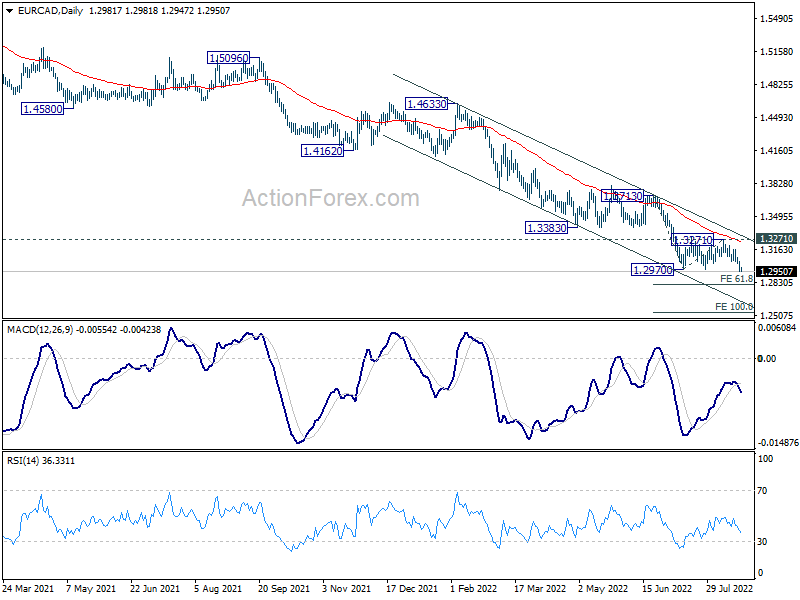
Following broad-based selloff in Euro, EUR/CAD finally broke out of range this week and it's now resuming long term down trend. Outlook is clearly bearish with the cross staying well inside falling channel, with recovered capped by falling 55 day EMA.
Next near term target is 61.8% projection of 1.3713 to 1.2970 from 1.3271 at 1.2812. The main question is whether EUR/CAD would accelerate downward further after hitting 1.2812. In that case, the cross could reach 100% projection at 1.2528 and rather quick manner.
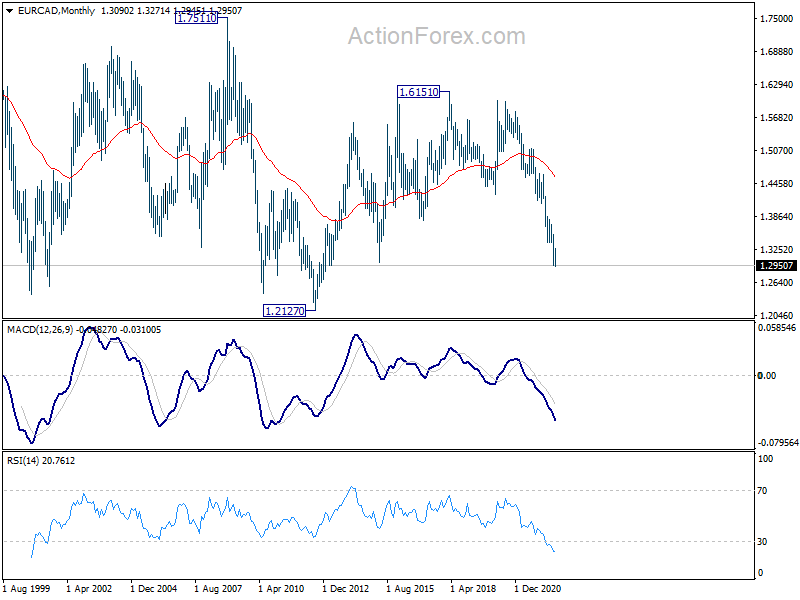
There is no clear support level ahead until 2012 low at 1.2127. In any case, for now, outlook will stay bearish as long as 1.3271 resistance holds.
Looking ahead
PMI data from Eurozone, the UK, and the US are the main features for today. US will also release new home sales.
EUR/USD Daily Outlook
Daily Pivots: (S1) 0.9897; (P) 0.9972; (R1) 1.0018; More...
EUR/USD's break of 0.9951 support confirms down trend resumption. Intraday bias stays on the downside for 61.8% projection of 1.0773 to 0.9951 from 1.0368 at 0.9860. Firm break there should prompt downside acceleration to 100% projection at 0.9546. On the upside, above 1.0045 minor resistance will turn intraday bias neutral and bring consolidations. But recovery should be limited well below 1.0368 resistance to bring fall resumption.
In the bigger picture, down trend from 1.6039 (2008 high) is still in progress. Next target is 100% projection of 1.3993 to 1.0339 from 1.2348 at 0.8694. In any case, outlook will stay bearish as long as 1.0368 resistance holds, in case of strong rebound.
Economic Indicators Update
| GMT | Ccy | Events | Actual | Forecast | Previous | Revised |
|---|---|---|---|---|---|---|
| 23:00 | AUD | Manufacturing PMI Aug P | 54.5 | 57.3 | 55.7 | |
| 23:00 | AUD | Services PMI Aug P | 49.6 | 54 | 50.9 | |
| 00:30 | JPY | Manufacturing PMI Aug P | 51 | 51.8 | 52.1 | |
| 07:15 | EUR | France Manufacturing PMI Aug P | 48.8 | 49.5 | ||
| 07:15 | EUR | France Services PMI Aug P | 53.5 | 53.2 | ||
| 07:30 | EUR | Germany Manufacturing PMI Aug P | 48.1 | 49.3 | ||
| 07:30 | EUR | Germany Services PMI Aug P | 49 | 49.7 | ||
| 08:00 | EUR | Eurozone Manufacturing PMI Aug P | 49 | 49.8 | ||
| 08:00 | EUR | Eurozone Services PMI Aug P | 50.5 | 51.2 | ||
| 08:30 | GBP | Manufacturing PMI Aug P | 51.3 | 52.1 | ||
| 08:30 | GBP | Services PMI Aug P | 52 | 52.6 | ||
| 13:45 | USD | Manufacturing PMI Aug P | 51.5 | 52.2 | ||
| 13:45 | USD | Services PMI Aug P | 50.4 | 47.3 | ||
| 14:00 | USD | New Home Sales M/M Jul | 580K | 590K | ||
| 14:00 | EUR | Eurozone Consumer Confidence Aug P | -28 | -27 |
EUR/CAD downside breakout, 1.2812 projection level next
Following broad-based selloff in Euro, EUR/CAD finally broke out of range this week and it's now resuming long term down trend. Outlook is clearly bearish with the cross staying well inside falling channel, with recovered capped by falling 55 day EMA.
Next near term target is 61.8% projection of 1.3713 to 1.2970 from 1.3271 at 1.2812. The main question is whether EUR/CAD would accelerate downward further after hitting 1.2812. In that case, the cross could reach 100% projection at 1.2528 and rather quick manner.
There is no clear support level ahead until 2012 low at 1.2127. In any case, for now, outlook will stay bearish as long as 1.3271 resistance holds.
Japan PMI manufacturing dropped to 51 in Aug, services down to 49.2
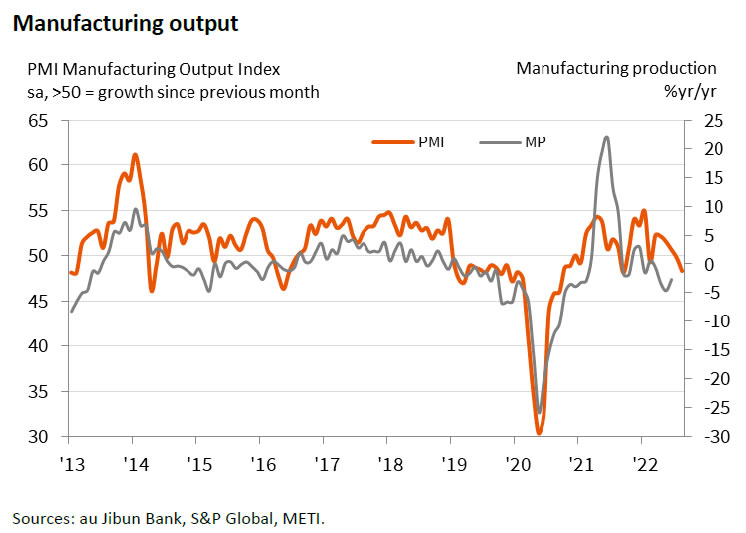
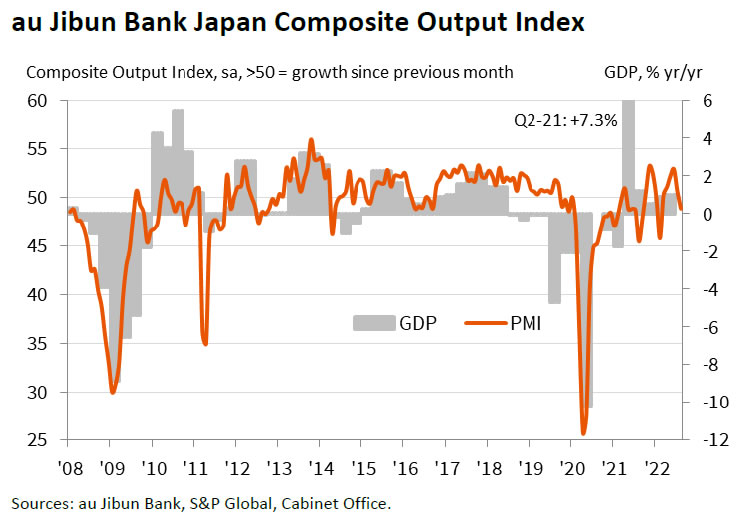
Japan PMI Manufacturing dropped from 52.1 to 51.0 in August, below expectation of 51.8. PMI Manufacturing Output dropped from 49.7 to 48.3. That's also the lowest level in 19 months. PMI Services dropped from 50.3 to 49.2, first contraction since March. PMI Composite dropped from 50.2 to 48.9, first contraction since February.
Usamah Bhatti, Economist at S&P Global Market Intelligence, said: "The latest Flash PMI data showed that Japanese private sector activity declined for the first time since February midway through the third quarter. Both manufacturing and services companies recorded a contraction in output in August, with the former falling at the fastest pace for 11 months.
"August data signalled the second-weakest reading in the composite index so far this year, though the rate of deterioration was only mild. Of concern was the amount of new business received by private sector firms, which reduced for the first time in six months and pointed to further weaknesses to come."
Australia PMI composite output dropped to 49.8, a renewed contraction
Australia PMI Manufacturing dropped from 55.7 to 54.5 in August, a 12-month low. PMI Services dropped from 50.9 to 49.6, a 7-month low. PMI Composite Output dropped from 51.1. to 49.8, a 7-month low.
Laura Denman, Economist at S&P Global Market Intelligence said: "A renewed contraction in Australia's private sector economy indicates that recent interest rate hikes made by the RBA, as well as sustained inflationary pressures, have begun to take a toll on overall demand levels.
"Should new order growth remain subdued, this may help reduce demand-pull inflation factors, but survey data continue to highlight the supply issues that remain prevalent globally, which will continue to keep price levels elevated for the foreseeable.
"As such, the RBA will likely continue along its rate-hiking path, which bodes ill for the wider economy given the latest survey data highlight clear signs of underlying weakness."
Technical Outlook and Review
USD/JPY:
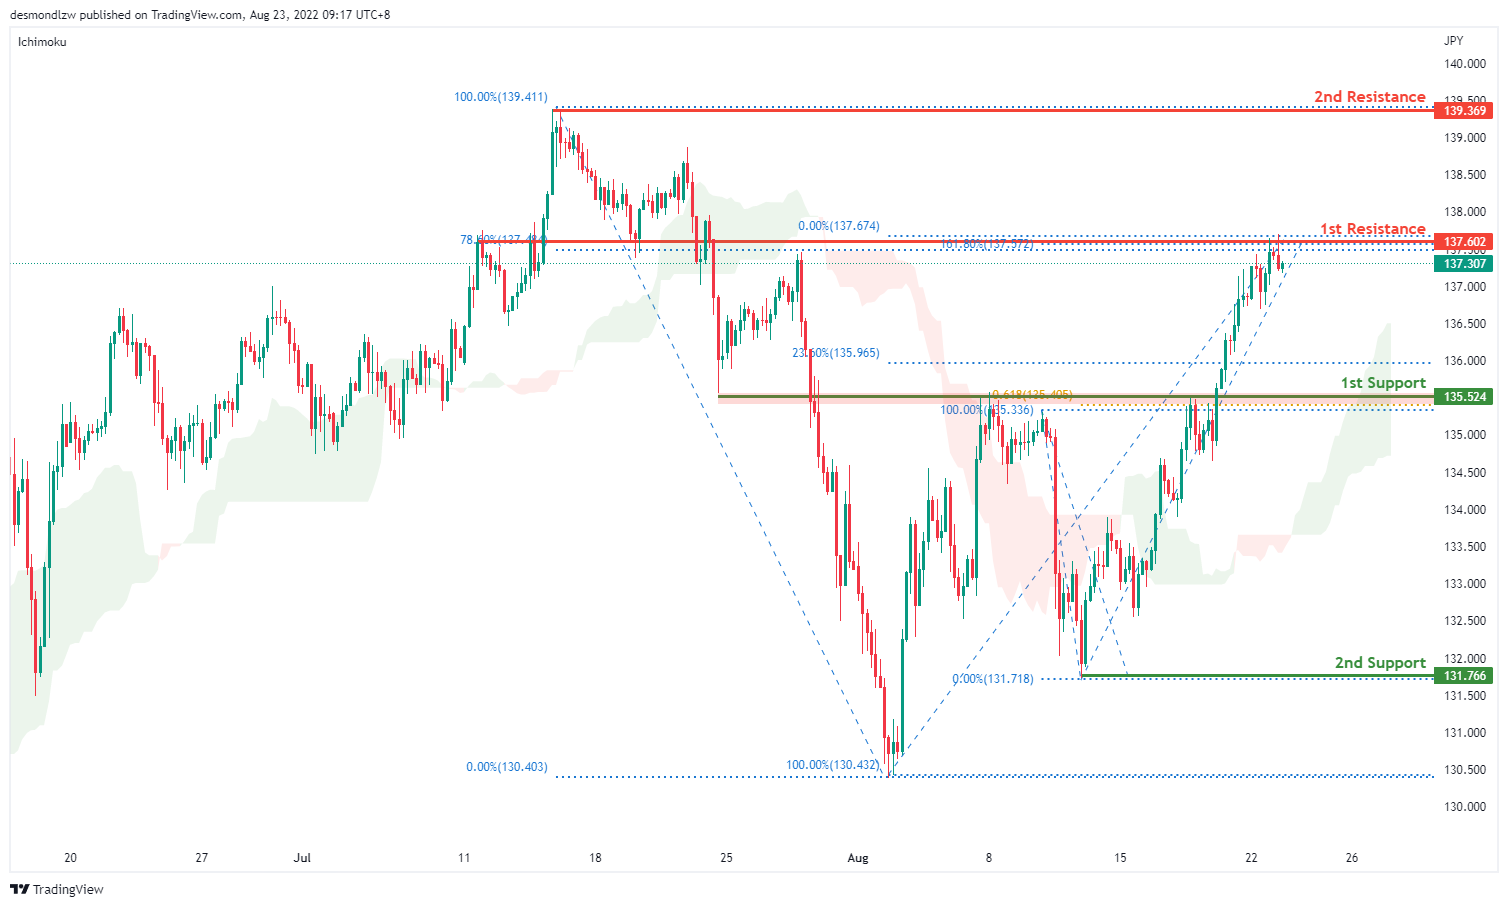
On the H4 chart, price has confirmed a bullish momentum breaking the previous high and testing the first resistance at 137.602 where the 78.6% fibonacci retracement and 161.8% extension sits. If bullish momentum continues, it will bring the price to 139.369 where the swing high sits. Alternatively if price pulls back, it should test the first support at 135.524 and the second support at 131.766
Areas of consideration:
- H4 time frame, 1st resistance at 137.602
- H4 time frame, 1st support at 131.766
DXY:
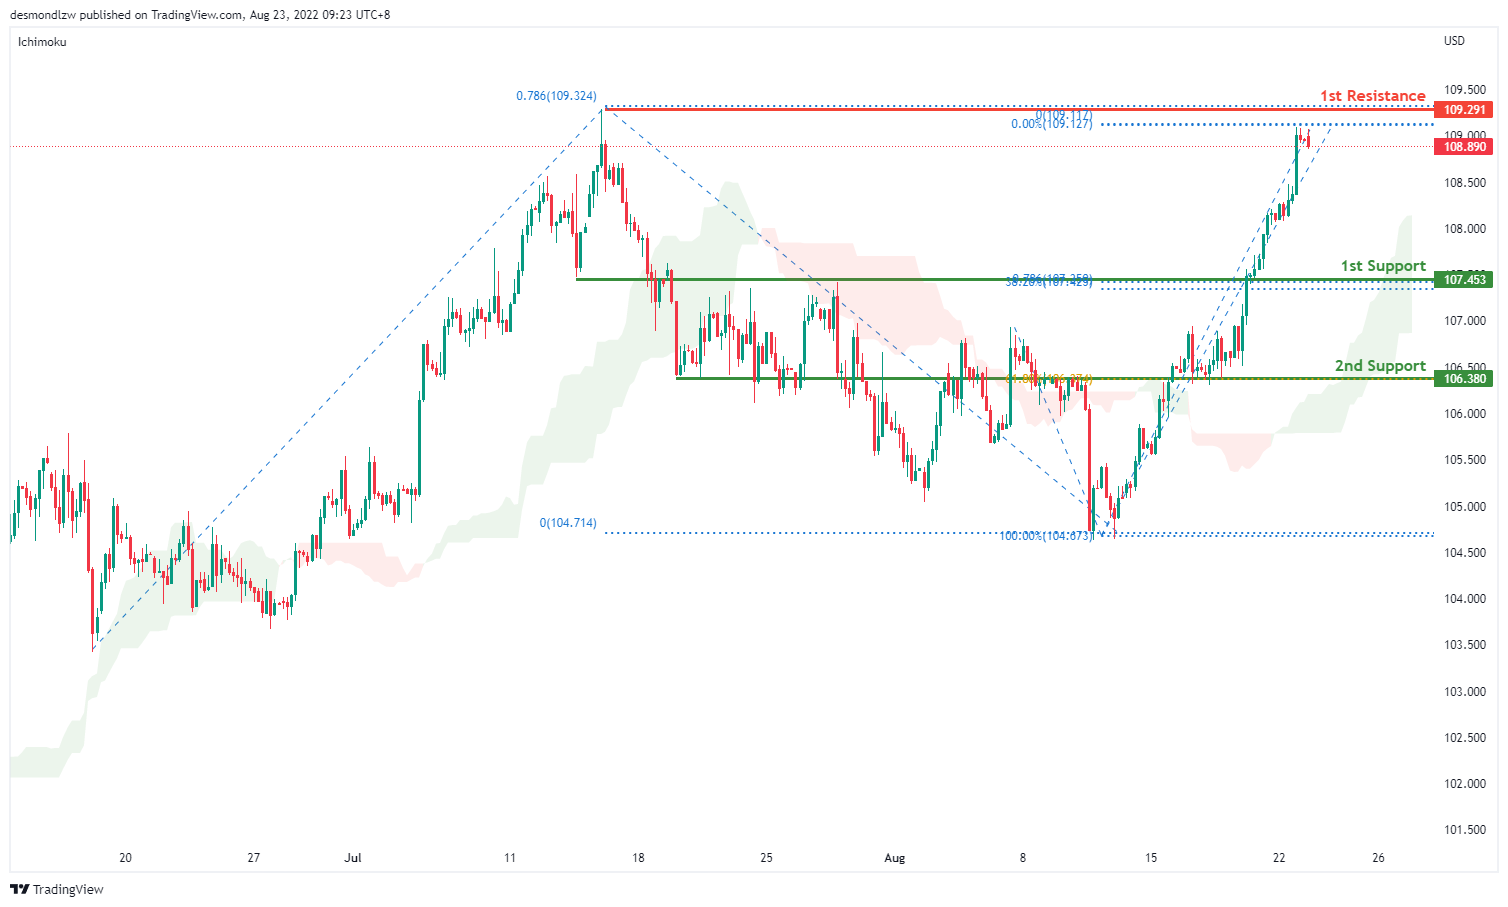
On the H4, prices seem to be moving in an ascending trend and is in a bullish momentum. Price is moving toward first resistance at 109.291 where the 78.6% Fibonacci projection and the previous swing high sits. If price fails to break the first resistance, it will pull back to test the first support at 107.453 where the 38.2% retracement and 78.6% projection sits and subsequently the second support at 106.380 where the 61.8% retracement sits
Areas of consideration:
- H4 time frame, 1st resistance at 109.291
- H4 time frame, 1st support at 107.453
EUR/USD :
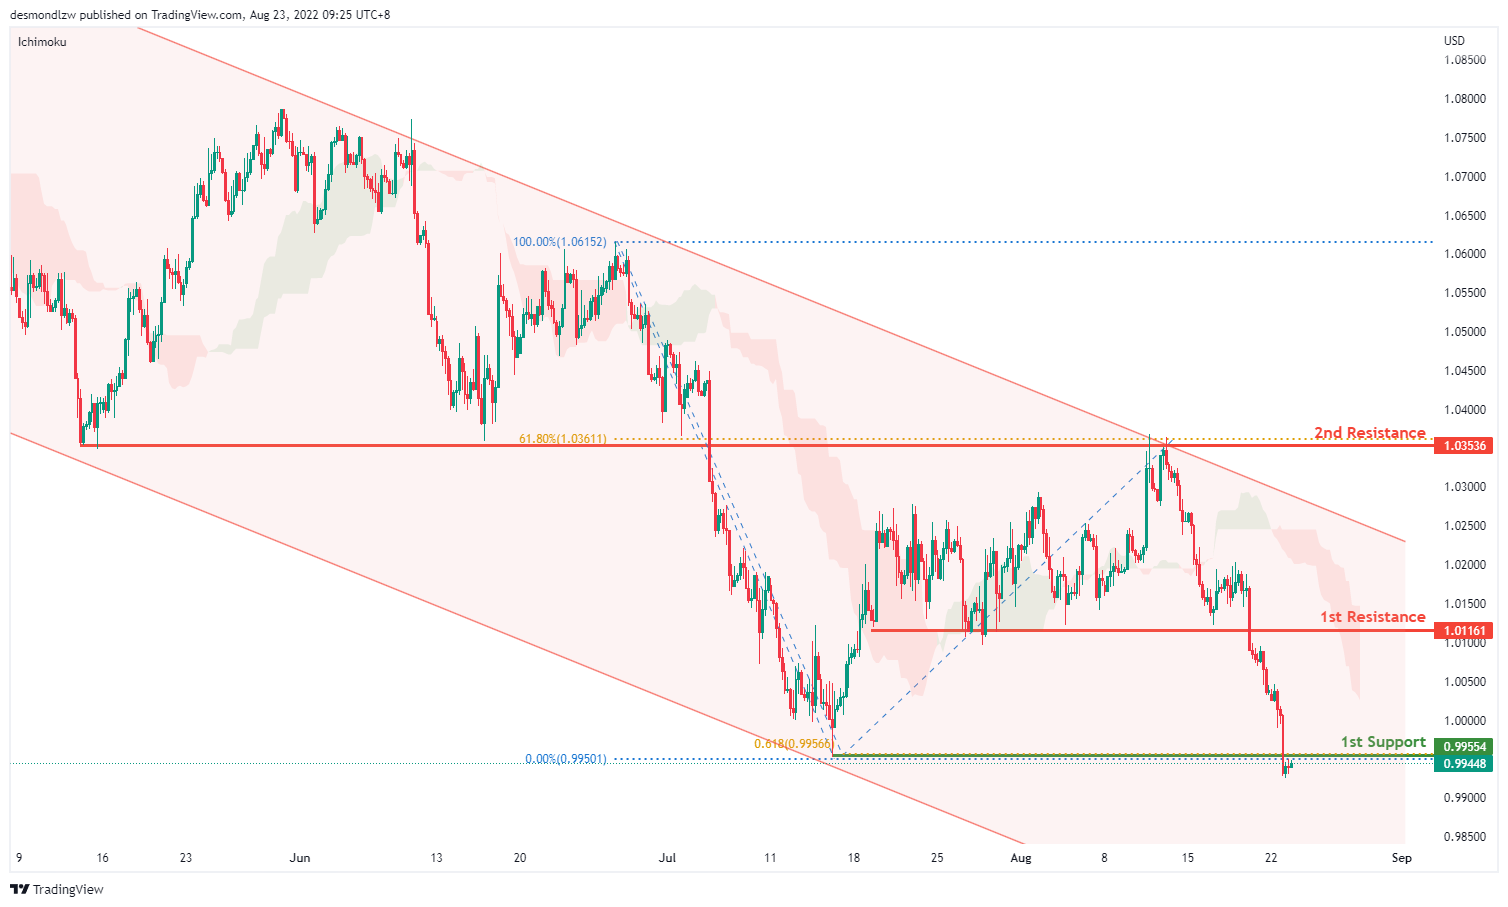
On the H4, prices have broken the ascending trend and are below the ichimoku indicator, we are bearish bias. Prices are testing the first support at 0.9955 where the 61.8% projection sits. Alternatively, prices could pull back to test the first resistance at 1.0116 where the previous swing low sits and subsequently the second resistance at 1.0353 where the 61.8% retracement and swing high sits
Areas of consideration :
- H4 1st resistance at 1.0116
- H4 1st support at 0.9955
GBP/USD:
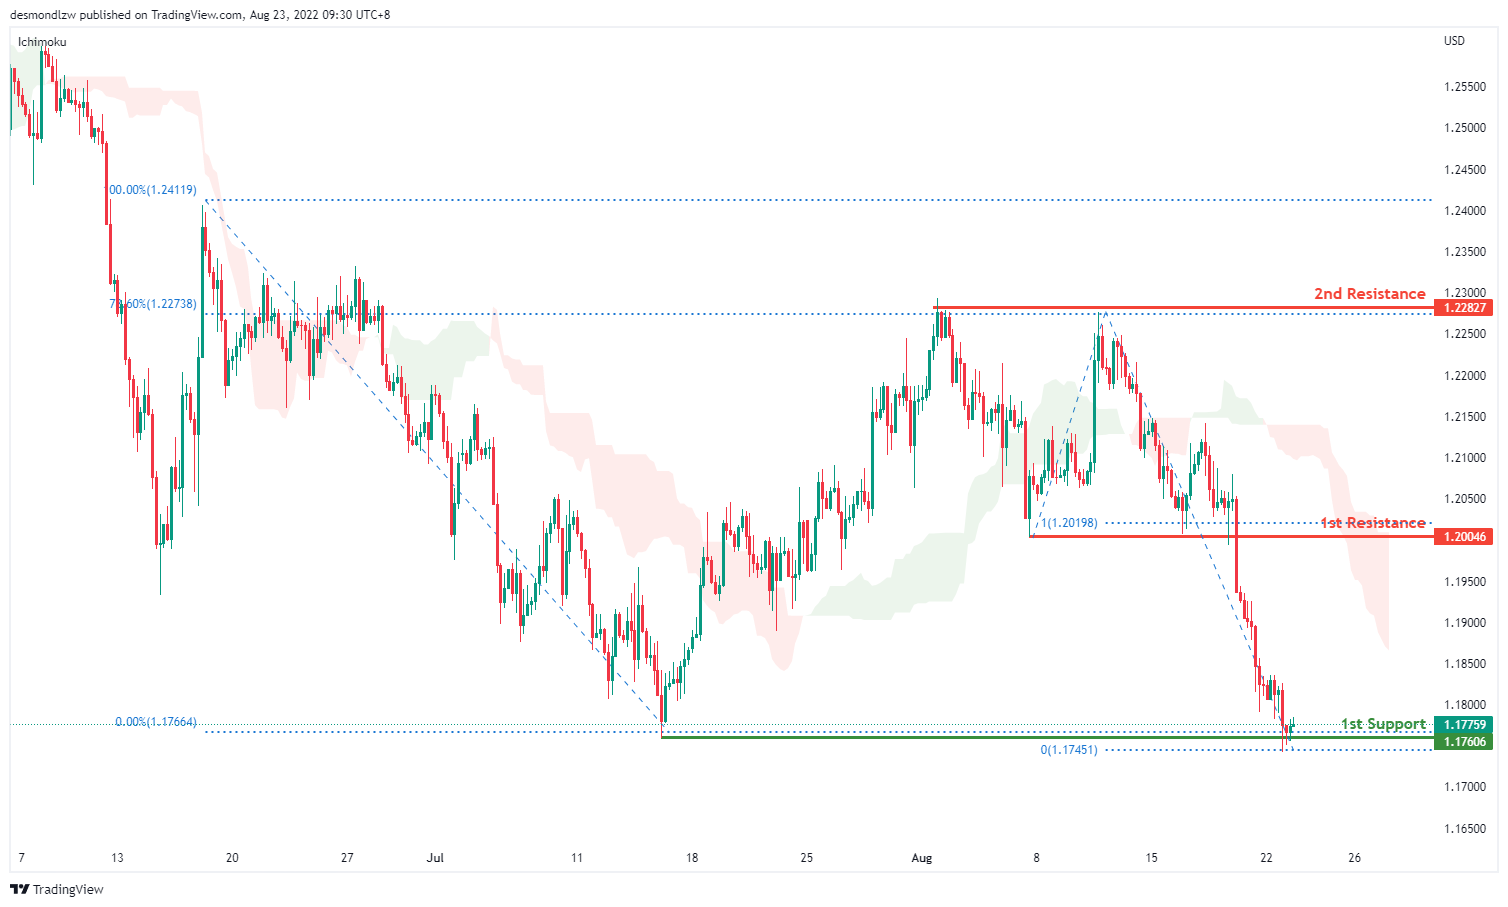
On the H4, prices seem to be in a bearish momentum. It is currently testing the first support at 1.1760 where the swing low sits. Alternatively, price can pull back to test the first resistance at 1.2004 where the 50% retracement and 100% projection sits. Subsequently testing the second resistance at 1.2282 where 78.6% retracement and the swing high sits
Areas of consideration:
- H4 1st resistance at 1.2004
- H4 1st support at 1.1760
USD/CHF:
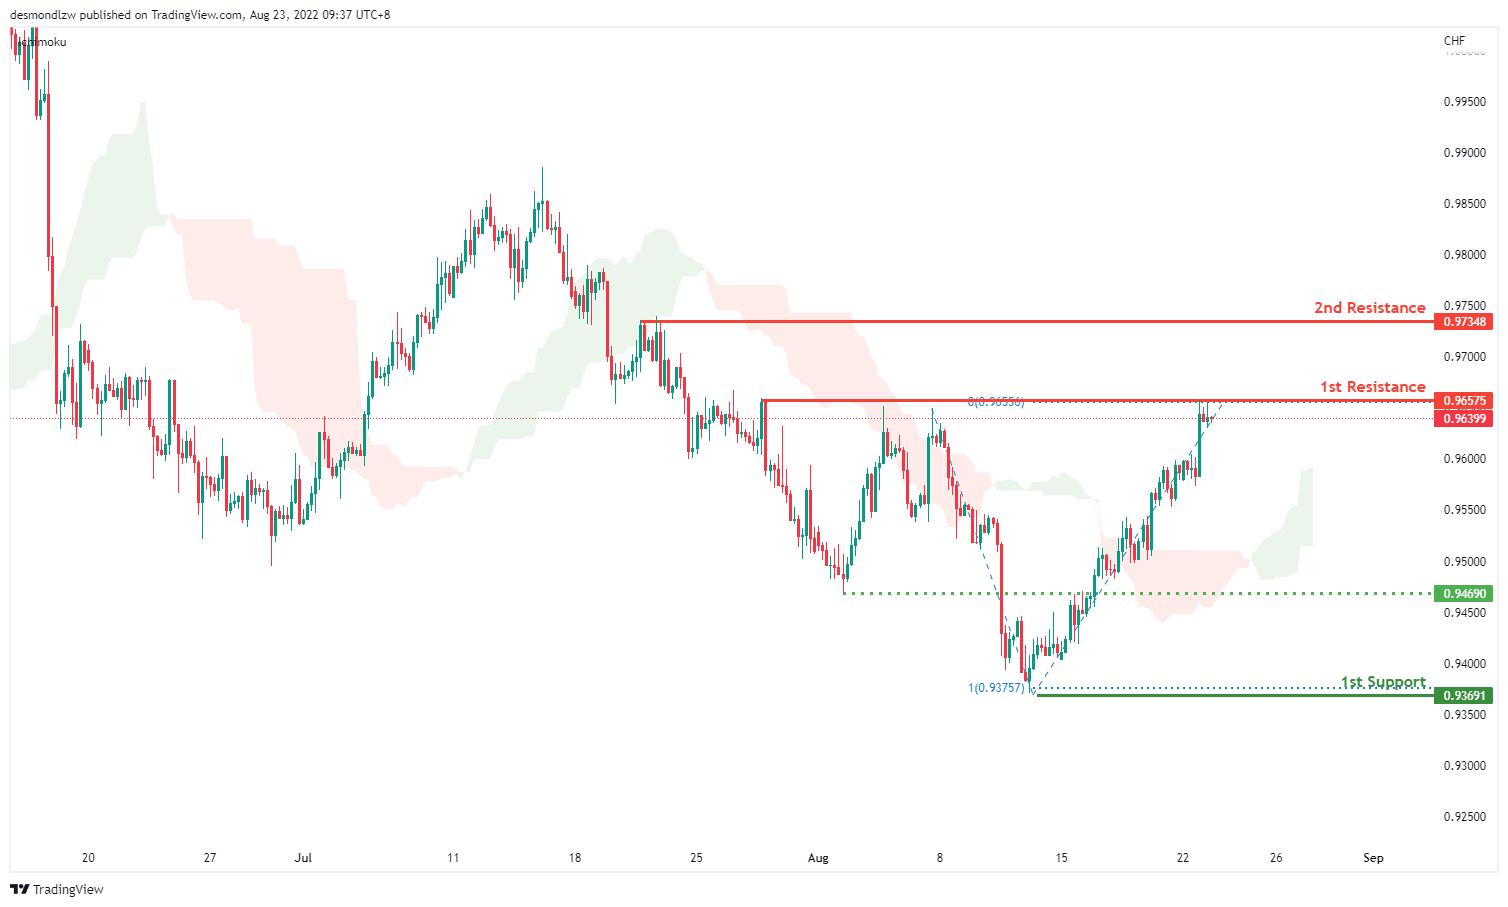
On the H4, with prices moving above the ichimoku cloud and breaking the descending trend, we are bullish bias. Price seems like it’s rising toward the first resistance at 0.9657 where the 61.8% fibonacci retracement sits. If price continues with the bullish momentum it will test the second resistance at 0.9737. Alternatively, prices could test the intermediate support at 0.9469 where the swing low sits and then the first support at 0.9369 where the 78.6% fibonacci retracement sits
Areas of consideration
- H4 1st support at 0.9369
- H4 1st resistance at 0.9657
XAU/USD (GOLD):
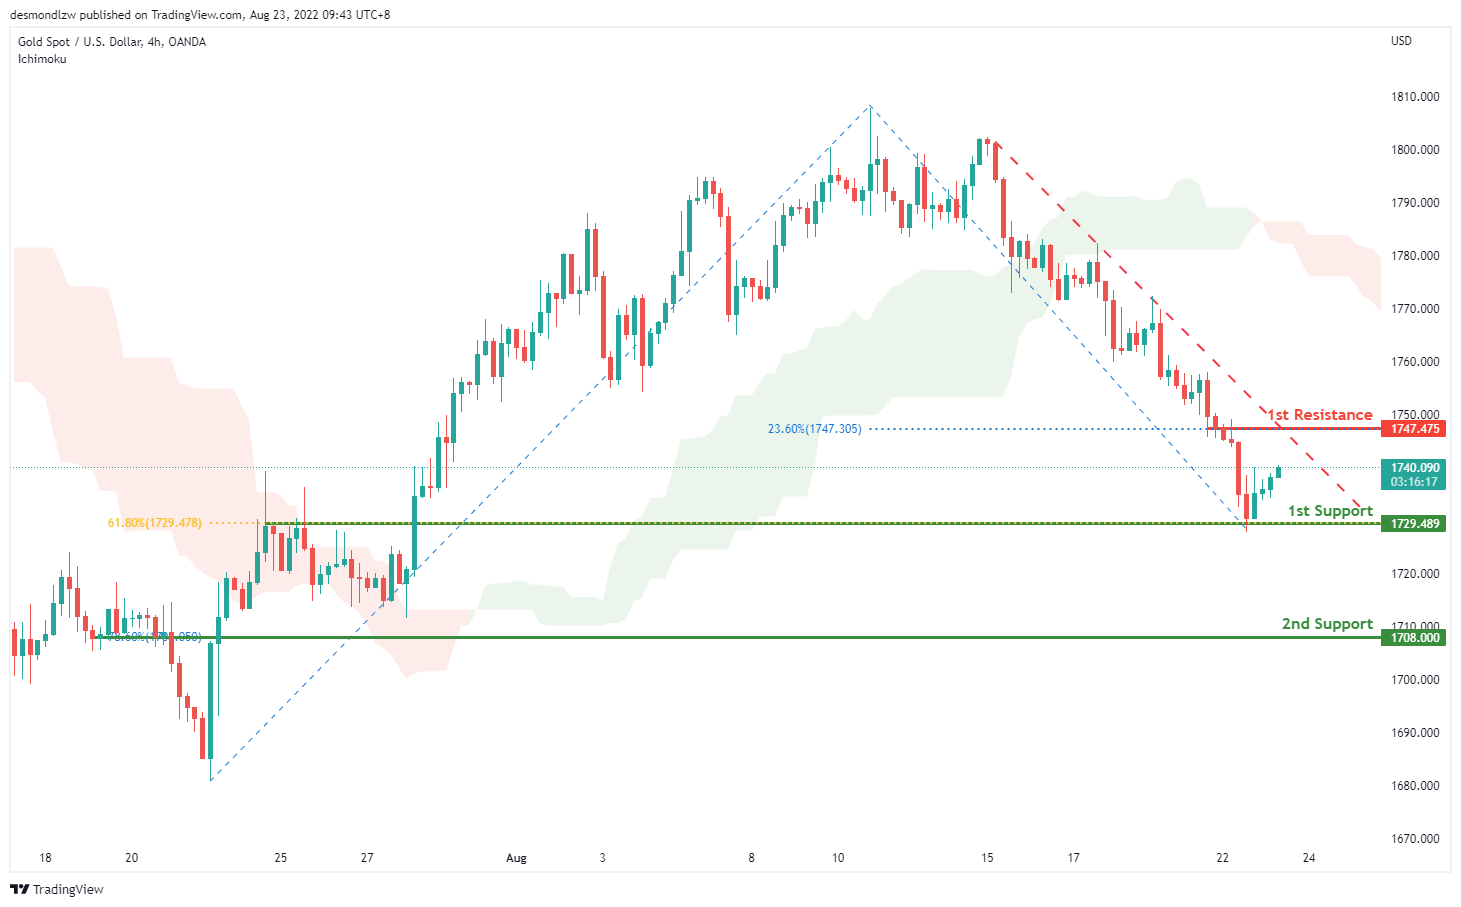
On the H4, with prices moving within the descending trendline, below ichimoku cloud, we have a bearish bias that the price may drop from the 1st support at 1729.489, which is in line with the 61.8% fibonacci retracement to the 2nd support at 1708.000, where the 78.6% fibonacci retracement is. Alternatively, the price may pullback and rise to the 1st resistance at 1747.475, where the 23.6% fibonacci retracement is.
Areas of consideration:
- H4 time frame, 1st support at 1729.489
- H4 time frame, 2nd support at 1708.000
AUD/USD:
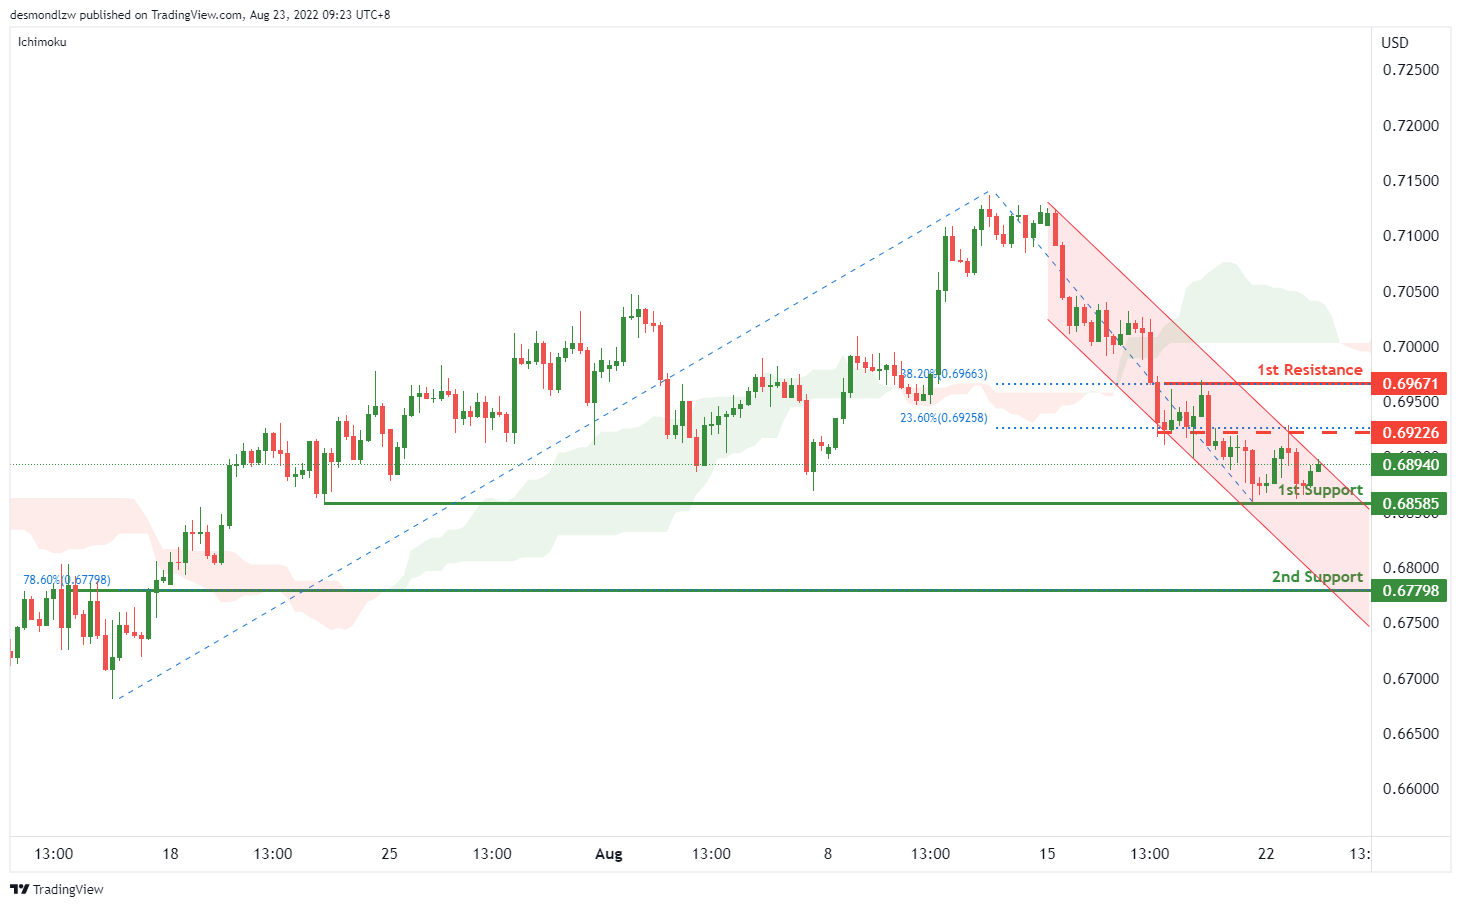
On the H4, with the price going within the descending channel and below ichimoku cloud, we have a bearish bias that the price may drop to the 1st support at 0.68585, which is in line with the previous swing low. If the price breaks the 1st support, we can expect it to drop to the 2nd support at 0.67798, where the 78.6% fibonacci retracement is. Alternatively, the price may break the descending channel and rise to the 1st resistance at 0.69671, where the swing high and 38.2% fibonacci retracement are. Take note the price of 0.69226 could be our intermediate resistance, which is in line with the 23.6% fibonacci retracement.
Areas of consideration
- H4 1st support at 0.68585
- H4 2nd support at 0.67798
NZD/USD:
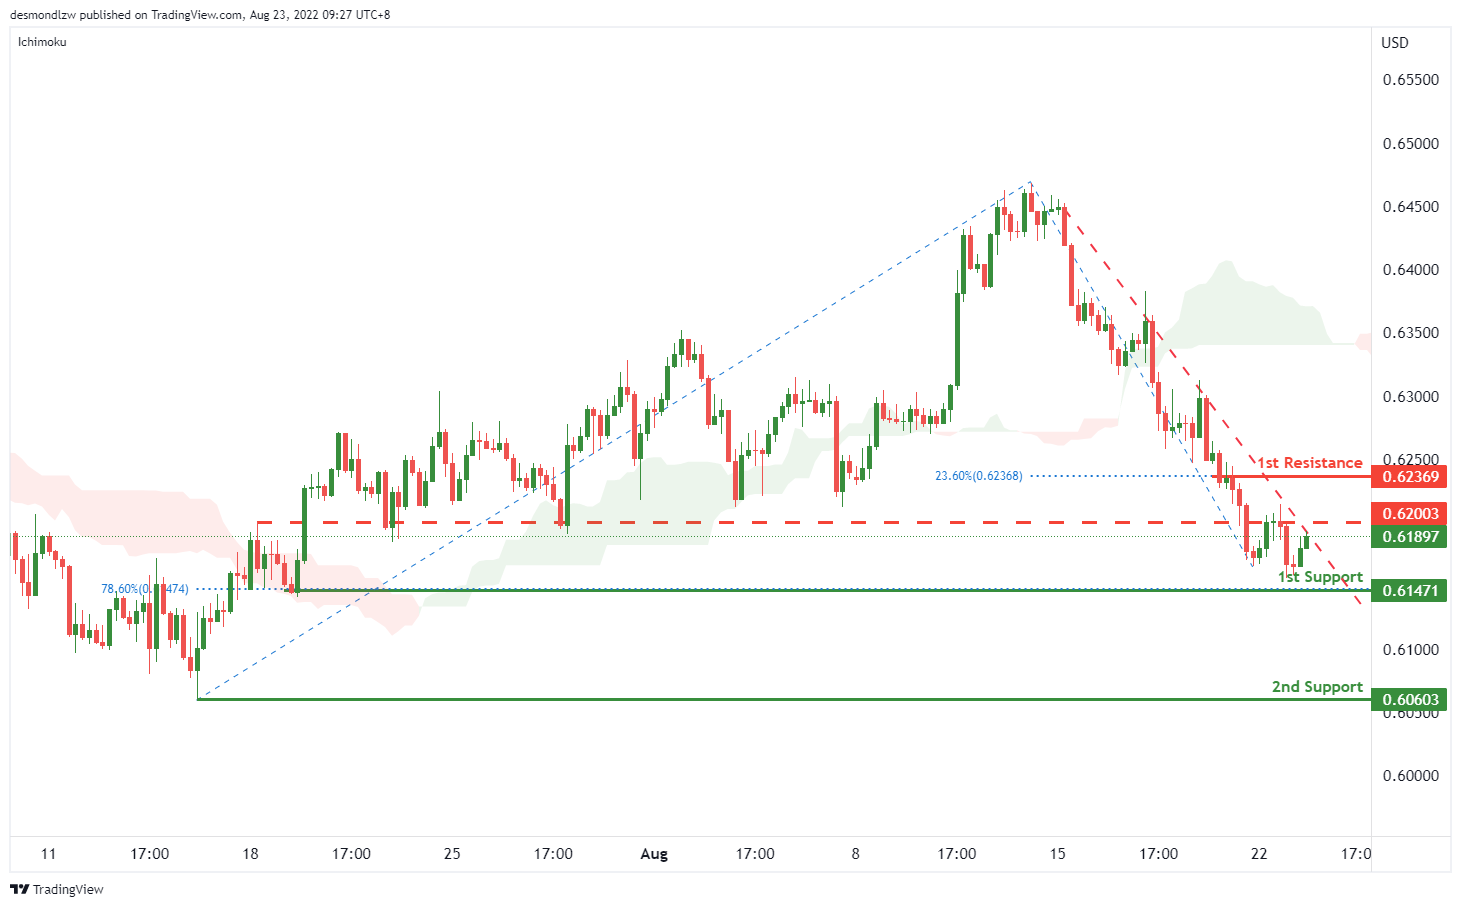
On the H4, with the price moving within the descending trendline, below ichimoku cloud and MACD indicators are below zero, we have a bearish bias that the price may drop to the 1st support at 0.61471, which is in line with the 78.6% fibonacci retracement and pervious swing low, if the price continue dropping, the price may drop to the 2nd support at 0.60603, which is in line with the swing low. Alternatively, the price may rise to the 1st resistance at 0.62369, where the 23.6% fibonacci retracement is. Take note the price of 0.62003 could be the intermediate resistance, which is the overlap resistance.
Areas of consideration:
- H4 time frame, 1st support at 0.61471
- H4 time frame, 2nd support at 0.60603
USD/CAD:
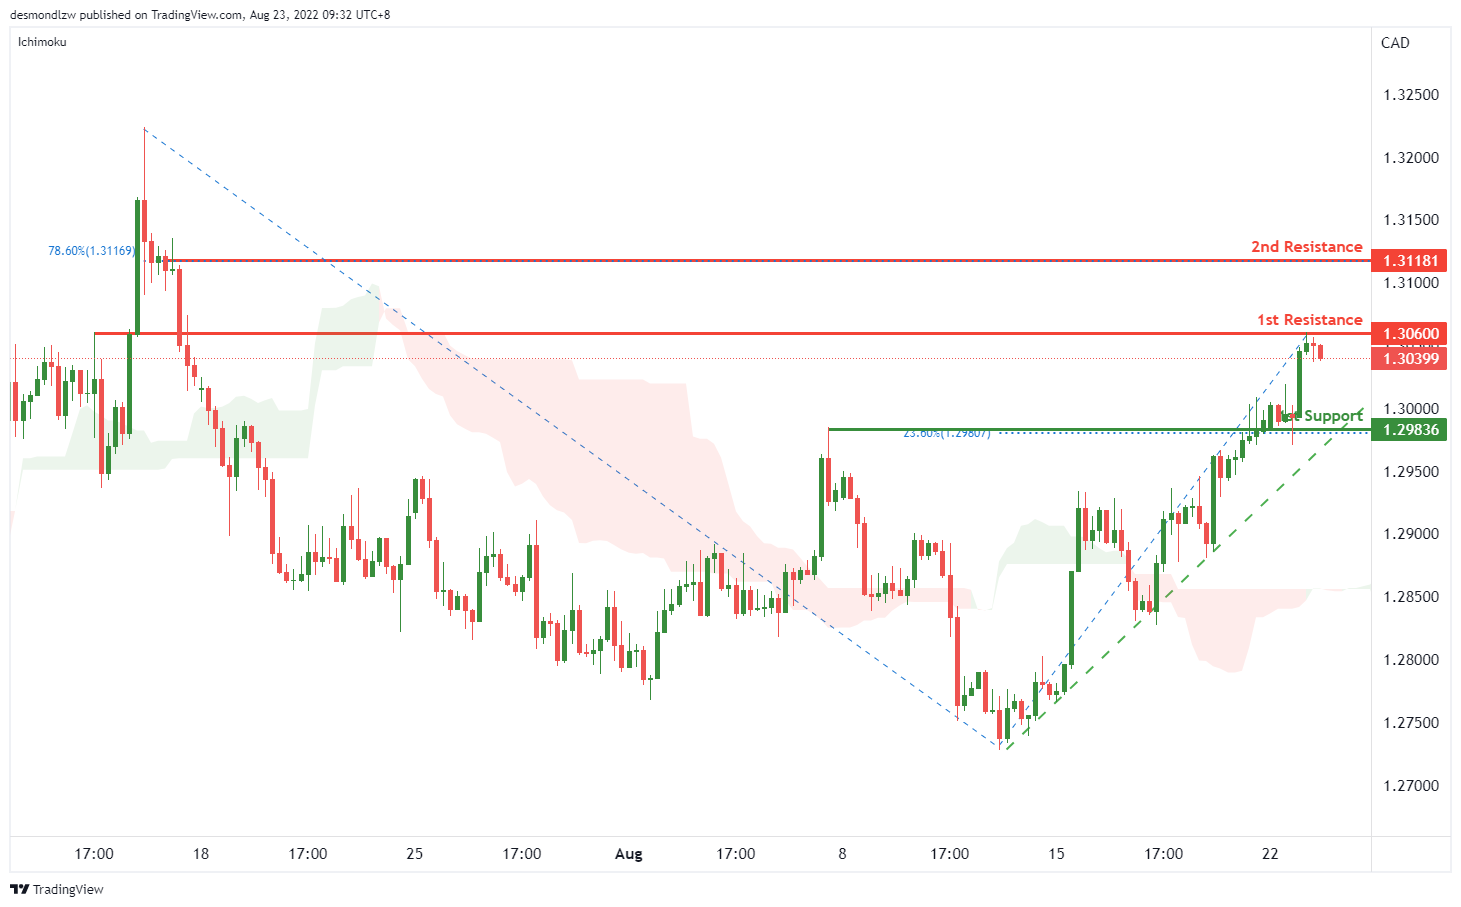
On the H4, with the price above the ichimoku cloud and moving within the ascending trendline, we have a bullish bias that if the price break the 1st resistance at 1.30600, which is the current swing high, the price may rise to the 2nd resistance at 1.31181, which is in line with 78.6% fibonacci retracement. Alternatively, the price may drop to the 1st support at 1.29836, where the 23.6% fibonacci retracement is.
Areas of consideration:
- H4 time frame, 1st resistance at 1.30600
- H4 time frame, 2nd resistance at 1.31181
OIL:
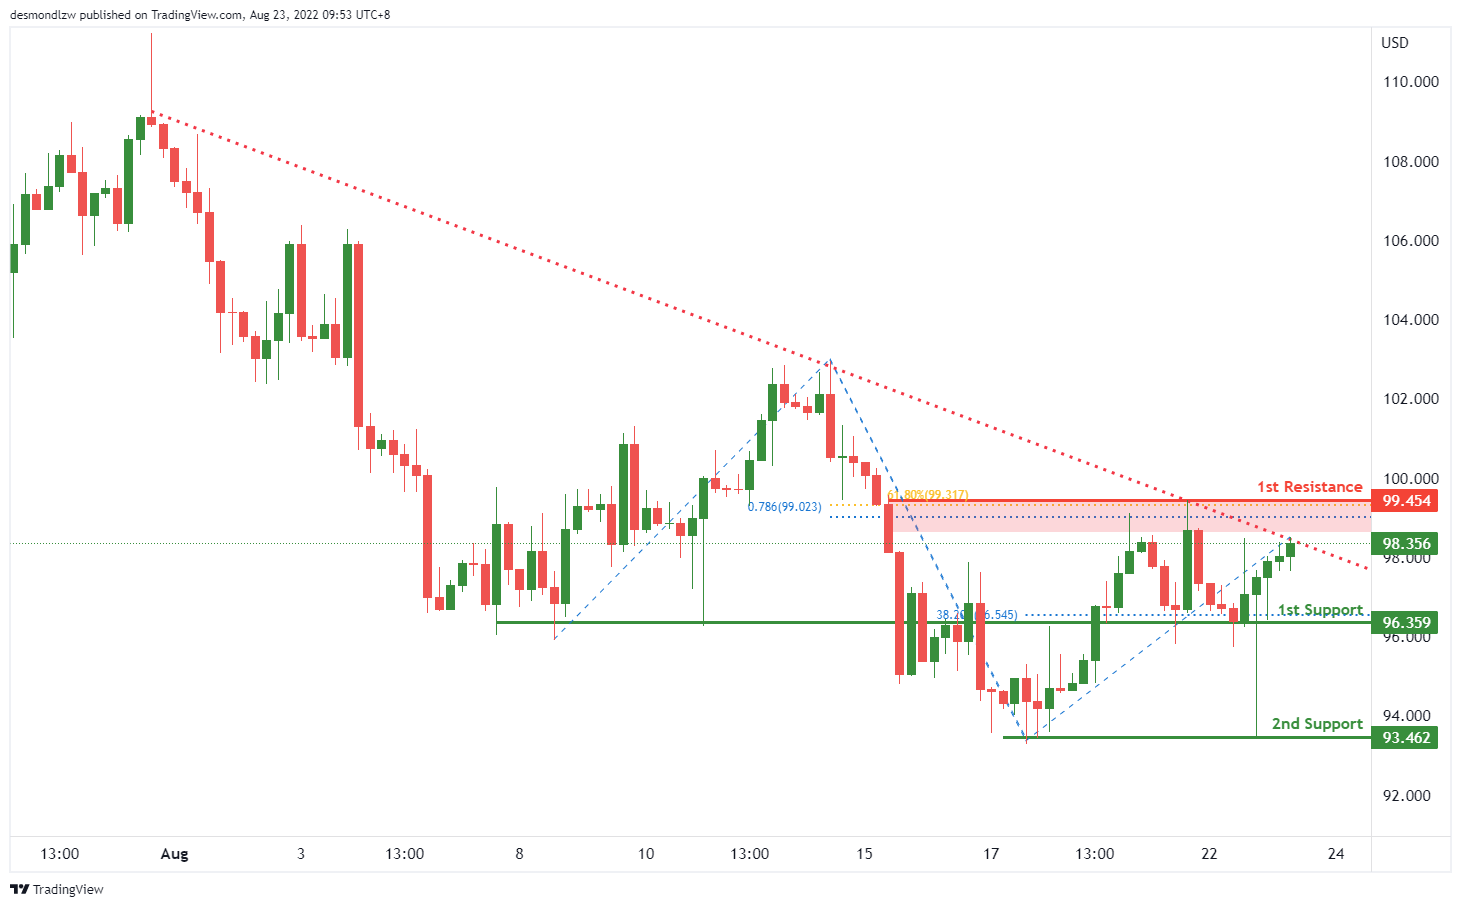
On the H4, with price moving within the descending trendline, we have a bearish bias that the price may drop to our 1st support at 96.359, which is in line with the overlap support and 38.2% fibonacci retracement, if the price break the 1st support, the price may drop to the 2nd support at 93.462, which is in line with the swing low. Otherwise, the price may rise to the 1st resistance at 99.454, where the 78.6% fibonacci projection, 61.8% fibonacci retracement and swing high are.
Areas of consideration:
- H4 time frame, 1st support at 96.359
- H4 time frame, 2nd support at 93.462
Dow Jones Industrial Average:
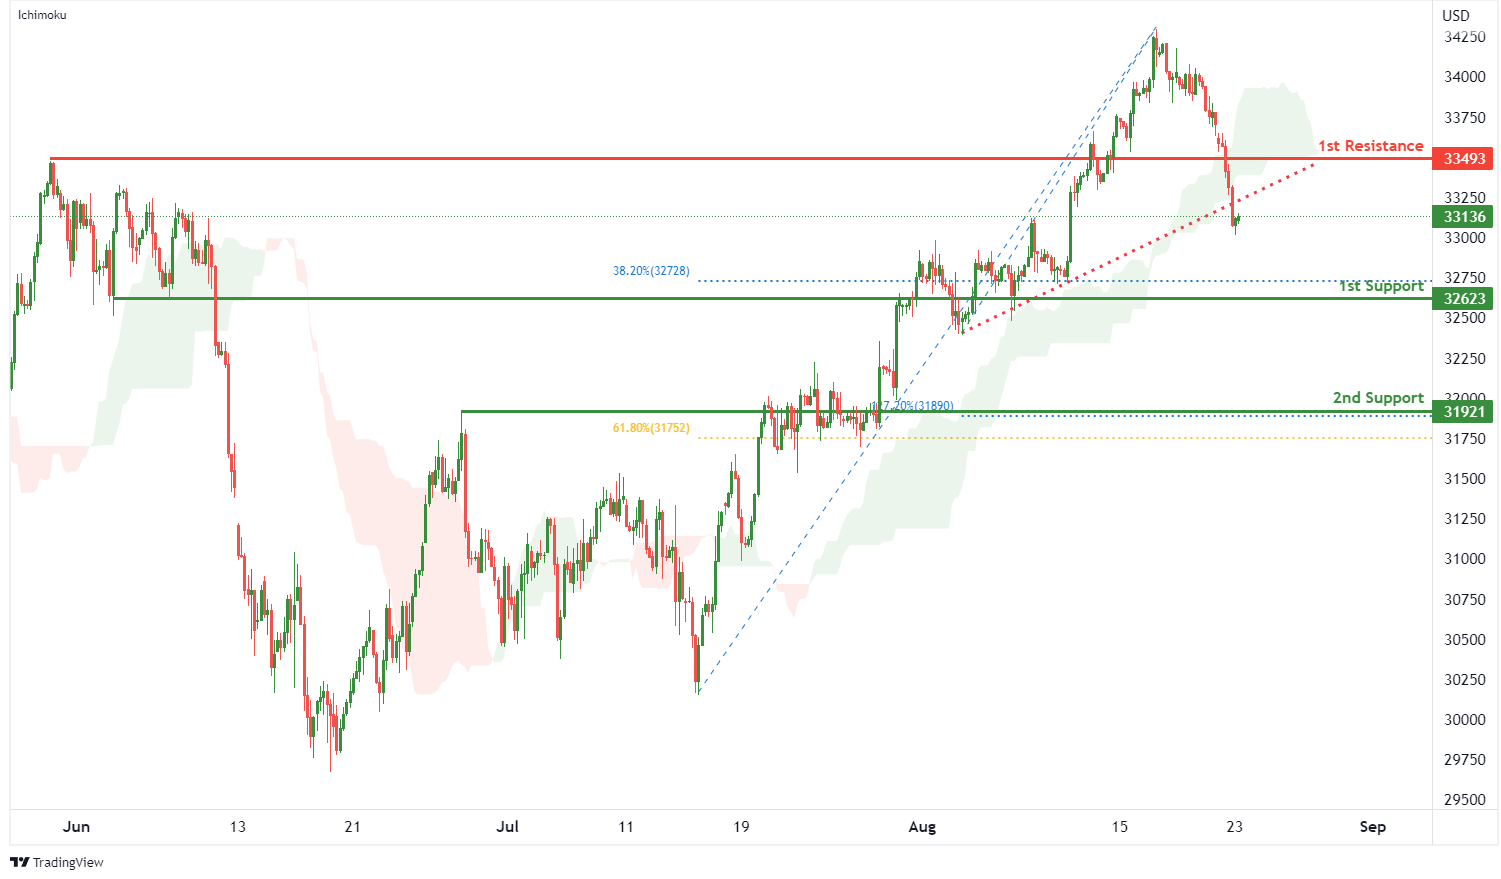
On the H4, with price breaking out of the ascending trendline and moving below the ichimoku indicator, we have a bearish bias that price will drop to 1st support at 32623 where the pullback support and 38.2% fibonacci retracement are. Once there is downside confirmation of price breaking 1st support, we would expect bearish momentum to carry price to 2nd support at 31921 where the pullback support, 61.8% fibonacci retracement and 127.2% fibonacci extension are. Alternatively, price could rise to 1st resistance at 33494 where the pullback resistance is.
Areas of consideration:
- H4 time frame, 1st resistance of 33494
- H4 time frame, 1st support at 32623
DAX:
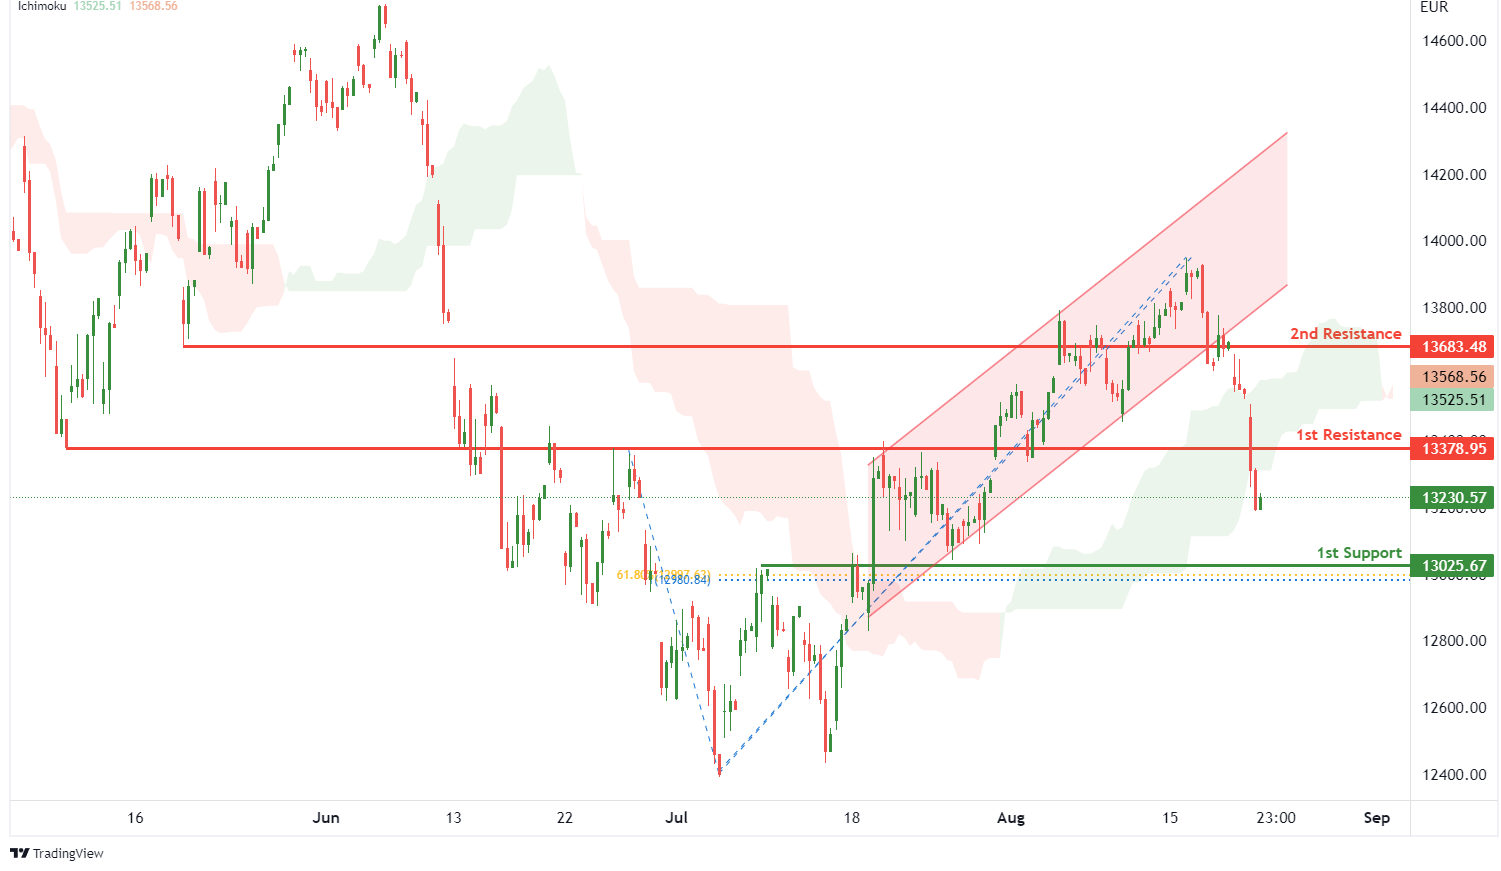
On the H4, with price breaking out of an ascending channel and moving below the ichimoku indicator, we have a bearish bias that price will drop from 1st resistance at 13378.95 where the overlap resistance is to the 1st support at 13025.67 where the pullback support, 61.8% fibonacci retracement and 100% fibonacci projection are. Alternatively, price could break 1st resistance and rise to 2nd resistance at 13683.48 where the pullback resistance is.
Areas of consideration:
- H4 time frame, 1st resistance of 13378.95
- H4 time frame, 1st support at 13025.67
ETHUSD:
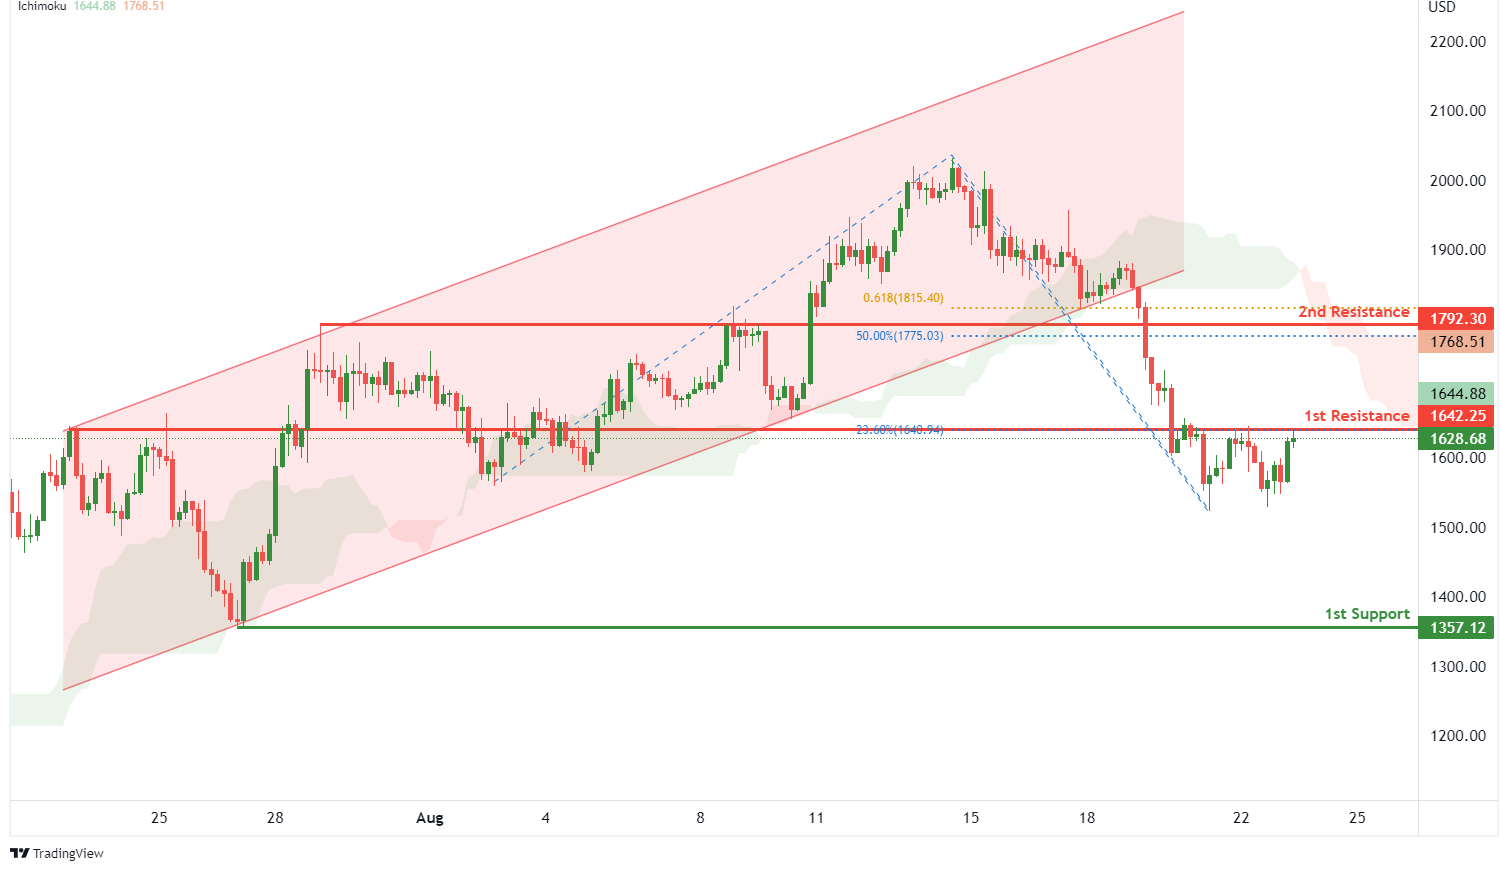
On the H4, with price breaking out of an ascending channel and moving below the ichimoku indicator, we have a bearish bias that price will drop from the 1st resistance at 1642.25 where the pullback support and 23.6% fibonacci retracement are to the 1st support at 1357.12 where the swing low support is. Alternatively, price could break 1st resistance and rise to 2nd resistance at 1792.30 where the overlap resistance, 50% fibonacci retracement and 61.8% fibonacci projection are.
Areas of consideration:
- H4 time frame, 1st resistance of 1642.25
- H4 time frame, 1st support at 1357.12
BTCUSD:
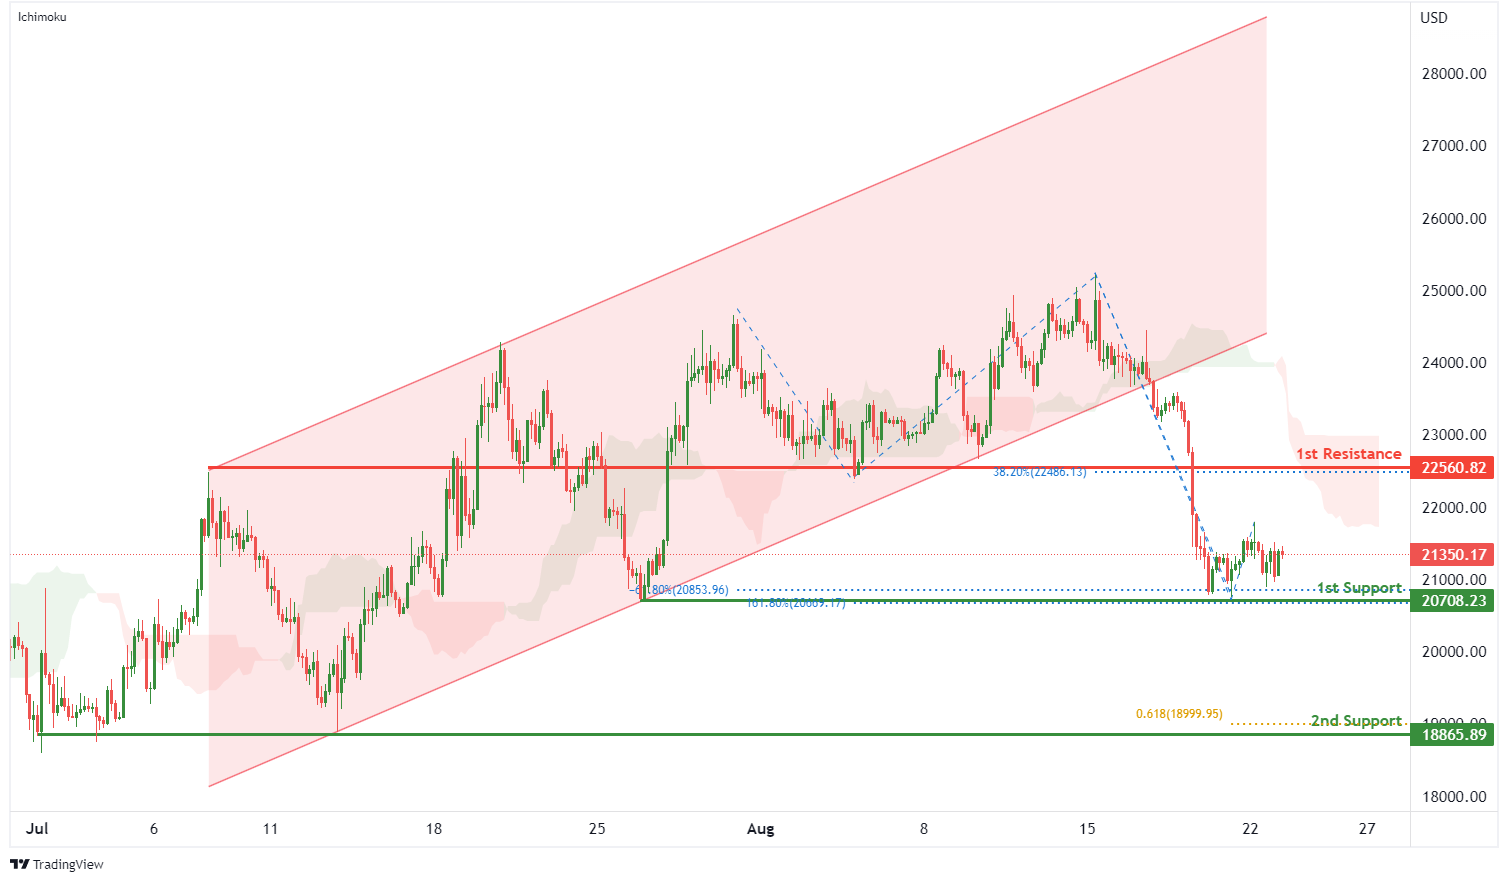
On the H4, with price breaking out of a bullish channel and moving below the ichimoku indicator, we have a bearish bias that price will drop to 1st support at 20708.23 where the -61.8% fibonacci expansion, 161.8% fibonacci extension and swing low support are. Once we have downside confirmation of price breaking 1st support structure,we would expect bearish momentum to carry price to 2nd support at 18865.89 where the swing low support and 61.8% fibonacci projection are. Alternatively, price could rise to 1st resistance at 22560.82 where the pullback resistance and 38.2% fibonacci retracement are.
Areas of consideration:
- H4 time frame, 1st resistance of 22560.82
- H4 time frame, 1st support at 20708.23
S&P 500:
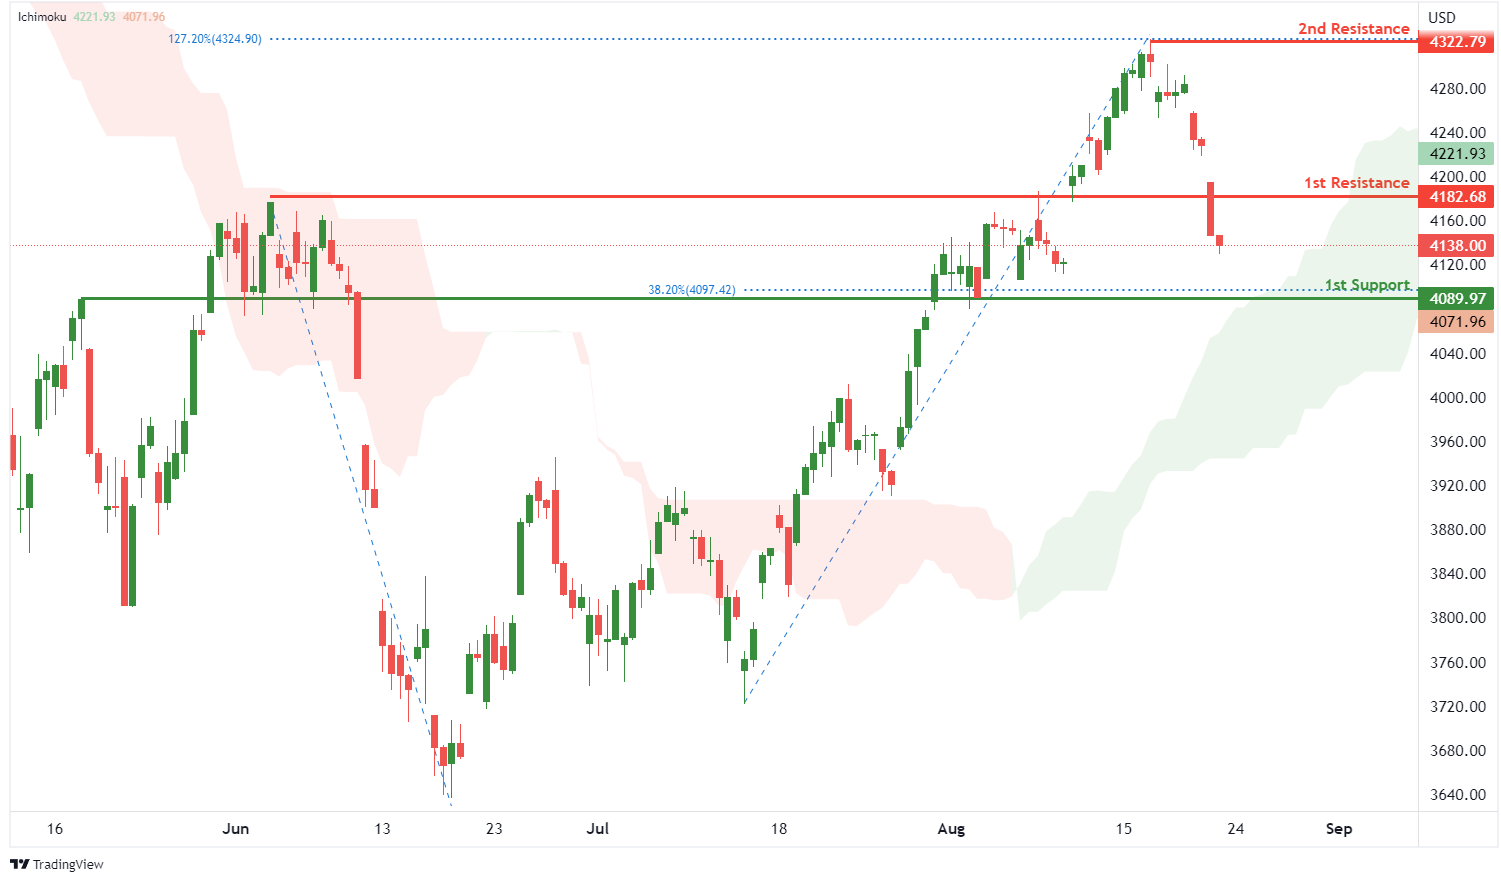
On the H4, with prices moving above the ichimoku indicator, we have a bullish bias that the price will rise to 1st resistance at 4182.68 where the pullback support is. Once there is upside confirmation of price breaking 1st resistance structure, we would expect bullish momentum to carry price to 2nd resistance at 4322.79 where the swing high resistance and 127.2% fibonacci extension are. Alternatively, price could drop to 1st support at 4089.97 where the pullback support and 38.2% fibonacci retracement are.
Areas of consideration:
- H4 time frame, 1st resistance of 4182.68
- H4 time frame, 1st support at 4089.97
GBP/USD Accelerates Lower, Euro Dives Below Parity
Key Highlights
- GBP/USD declined heavily below 1.2000 and 1.1850.
- Many hurdles are forming near 1.1900 and 1.2000 on the 4-hours chart.
- EUR/USD declined heavily below the parity level.
- The US Manufacturing PMI could decline from 52.2 to 51.5 in August 2022 (Preliminary).
GBP/USD Technical Analysis
The British Pound failed to clear the 1.2250 resistance zone against the US Dollar. GBP/USD started a major decline and traded below the key 1.2000 support zone.
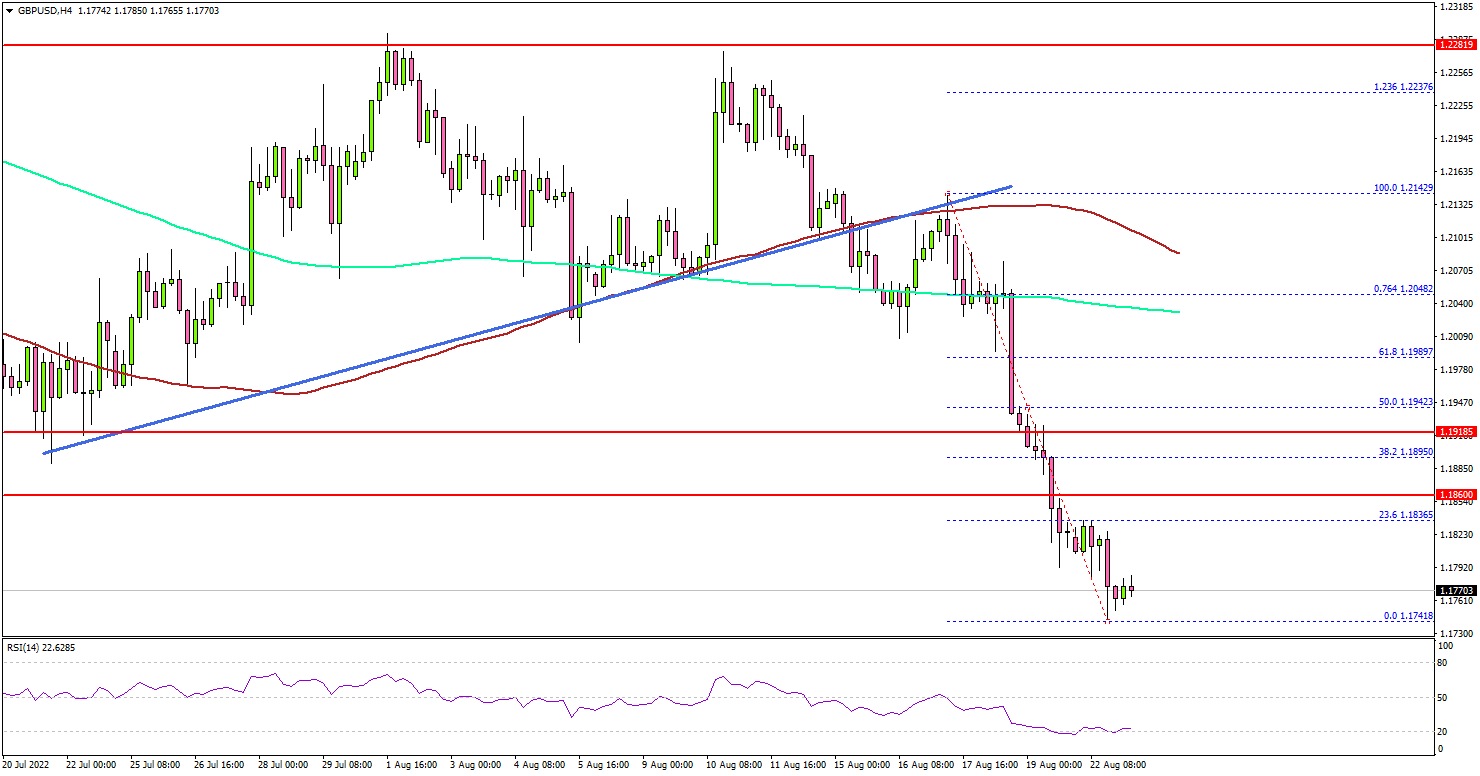
Looking at the 4-hours chart, the pair settled below the key 1.2000 support, the 100 simple moving average (red, 4-hours), and the 200 simple moving average (green, 4-hours). There was also a break below a major bullish trend line with support near 1.2100.
The decline gained pace below the 1.1850 support level. If the bears remain in action, the pair could dive further below 1.1750.
The next major support is near the 1.1700 zone, below which the bears may even aim a move towards the 1.1500 level in the coming days.
On the upside, the pair is facing resistance near the 1.1850 level. The next major resistance is near the 1.1910 level. A clear move above the 1.1910 resistance might send the pair higher towards the 1.2000 level.
Looking at EUR/USD, the pair declined heavily below the 1.0000 support zone and there is a risk of more losses in the near term.
Economic Releases
- Germany’s Manufacturing PMI for August 2022 (Preliminary) - Forecast 48.3, versus 49.3 previous.
- Germany’s Services PMI for August 2022 (Preliminary) - Forecast 49.0, versus 49.7 previous.
- Euro Zone Manufacturing PMI for August 2022 (Preliminary) – Forecast 49.0, versus 49.8 previous.
- Euro Zone Services PMI for August 2022 (Preliminary) – Forecast 50.5, versus 51.2 previous.
- UK Manufacturing PMI for August 2022 (Preliminary) – Forecast 51.3, versus 52.1 previous.
- UK Services PMI for August 2022 (Preliminary) – Forecast 52.0, versus 52.6 previous.
- US Manufacturing PMI for August 2022 (Preliminary) – Forecast 51.5, versus 52.2 previous.
- US Services PMI for August 2022 (Preliminary) – Forecast 49.1, versus 47.3 previous.
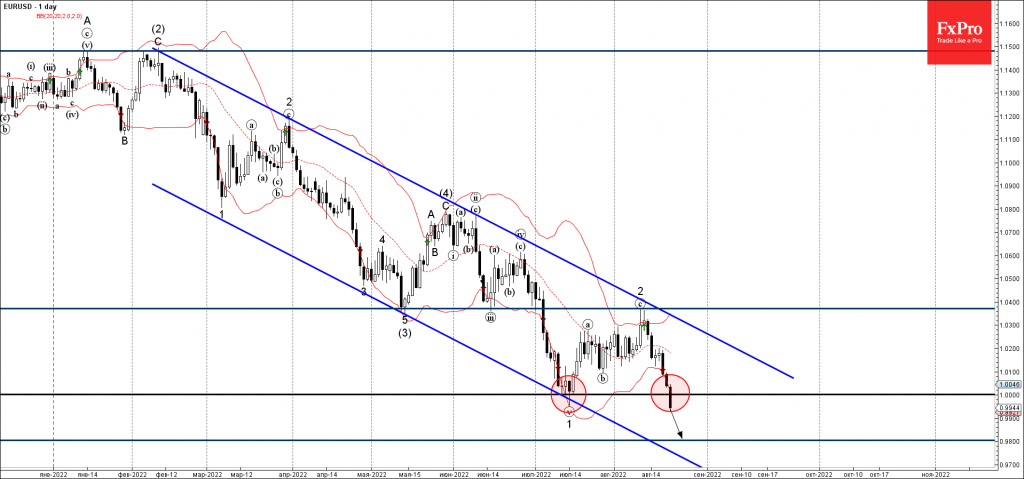
EURUSD Wave Analysis
- EURUSD broke below the parity 1.0000
- Likely to fall to support level 0.9800
EURUSD today broke strongly below the parity 1.0000 (which stopped the previous sharp downward impulse wave 1 from the start of June).
The breakout of the parity 1.0000 should accelerate the active short-term downward impulse wave 3.
Given the overriding daily downtrend, EURUSD can be expected to fall further toward the next support level 0.9800 (low of the earlier wave (ii) from the start of August).