

Sample Category Title
Gold Retreats Back Near Falling Trend Line; Maintains Bearish Bias
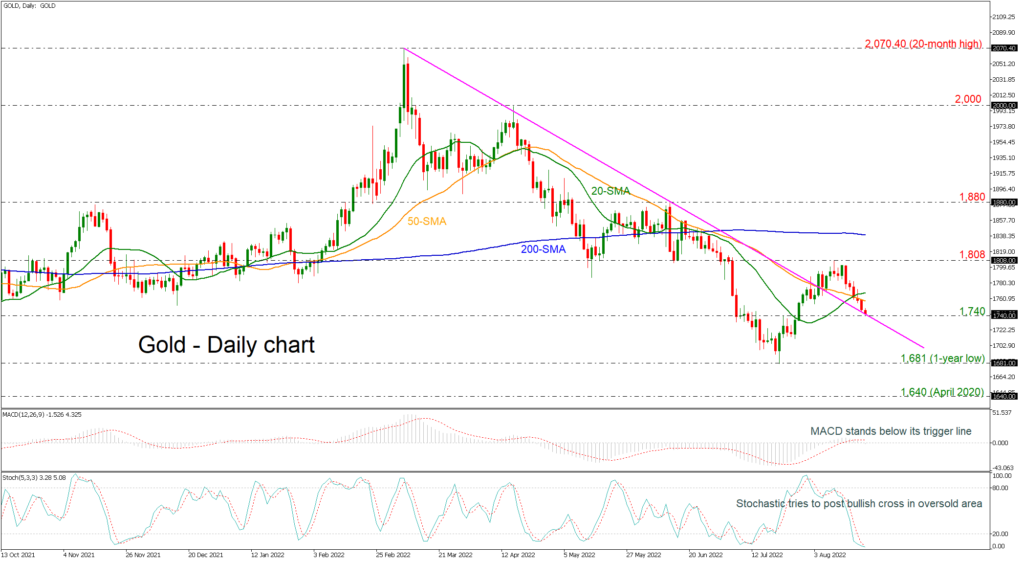
Gold prices remain under pressure and risk is still to the downside as prices continue to drift lower from the 1,808 level. The commodity is re-testing the downtrend line that broke at the beginning of the month, signifying a continuation of the descending movement.
The short-term technical indicators are in bearish territory, with the MACD standing below its trigger line; however, the stochastic oscillator is suggesting an oversold market as it is ready to post a bullish cross within its %K and %D lines. Prices are looking capped by the 20 and 40-day simple moving averages (SMAs) which are negatively aligned after a bullish crossover that took place on August 17.
The next target to the downside is the one-year low of 1,681 if there is a move below the downtrend line. At this stage the market would likely see a resumption of the descending view from the 2,070.40 peak and put in place a lower low at 1,640, registered in April 2020.
Upside moves are likely to find resistance at 1,808 but first needs to surpass the SMAs. There is an important resistance zone between the 200-day SMA at 1,840 ahead of the 1,880 resistance.
In the short-term, the bearish phase remains in play especially if gold prices continue to trade below the SMAs.
US 500 Retreats after Hitting 200-Day SMA
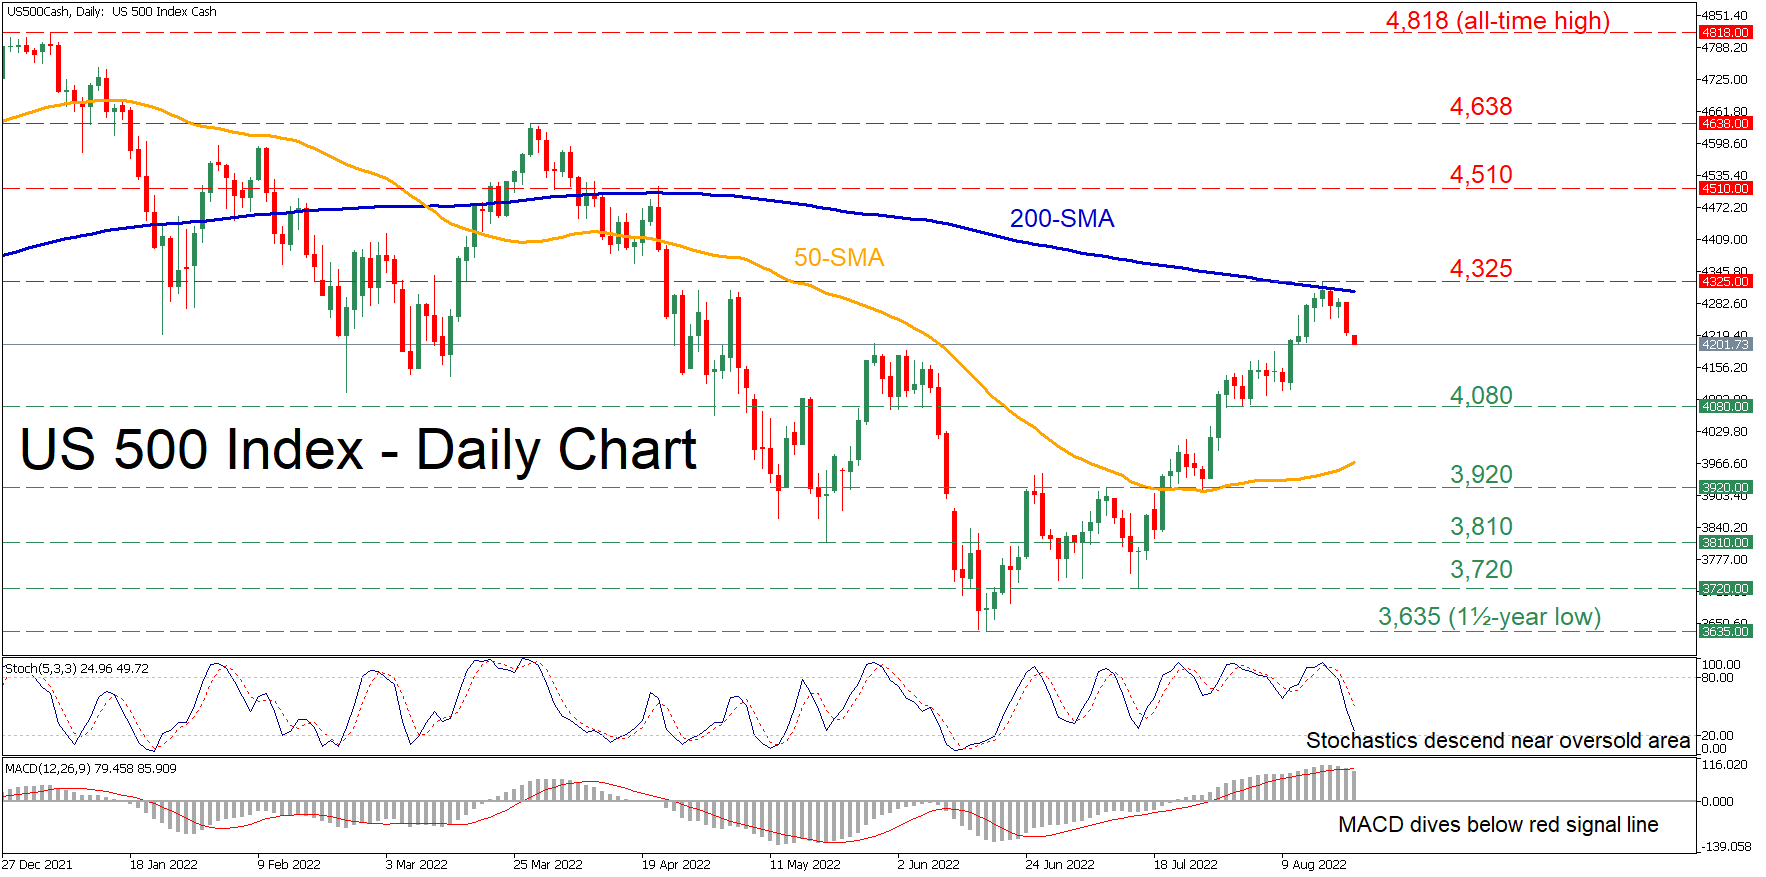
The US 500 stock index (cash) has been in a sustained uptrend after finding its feet at the 1½ -year low of 3,635. However, the price has exhibited a downside correction since it failed to cross above the 200-day simple moving average (SMA) and is currently hovering around the May peak levels.
The momentum indicators are endorsing the recent retracement. Specifically, the stochastic oscillator is descending close to the oversold zone, while the MACD histogram has crossed beneath its red signal line.
To the downside, should the weakness persist, immediate support could be encountered at the recent low of 4,080. Sliding beneath that floor, the index could descend towards 3,920 or lower to test the May low of 3,810. Any further declines may then cease at the July support of 3,720.
On the flipside, if negative momentum wanes and the price drifts higher, the recent reversal point of 4,325 might act as the first line of defence. Piercing through this region, the bulls could aim for 4,510 before the March peak of 4,638 appears on the radar. A violation of the latter could open the door for the all-time high of 4,818.
Overall, even though the US 500 index’s rebound appears to be running out of steam, it is still too early to call for a reversal of the short-term uptrend. Hence, a profound close above the 200-day SMA could signal the resumption of the recovery.
EURUSD Looks Unfortunate as Sell-off Nears Parity Again
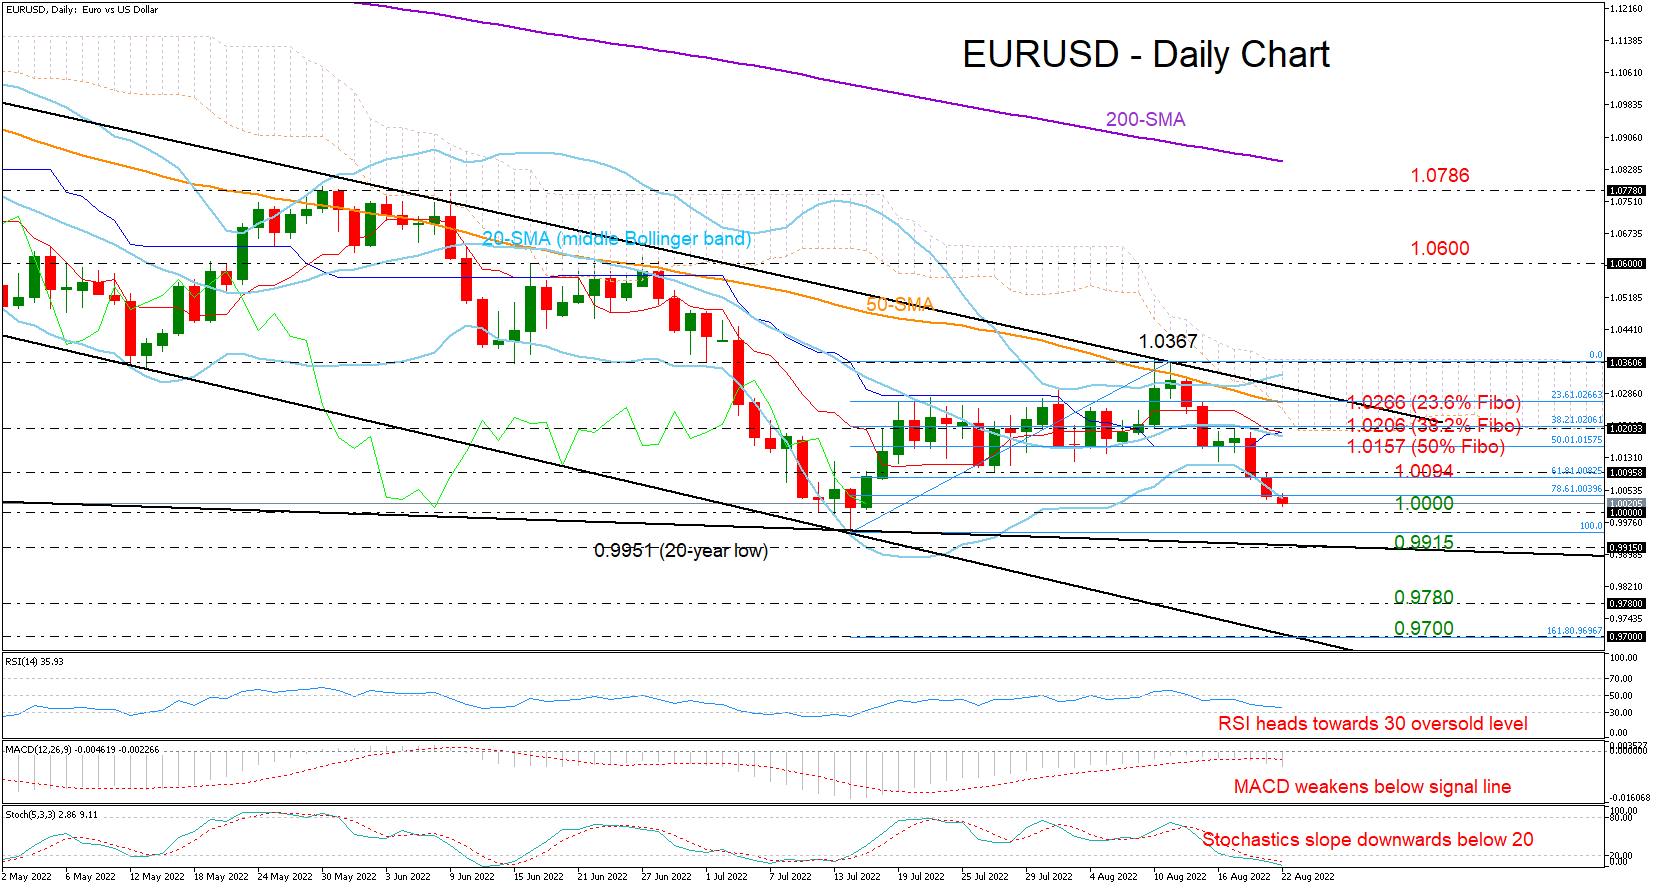
EURUSD was sliding towards the critical 1.0000 level during Monday’s early European trading hours, which the bears could not successfully claim in mid-July. The move comes after the failure to climb above the 20-day simple moving average (SMA) and the 1.0200 number last week.
Previously, the pair could not find enough buyers to exit the 2022 downward-sloping channel either, with the momentum indicators currently foreseeing more bearish episodes ahead. Although the price closed marginally below the lower Bollinger band on Friday, signaling oversold conditions, the stochastics have yet to post a bearish cross below 20, while the RSI has some distance to run till the 30 mark. The MACD also seems to be starting a new bearish wave below its red signal line.
If sellers manage to dominate below parity, violating the support line at 0.9915 too, which connects all the lows from August 2018, the downtrend could gain significant momentum towards the 0.9780 – 0.9700 constraining zone last active during the 2000-2002 period. The channel’s bottom line is also in the neighborhood, adding extra importance to the region. Should the negative outlook further worsen from here, the spotlight will immediately shift to the September 2002 trough of 0.9600.
Otherwise, another bounce on 1.0000 may initially push for a close above Friday’s resistance at 1.0094 with scope to reach the 1.0157 – 1.0206 border, formed by the 50% and 38.2% Fibonacci levels of the latest upleg. The area also encapsulates the 20-day SMA and the lower limit of the Ichimoku cloud. Hence, any violation of this territory could send the pair directly up to the 50-day SMA currently lying around the 23.6% Fibonacci of 1.0266 and the channel’s upper limit at 1.0294.
In brief, the ongoing bearish wave in EURUSD is expected to persist in the short term, with traders likely waiting for a clear break below the 1.0000 – 0.9915 area to further reduce exposure in the market.
Daily Technical Analysis
EUR/USD
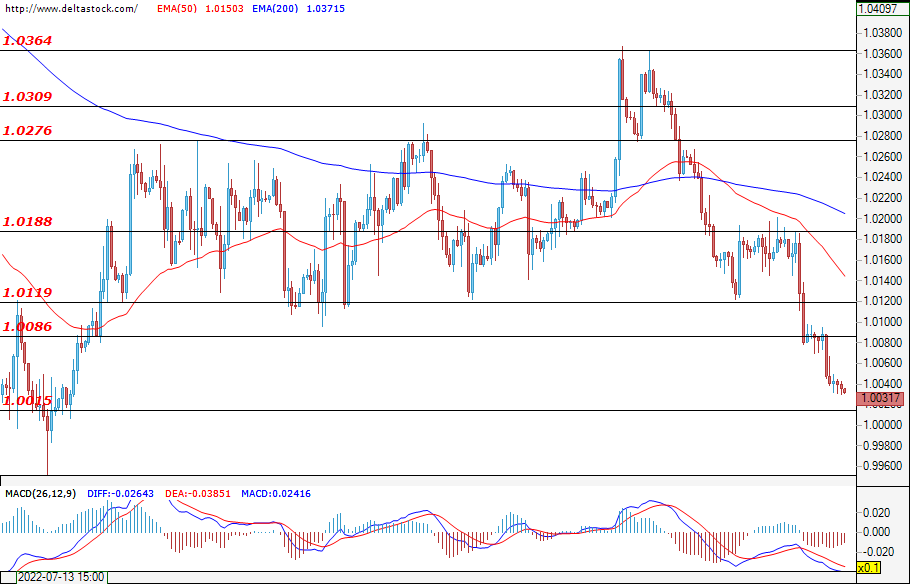
After the successful breach of the zone at 1.0086, the European common currency continued to depreciate against the dollar, and during the early hours of today`s trading, the pair is looking to test the important support at 1.0015. A successful violation of the mentioned level could easily lead to new losses and would strengthen the negative expectations for the future path of the pair. If the bulls enter the market, then their first target for them could be found at the level at 1.0086, which is currently acting as resistance. A breach of the next zone at 1.0119 could start a larger correction towards the major resistance at 1.0188. Among the most anticipated news will be the release of the data for the U.S. GDP and the initial jobless claims (Thursday; 12:30 GMT), as well as the Jackson Hole symposium (25-27 August).
GBP/USD
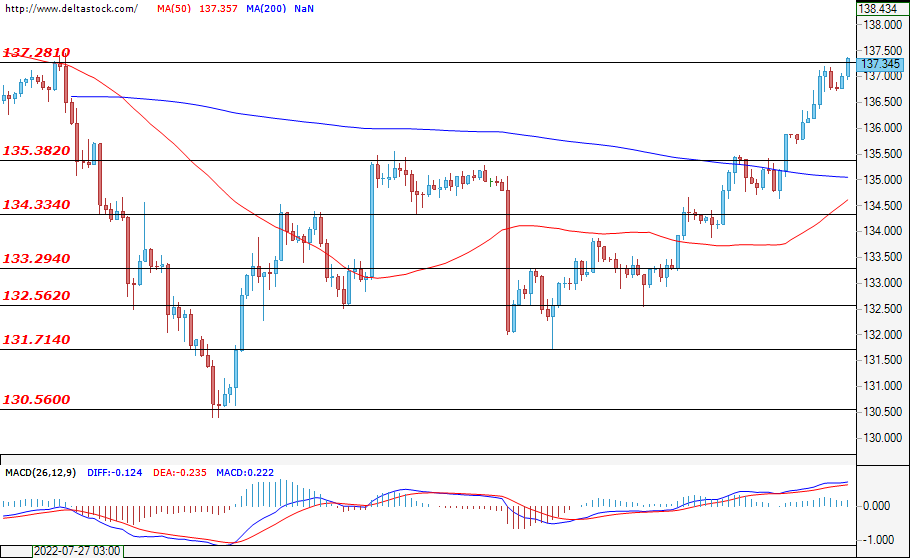
The U.S. dollar recovered most of its losses against the yen from the end of last month, and at the time of writing, the pair is testing the local high at 137.28. If the bullish attack continues, then a confirmation of the breach for the buyers could lead to a rally and could easily lead to a rally towards the levels at around 138.00. If the bears prevail, then the expectations are for a correction and test of the support at 135.38. A successful violation of the zone at 134.33, followed by a breach of the lower level at 133.29, could lead to a change in the current sentiment of the market participants.
USD/JPY
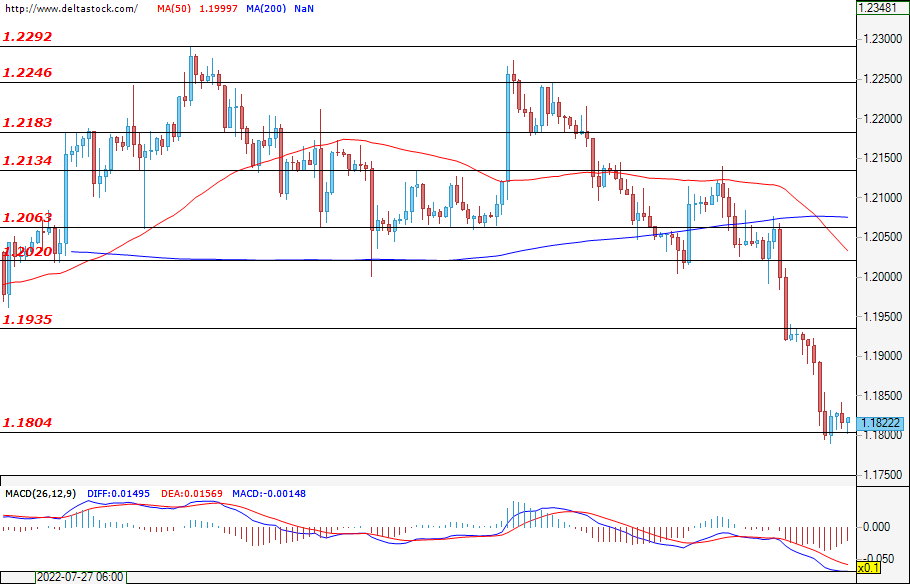
The appreciation of the dollar against most of the world's major currencies led to new losses for the Cable, and after the test of the support at 1.1804, the pair consolidated above the mentioned zone. If the bears gain enough momentum, then a successful violation here could easily continue the depreciation and could lead to a move towards the lows from July at around 1.1760. If the bulls prevail, then the first resistance for them would be the level at 1.1935, followed by the upper target at 1.2020.
EUGERMANY40
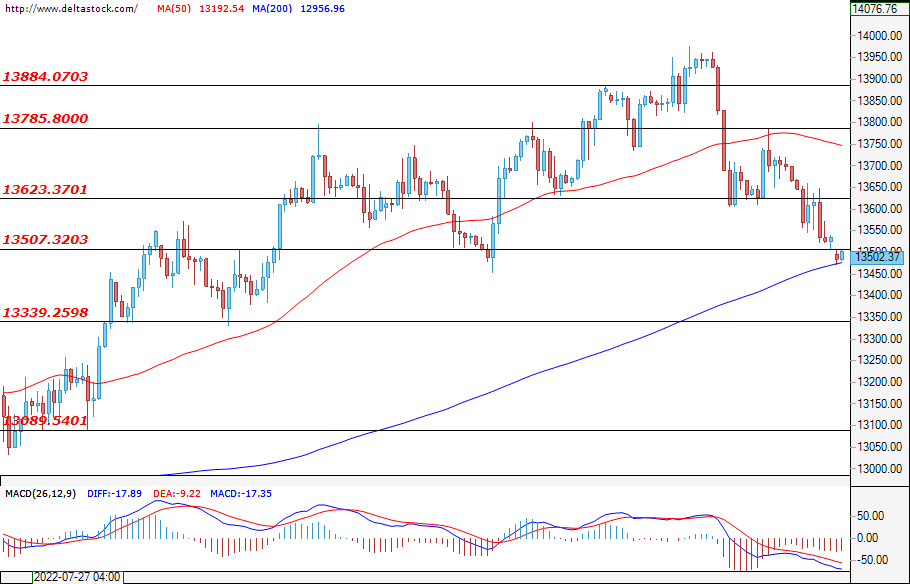
The test of the support at 13507 was not successful, and after the negative start of the trading week for the German index, the price held above the mentioned zone. If the bulls prevail, then an attempt for a breach of the resistance zone at 13623 is a highly probable scenario. However, only a violation of the zone at 13785, followed by a breach of the upper one at 13884, could form the current move as corrective and could spark a new rally towards 14000. If the bears enter the market, then a successful test of the support at 13339 could easily deepen the depreciation and lead to a decline towards 13089.
US30
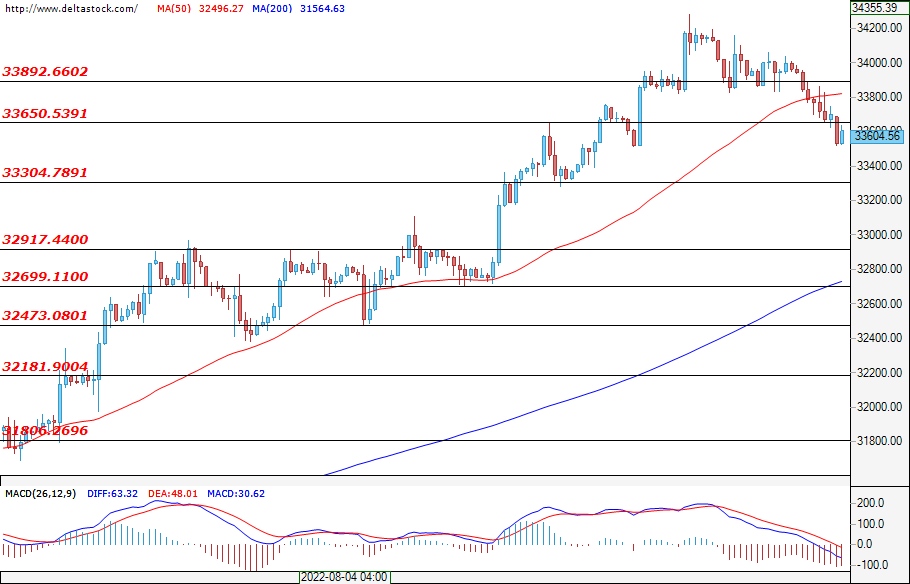
The U.S. blue-chip index continued to decline, and after the breach of the support zone at 33650, the price consolidated at around the current level at 33604. If the bearish attack continues, then a successful test of the zone at 33304 could easily deepen the sell-off towards the important support at 32917. Better-than-expected GDP data for the U.S. and a positive initial jobless claims report (Thursday; 12:30 GMT) could help the bulls prevail. Their first target is the zone at 33650, which is now acting as resistance. A violation of the upper level at 33892 could strengthen the positive expectations and could easily lead the price towards the highs from April at around 35315.
Preliminary Global Manufacturing PMIs for July
For traders looking to see where the markets might be headed for the rest of the month, tomorrow's data might be the sentiment catalyst. PMIs are the freshest data, and they are especially relevant now as investors grade the impact of central bank policy on the economy.
If we get a rash of good PMI data, it could propel risk sentiment higher, depress the dollar and support emerging markets. If flash PMIs were to disappoint, then the downturn in the markets seen at the end of last week could accelerate. Keep in mind this is preliminary data, and at the start of next month there could be revisions.
What to look out for:
Australia:
The consensus is for a mixed bag down under, but in general staying in expansion. Commodity prices have been on the back foot, but the major exporter to China appears to continue to outperform its global peers. Australian Manufacturing PMI is expected to slip a bit to 55.0 from 55.7, while services PMI is expected to advance by the minimum to 51.0 from 50.9 prior.
France:
As usual, being the first to report out of the shared economy, it could set the tone for Europe. With energy prices increasing faster in France than in Germany, worries about industrial performance through the winter have been rising. French Manufacturing PMI is expected to slip further into contraction down to 48.9 from 49.5 previously. Services PMI is expected to remain in positive but decline as well to 52.5 from 53.2.
Germany:
If the largest economy in the EuroZone has a different result than France's, it could shift market sentiment. However, growing concerns over energy supply is expected to keep optimism under pressure. Just this morning it was announced that Nord Stream 1 would be shut again for 3 days, after German officials confirmed nuclear power plants wouldn't be extended. German Manufacturing PMI is expected to fall lower than France's to 48.3 compared to 49.3 prior. Services is also expected to fall further into contraction at 49.0 from 49.7 prior.
EuroZone:
Likely won't impact markets unless other countries manage to substantially differ from the two largest economies. Manufacturing PMI is expected to be further in contraction to 49.0 from 49.9, while Services PMI is expected to stay in expansion by barely at 50.5 compared to 51.2.
UK:
Britain is expected to keep challenging the trend in Europe and stay substantially in expansion despite officials worried that a recession is imminent. While the UK is expected to face cost of living pressure from energy supply issues, there is yet no expected need to plan for industrial shutdowns as is the case on the Continent. Nevertheless, optimism is expected to wane a bit. Manufacturing PMI is forecast to come in at 51.3 compared to 52.1 prior and Services PMI is forecast to slip to 52.0 from 52.6 prior.
US:
The US is expected to buck the trend, with manufacturing staying in expansion while services improves but stays in contraction. American industries might be expected to pick up some of the potential impact from energy issues in Europe. But tighter Fed policy and potential NBER might officially declare a recession, it could weigh on consumer sentiment, even as retail sales continue to slide. Manufacturing PMI is forecast at 51.9 compared to 52.2 prior, a minor reduction in optimism. Services PMI is expected to advance substantially to 49.1 compared to 47.3 prior.
XAG/USD Grinds Critical Floor
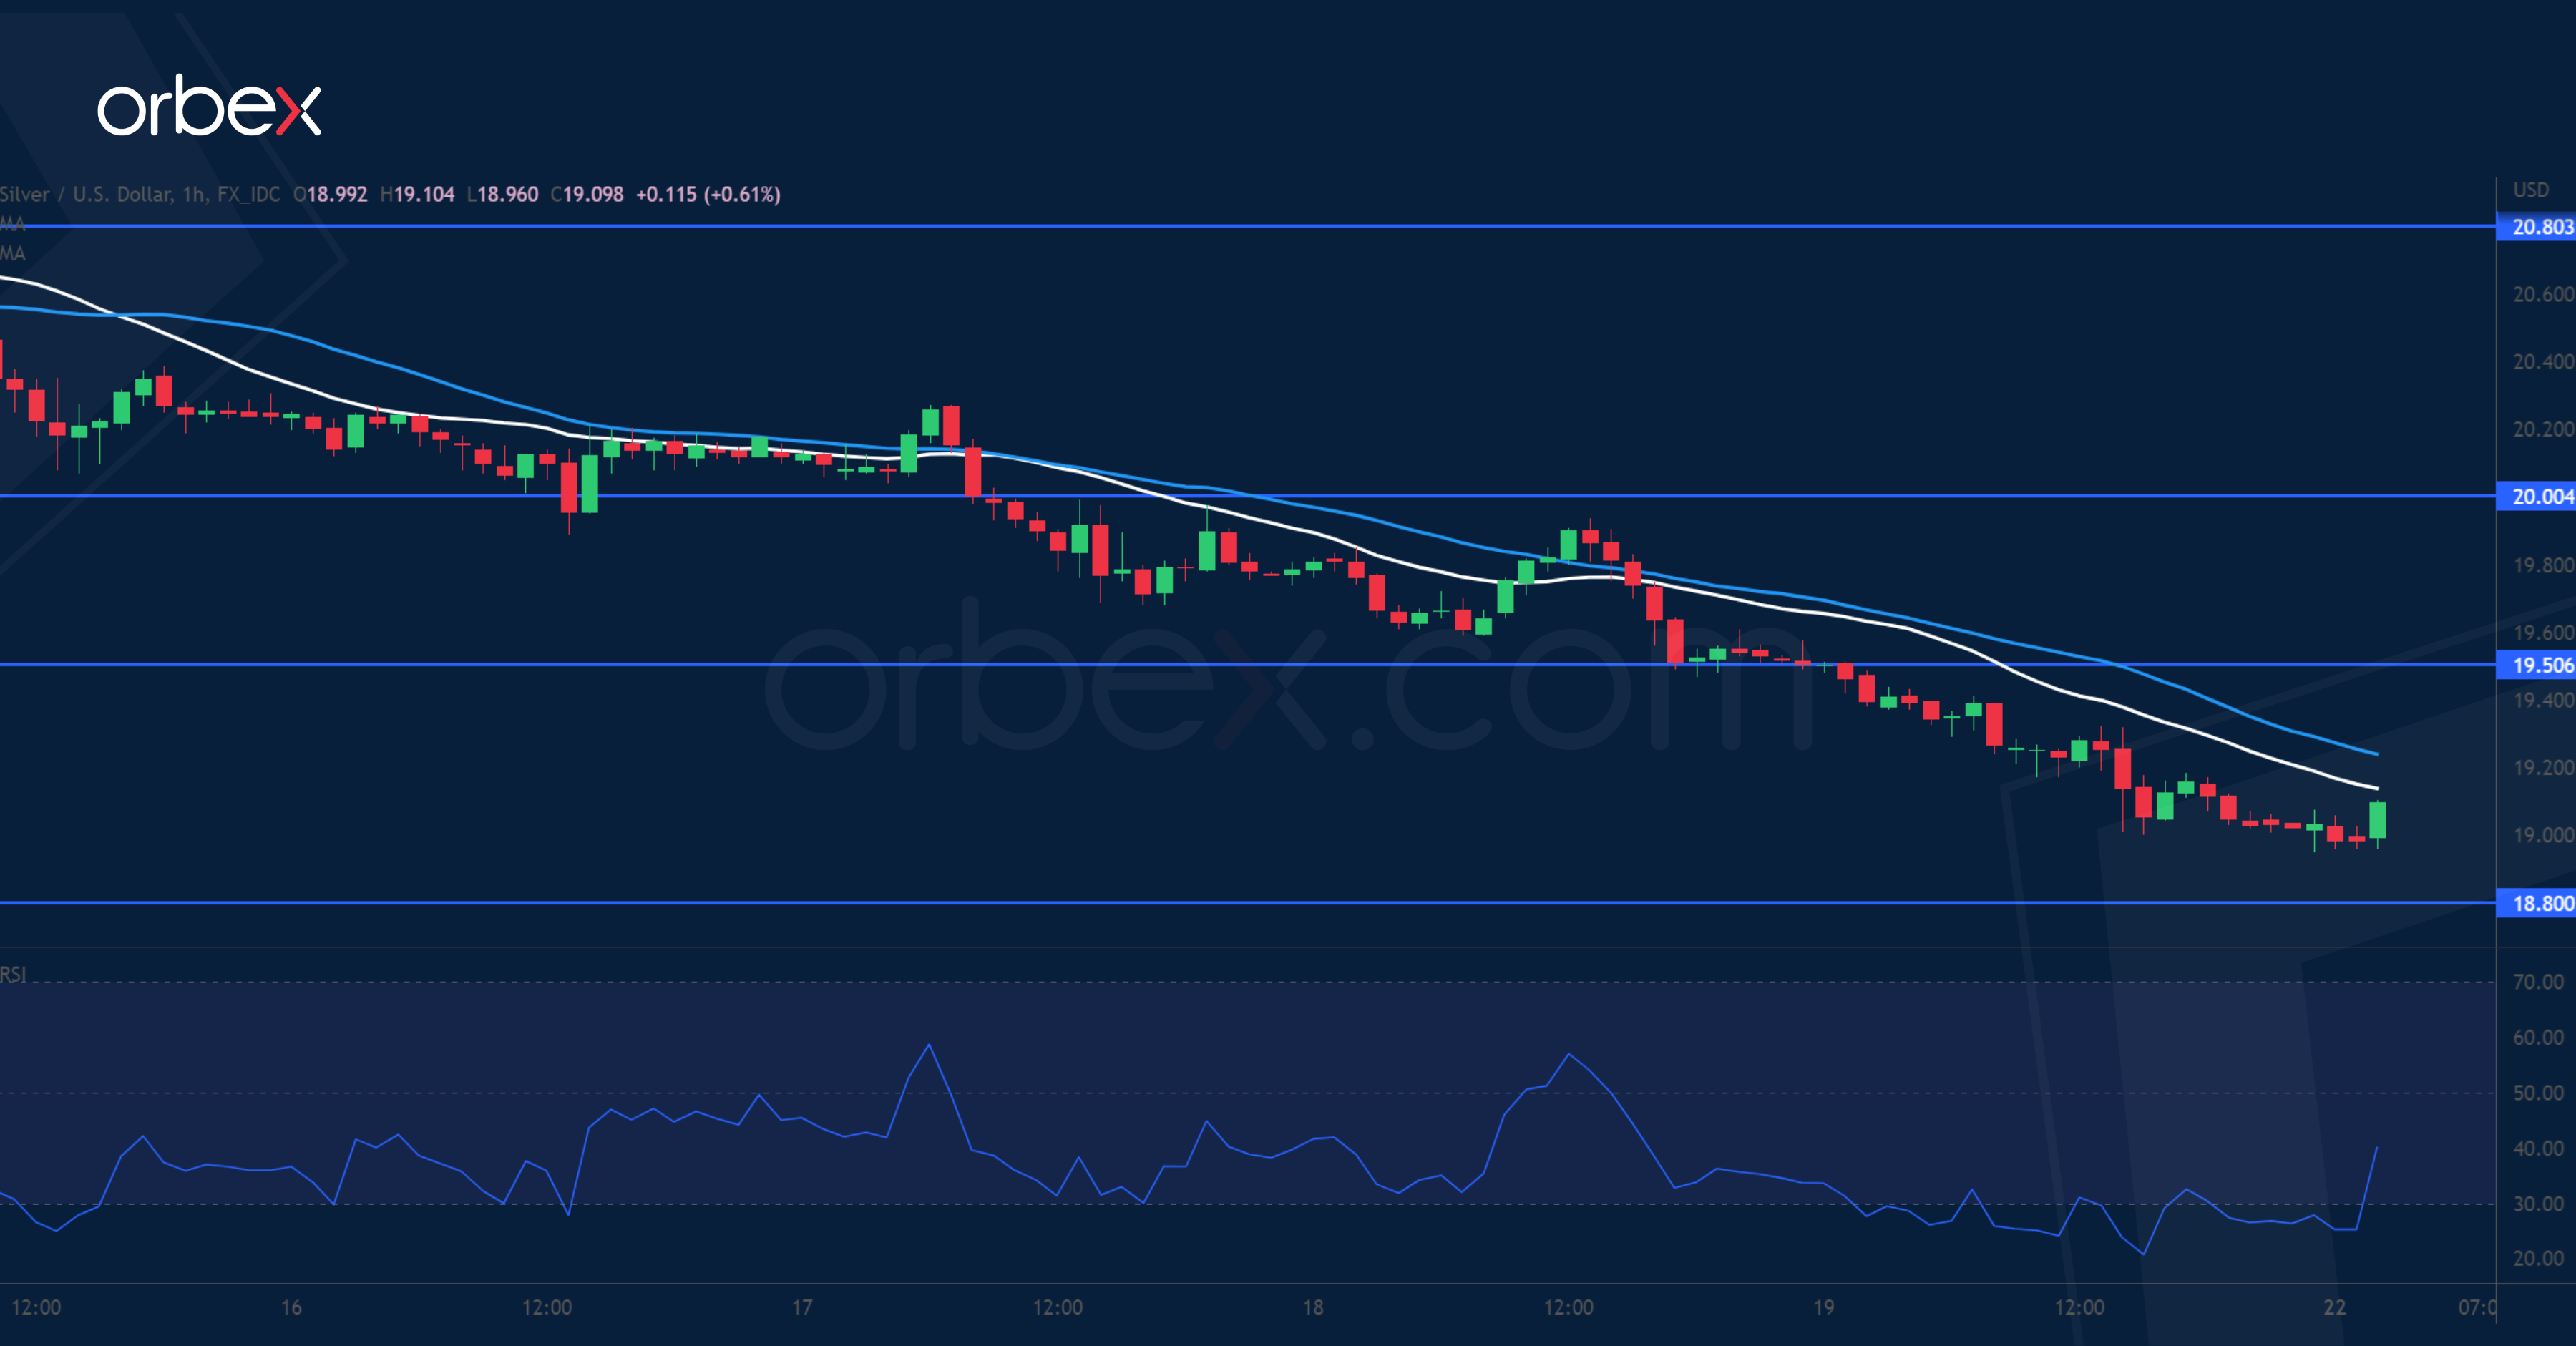
Silver plunges as the US dollar recovers across the board. On the daily chart, the price action reversed its course at the support-turned-resistance (20.80). A drop below previous lows at 19.60 suggested a lack of follow-up interest in the metal and triggered a wave of profit-taking. 18.80 at the base of last month’s bullish breakout is an important level to see whether there are still buyers left. Otherwise, the bears might push below 18.20. As the RSI dips into oversold territory, 19.50 is a fresh resistance in case of a bounce.
GBP/JPY Seeks Support
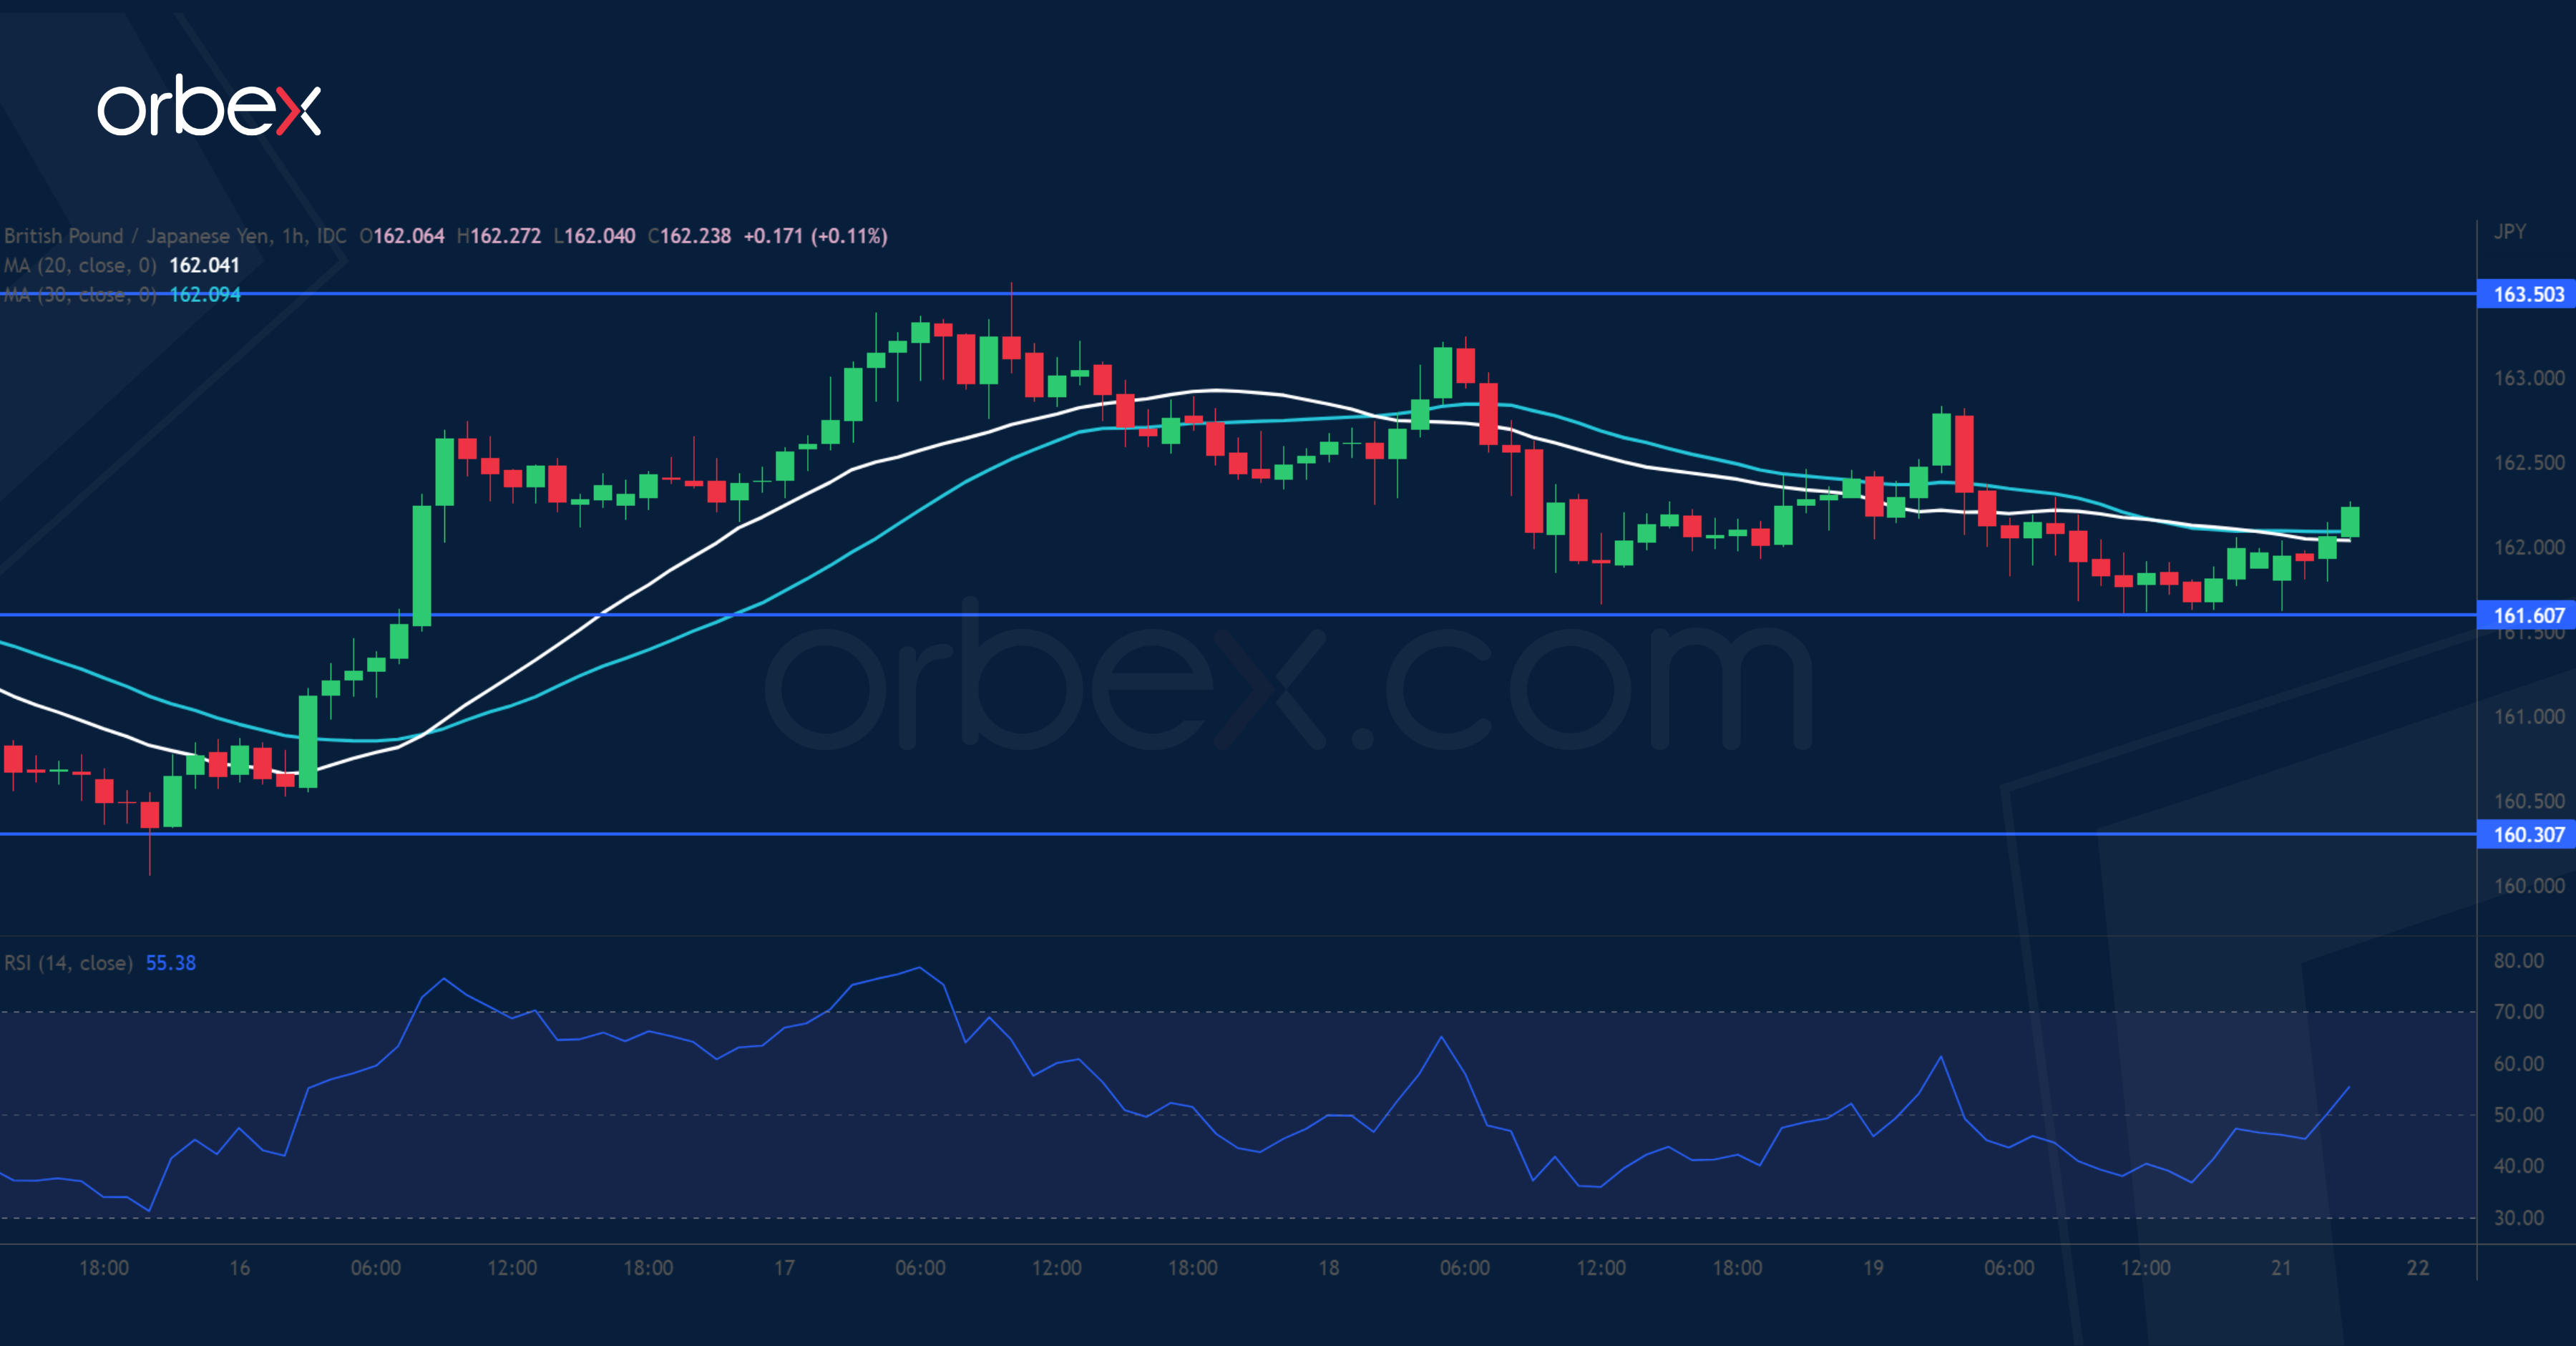
The pound retreats as recession fears take a foothold in the UK. The latest rebound has met stiff selling pressure at the daily resistance (163.50) which also sits on the 30-day moving average. This failure to achieve a new high suggests that the path of least resistance would be down. 161.60 is a support after intraday buyers gave up their gains at 162.30. Further down, 160.30 is a key level to keep the rebound intact. Its breach could make Sterling vulnerable to a new round of sell-off below 159.50.
USD/CAD Breaks Resistance
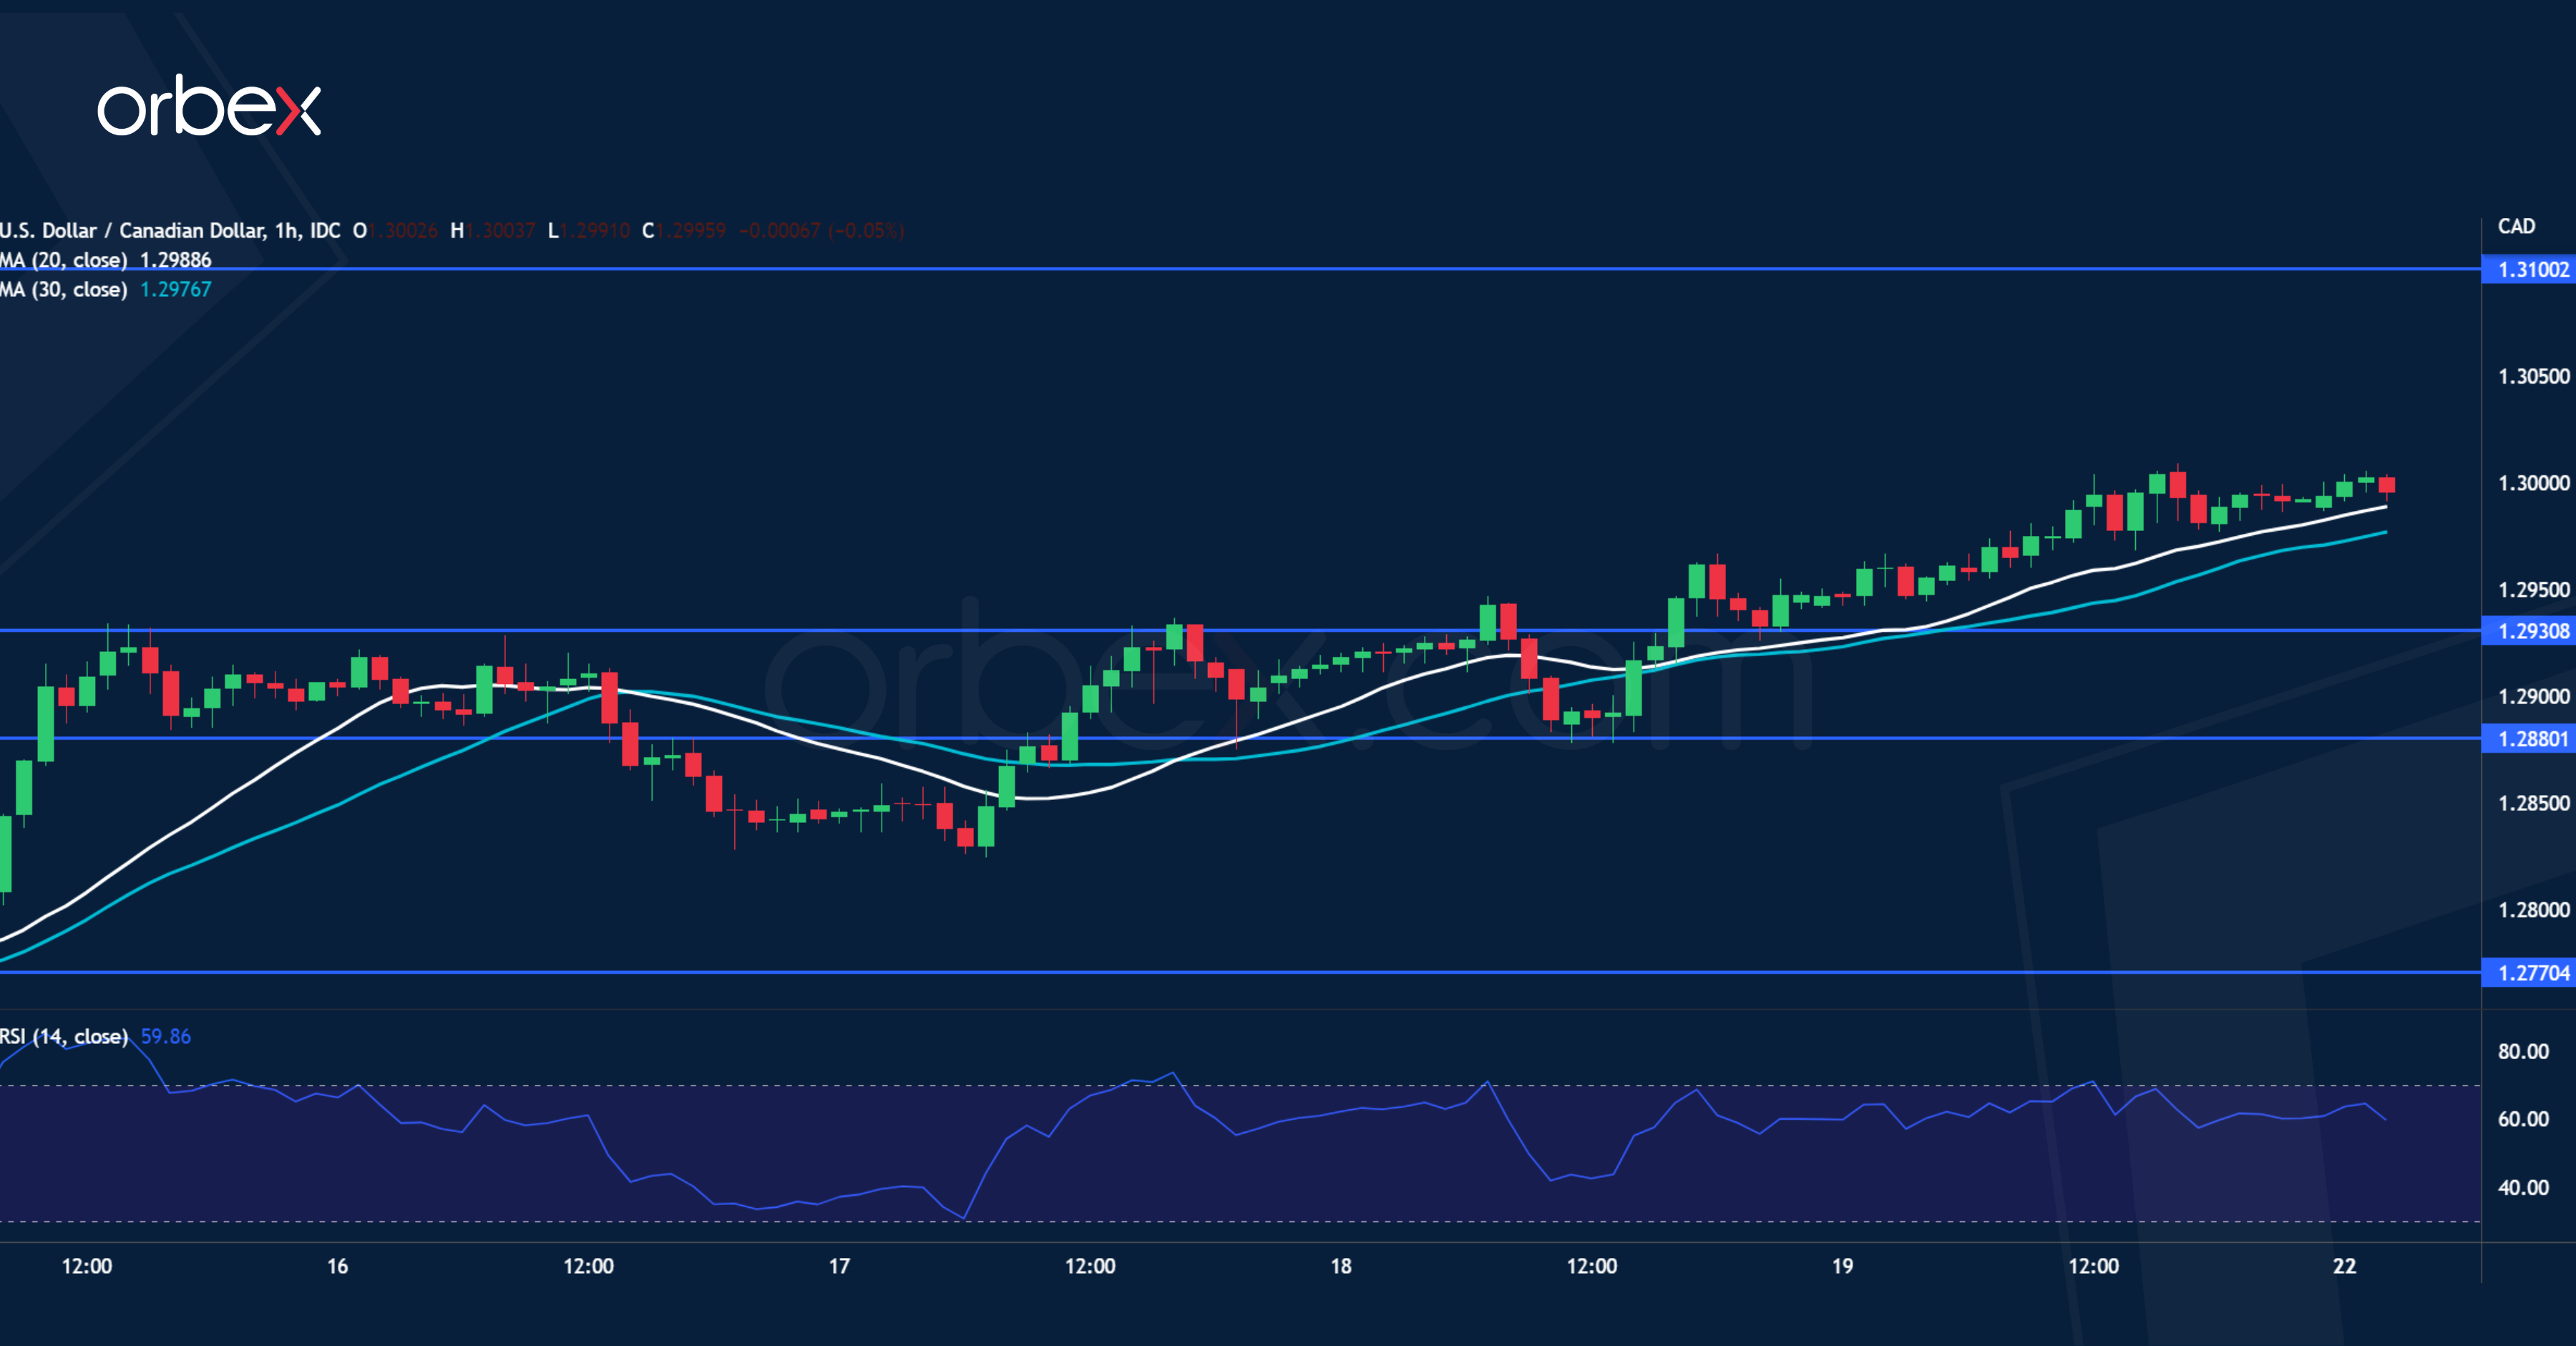
The Canadian dollar softened as June’s retail sales decelerated. The pair previously came under pressure at 1.2980. A close above this supply zone equally a daily resistance would flush the remaining selling interest out and open the door for a sustained rebound. The greenback has secured support over 1.2880, which is a sign of commitment from the buy side. 1.3100 under July’s peak is the next target should the rally gain traction. Its breach could resume the uptrend in the medium-term. 1.2930 is the closest support.
EUR/USD: Bears On Track for Retest of 2022 Low
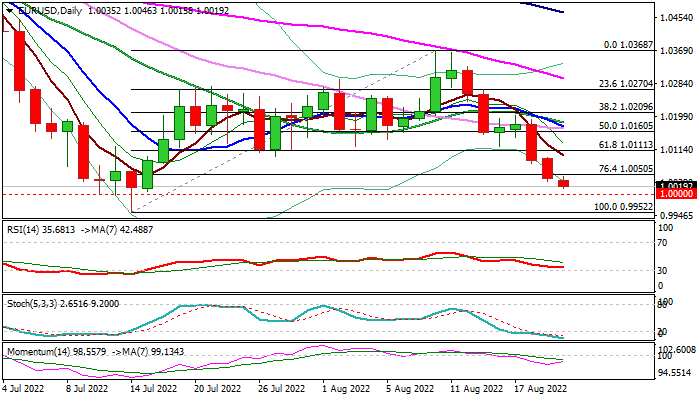
The Euro resumes strong fall of past two days and pressuring parity level in early Monday trading, following 2.1% drop last week.
Growing negative sentiment on continuous weak economic data from the EU that prompts traders into safety of US dollar, strongly weigh on the single currency.
Bears are on track for another probe through parity level and retest of 2022 low at 0.9952 (July 14), where previous attempt was strongly rejected.
Fully bearish weekly studies support the notion, though oversold daily techs suggest that bears may face headwinds on approach to key support and pause the downtrend for consolidation.
Upticks should stay under 1.01 zone and expected to provide better selling opportunities for push through 0.9952 pivot that would unmask Sep 2002 low at 0.9607.
Res: 1.0050; 1.0100; 1.0160; 1.0184.
Sup: 1.0000; 0.9952; 0.9900; 0.9853.
Dollar Outpaced Peers Despite Relative Yield Disadvantage
Markets
The core bond sell off last week lasted until the US close. Double digit UK inflation numbers, US retail resilience, hawkish messages from the RBNZ & Norges Bank and finally an avalanche of Fed comments all contributed to refocus on inflation dynamics and front-loaded tightening by central banks. It broke ranks with the core bond/stock market comeback since mid-June when the onus was on recessionary fears which would keep central banks sidelined sooner. UK gilts underperform German Bunds who in their turn underperformed US Treasuries. On a weekly basis, UK yields added 17.7 bps (30-yr) to 45.8 bps (2-yr) in a bear flattening move. German yields added 16.9 bps (30-yr) to 28.8 bps (3-yr) with the curve moving in similar fashion. From a technical point of view, longer term yields broke out of their corrective downward trend channels. The US yield curve turned less inverse with weekly changes varying between +14.8 bps (7-yr) and -1.3 bps (2-yr). European and US stock markets on Friday again fell prey to the ferocity of the core bond sell-off with main indices losing 1% to 2%. The dollar outpaced peers despite the relative yield disadvantage. The more difficult risk context is one explanation. A second one is in the breakdown of the yield surge. Especially in Europe, higher inflation expectations made a larger contribution compared to real yields. Technically, EUR/USD’s failure to regain first resistance around 1.0350 was already a bad omen for the pair which closed the week at 1.0037. Sterling lost out against the euro given the global context with the pair exiting the corrective downward trend channel since mid-June and closing the week at 0.8485. Smaller, less liquid currencies (CEE, down under, SEK) faced a tough week with the commodity-related NOK and CAD being the only ones to more or less keep level with the euro (thus still losing out against USD). USD/JPY broke above 135.58 resistance, returning above 137. This morning’s PBOC easing (see below) doesn’t really influence global markets. Local stock indices slightly outperform (+0.5%) while CNY drops to a new YTD low at 6.83. Today’s eco calendar only contains some second-tier eco releases, but gets more exiting later on. EMU August PMI’s (tomorrow), Minutes of the previous ECB Meeting (Thursday) and US PCE deflators (Friday) are scheduled for release. This week’s main talking point will be the Kansas City Fed’s Jackson Hole symposium with Fed Chair Powell giving the key note speech on the economic outlook on Friday. We expect last week’s trends to last into that speech as markets reposition towards more hawkish central banks. We finally retain comments by German Bundesbank Nagel who warned for double digit German inflation in Autumn with inflation likely averaging more than 6% next year. It’s a strong nod towards continuing policy normalization in steps of 50 bps, as suggested by ECB Schnabel last week.
News Headlines
At the monthly fixing, the PBOC this morning lowered the 1-year loan prime rate by 5 bps to 3.65%. The 5 year LPR was set 15 bps lower at 4.30%. The PBOC action follows other measures from the Chinese central bank last week to support the ailing property sector. The move also aims to revive credit flows to the broader economy as activity still struggles to rebound from Covid-lockdowns and as uncertainty on the local real estate sector is weighing on consumers’ moral. The yuan this morning weakens further against the dollar with USD/CNY trading near 6.827. In an interview with Bloomberg, RBNZ deputy governor Hawkesby indicated that the central bank wants the get the OCR cash policy rate comfortably above neutral in order to slow the economy and cool price pressures. The RBNZ last week raised its policy rate from 2.5% to 3.0%. Hawkesby assessed that the economy has been more resilient than expected. The central bank was deliberately ambiguous as it forecasted a potential 4.1% peak for the policy rate. There is a risk that the policy rate will have to be raised to 4.25%. According to Hawkesby, the RBNZ hasn’t settled on a new estimate for what the neutral policy rate might be, but the MPC talked about a range of 2% to 3% which is higher than a previous estimate of 2.0%.