Sample Category Title
New Zealand goods exports rose 16% yoy in Jul, imports rose 26% yoy
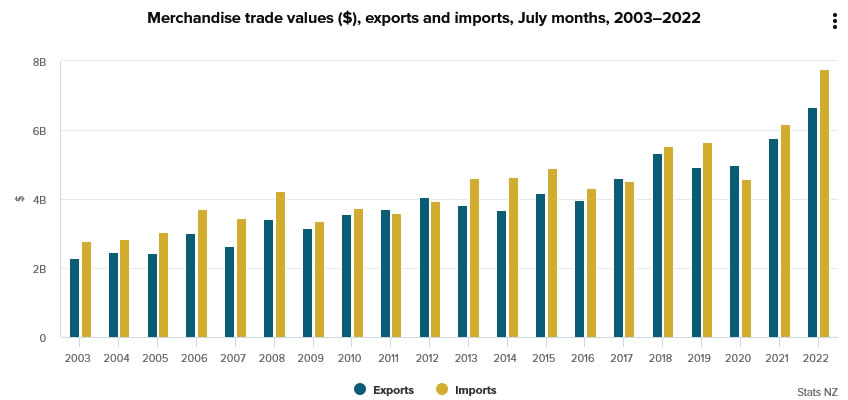
New Zealand goods exports rose 16% yoy to NZD 6.7B in July. Goods imports rose 26% yoy to NZD 7.8B. Trade deficit came in at NZD -1.1B, comparing expectation of NZD 105m surplus.
China led the monthly rise in exports, up 13%. Exports to Australia was down -1.1%, USA up 5.8%, EU up 7.5%, Japan up 18%. Imports from China was up 19%, EU up 3.0%, Australia up 16%, USA up 34%, and Japan up 54%.
Japan CPI core rose to 2.4% yoy, highest since 2014
Japan headline CPI rose from 2.4% yoy to 2.6% yoy in July, above expectation of 2.2% yoy. CPI core (all items ex-fresh food) rose from 2.2% yoy to 2.4% yoy, matched expectations. CPI core-core (all items ex-food, energy) rose from 1.0% yoy to 1.2% yoy, above expectations of 0.6% yoy.
Core inflation has now exceeded BoJ's 2% target for four straight months, and hit the highest level since December 2014. The core-core reading was also the fastest since December 2015, while the headline reading was the strongest since 2008.
Both Prime Minister Fumio Kishida and BoJ Governor Haruhiko Kuroda have called for robust wage gains to ensure that inflation is sustainable. But the markets are expecting some pressure on the BoJ for acting on monetary policy if CPI hits 3%.
Fed Bullard: We should continue to move expeditiously on rates
St. Louis Fed President James Bullard told WSJ, "we should continue to move expeditiously to a level of the policy rate that will put significant downward pressure on inflation" and "I don't really see why you want to drag out interest rate increases into next year."
Bullard also indicated that he backs another 75bps rate hike in September. He also reiterated he preference to have federal funds rate at 3.75-4.00% by the end of the year, from current 2.25-2.50%.
Fed George: Direction for rates pretty clear, but pace to be debated
Kansas City Fed President Esther George said yesterday that "the case for continuing to raise rates remains strong" and "the direction is pretty clear".
But, "the question of how fast that has to happen is something my colleagues and I will continue to debate," she added.
"We have done a lot, and I think we have to be very mindful that our policy decisions often operate on a lag. We have to watch carefully how that's coming through," she warned.
Cliff Notes: Labour Market Strength to Prove a Key Determinant of Policy in 2023
Key insights from the week that was.
The strength of the Australian labour market was a key talking point this week as the unemployment and underemployment rates reached new multi-decade lows of 3.4% and 6.0% respectively.
Intriguingly, this occurred as the Australian economy lost 41k jobs and total hours worked declined 0.8%, offset by a 0.3ppt decline in participation. The ABS made clear that the loss of jobs in the month likely stemmed from the sample period coinciding with the winter school holidays; absences associated with COVID-19 and other illnesses; and flooding in NSW. Shifting seasonality also looks to have been a factor, with 35k jobs created on a non-seasonally-adjusted basis.
Not only is demand for labour strong, but the supply of labour remains heavily constrained (see below for a discussion of the latest migration data). Combined, these two trends look set to tighten Australia’s labour market further in coming months, with the unemployment rate forecast to fall to 3.0% around the turn of the year. While the headline Wage Price Index is yet to respond to this historic degree of labour market tightness (0.7%; 2.6%yr), the detail of the Q2 report make clear momentum is building. Most significantly, the private sector respondents that received a wage increase in the quarter reported a 3.8% gain, the strongest result since June 2012. We expect these gains to broaden across the population and to strengthen further through 2023, with annual growth in the headline wage price index forecast to peak at 4.5% at end-2023.
The potential risk that (extremely) limited spare capacity poses to Australia’s fight against inflation was evident in the RBA minutes for August, as discussed by Chief Economist Bill Evans. While global factors continue to be recognised for their role in the current inflationary episode, the August minutes gave “widespread upward pressures on prices from strong demand, a tight labour market and capacity constraints” greater attention. The Board also emphasised that strong demand conditions are expected to hold through 2022, potentially impacting inflation and expectations into 2023.
While cognisant of these risks, we continue to expect a peak cash rate of 3.35% at February 2023 will quell domestic inflation pressures as GDP growth abruptly slows to just 1.0%yr by December 2023. Before moving on from the RBA minutes, we also must highlight their discussion of climate change and the management of related risks. Specifically, climate change’s growing prominence in investor decision making was emphasised, as was the potential for these considerations to impact the cost of funding. Disclosure standards as well as the risks to the economy and financial system from climate change were also front of mind.
As noted above, migration data for July was also released this week. The recovery in overseas travel was supported by a return to mid-year seasonal strength as Australian residents and visitors embarked on short-term holiday travel. Arrivals and departures have now risen to be at 60% and 55% of their respective pre-pandemic levels, with a full recovery in these headline figures by the end of summer becoming increasingly likely. However, the clear lack of evidence indicating positive net inflows of temporary workers presents some offsetting concerns. This is not due to a lack of foreign demand for Australian temporary work, but rather the presence of substantial visa processing delays creating a notable lag in the return of temporary workers, offering little support to alleviate labour supply constraints within Australia.
Across in New Zealand, the resolve of the RBNZ to suppress inflation and associated risks was again on display at their August meeting, with another 50bp hike delivered and more flagged for later this year. As detailed by our New Zealand economics team, the decision statement focused heavily on inflation pressures and capacity constraints, most notably in the labour market. The expected pace of rate increases was also accelerated and the projected peak for the cash rate lifted slightly to 4.1%. Our New Zealand team broadly concur with the RBNZ’s thinking, having forecast two additional 50bp increases for the remainder of the year to a peak of 4.0%. However, they see more scope for interest rates to ease back in subsequent years given growing evidence that policy tightening is having the desired effect. Westpac’s August Economic Overview is now available for a full view of New Zealand’s economy.
Data received for the US this week was largely secondary in significance. July housing starts/ permits and existing home sales highlighted the shock to activity from tight financial conditions and declining real incomes, the latter materially impairing affordability. Retail sales meanwhile met expectations, but again showed a consumer challenged by the cost of living, with total sales flat in the month and core spending up modestly after a poor Q2.
The release of the week for the US was instead the FOMC’s July meeting minutes. Perhaps because the July meeting is between participant forecast updates, or potentially as they expect recent weakness to be recovered quickly, the tone of the Committee’s commentary was sanguine on activity and, in terms of the risks, still focused on inflation. That said, it seems as though expectations of risks are shifting. Inflation risks related to pandemic supply disruptions are seen as largely in the past, and “the apparent absence of a wage–price spiral” was noted – the latter minimising the risk of a third wave of inflation on strong consumer demand. Participants are also clearly of the view that “the bulk of the effects on real activity had yet to be felt” and so there is need to be cognisant of any change in activity momentum month to month. We remain of the view that September’s 50bp hike will be followed by two 25bp hikes in November and December to a peak fed funds rate of 3.375%. However, a pause to late-2023 will then be seen with 125bps of cuts to follow from December quarter 2023. This easing should support growth back to trend by end-2024 and see the unemployment rate stabilise around 5.0%, up from 3.5% currently.
In Europe, inflation continues to spark concern. In short, the Russia-Ukraine conflict and the COVID-19 reopening represent a dual-front of inflationary pressures. Supply issues continue to drive record inflation prints in the Euro Area (8.9%yr), with energy (39.6%yr) and food (11.5%yr) making particularly strong contributions. Simultaneously, the rebound in consumer spending across recreation, furniture and restaurants has materially broadened this pulse. Indeed, annual core inflation is not only double the ECB’s medium-term target at 4%yr, but a record 74% of the consumption basket is running at an annual inflation rate above 2.5%, well above the 10-20% range during the pre-pandemic era. Similarly in the UK, annual headline inflation has reached a double-digit pace of 10.1%, and a more concerning print for core inflation (6.2%yr) highlights the extent of the inflation challenge facing the region. Further monetary tightening is clearly warranted to fight this battle, even if a degree of weakness in activity materialises. Hence, we expect the ECB and the Bank of England to raise their respective key policy rates to 1.50% and 2.75% by year-end.
Coming back to China. The data received over the past week disappointed on every front. We are not anxious over the production environment, nor the outlook for infrastructure and business investment – even after the poor July credit outcome, year-to-date total social financing growth still sits at 15%, while comments by Premier Li this week made clear more support is coming. What is of concern though is the spread of COVID-19 in tourist areas such as Hainan. This outbreak has the potential to transmit the virus to multiple locations across the country, as holiday makers go home, and is also likely to deter other households from planning holidays and potentially increasing their discretionary services consumption closer to home. The limited progress in resolving the mortgage strike of recent months and with many developers remaining in a fragile state, it also seems likely that the recovery in housing investment will come later than we anticipated. As a result, we have revised down our 2022 growth forecast to 3.0% from 3.5%, but maintain a 7.0% projection for 2023. Authorities certainly have the capacity to deliver such an outcome, but co-ordinated action at both the central and local level will be required.
USD/JPY Regains Momentum, Eyes More Upsides
Key Highlights
- USD/JPY started a fresh increase above the 134.00 resistance.
- It cleared a major bearish trend line at 134.10 on the 4-hours chart.
- EUR/USD is struggling below the 1.0200 resistance zone.
- GBP/USD extended decline and spiked below the 1.2020 level.
USD/JPY Technical Analysis
The US Dollar formed a base above the 131.50 level and started a fresh increase against the Japanese Yen. USD/JPY broke the 133.20 and 133.50 resistance levels to move into a positive zone.
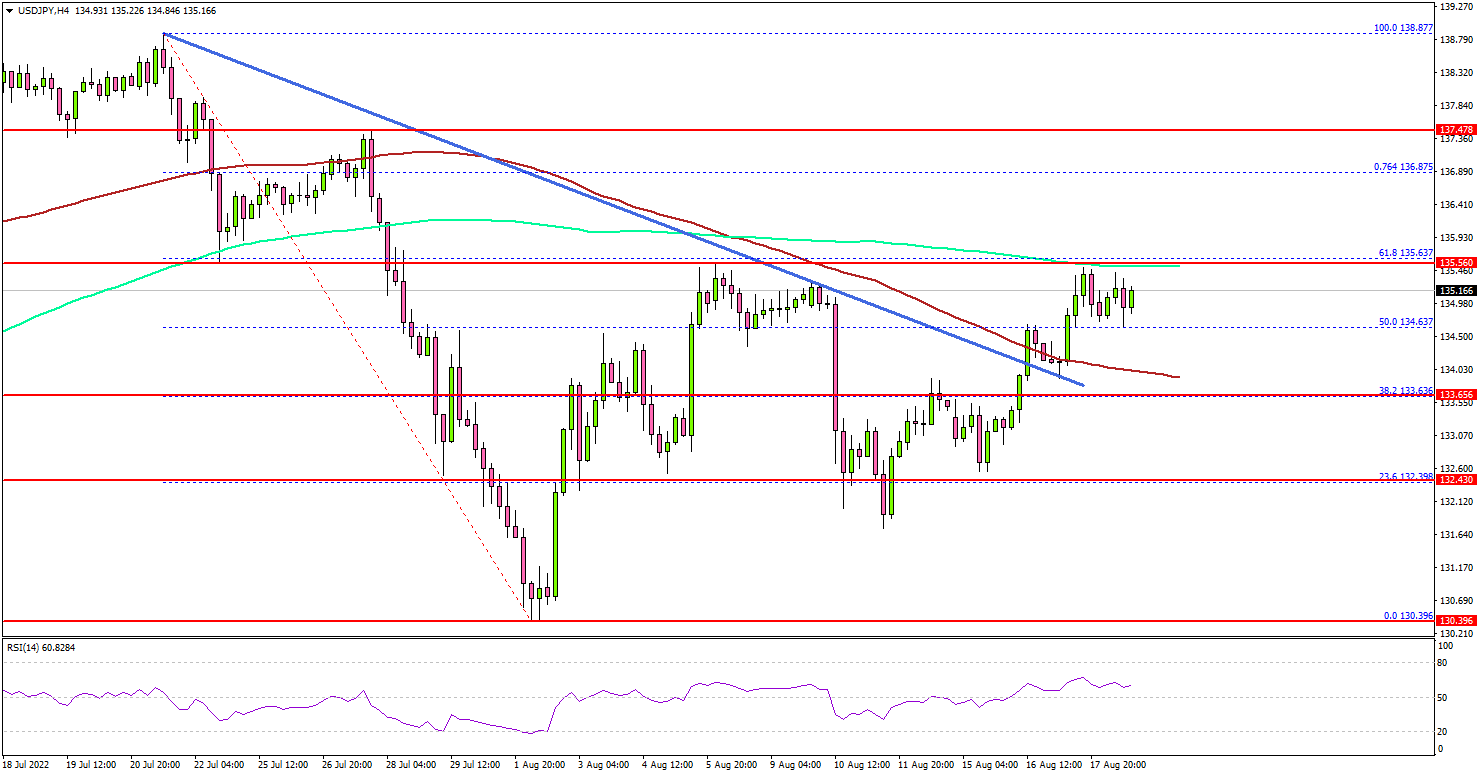
Looking at the 4-hours chart, the pair was able to settle above the 134.00 resistance and the 100 simple moving average (red, 4-hours). There was also a break above a major bearish trend line at 134.10.
The pair surpassed the 50% Fib retracement level of the downward move from the 138.87 swing high to 130.39 low. It is now showing positive signs above the 134.50 level. On the upside, the pair is facing resistance near the 135.65 level and the 200 simple moving average (green, 4-hours).
The next major resistance is near the 136.85 level. It is near the 76.4% Fib retracement level of the downward move from the 138.87 swing high to 130.39 low.
A clear move above the 136.85 resistance might send the pair higher towards the 138.00 level. The next major resistance is 138.80, above which the pair could accelerate higher. In the stated case, the pair could rise towards the 139.50 resistance zone in the near term.
On the downside, there is a decent support forming near 134.50 level. The main support is now forming near the 134.00 level. A downside break below the 134.00 support might push the pair in a negative zone.
Looking at EUR/USD, the pair remained in a bearish zone below the 1.0200 level and might extend losses in the near term.
Economic Releases
- UK Retail Sales for July 2022 (YoY) - Forecast -3.3%, versus -5.8% previous.
- UK Retail Sales for July 2022 (MoM) - Forecast -0.2%, versus -0.1% previous.
- Canadian Retail Sales for June 2022 (MoM) – Forecast +0.3%, versus +2.2% previous.
- Canadian Retail Sales ex Autos for June 2022 (MoM) – Forecast +0.9%, versus +1.9% previous.
Elliott Wave View: CADJPY Looking for 7 Swing
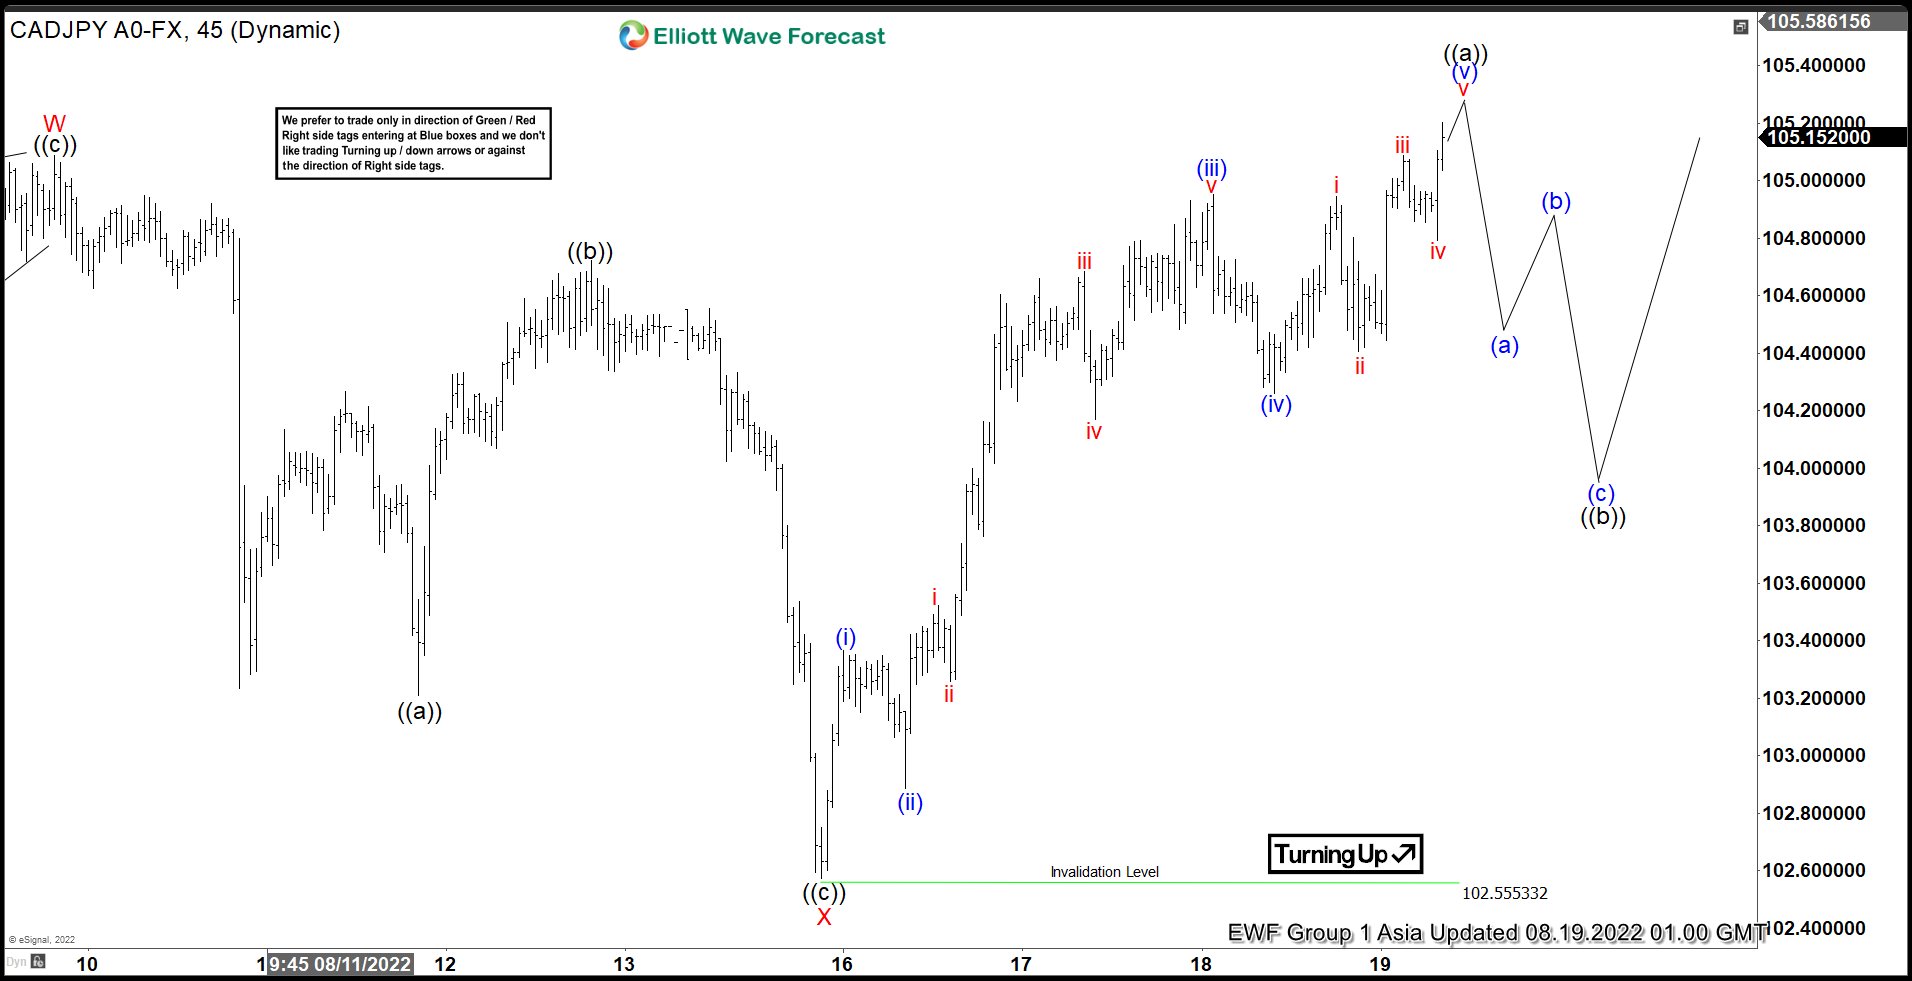
Short term view in CADJPY suggests rally from 8.2.2022 low is unfolding as a double three Elliott Wave structure. Up from 8.2.2022 low, wave ((a)) ended at 104.71 and dips in wave ((b)) ended at 102.93. Pair extended higher in wave ((c)) at 105.088 which completed wave W in higher degree. Pullback in wave X ended at 102.57 low as a zigzag structure. Down from wave W, wave ((a)) ended at 103.2, rally in wave ((b)) ended at 104.72, and final leg lower wave ((c)) ended at 102.57 which also completed wave X.
Wave Y is in progress higher with internal subdivision as a zigzag structure. Up from wave X, wave (i) ended at 103.36 and pullback in wave (ii) ended at 102.88. Pair then resumed higher in wave (iii) towards 104.95, and pullback in wave (iv) ended at 104.26. Near term, expect wave (v) to complete soon and this should also end wave ((a)) of the zigzag. Pair should then pullback in wave ((b)) to correct cycle from 8.15.2022 low in 3, 7, or 11 swing before the rally resumes. As far as pivot at 102.55 low stays intact, expect dips to find support in 3, 7, 11 swing for further upside.
CADJPY 45 Minutes Elliott Wave Chart
British Dips Below 1.20, Retail Sales Next
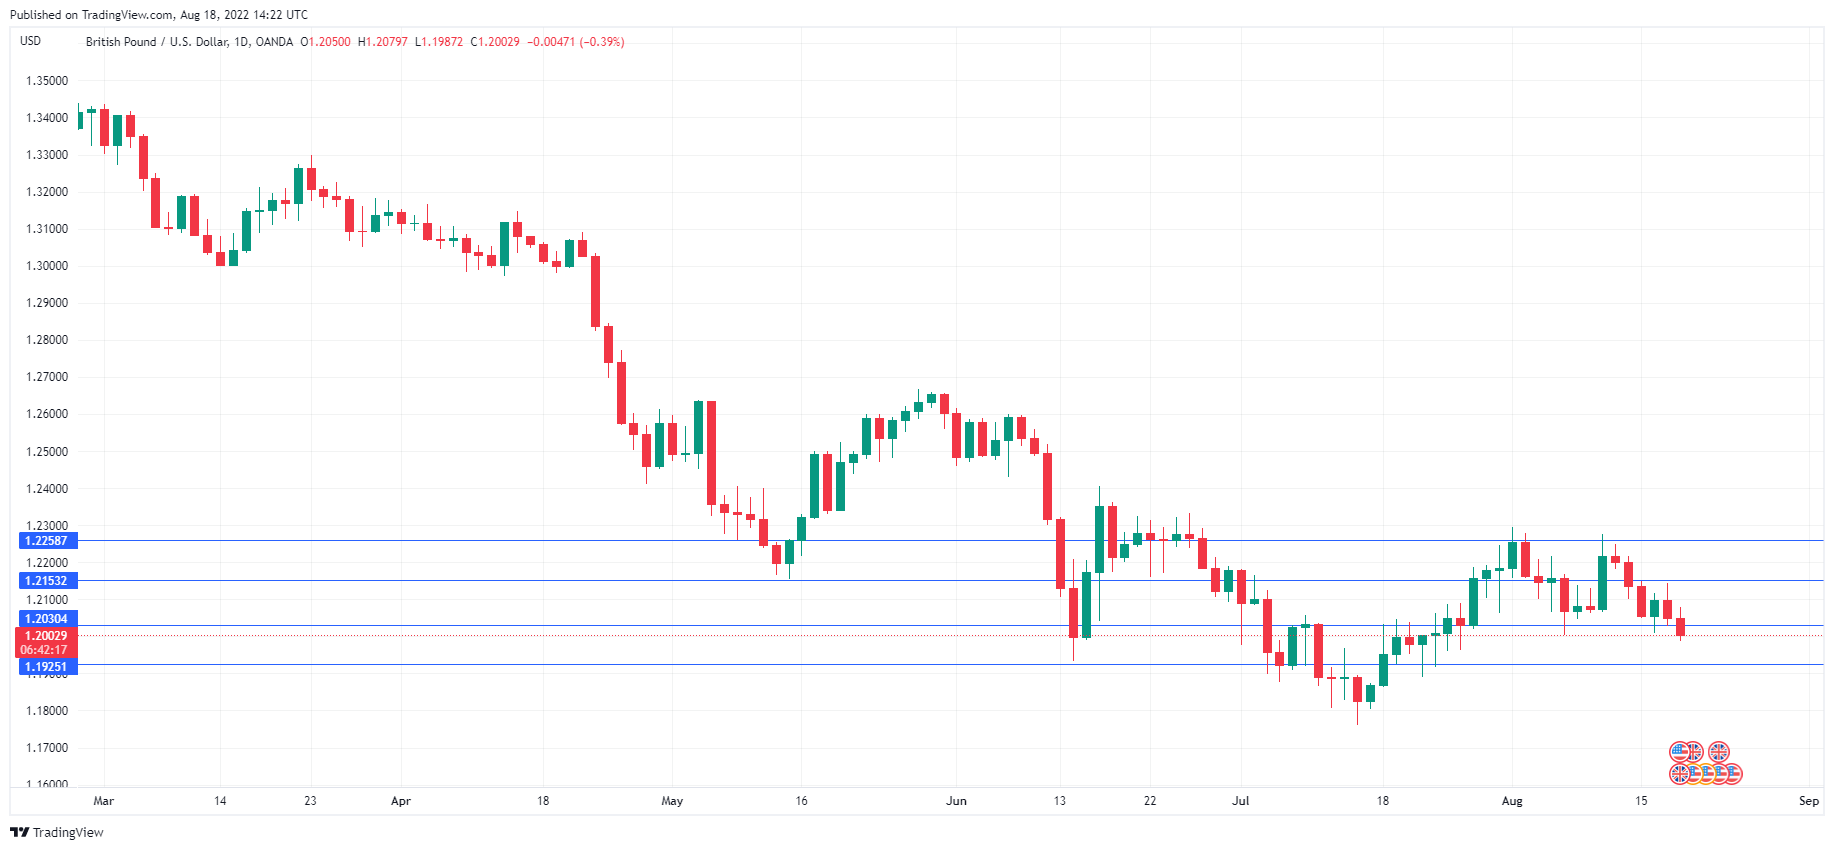
The British pound continues to lose ground and has fallen below the 1.20 line for the first time since July 26th. GBP/USD is trading at 1.1996 in the North American session, down 0.47%.
Pound eyes UK retail sales
It has been a busy economic calendar in the UK this week. Retail sales will wrap things up on Friday, with the markets bracing for more bad news from the consumer spending front. Retail Sales fell 5.8% YoY in June, and the forecast for July stands at -3.3%.
A continuing decline in consumer spending shouldn’t be a surprise, given the grim economic picture. Headline inflation rose to 10.1% YoY in July, up from 9.4% in June and above the forecast of 9.8%. The BoE has been raising interest rates in an effort to curb inflation, but don’t hold your breath. The central bank has warned that it doesn’t expect inflation to peak before it hits a staggering 13% in October. As well, real wages fell 3% in Q2, making it even harder for workers to keep up with the cost-of-living crisis, and the energy price cap will increase substantially in October. The British consumer is trying to ease the pain by cutting back on spending, but this will hurt the economy and could cause the economy to tip into a recession even faster.
The FOMC minutes on Wednesday didn’t contain anything unexpected. The minutes reiterated that monetary tightening would continue until inflation eased significantly. Meeting participants noted that the pace of rate hikes would ease once inflation cooled down. They also said that inflation is not showing signs of peaking. The markets do not appear to have absorbed this hawkish message, with the surprise drop in US inflation resulting in the markets expecting a U-turn in Fed policy. This has led to gains in the equity markets and a downward trend for the US dollar.
GBP/USD Technical
- GBP/USD is testing support at 1.2030. Below, there is support at 1.1925
- There is resistance at 1.2153 and 1.2258
EURGBP Stays Stuck Between Two Diagonal Trendlines
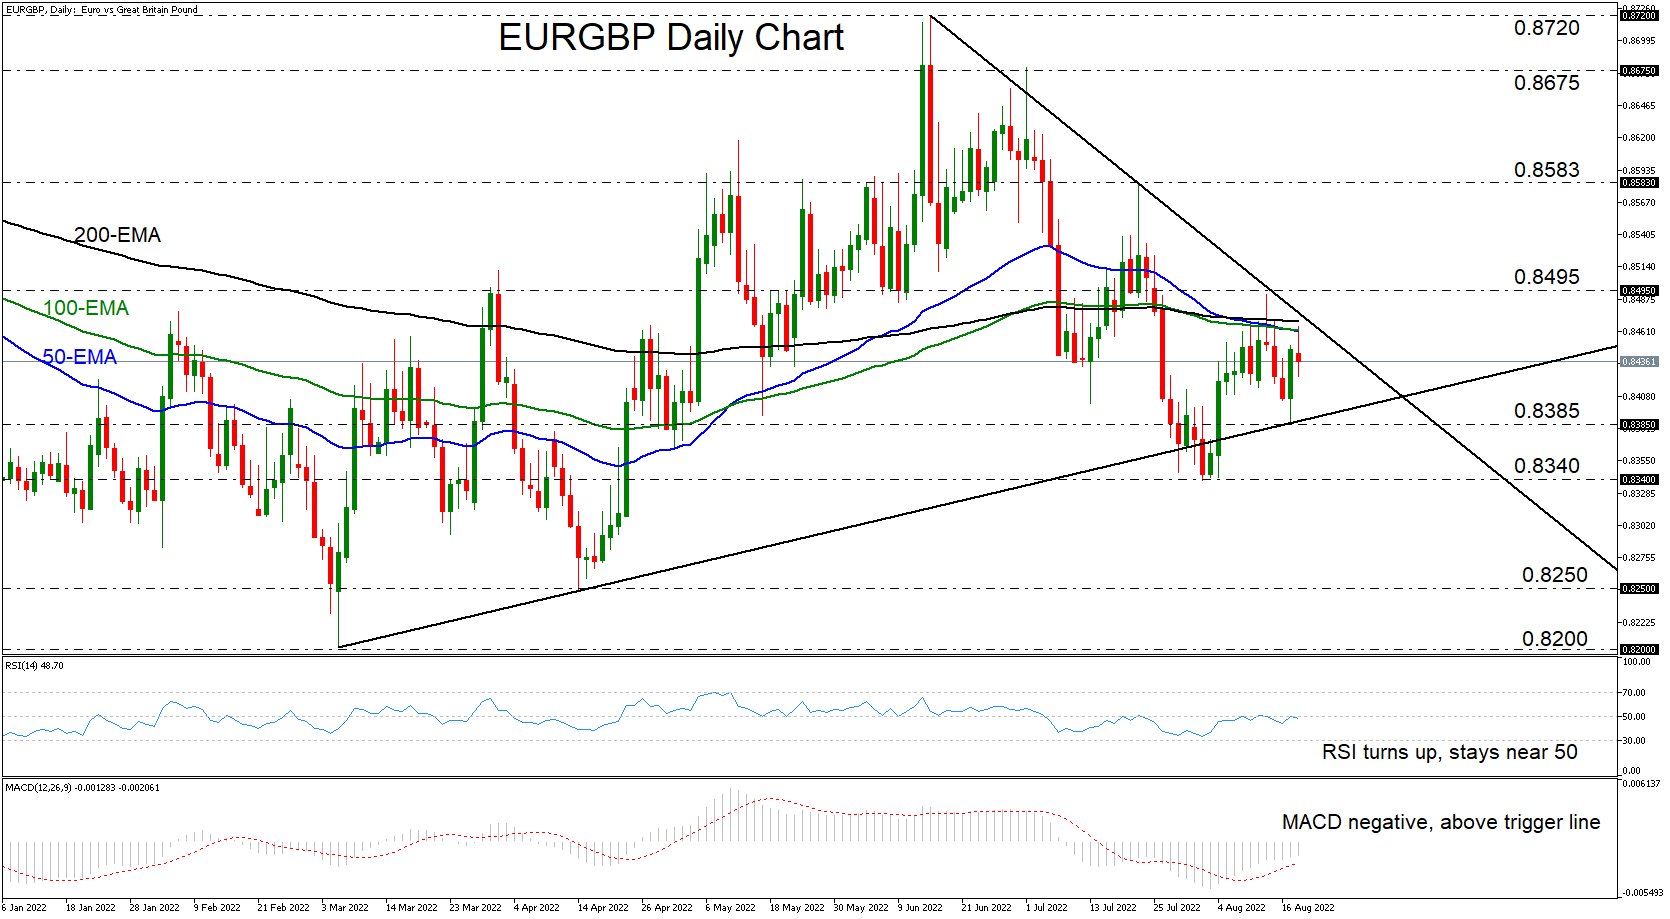
EURGBP traded higher yesterday, after hitting support at the crossroads of the 0.8385 level and the tentative upside line drawn from the low of low of March 7. Nonetheless, the advance remained limited near the conversion point of all the plotted exponential moving averages (EMAs), slightly below the downside line drawn from the high of June 15.
This likely keeps the near-term outlook neutral, a view also enhanced by the daily oscillators. The RSI rebounded somewhat, but it has now flattened near its 50 line, signaling a lack of directional momentum. The MACD, although negative, remains above its trigger line and is getting closer to zero, suggesting that the downside speed is now fading.
The bears may regain full control upon a dip below 0.8385, which could also confirm the break of the upside support line taken from the low of March 7. The next area to consider as a support may be at 0.8340, a zone which prevented the bears from drifting further south at the beginning of this month. However, if that obstacle is cleared this time around, a dive all the way down to the April 14 low at 0.8250 may be possible.
Alternatively, the move that could encourage more bulls to jump into the action may be a recovery above the high of August 12, at around 0.8495. This would confirm a forthcoming higher high on the daily chart and could set the stage for advances towards the peak of July 21, at 0.8583. Another break above 0.8583 could extend the advance towards the July 1 high, near 0.8675.
In short, EURGBP is stuck between two diagonal lines, and although the plotted moving averages are providing resistance, our oscillators detect a lack of, or little, directional momentum. This likely paints a neutral near-term picture for now.