Sample Category Title
EUR/USD Breaks Demand Zone
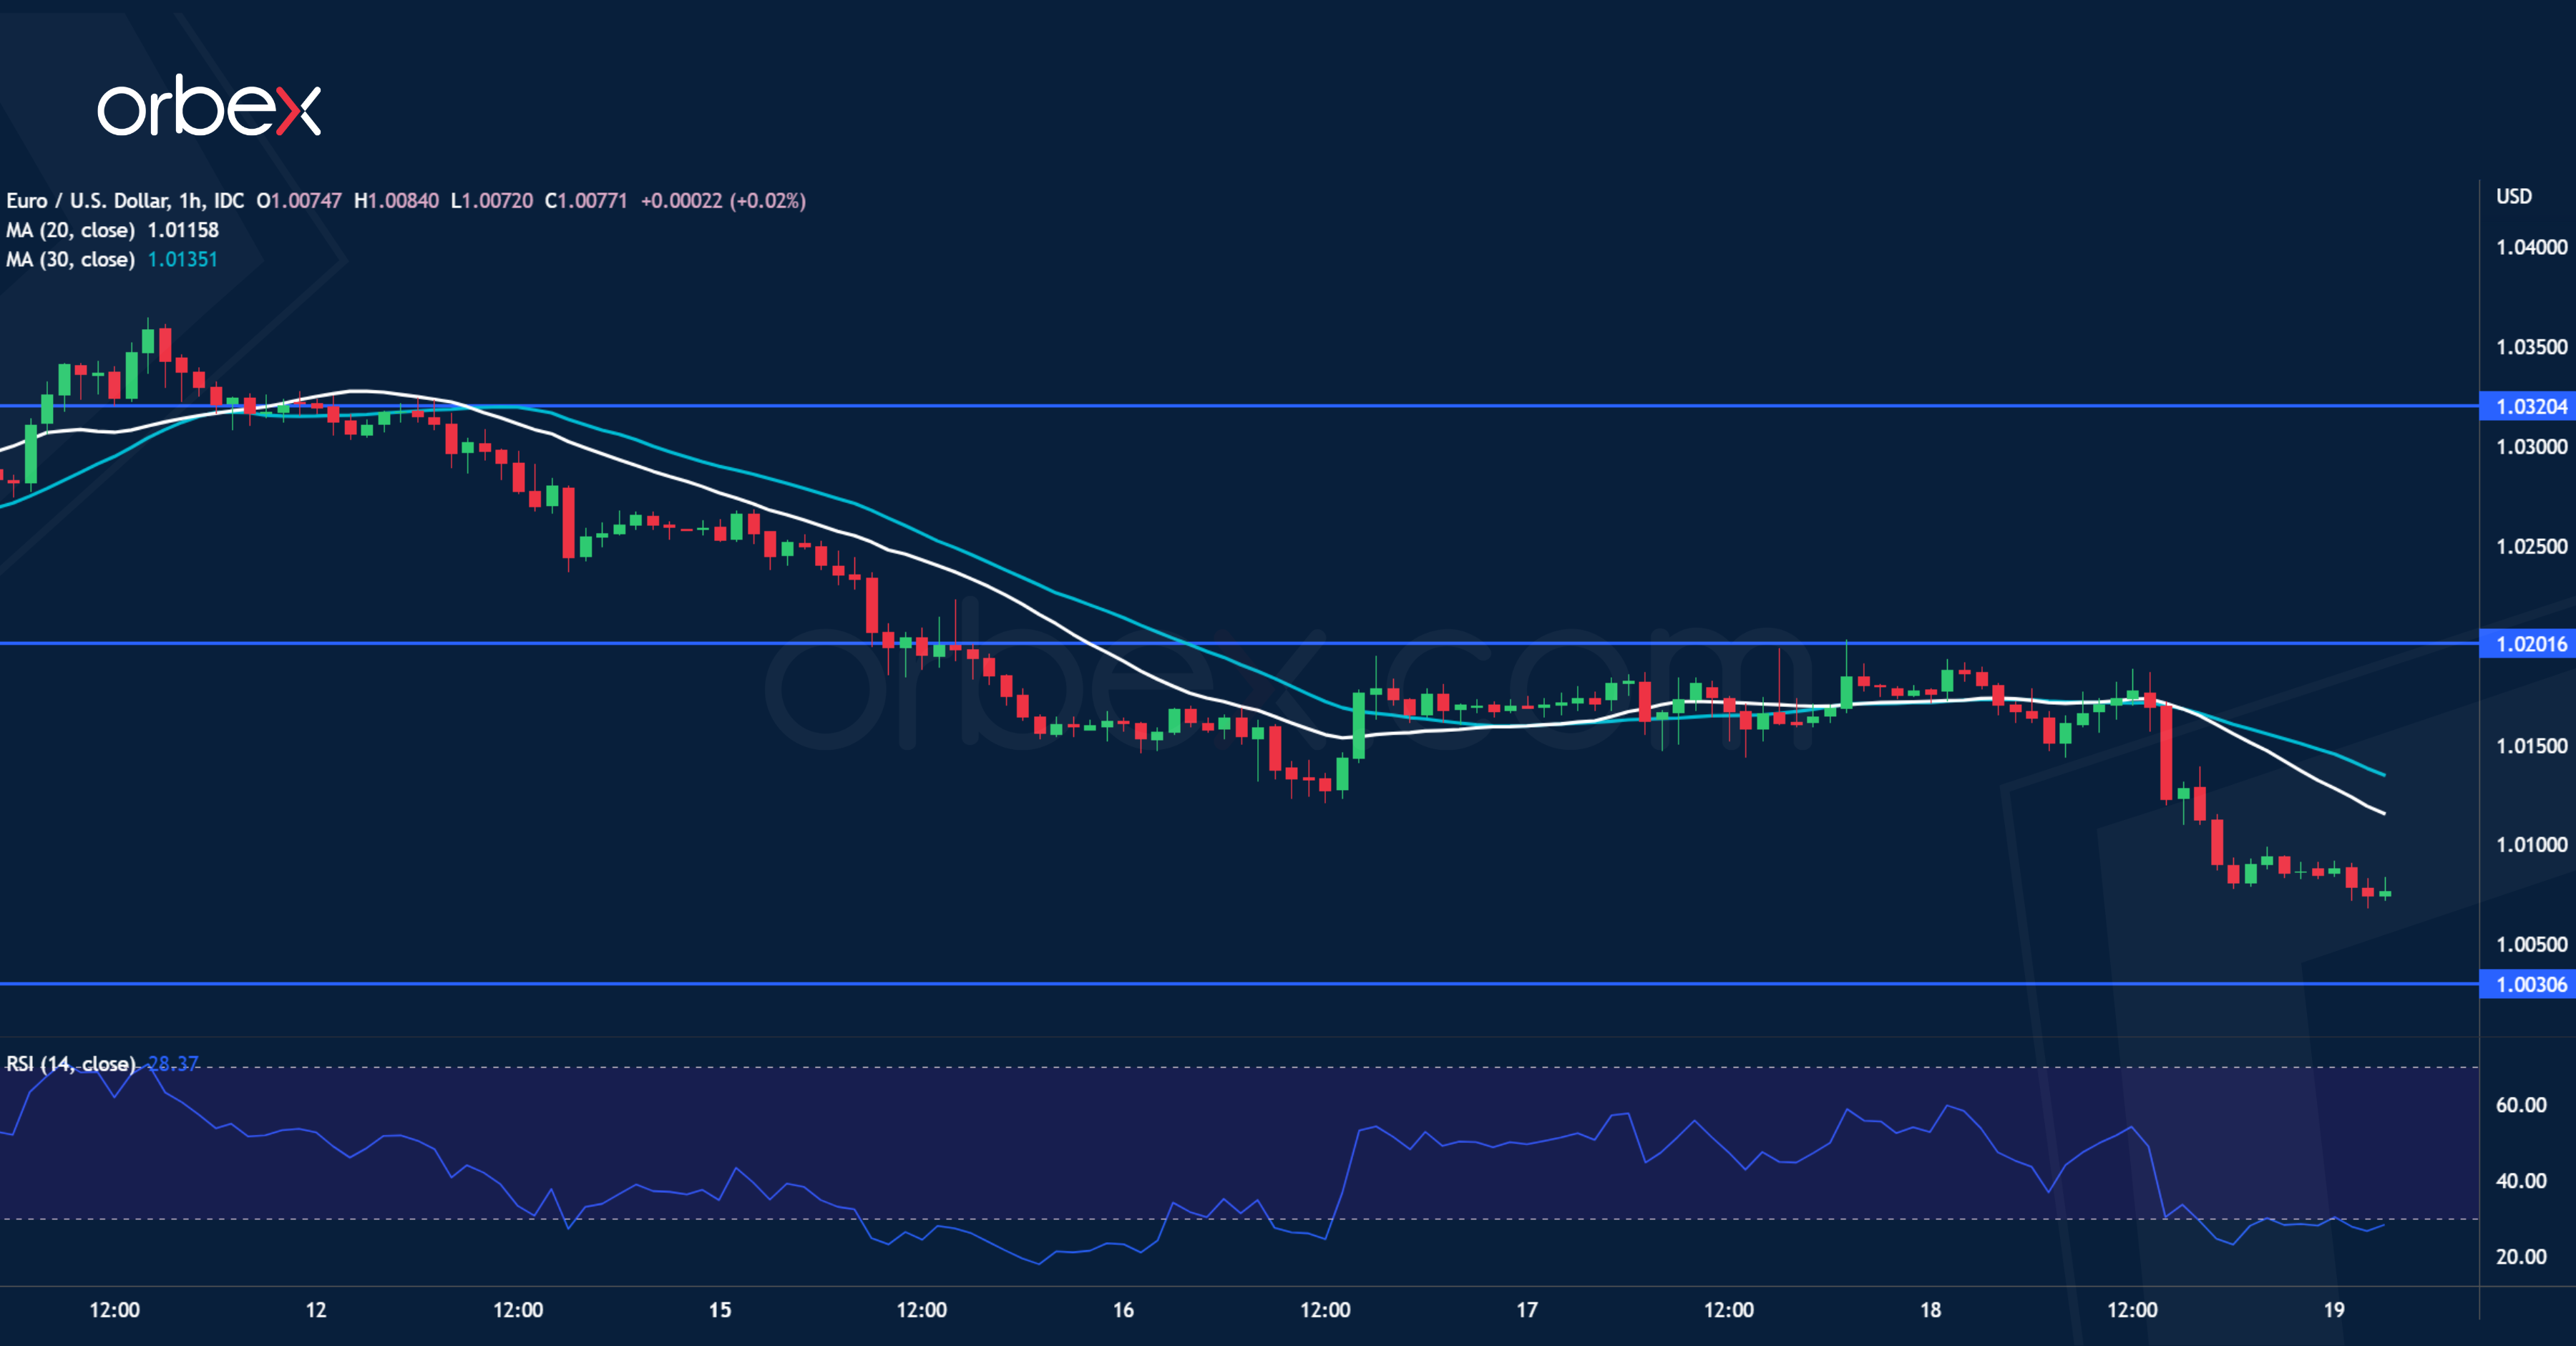
The US dollar surged over fewer jobless claims last week. A fall below 1.0200 has weighed on sentiment, invalidating the latest bounce. The former support has turned into a resistance. The euro’s failure to hold above the previous consolidation area at 1.0120 suggests that the directional bias is still down. The RSI’s oversold condition may attract some bargain hunters, but buyers need to clear 1.0200 before the pair could get back on track. 1.0030 is the next support and a breach could trigger momentum selling below parity.
Daily Technical Analysis
EUR/USD
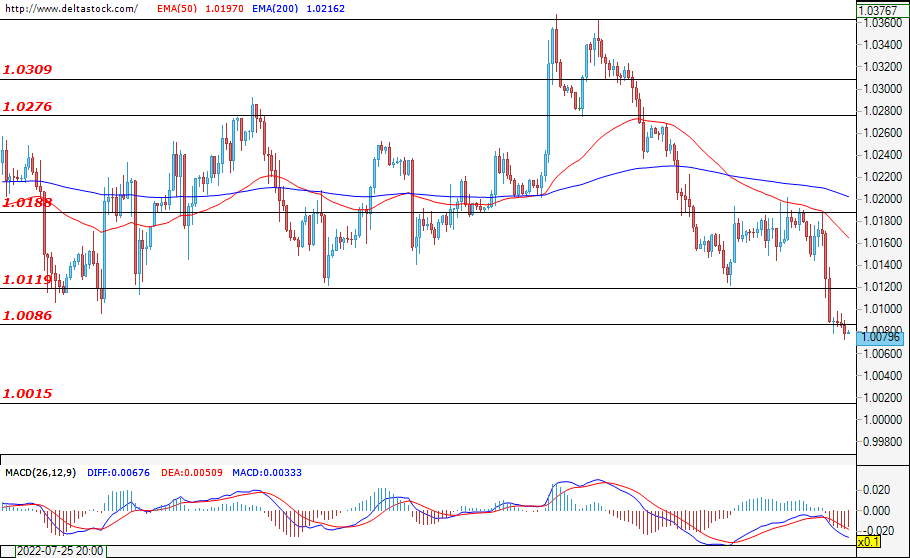
The better-than-expected U.S. unemployment data gave the dollar a strong boost and it rose against the single European currency, easily breaching the support at 1.0119. At the time of writing, the price is consolidating around the next support at 1.0086. For now, the bears have settled permanently in the market and it looks like they will have no problem attacking the levels at around parity. There, the bulls could be expected to enter the market and hold off their pressure for a while. Only a breach of the resistance at 1.0188 could be seen as an attempt at forming a range trend that has become so typical of the pair, but this does not seem very likely for now.
USD/JPY
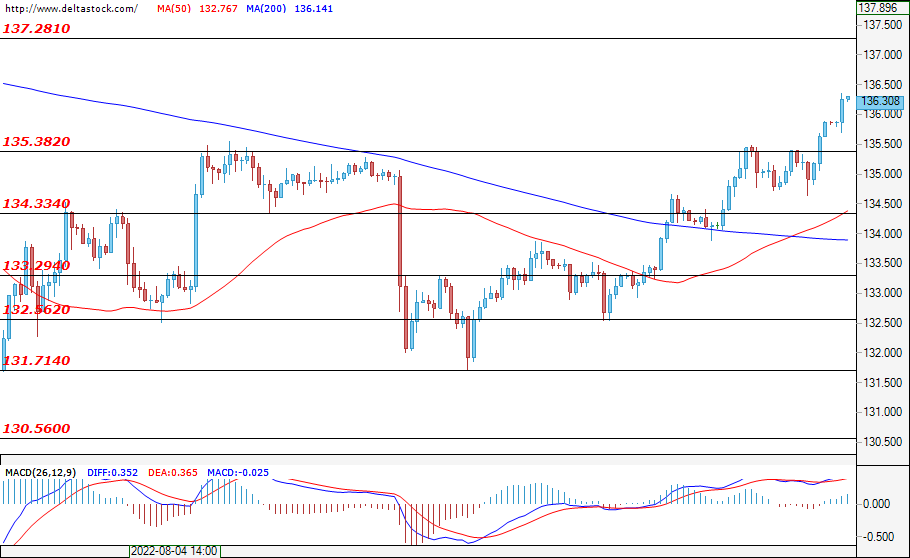
The breach of the resistance at 135.38 proved to be successful, reaffirming the positive sentiment for the appreciation of the dollar against the yen. The next target for the bulls will be the resistance at 137.28. A more sustained bearish reversal is not expected, unless the supports at 134.33 and 133.29 are both overcome.
GBP/USD
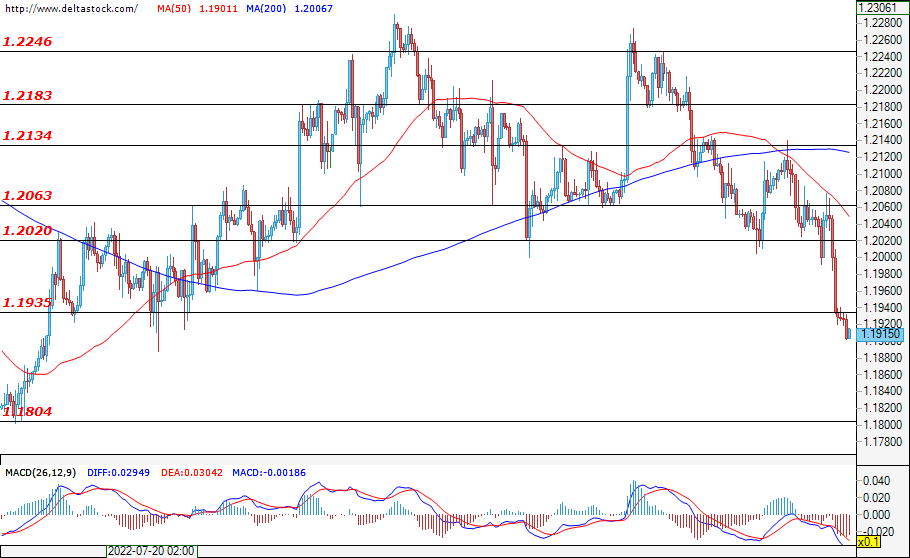
The bears managed to break through the support at 1.2020 after the U.S. jobless claims data came in slightly better than expected. At the time of writing the analysis, the price is hovering around the support at 1.1933, where the bulls are trying to hold off the bearish pressure, but the expectations are that they will fail and that the price will likely head towards the support at 1.1804.
EUGERMANY40
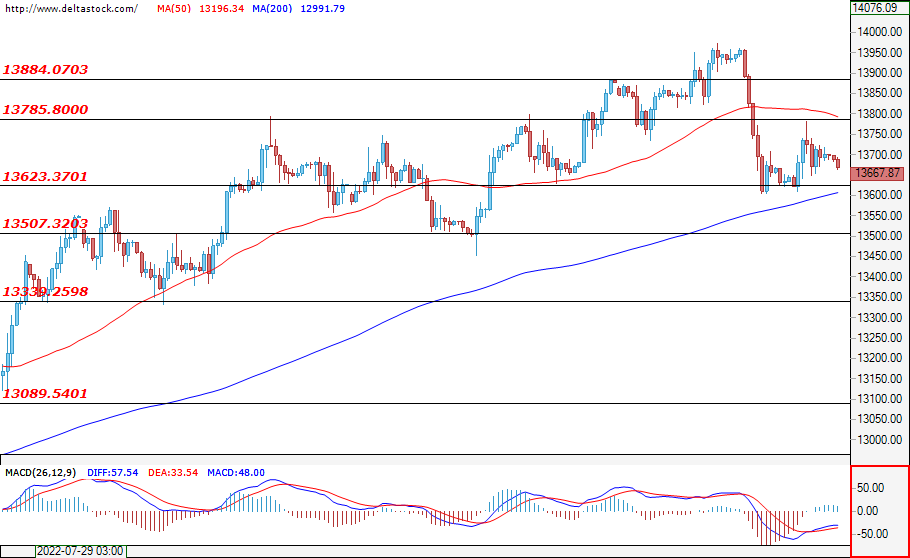
During the past session, the price of the German index consolidated in the range between the levels of 13785 and 13620. While the positive sentiments are likely not over yet, should the bears manage to overcome the supports at 13623 and at 13507, then it is possible that we will see a deeper correction towards the level of 13339. If, however, the resistance at 13785 is overcome, then the positive trend will return and the next target for the bulls – the level at 13885 – will likely be easily overcome.
US30
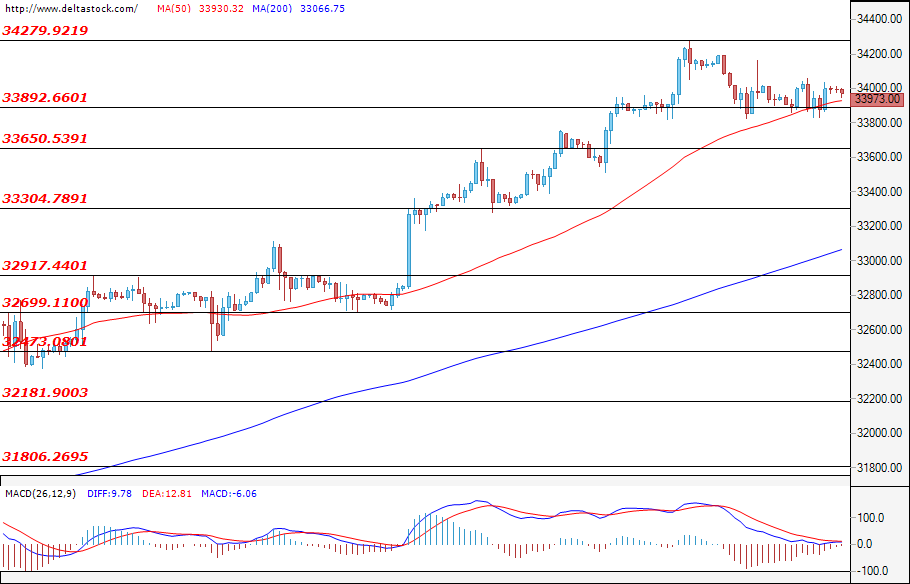
The positive trend for the U.S. blue-chip index is probably not over yet. Although the price has been moving in the range between 34279 and 33829 for the past three sessions, the breach of the support at 33892 has still not been confirmed. Even if it does end up being breached, however, signs of a follow-up correction could only be expected following the breach of the support at 33552. If this does not happen and the resistance at 34279 is overcome instead, then the next level for the bulls will be 34873, which can be seen from the higher time frames.
Technical Outlook and Review
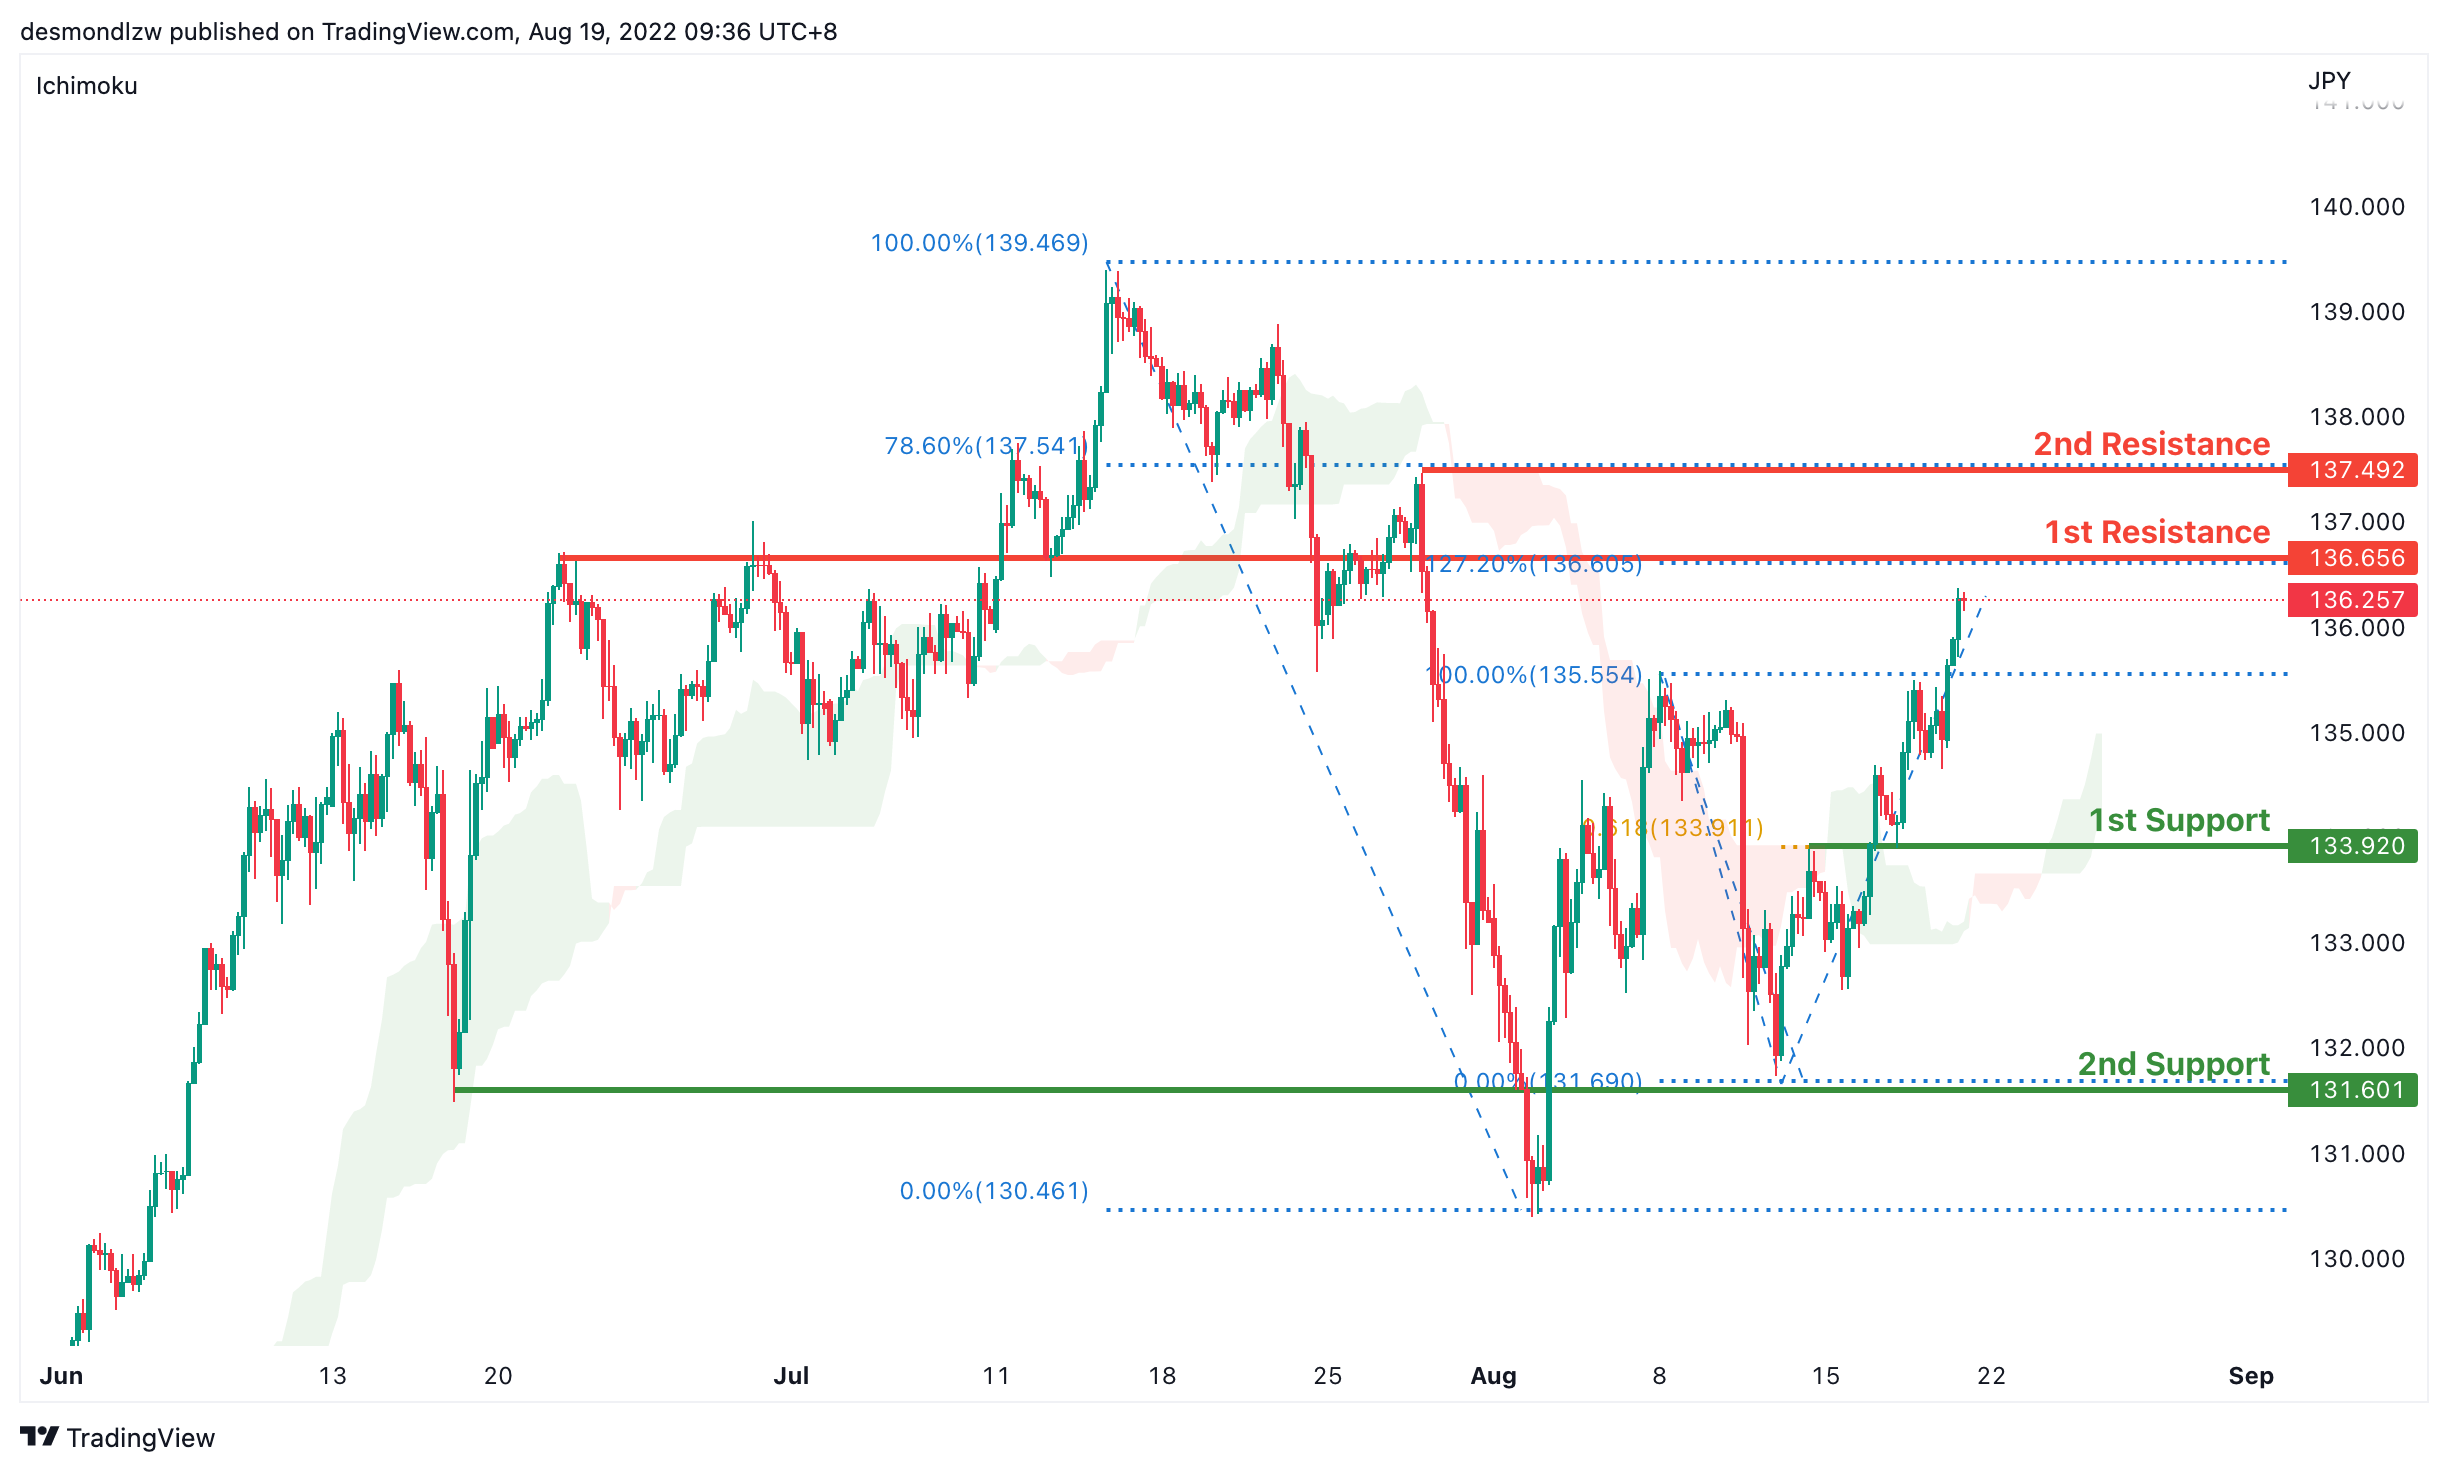
USD/JPY:
On the H4 chart, prices seem to have pulled back a little but the overall trend is still bearish biased. Price has broken the intermediate resistance at 133.908 which is the 50% Fibonacci retracement and is now testing the first resistance at 135.605 where the previous swing high. 61.8% fibonacci retracement and 78.6% projection sits.If the bearish momentum continues it will pull back to test the first support at 131.711 where the 78.6% retracement and 100% projection sits
Areas of consideration:
- H4 time frame, 1st resistance at 135.605
- H4 time frame, 1st support at 131.711
DXY:
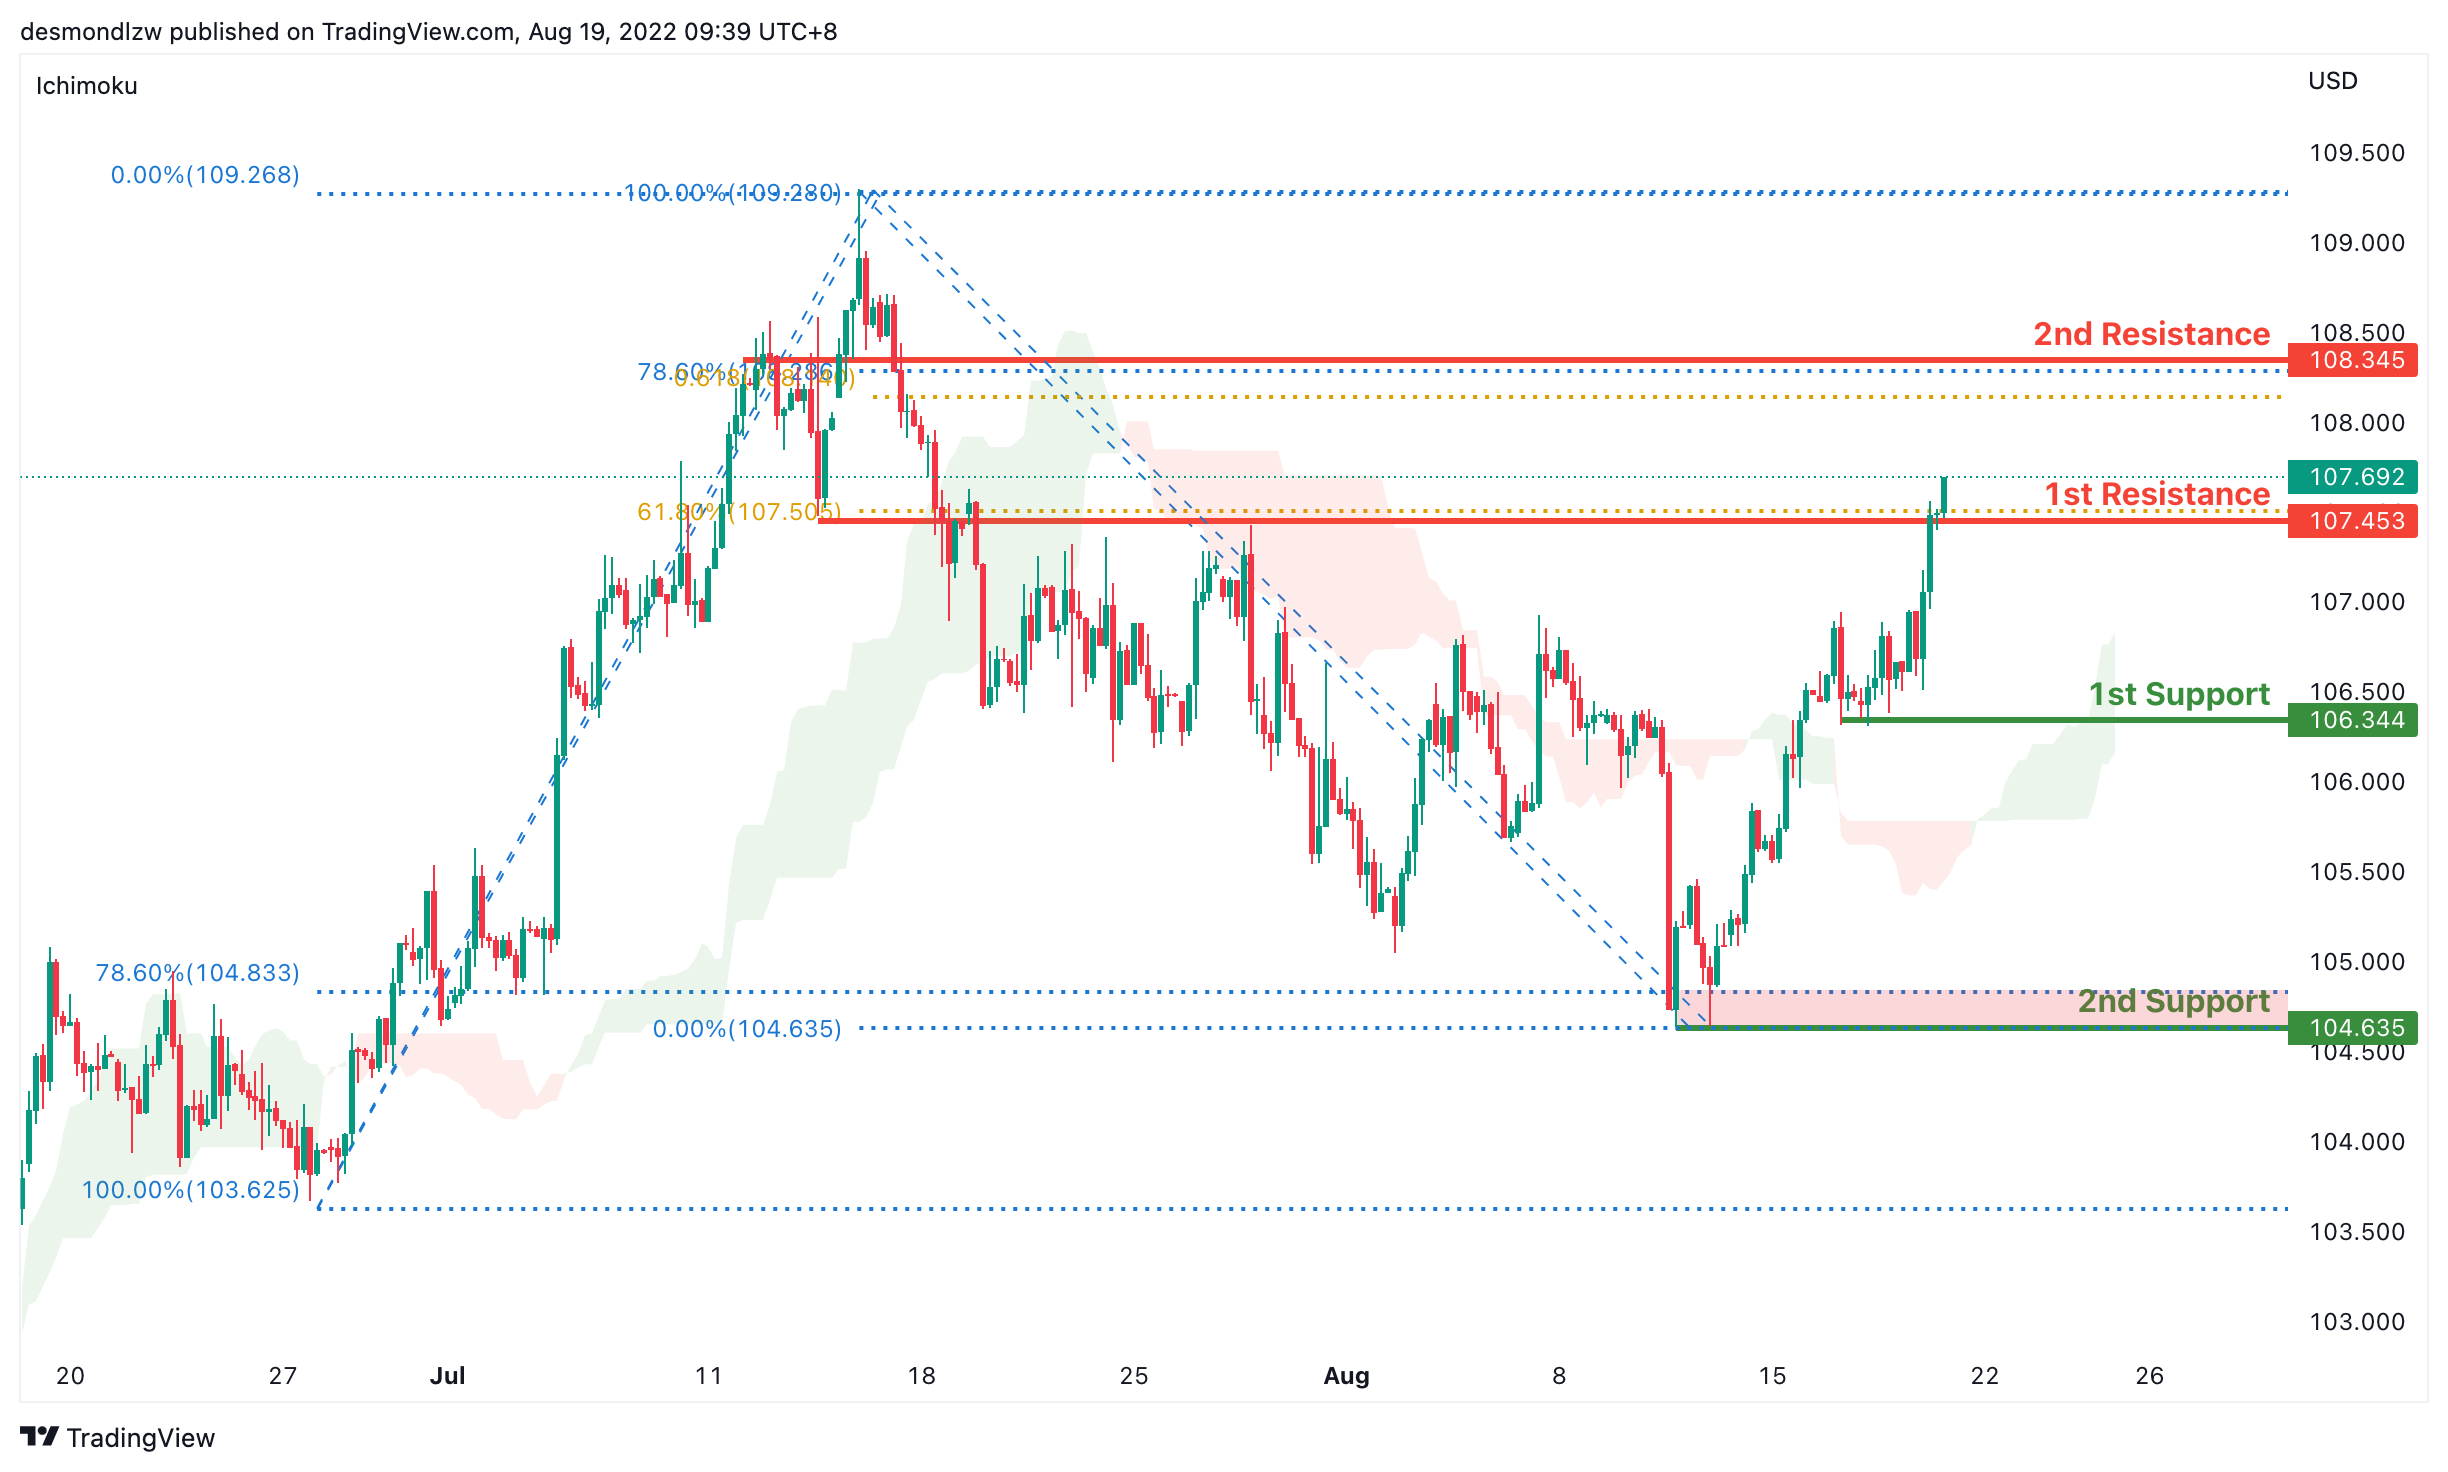
On the H4, prices seem to be moving in an ascending trend and is in a bullish momentum. Price is now around the first resistance at 106.945 where the 50% Fibonacci retracement and the previous swing high sits. We’re looking for price to test the first resistance again and if price continues with bullish momentum, it will test the second resistance at 107.453 where the 61.8% fibonacci retracement sits. If fails to break the first resistance, it will pull back to test the first support at 104.635 where the 78.6% retracement is and subsequently the second support at 103.697 which is the previous swing low
Areas of consideration:
- H4 time frame, 1st resistance at 106.945
- H4 time frame, 1st support at 104.635
EUR/USD :
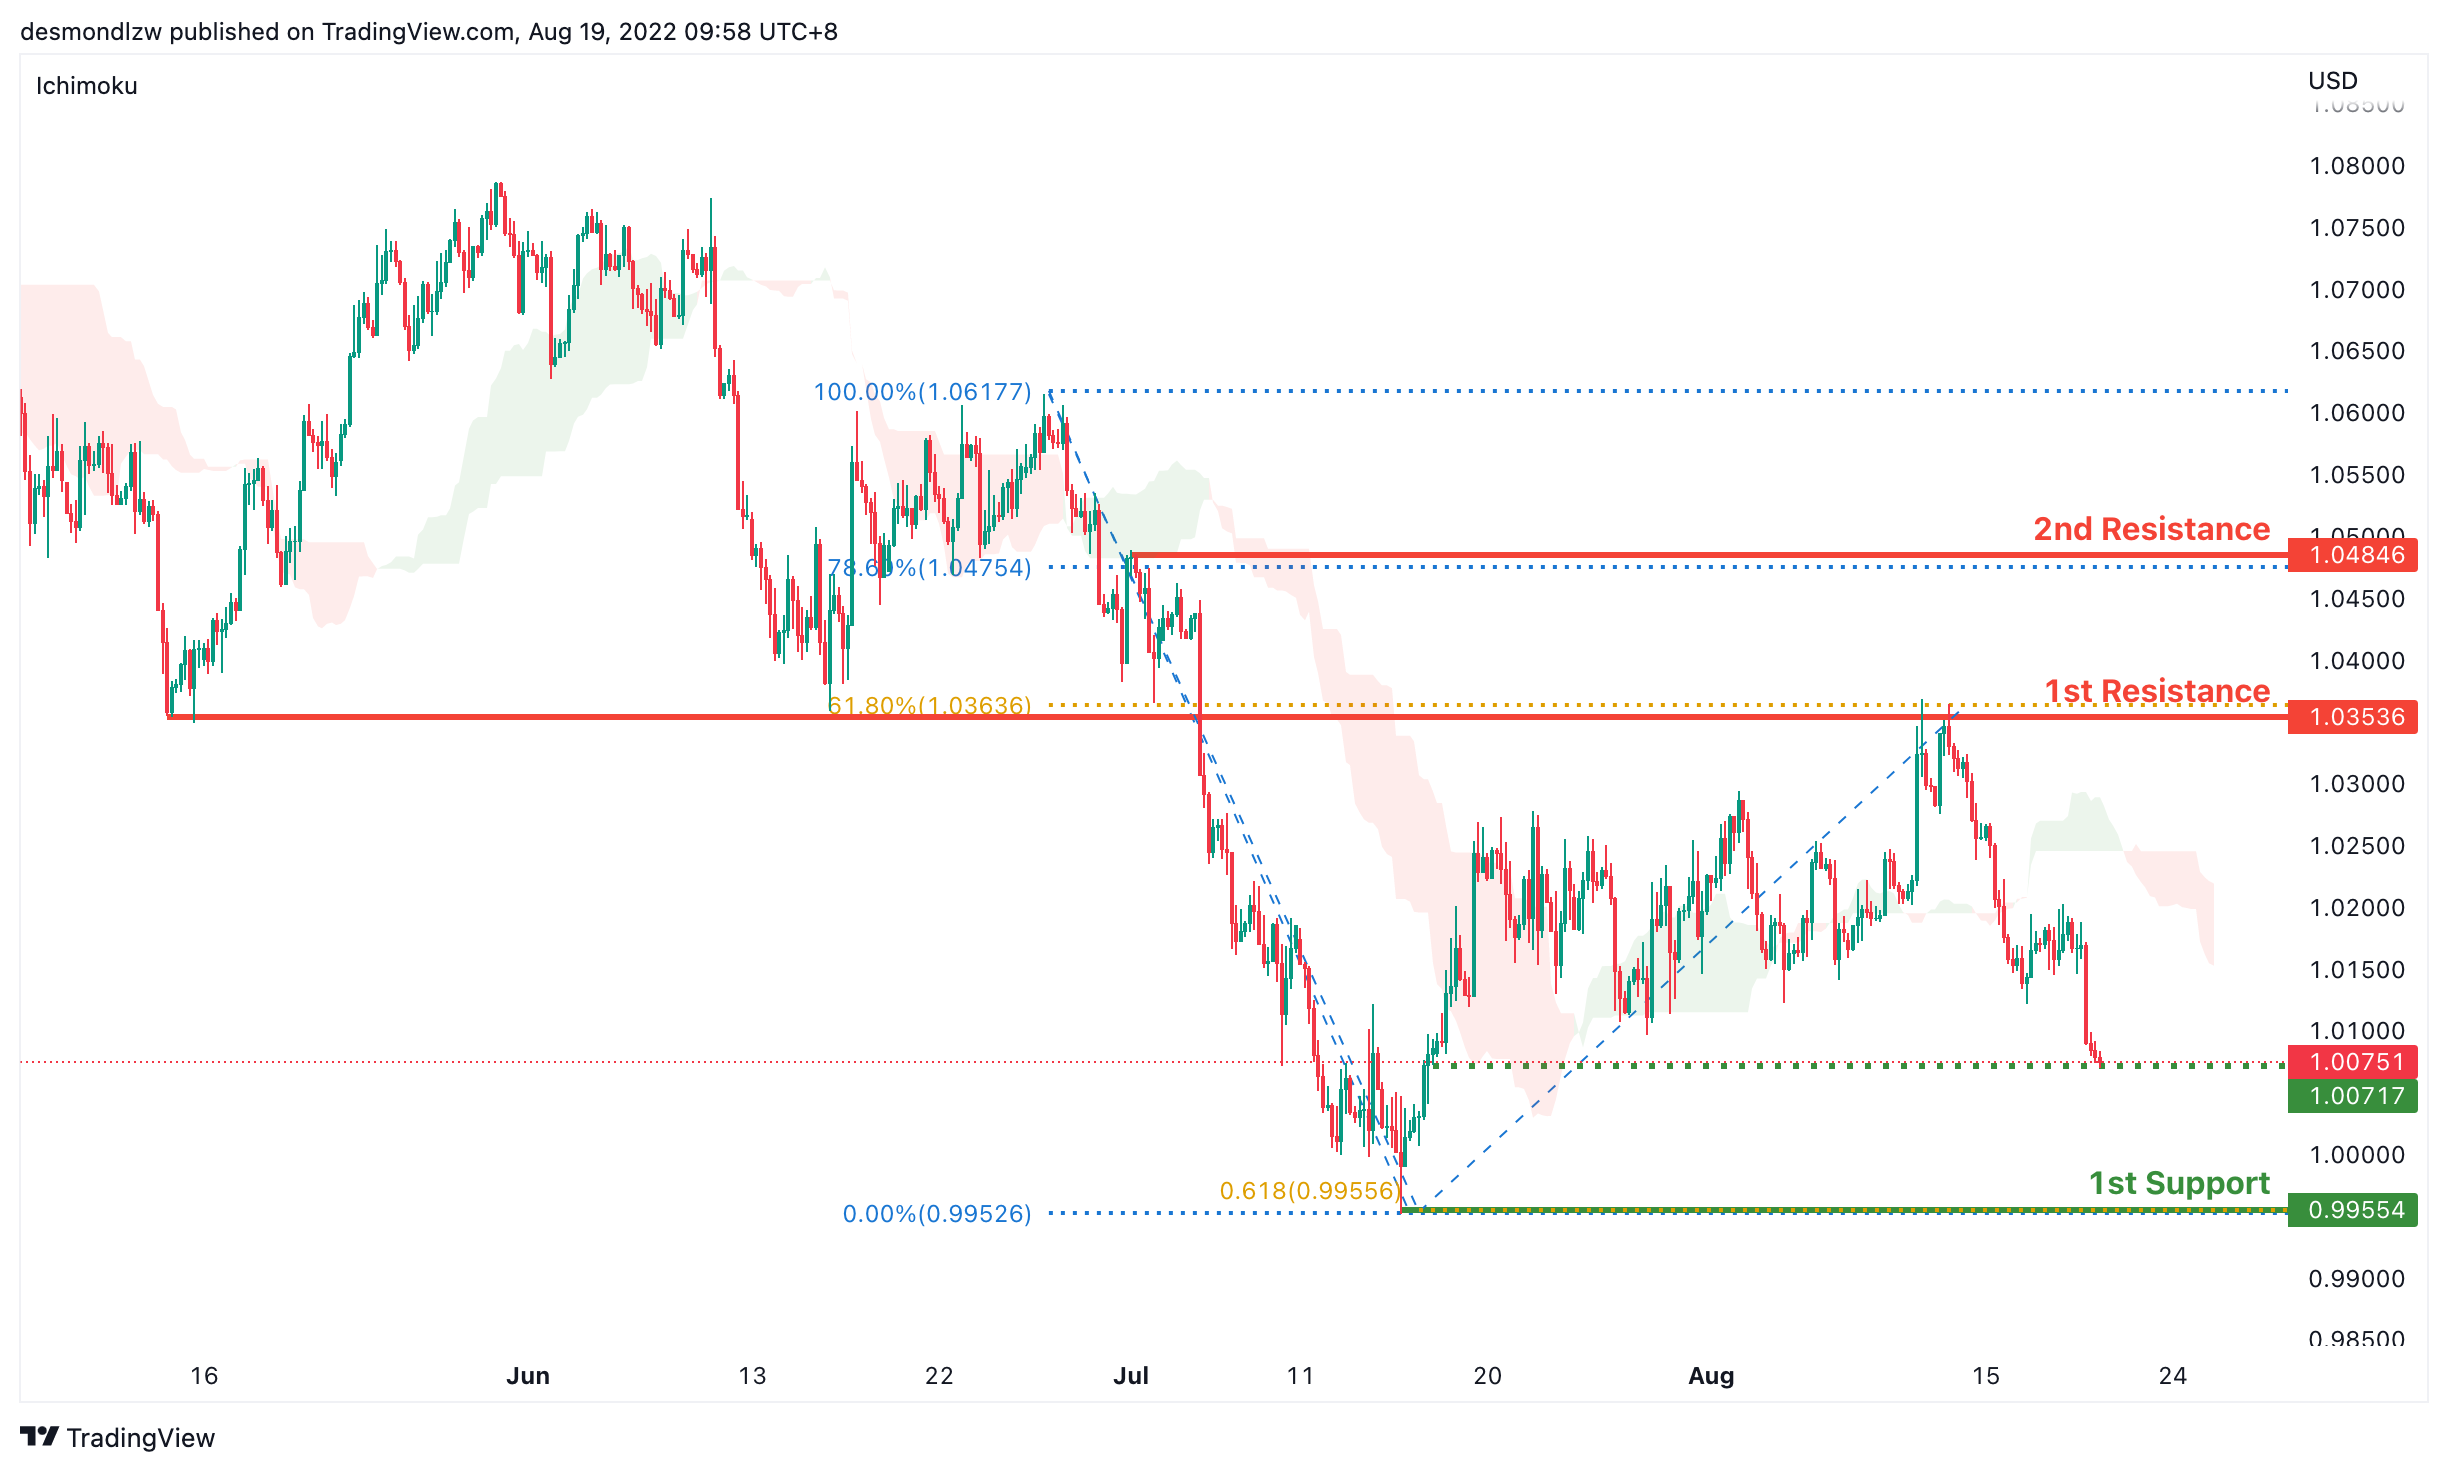
On the H4, prices have broken the ascending trend and are below the ichimoku indicator, we are bearish bias. Prices have ascended slightly but we’re looking for a pull back to test the first support at 1.0108 where the 61.8% Fibonacci retracement sits. If prices continue in the bearish momentum, it will test the second support at 0.9948. Alternatively price could go back to test the first resistance at 1.0363 where the 61.8% Fibonacci retracement sits and then the second resistance at 1.0465
Areas of consideration :
- H4 1st resistance at 1.0363
- H4 1st support at 1.0108
GBP/USD:
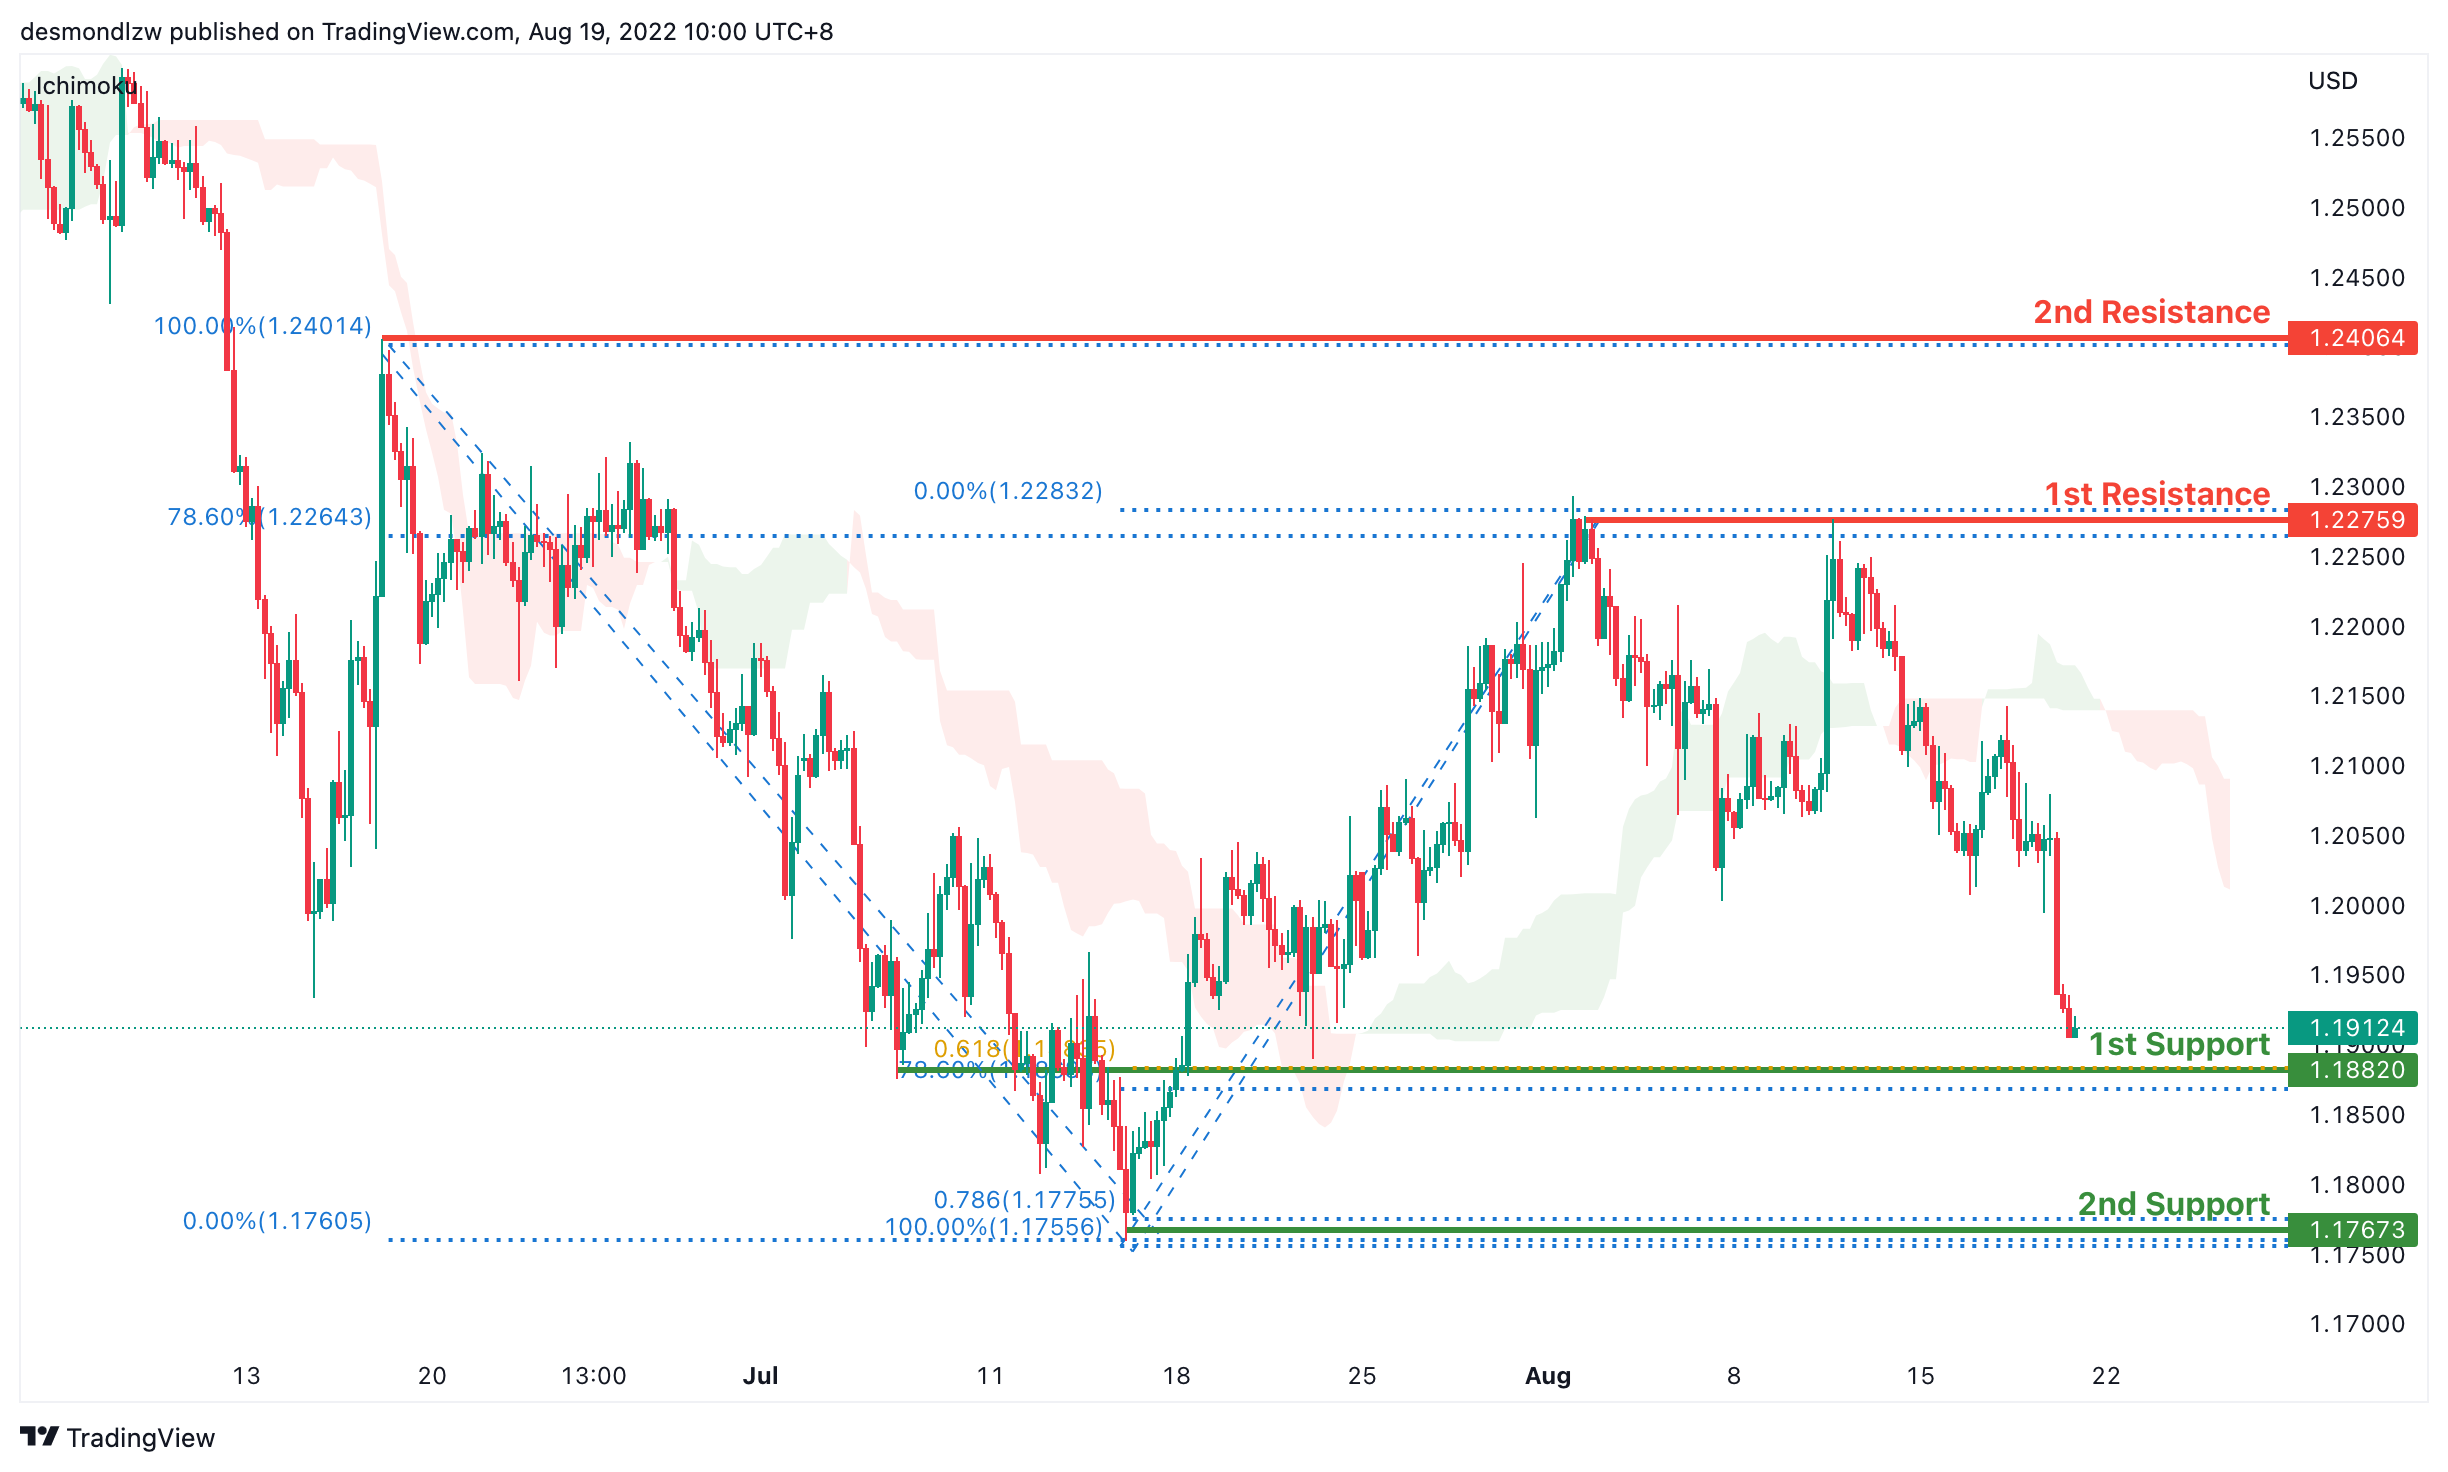
On the H4, prices seem to be in a bearish momentum. It is currently testing the 50% Fibonacci retracement and if the bearish momentum continues, it will pull prices to our first support 1.2025 where our swing low sits. If prices pull back further it will test the second support at 1.1767 where our 78.6% Fibonacci projection sits. Alternatively price could hit resistance at 1.2275 around the 78.6% projection and the first resistance at 1.2403 where the swing high sits
Areas of consideration:
- H4 1st resistance at 1.2275
- H4 1st support at 1.2025
USD/CHF:
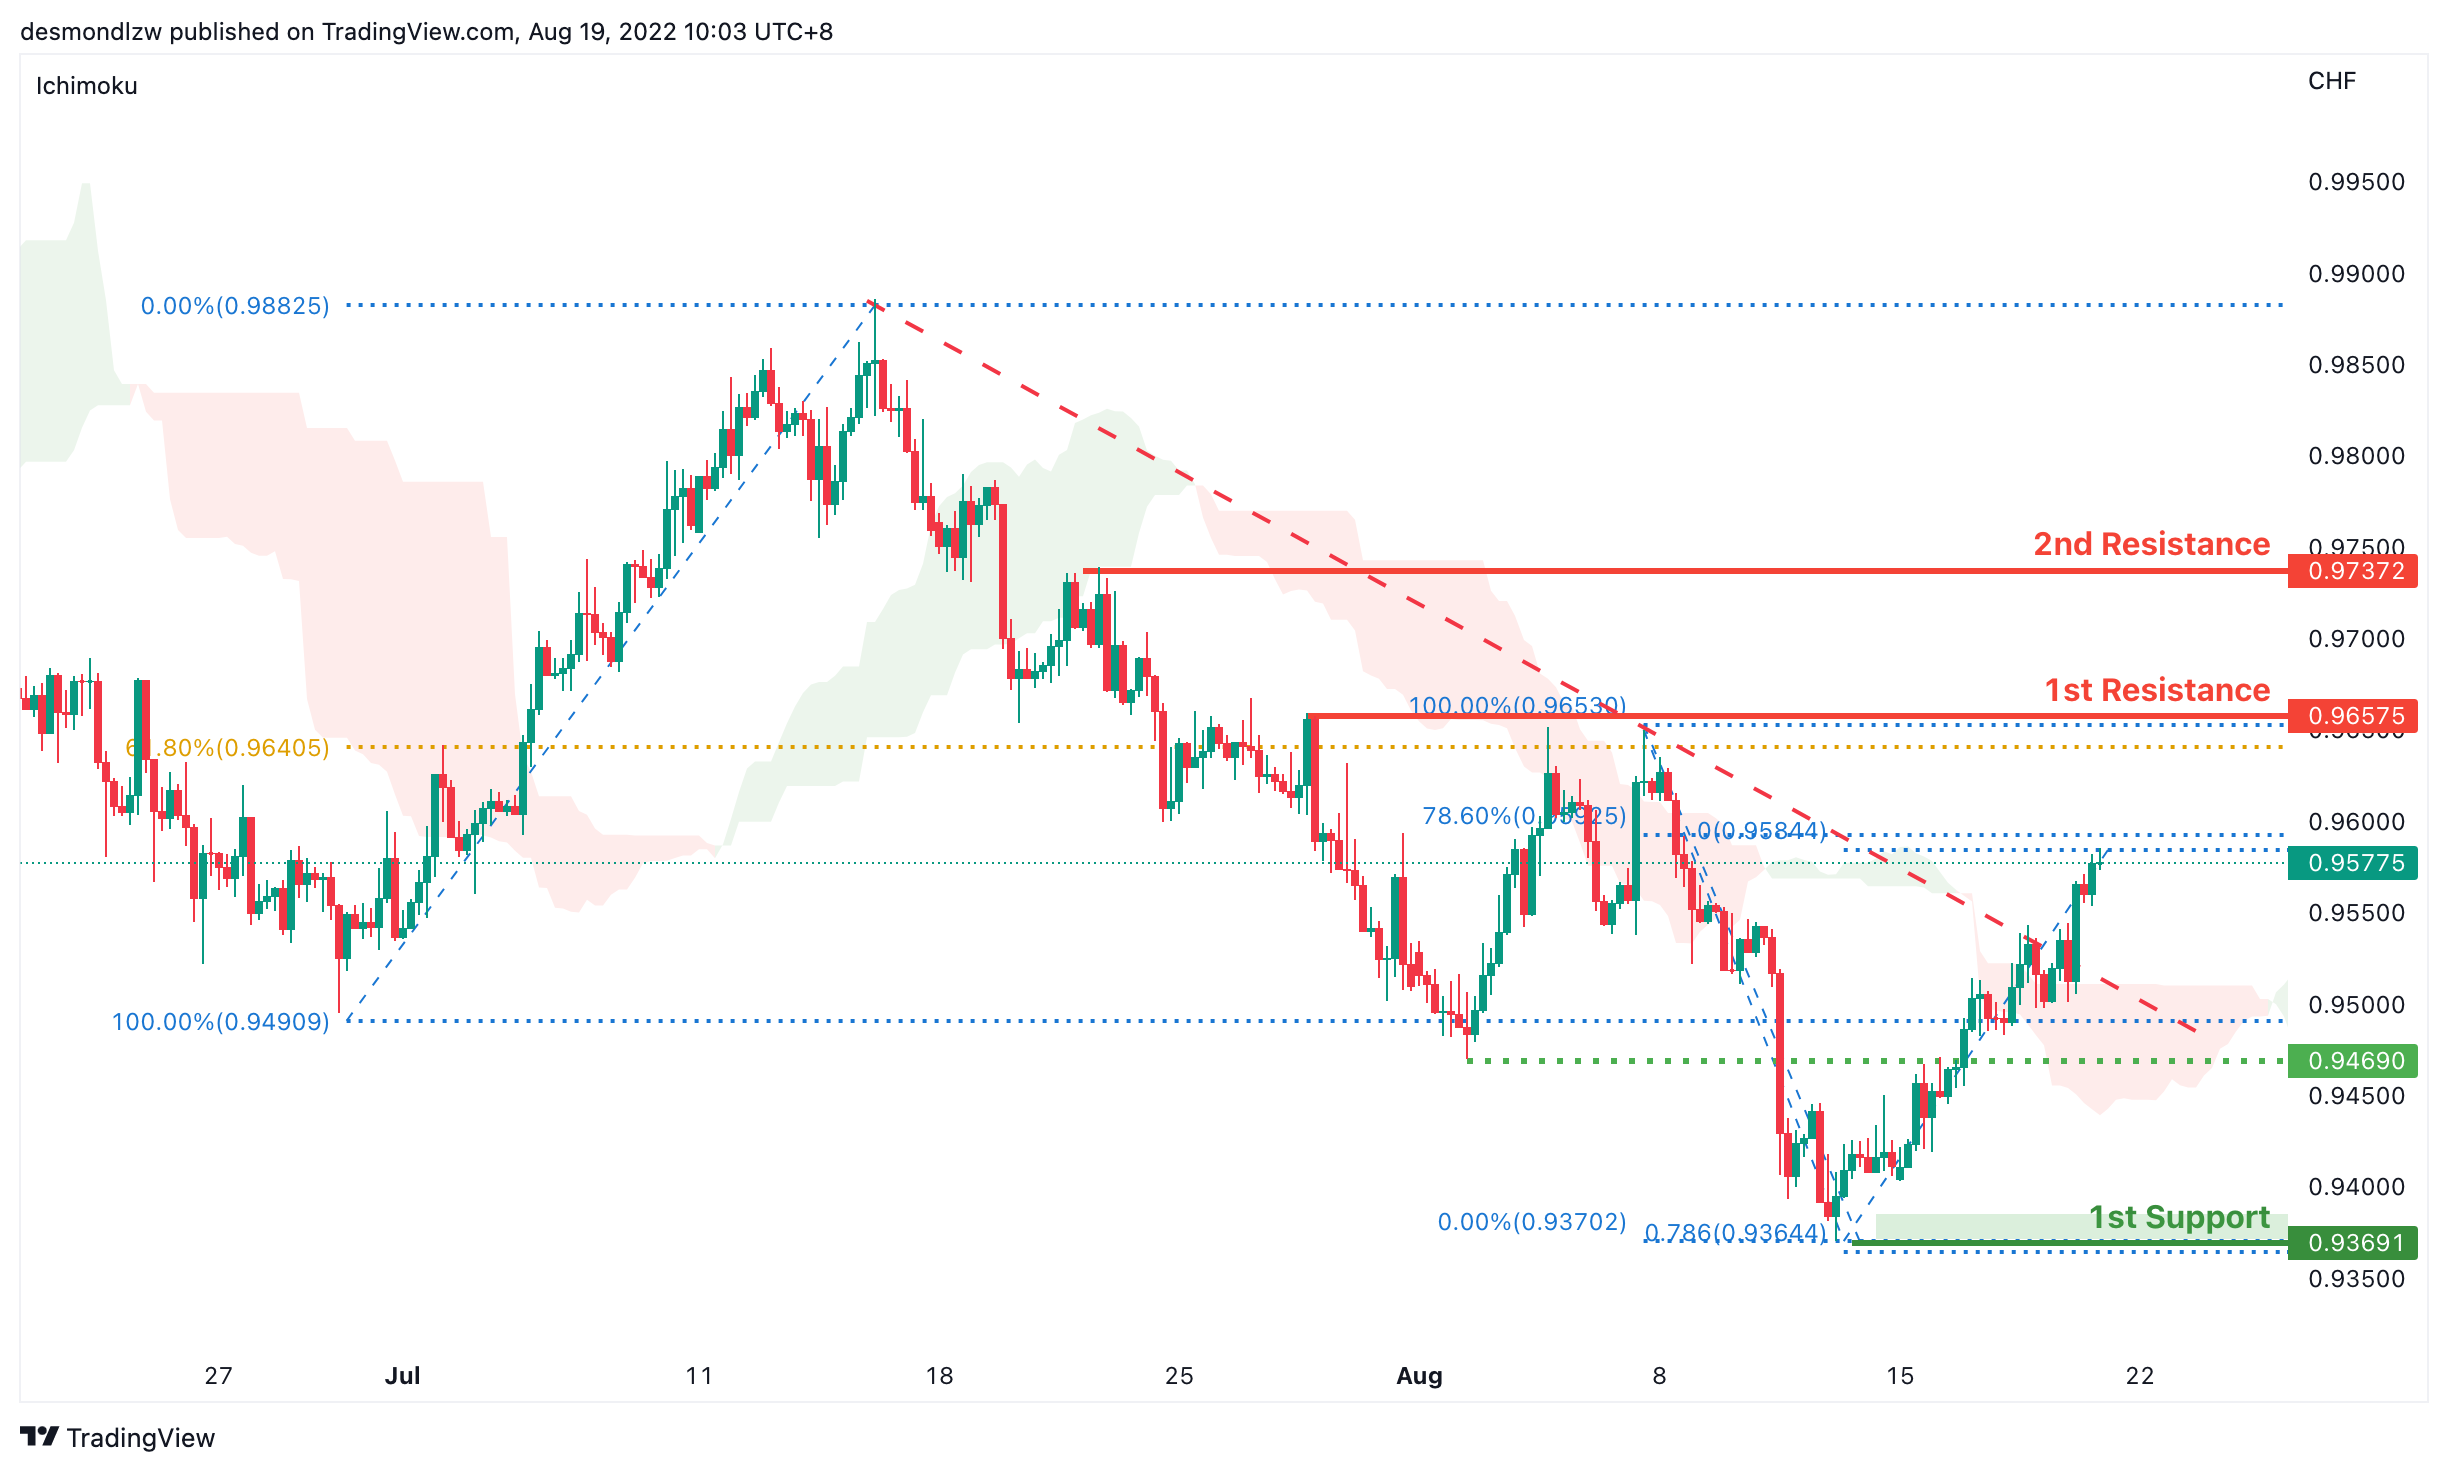
On the H4, with prices moving below the ichimoku cloud and along the descending trend, we are bearish bias that the price will continue with the bearish momentum. Price is now testing at the 61.8%% Fibonacci retracement and it may rise to test the first resistance at 0.9542 again. If bearish momentum continues, it should pull back to test at the intermediate support at 0.9468 where the previous swing low is then the first support at 0.9369 where the 61.8% projection and 127.2% extension sits
Areas of consideration
- H4 1st support at 0.9369
- H4 1st resistance at 0.9542
XAU/USD (GOLD):
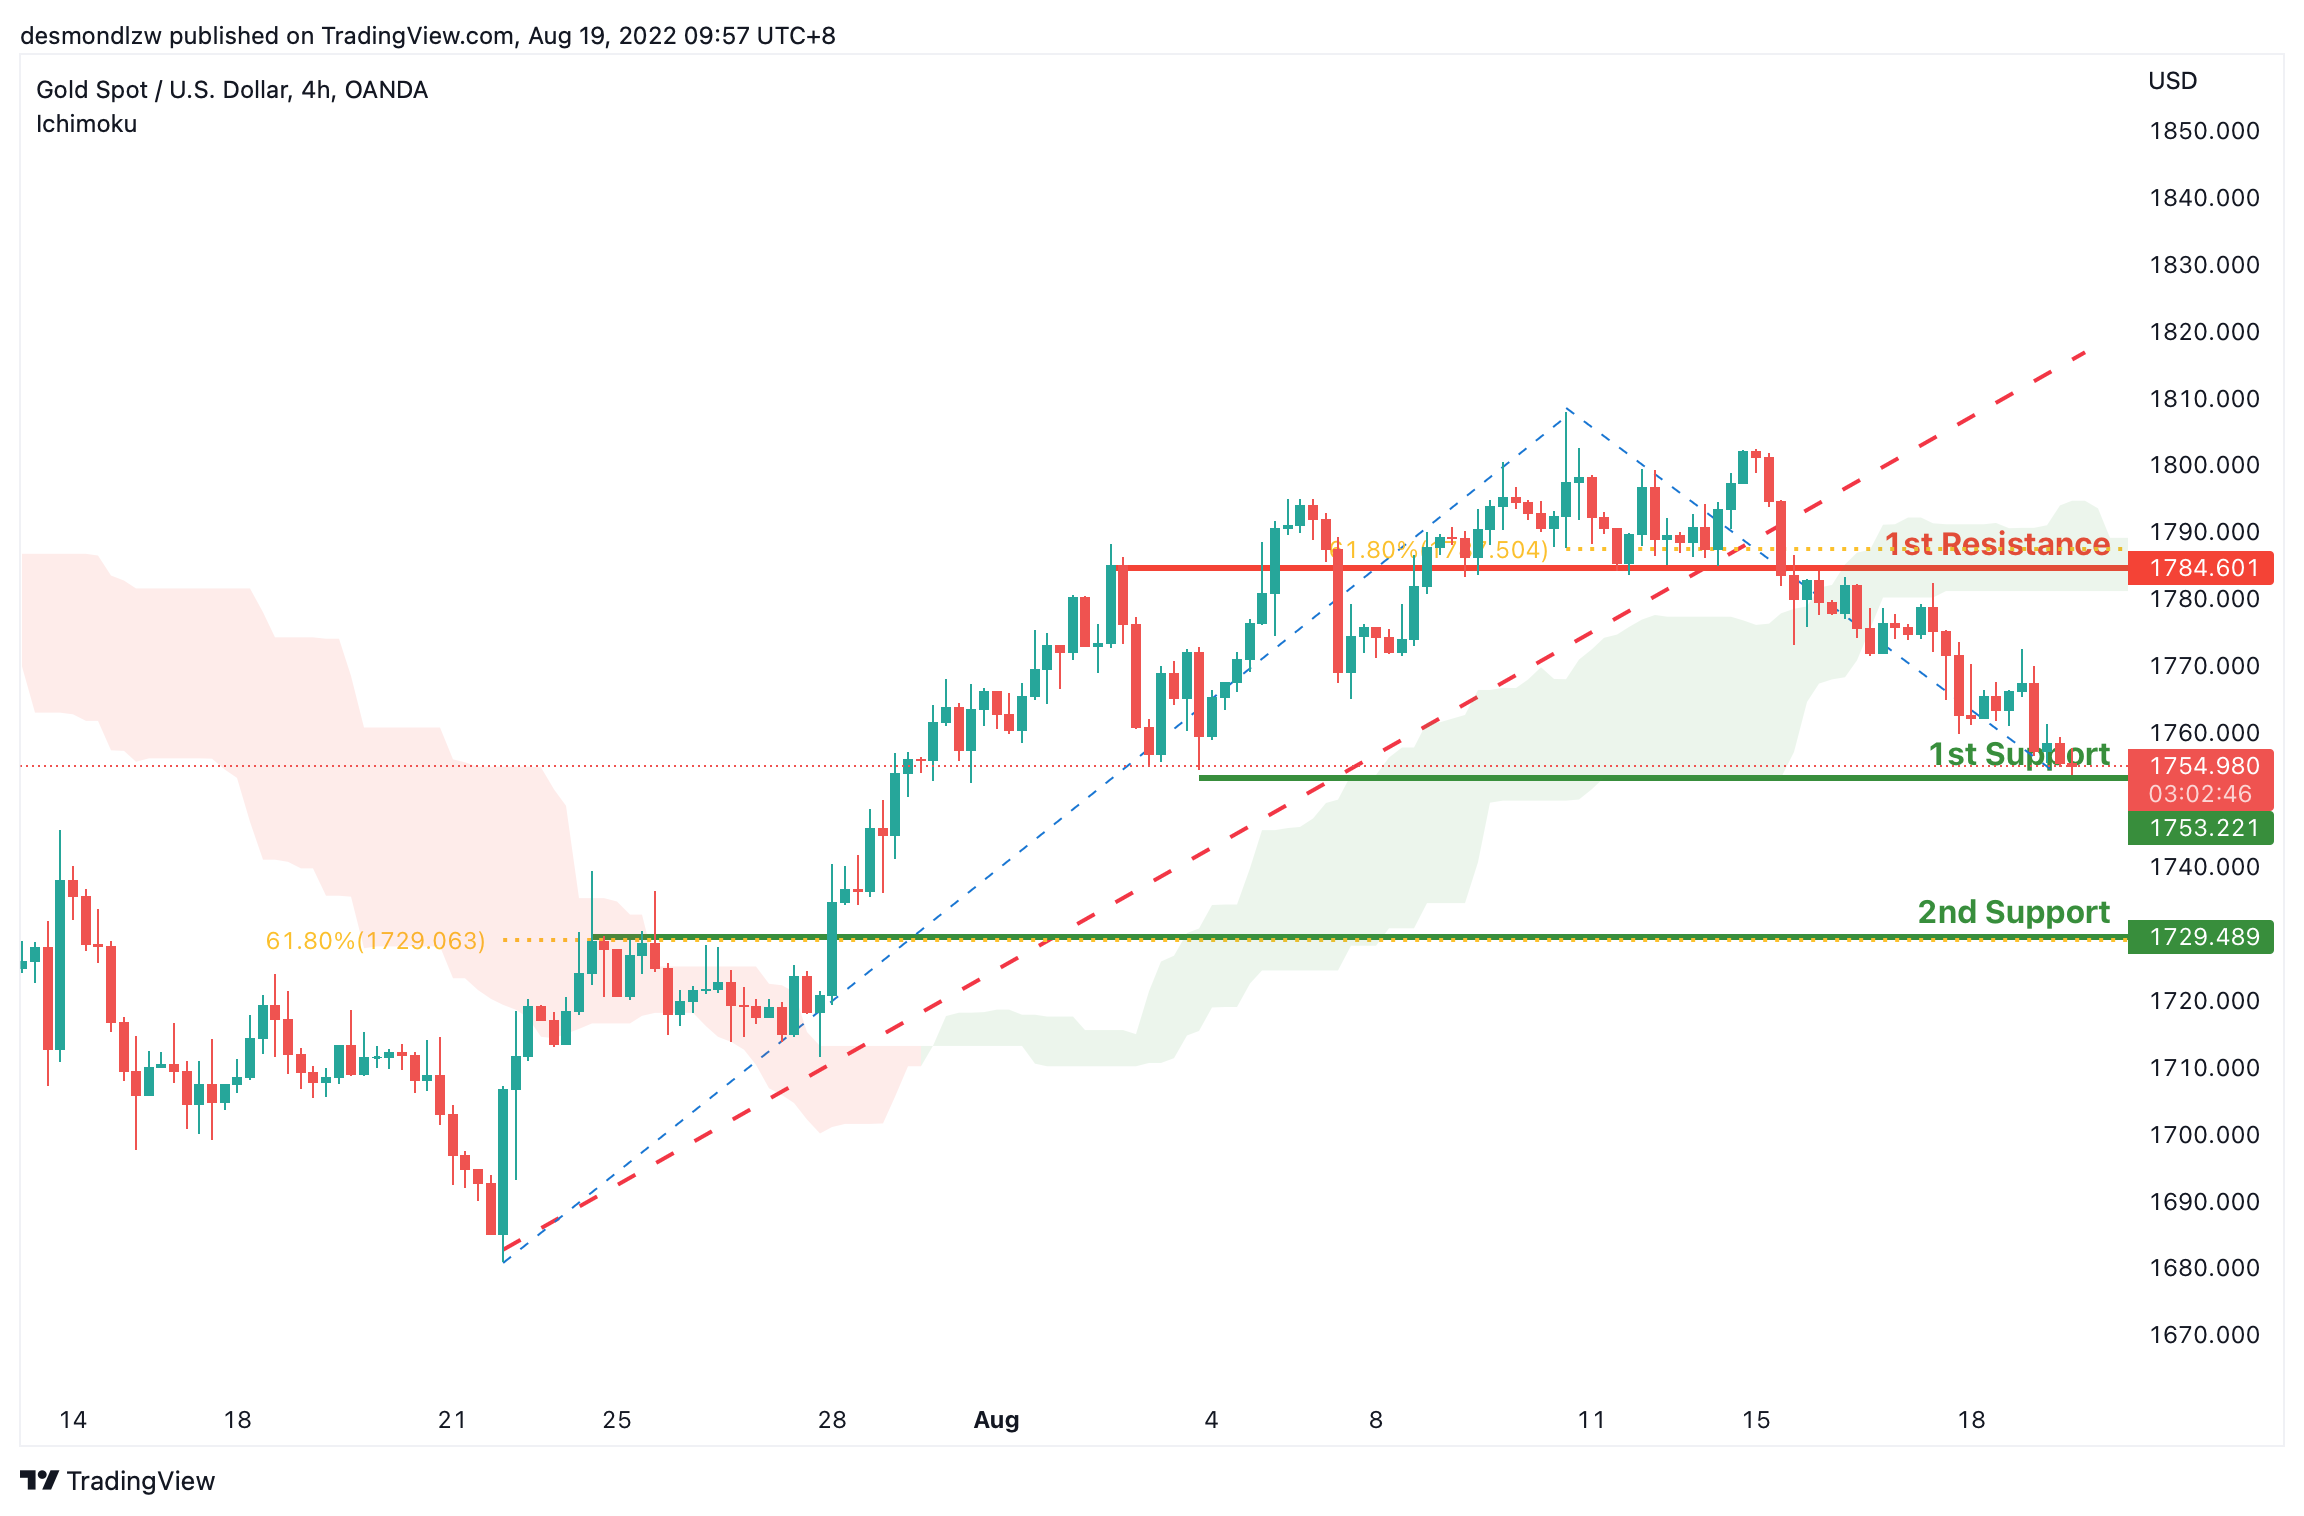
On the H4, with prices breaking the ascending and below ichimoku cloud, we have a bearish bias that the price may drop from the 1st support at 1754.980, which is in line with the overlap support to the 2nd support at 1729.489, which is in line with the pullback support and 61.8% fibonacci retracement. Alternatively, the price may rise to the 1st resistance at 1784.601, which is in line with the 61.8% fibonacci retracement and overlap resistance.
Areas of consideration:
- H4 time frame, 1st support at 1754.98
- H4 time frame, 2nd support at 1729.489
AUD/USD:
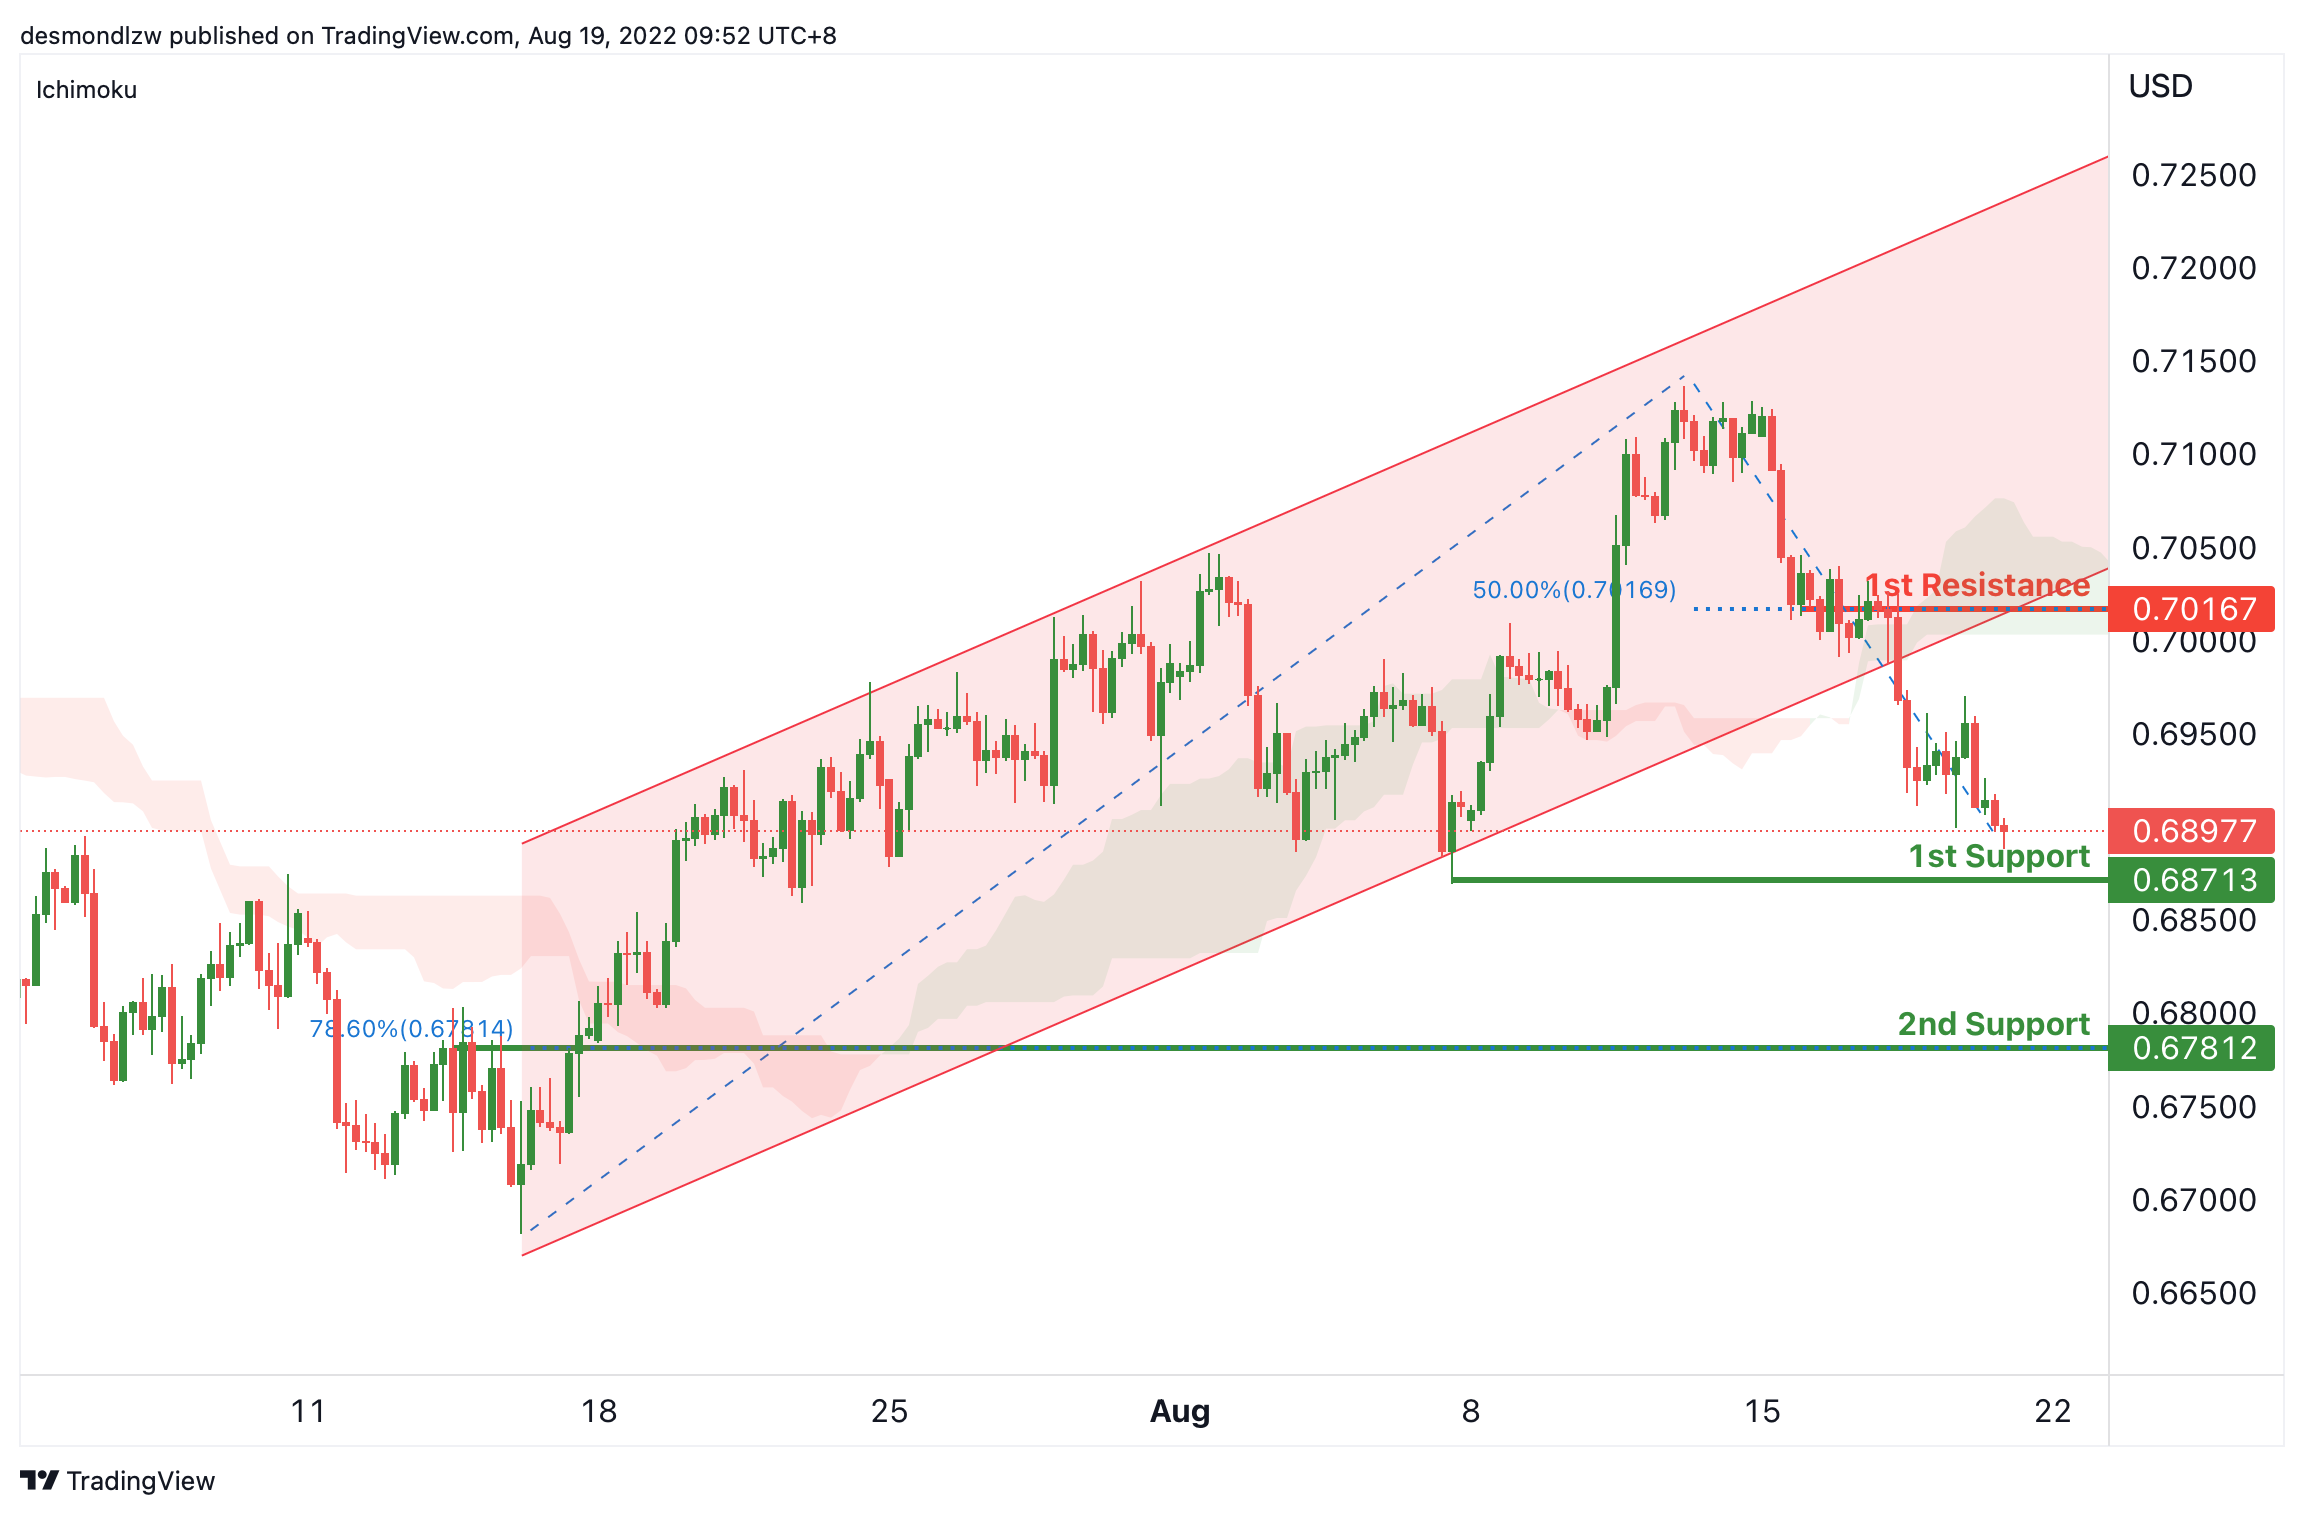
On the H4, with the the price breaking the ascending channel and below the ichimoku cloud, we have a bearish bias that price may drop to the 1st support at 0.68713, where the swing lows is to the 2nd support at 0.67812, which is in line with the 78.6% fibonacci retracement. Alternatively, the price may rise to the 1st resistance at 0.70167 which is in line with 50% fibonacci retracement.
Areas of consideration
- H4 1st support at 0.68713
- H4 2nd support at 0.67812
NZD/USD:
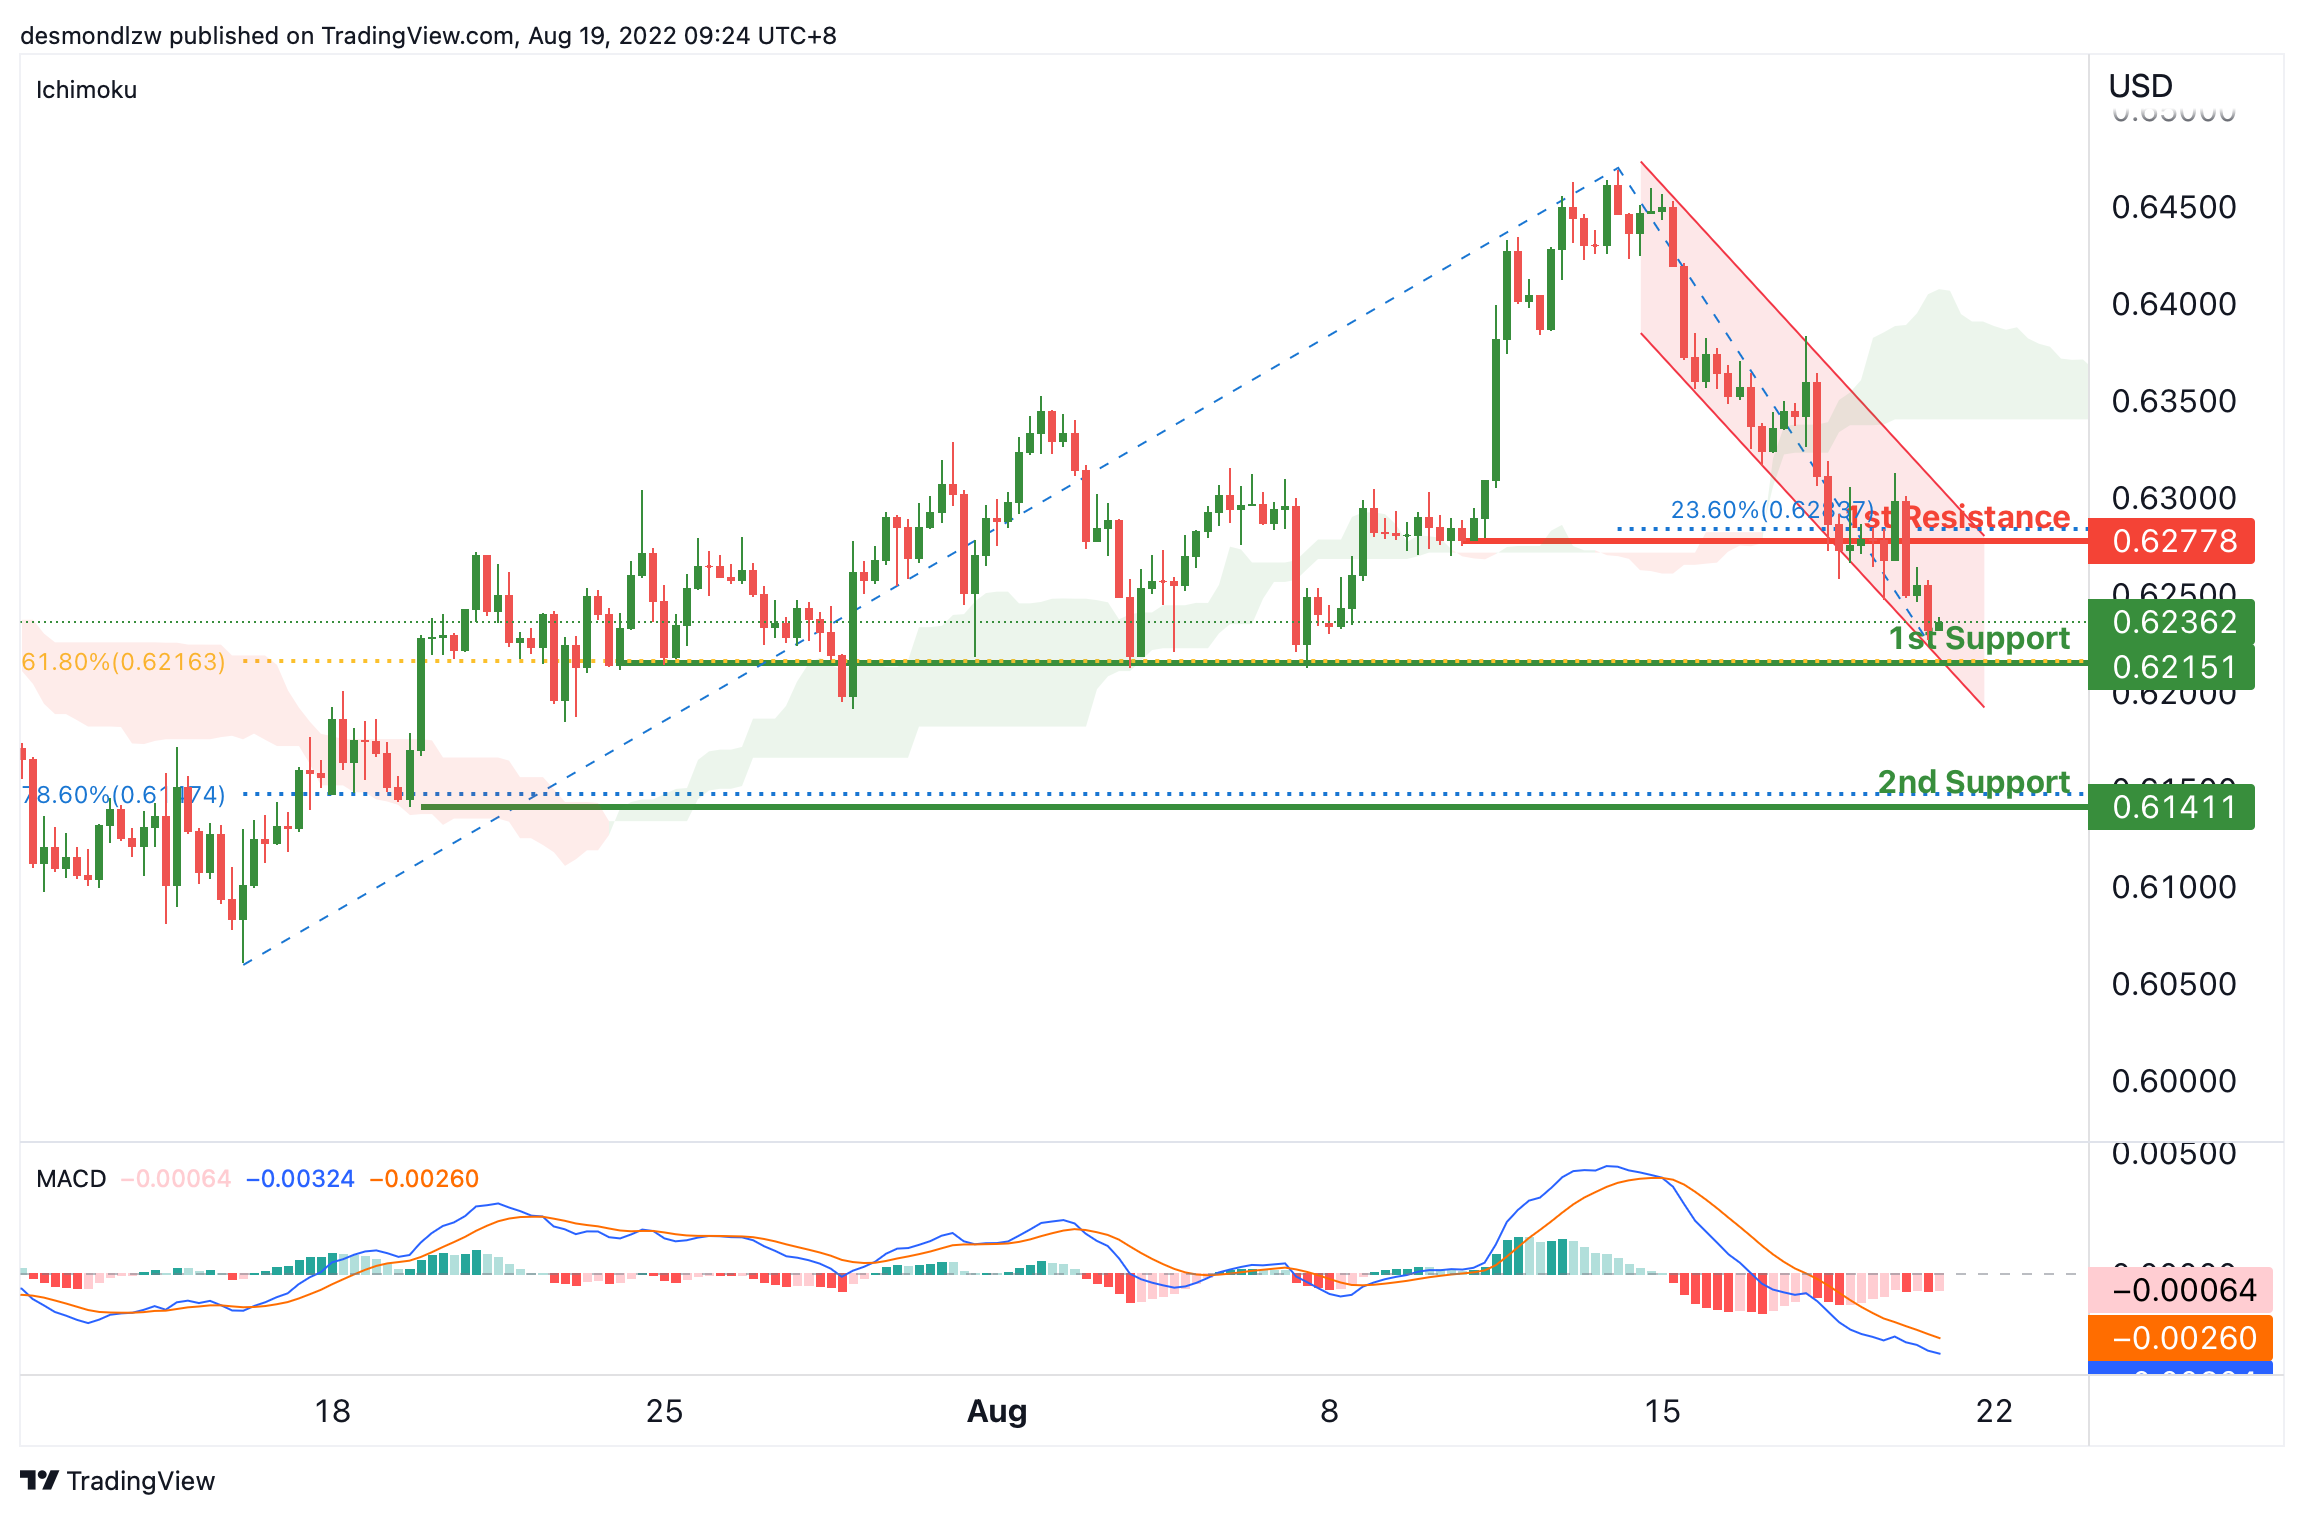
On the H4, with the price moving within the descending channel, below ichimoku cloud and MACD indicators are below zero, we have a bearish bias that the price may drop from the 1st support at 0.62362, which is in line with the 61.8% fibonacci retracement and pervious swing lows to the 2nd support at 0.61411, which is in line with the swing low and 78.6% fibonacci retracement. Alternatively, the price may rise to the 1st resistance at 0.62778, where the 23.6% fibonacci retracement is.
Areas of consideration:
- H4 time frame, 1st support at 0.6236
- H4 time frame, 2nd support at 0.61411
USD/CAD:
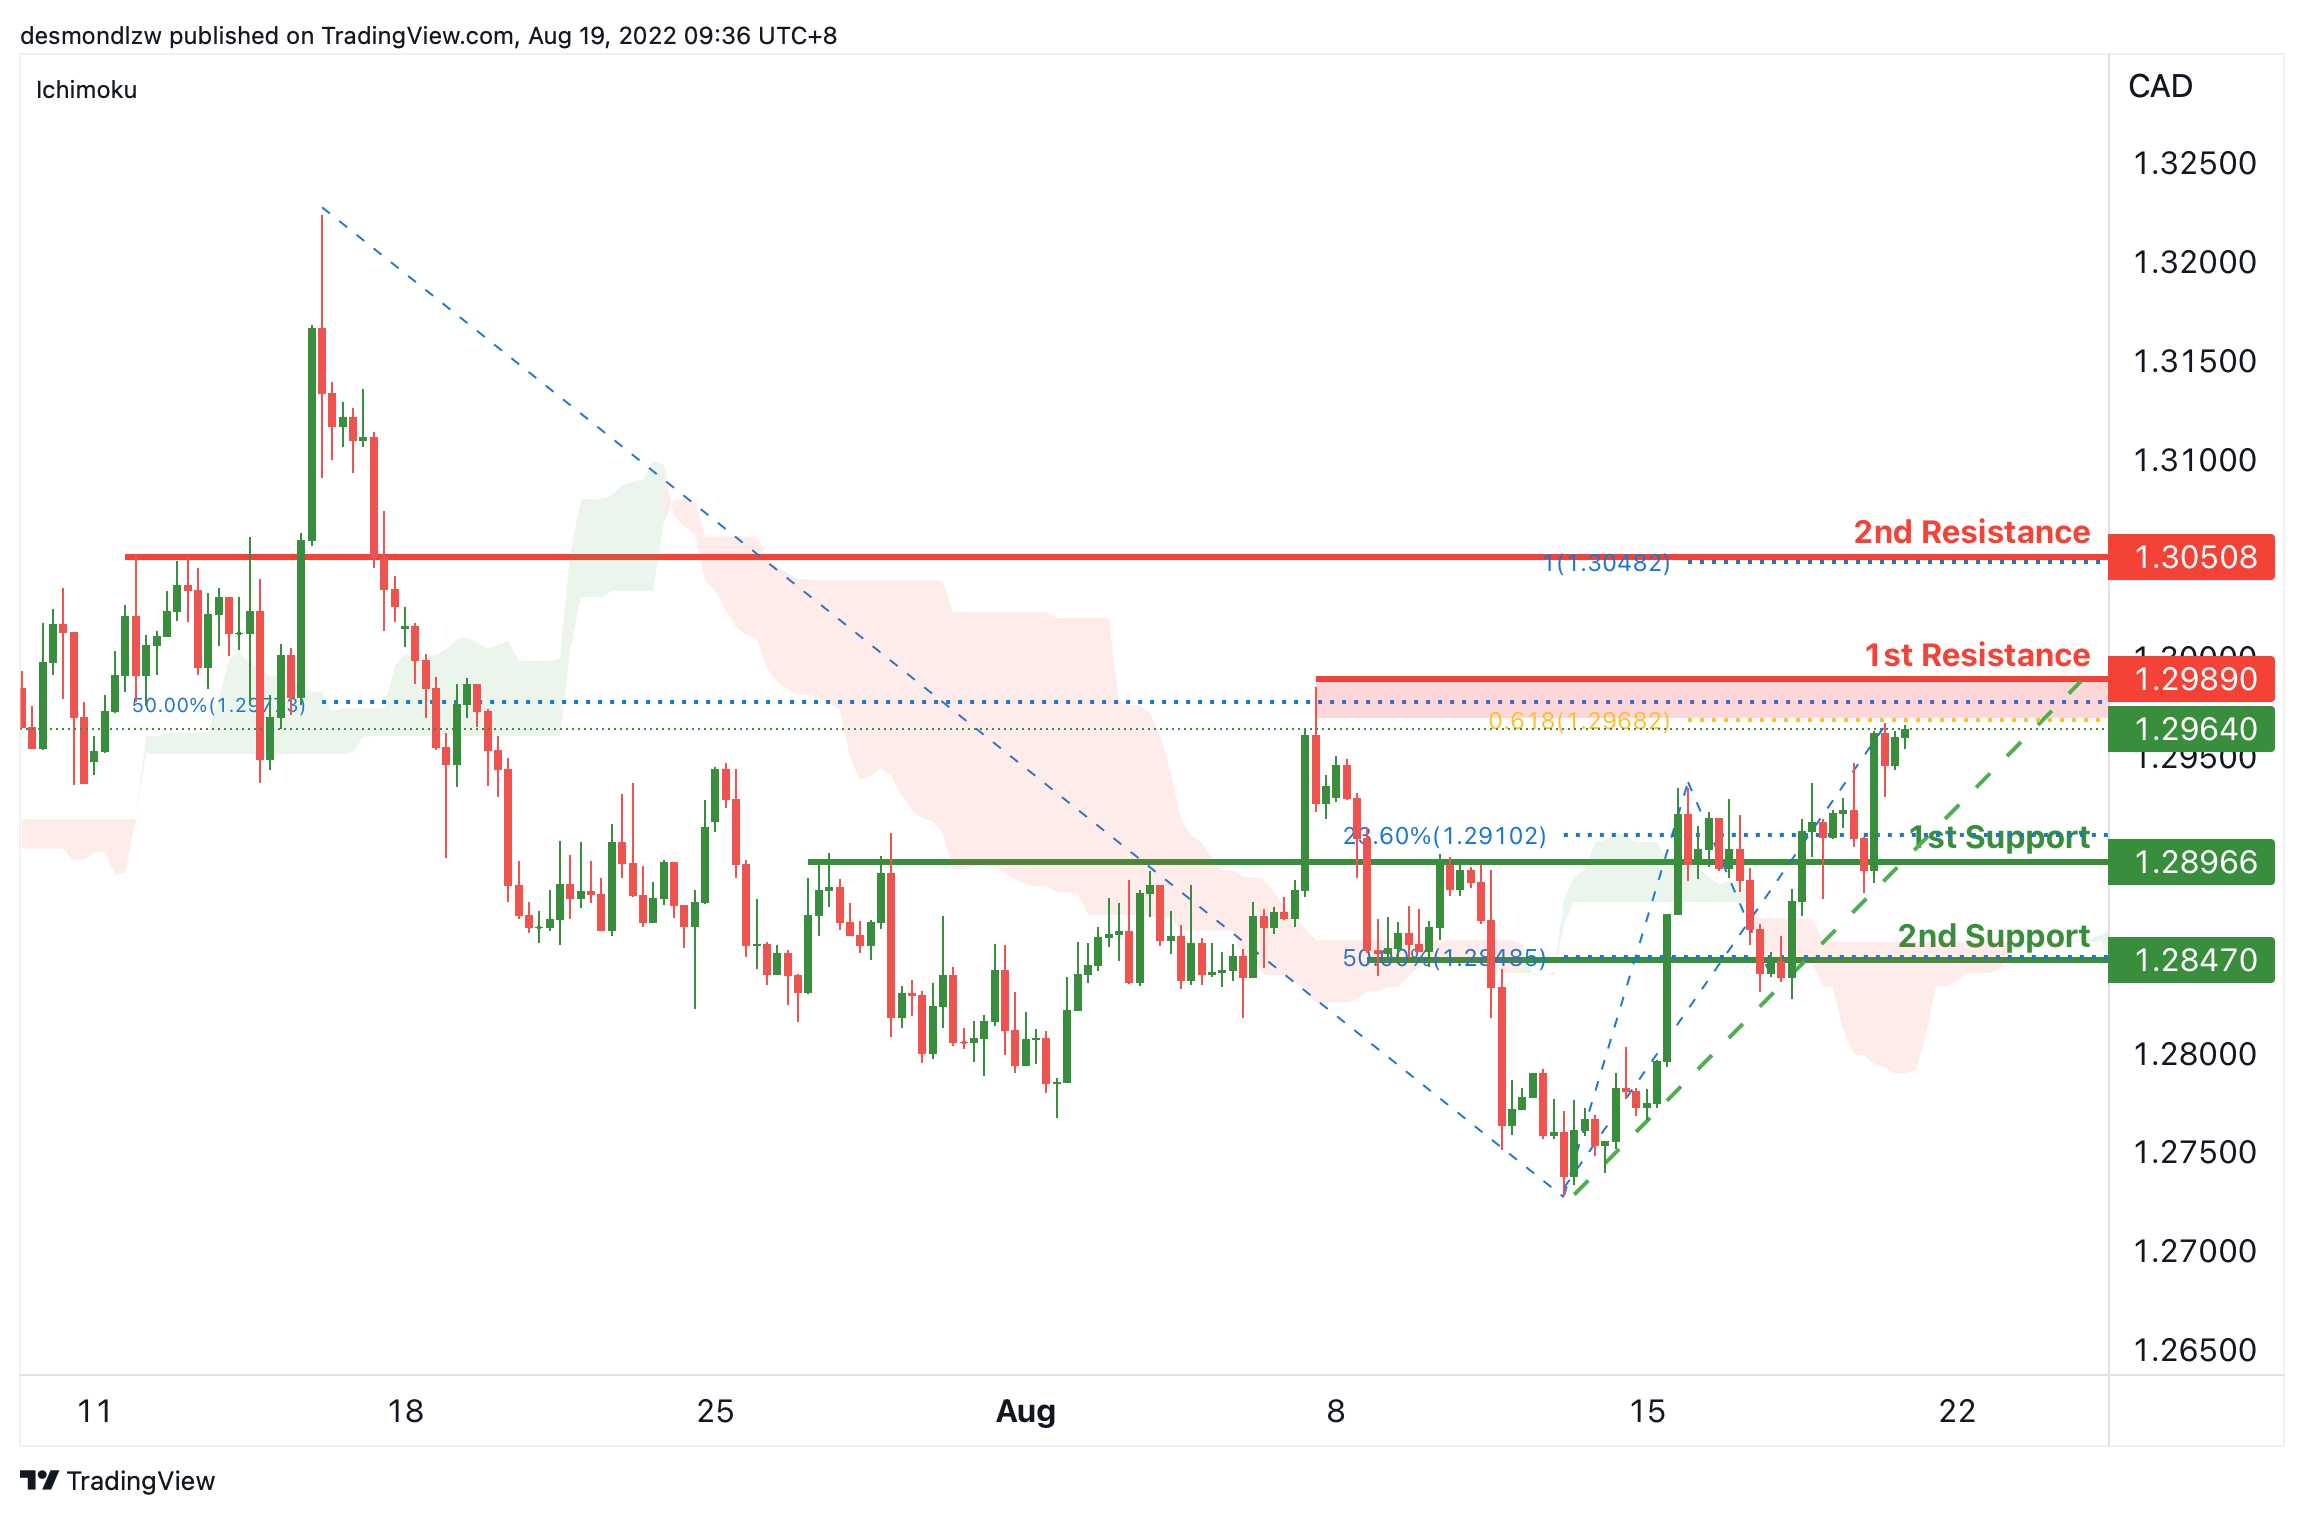
On the H4, with the price moving within the ascending trendline and above the ichimoku cloud, we have a bullish bias that the price may rise to the 1st resistance at 1.29890, where the swing high, 61.8% fibonacci projection, 50% fibonacci retracement are. If the price breaks the 1st resistance, we can expect the price to rise to the 2nd resistance at 1.30508, which is in line with the 100% fibonacci projection and previous swing highs. Alternatively, the piece may drop to the 1st support at 1.28966, where the current swing low, previous swing highs and 23.6% fibonacci retracement are. IF the price breaks the 1st support, we can expect the price drop down to the 2nd support at 1.28470, which is in line with the swing low and 50% fibonacci retracement.
Areas of consideration:
- H4 time frame, 1st resistance at 1.29890
- H4 time frame, 2nd resistance at 1.30508
OIL:
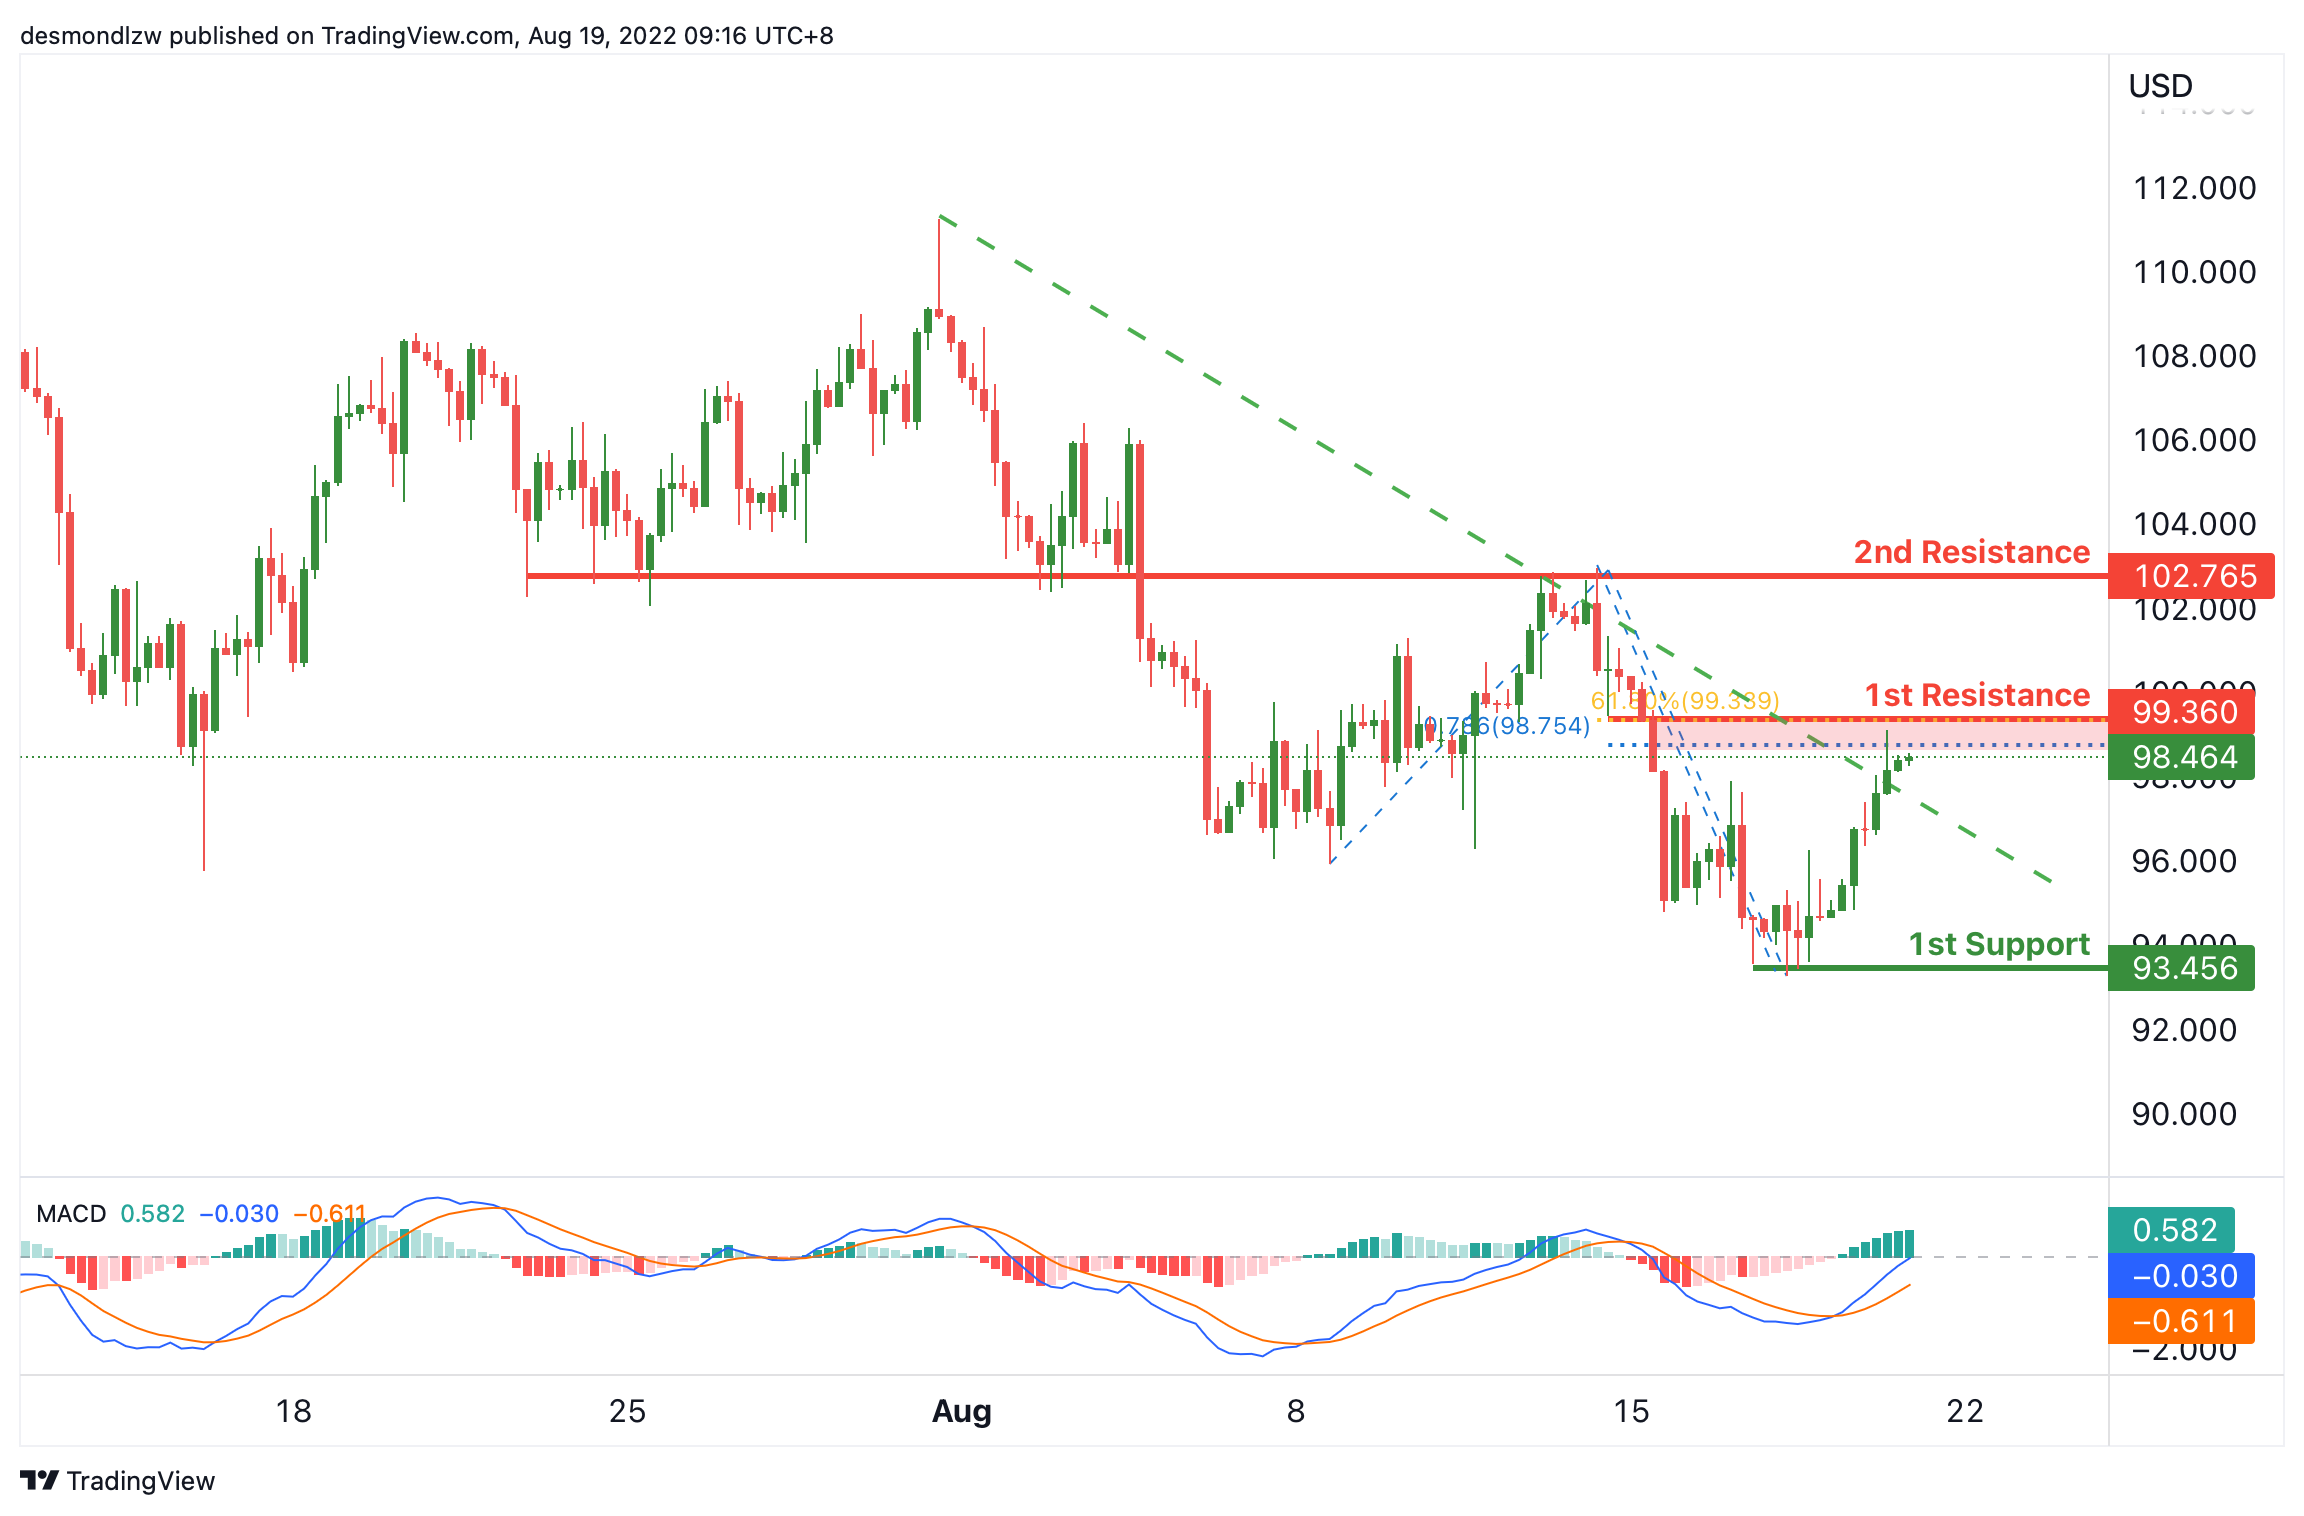
On the H4, with price breaking the descending channel and DIF line is breaking zero, if the price break the 1st resistance at 99.360, which is in line with the 61.8% fibonacci retracement, 78.6% fibonacci projection, we can expect the price rise to the 2nd resistance at 102.765, which is in line with the overlap resistance. Alternatively, the price may drop to the descending trendline and go down to the 1st support at 93.456, which is in line with the swing low.
Areas of consideration:
- H4 time frame, 1st resistance at 99.360
- H4 time frame, 2nd resistance at 102.765
Dow Jones Industrial Average:
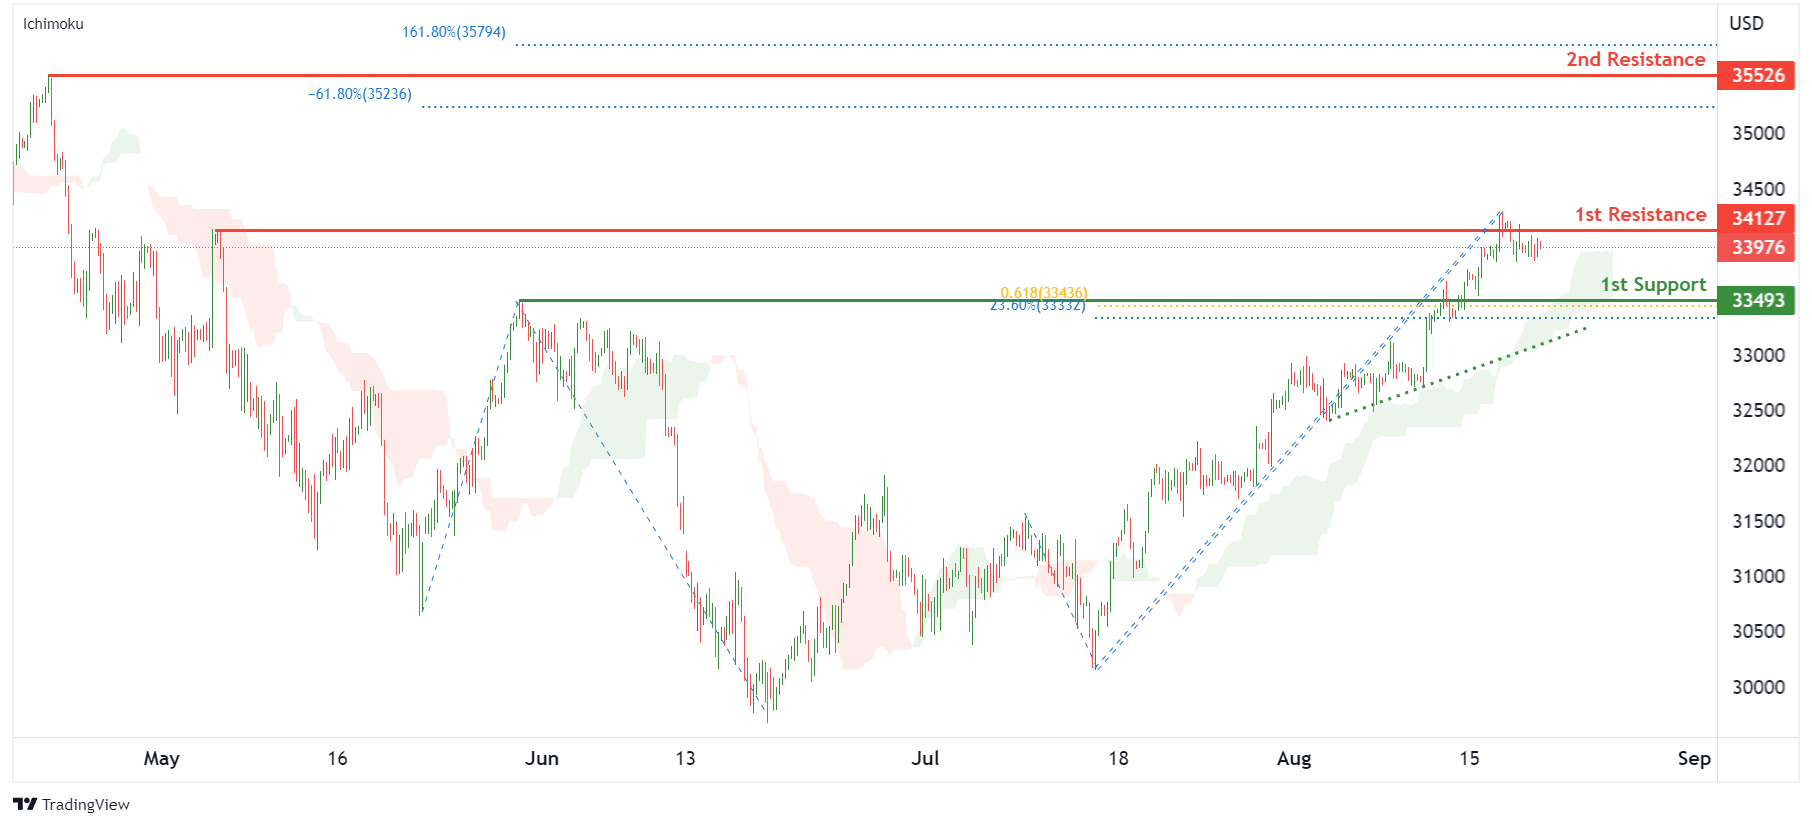
On the H4, with price moving above the ichimoku indicator and along an ascending trendline, we have a bullish bias that price will rise to 1st resistance at 34127 where the pullback resistance is. Once there is upside confirmation that price has broken 1st resistance structure, we would expect bullish momentum to carry price to 2nd resistance at 35526 where the swing high resistance, 161.8% fibonacci extension and -61.8% fibonacci expansion are. Alternatively, price could drop to 1st support at 33493 where the pullback support, 61.8% fibonacci projection and 23.6% fibonacci retracement are.
Areas of consideration:
- H4 time frame, 1st resistance of 34127
- H4 time frame, 1st support at 33493
DAX:
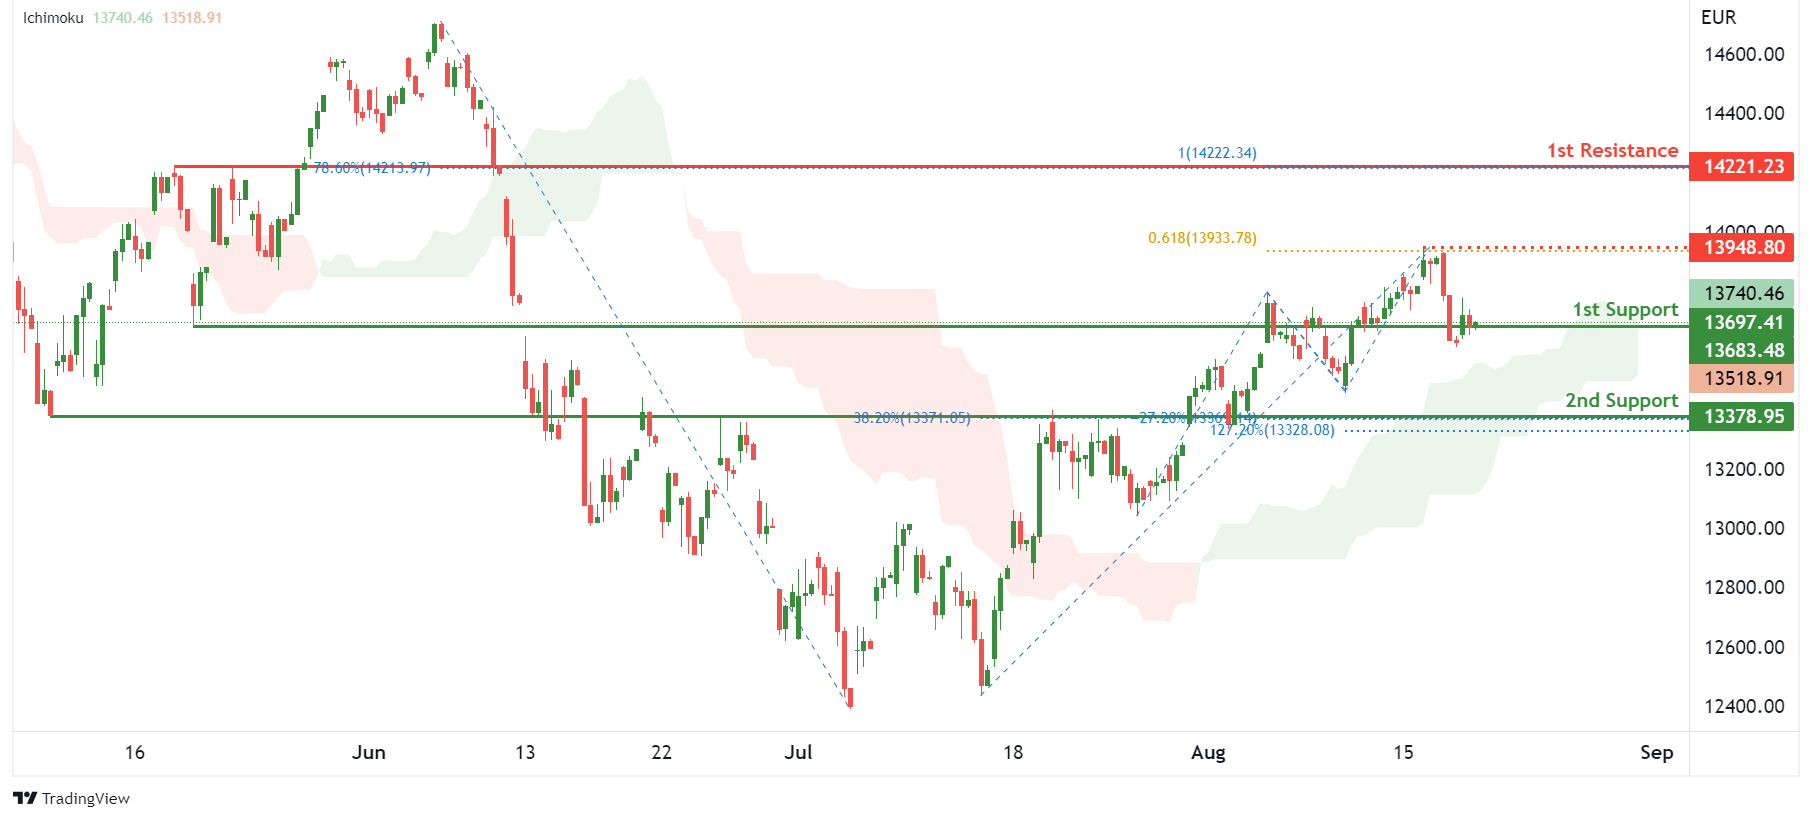
On the H4, with price moving above the ichimoku indicator, we have a bullish bias that price will rise to the 1st resistance at 13683.48 where the pullback resistance is. Once there is upside confirmation of price breaking the 1st resistance structure, we would expect price to rise to 2nd resistance at 14221.23 in line with 100% fibonacci projection and 78.6% fibonacci retracement. Take note of intermediate resistance at 13948.80 where the swing high resistance and 61.8% fibonacci projection are. Alternatively, price could drop to 1st support at 13378.95 where the overlap support, -27.2% fibonacci expansion, 127.2% fibonacci extension and 38.2% fibonacci retracement are
Areas of consideration:
- H4 time frame, 1st resistance of 13683.48
- H4 time frame, 1st support at 13378.95
ETHUSD:
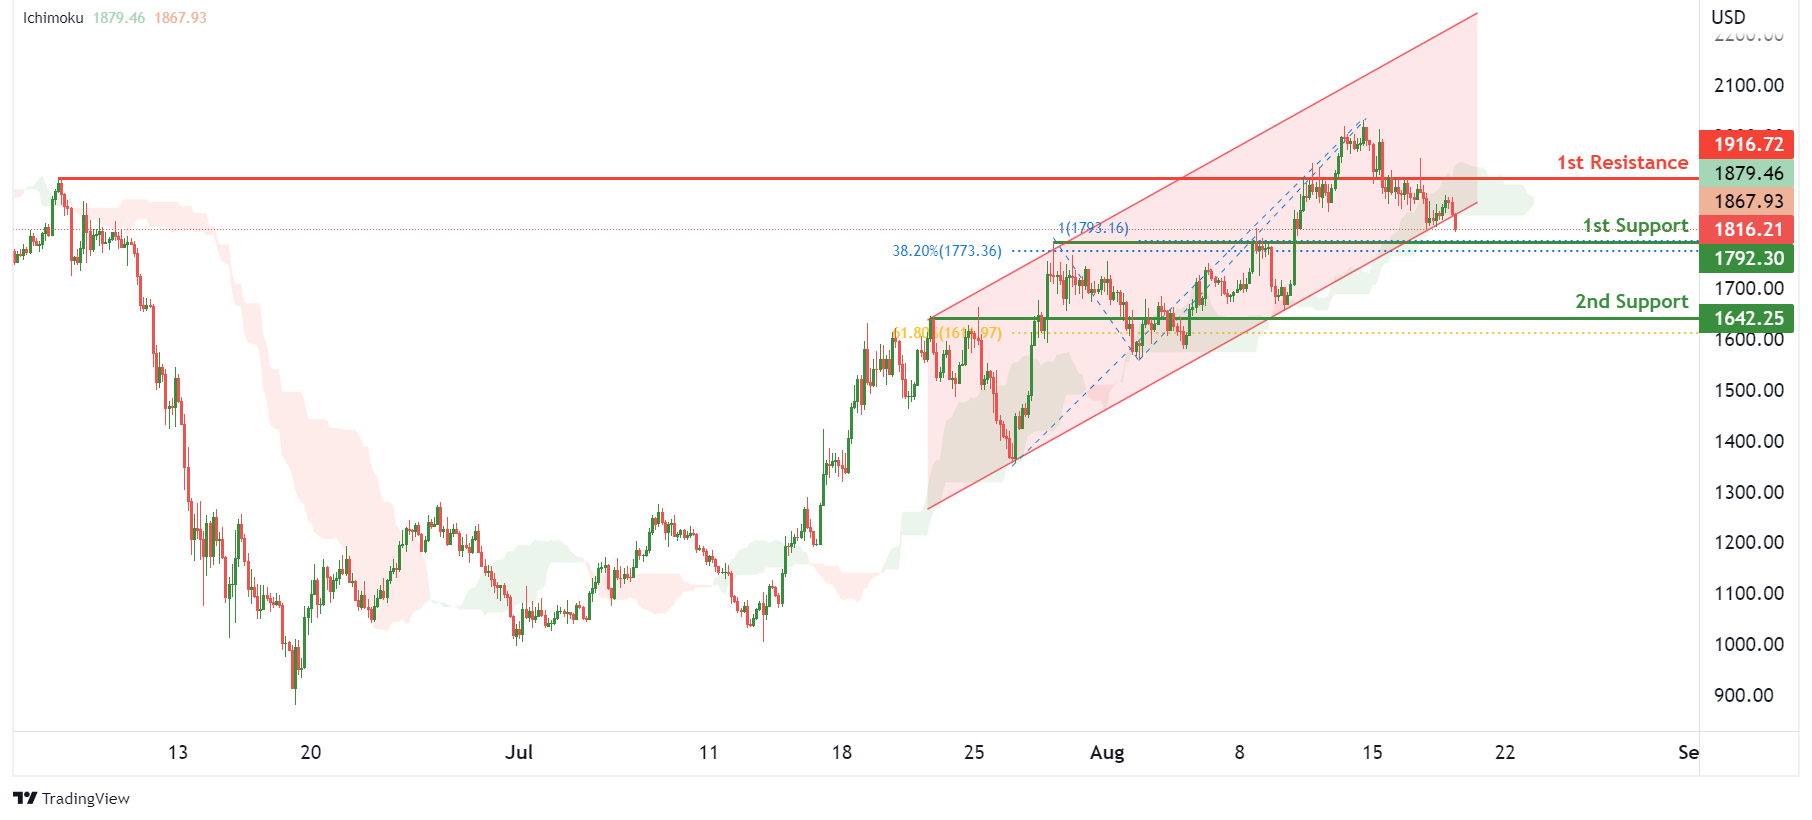
On the H4, with price moving within an ascending channel and bouncing off the ichimoku support, we have a bullish bias that price will rise to the 1st resistance at 1916.72 where the pullback resistance is. Once there is upside confirmation that price has broken 1st resistance structure, we would expect bullish momentum to carry price to 2nd resistance at 2015.54 where the swing high resistance is. Alternatively, price could drop to 1st support at 1792.30 where the overlap support, 38.2% fibonacci retracement and 100% fibonacci projection are.
Areas of consideration:
- H4 time frame, 1st resistance of 1916.72
- H4 time frame, 1st support at 1792.30
BTCUSD:
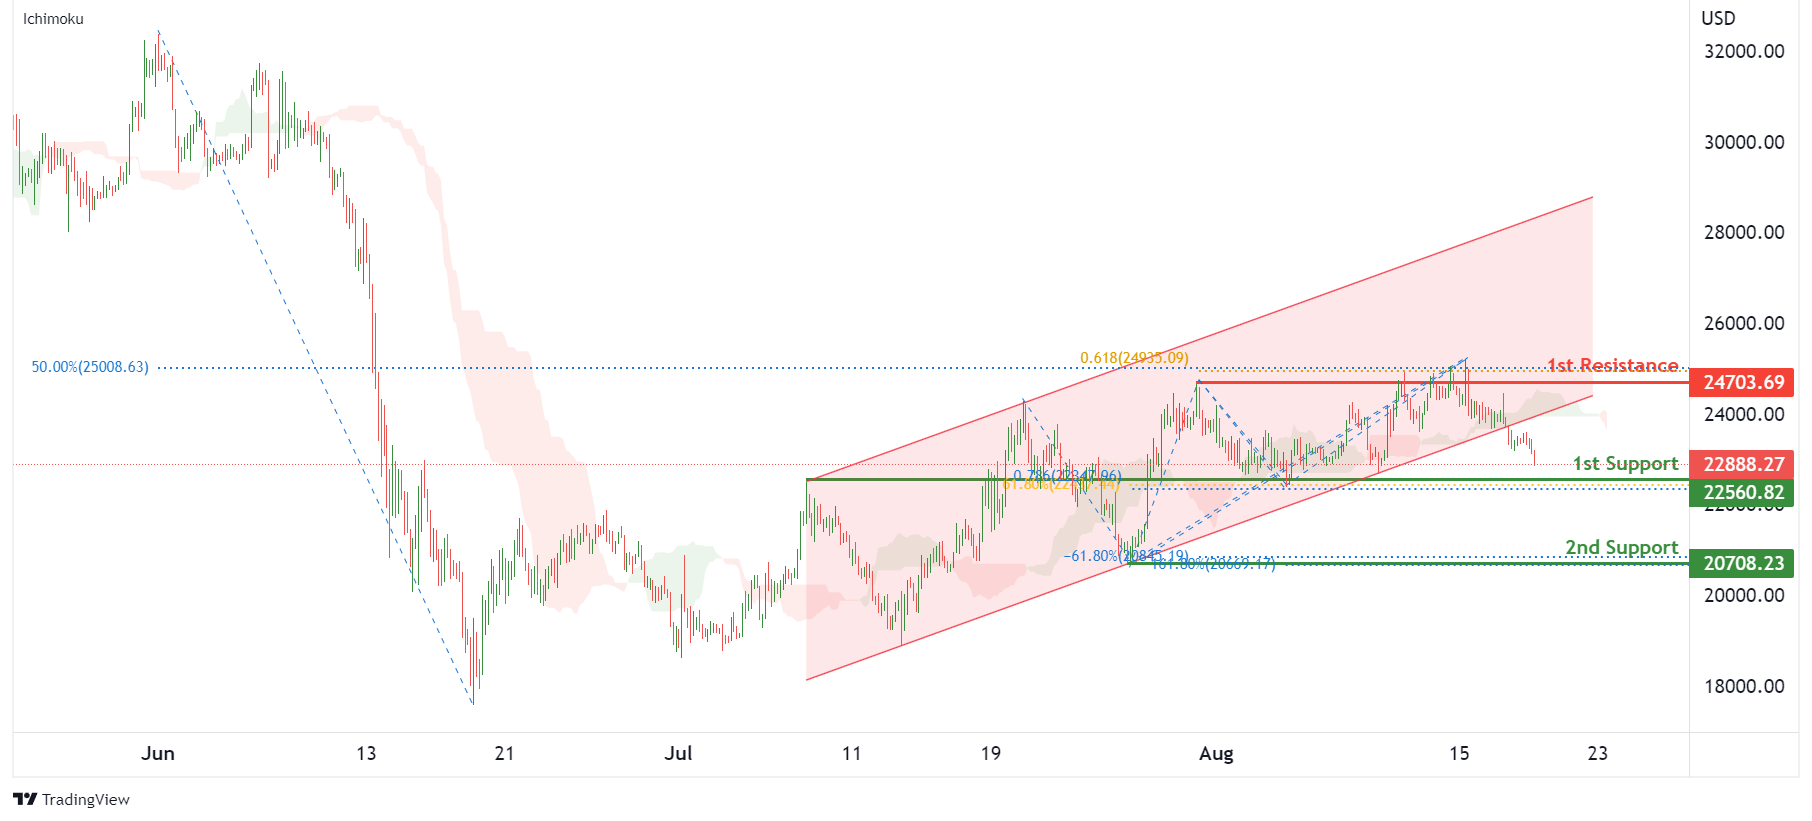
On the H4, with price breaking out of a bullish channel and moving below the ichimoku indicator, we have a bearish bias that price will drop to 1st support at 22560.82 where the pullback support, 61.8% fibonacci retracement and 78.6% fibonacci projection are. Once we have downside confirmation of price breaking 1st support structure,we would expect bearish momentum to carry price to 2nd support at 20708.23 where the -61.8% fibonacci expansion, 161.8% fibonacci extension and swing low support are. Alternatively, price could rise to 1st resistance at 24703.69 where the pullback resistance, 50% fibonacci retracement and 61.8% fibonacci projection are.
Areas of consideration:
- H4 time frame, 1st resistance of 24703.69
- H4 time frame, 1st support at 22560.82
S&P 500:
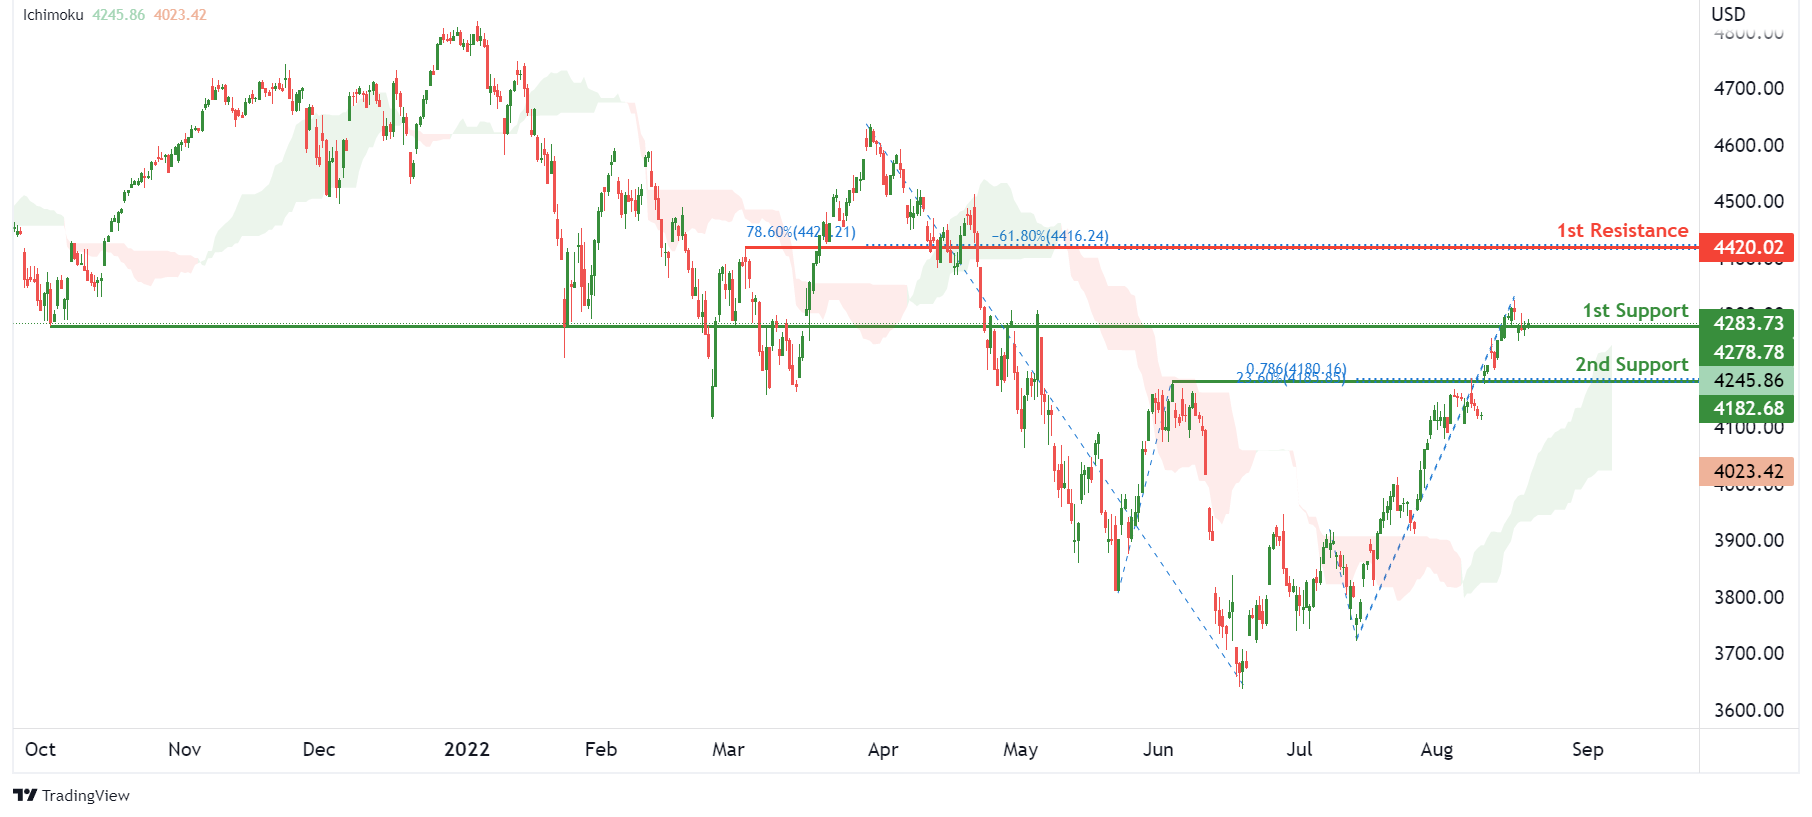
On the H4, with prices moving above the ichimoku indicator, we have a bullish bias that the price will rise to 1st resistance at 4278.78 where the overlap resistance is. Once there is upside confirmation that price has broken the 1st resistance structure, we would expect bullish momentum to carry price to 2nd resistance at 4420.02 where the pullback resistance, 78.6% fibonacci retracement and -61.8% fibonacci expansion are. Alternatively, price could drop to 1st support at 4182.68 where the pullback support, 78.6% fibonacci projection and 23.6% fibonacci retracement are.
Areas of consideration:
- H4 time frame, 1st resistance of 4278.78
- H4 time frame, 1st support at 4182.68
In Favour of More USD Strength Going into Jackson Hole Gathering
Markets
An avalanche of Fed members hit the wires yesterday, especially during US trading hours. Voting member St.-Louis Fed Bullard argued in favour of a third consecutive 75 bps rate hike in September. In a WSJ interview, he vows to continue to move expeditiously to a level of the policy rate that will put significant downward pressure on inflation. He is a fan of frontloading tightening, with the policy rate at a restrictive level of 3.75%-4% by year-end. Bullard argues that continuing the cycle on the next three meetings should be taken for granted. Afterwards, the Fed should re-evaluate the state of the economy and inflation dynamics to consider how to move forward in 2023. If one thing is sure, he believes that market speculation over rate cuts is definitely premature. Bullard fears that high inflation will prove more persistent than what many parts of Wall Street think. On top, he errs on the optimistic side of expectations when it comes to H2 2022 growth on the back of the strong US labour market.
Non-voting SF Fed Daly said that she was open to raising rates by 50 or 75 bps next month and underlined that the Fed wasn’t in a hurry to reverse course next year.
Non-voting Minneapolis Fed Kashkari wants to tackle the Fed’s inflation problem right now. He stressed that economic fundamentals are strong and wants to get down inflation urgently.
Voting Kansas City Fed George is in favour of slowing down the tightening pace, mainly because of the lagging impact on inflation from the Fed’s actions. She already dissented in June, in favour of a smaller rate hike. Nevertheless, when it comes to the terminal interest rate, she doesn’t want to talk about a stopping point yet as the Fed has to be completely convinced that inflation is coming down.
Markets at the moment seem to turn a deaf ear to the new vigilance coming from Fed members. They discount an additional 125 bps (3.5%-3.75%) of tightening by year-end and that’s about it. US money markets even discount a 25 bps policy rate cut by end 2023. This suggests that we might see more hawkish repositioning next week in the sidelines of the Jackson Hole symposium (Aug 25-27). This year’s topic is “reassessing constraints on the economy and policy”. Fed Chair Powell was yesterday confirmed as speaker on August 26. He will share his views on the economic outlook.
US Treasuries yesterday even outperformed German Bunds and UK Gilts. US yields dropped by 1.6 bps (30-yr) to 8.5 bps (2-yr). The German and UK yield curves bear flattened on the contrary with yields up around 5 bps at the front end and marginally higher at the very long end of the curve. In FX space, the dollar outpaced the euro which on his turned performed better than sterling. Relative yield dynamics are void at the moment as trading theme. EUR/USD yesterday fell below the 1.01 big figure. We tend to argue in favour of more USD strength going into the Jackson Hole gathering. EUR/GBP flipped sides around the 0.8450 mark. The pair is currently testing the topside of the corrective downward trend channel since mid-June. This morning’s better than expected UK retail sales (0.4% M/M for core) don’t immediately come to sterling’s rescue. Today’s eco calendar is empty. Apart from the Fed symposium, market keep next week’s EMU PMI’s in the back of their minds.
News Headlines
UK consumer confidence (GfK, growth from knowledge) fell to a new record low of -44 in August. GfK has been tracking consumer confidence since 1974. All measures declined (personal financial situation over last/over next 12 months, general economic situation over last/over next 12 months and major purchase index), reflecting acute concerns as the cost-of-living soars. A sense of exasperation about the UK’s economy is the biggest driver of these findings. GfK Client Strategy Director Staton says that the crisis of confidence will only worsen with the darkening days of autumn and the colder months of winter.
GBP/JPY Daily Outlook
Daily Pivots: (S1) 161.47; (P) 162.36; (R1) 163.03; More...
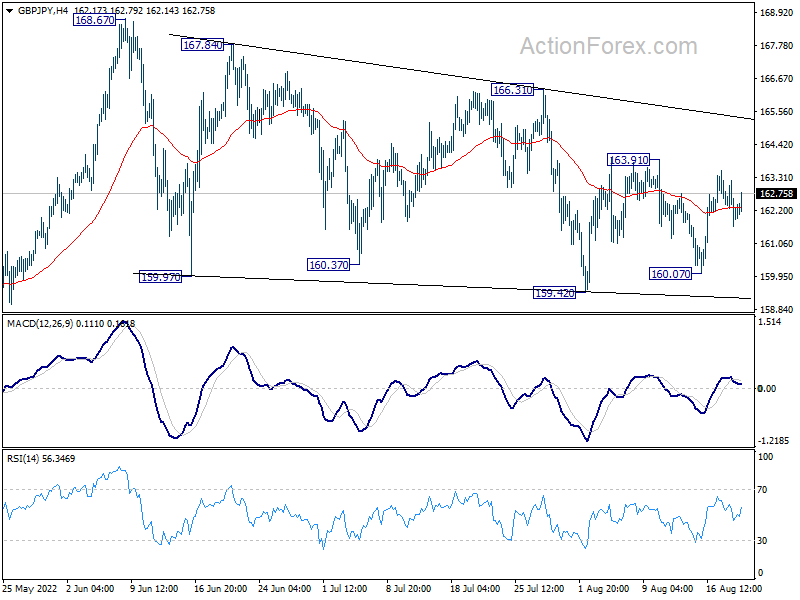
Intraday bias in GBP/JPY is turned neutral first but outlook is unchanged. Corrective pattern from 168.67 is extending. Break of 163.91 will bring stronger rise to 166.31 resistance. On the downside, below 160.07 will turn bias to the downside for 159.42 and below.
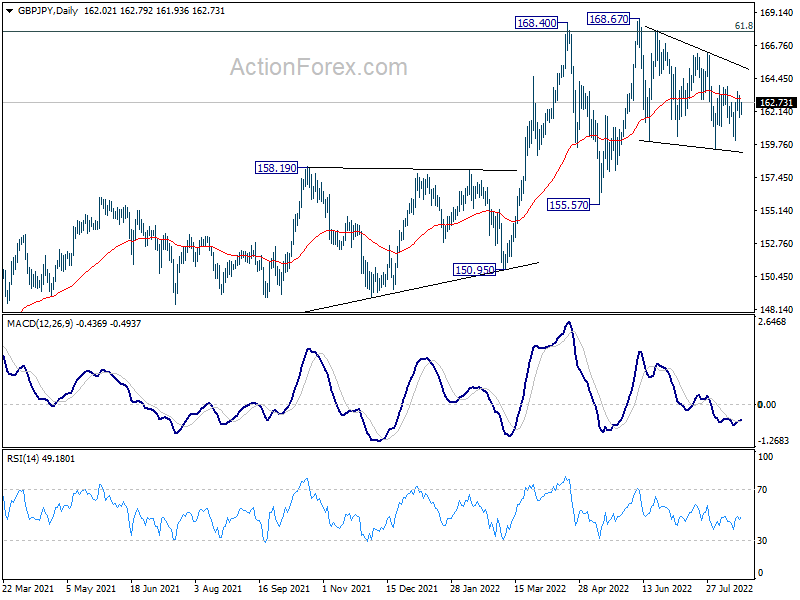
In the bigger picture, up trend from 123.94 (2020 low) is still in progress. Sustained break of 61.8% retracement of 195.86 (2015 high) to 122.75 (2016 low) at 167.93 will be a long term bullish signal, and could pave the way back to 195.86 high. This will remain the favored case as long as 155.57 support holds, even in case of deep pull back.
EUR/JPY Daily Outlook
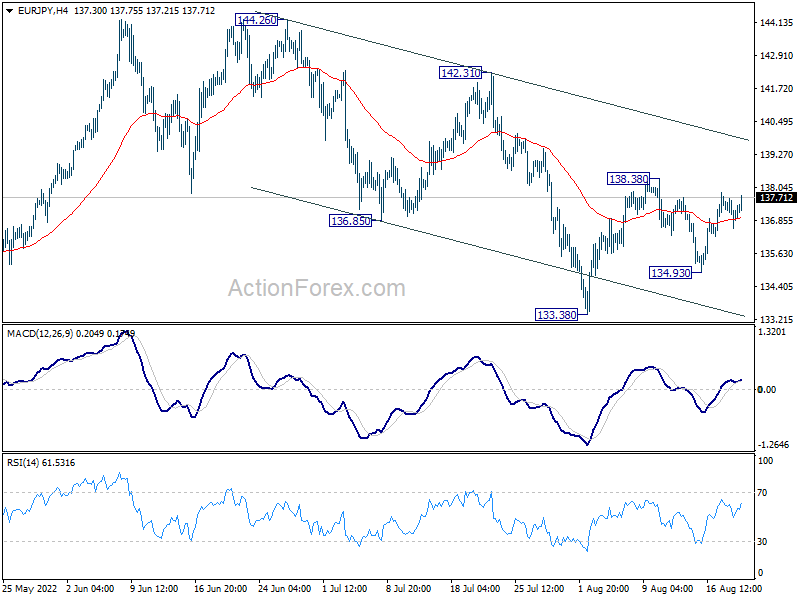
Daily Pivots: (S1) 136.54; (P) 137.10; (R1) 137.64; More....
Intraday bias in EUR/JPY remains neutral at this point. The corrective pattern from 144.25 is still extending. On the upside, above 138.38 will resume the rebound from 138.38. On the downside, below 134.93 will turn bias back to the downside for 133.38 support.
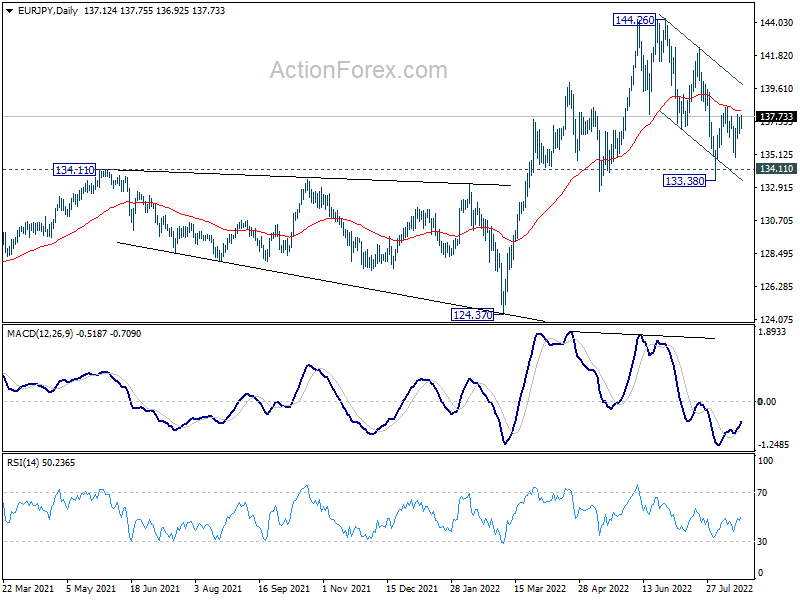
In the bigger picture, up trend from 114.42 (2020 low) is seen as the third leg of the pattern from 109.30 (2016 low). Further rally is in favor as long as 134.11 resistance turned support holds, even in case of deep pull back. Next target is 149.76 (2015 high). However, sustained break of 134.11 will be a sign of medium term bearish reversal and turn focus to 124.37 support for confirmation.
EUR/GBP Daily Outlook
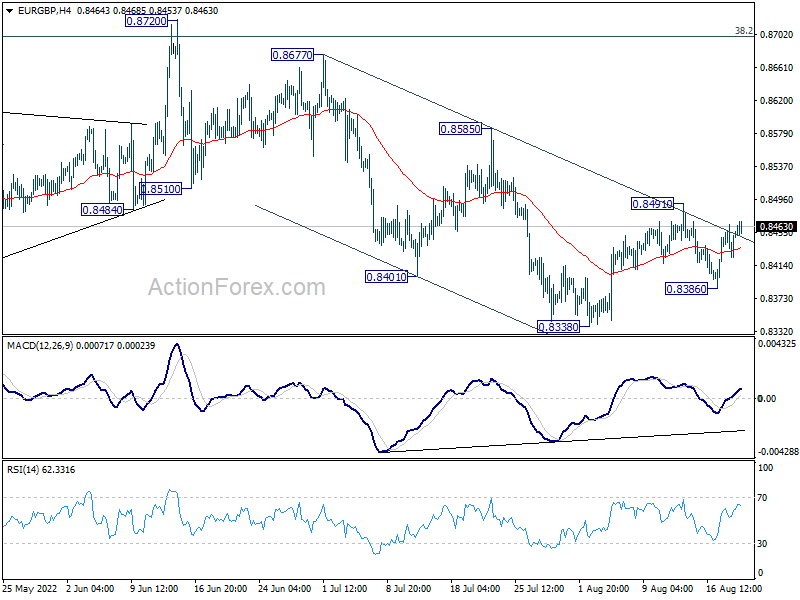
Daily Pivots: (S1) 0.8431; (P) 0.8449; (R1) 0.8473; More...
Intraday bias in EUR/GBP remains neutral at this point. On the upside, break of 0.8491 resistance will resume the rebound from 0.8338. That would also argue that choppy decline from 0.8720 has completed. Bias will be back to the upside for 0.8585 resistance. On the downside, below 0.8386 should resume the fall from 0.8720 through 0.8338.
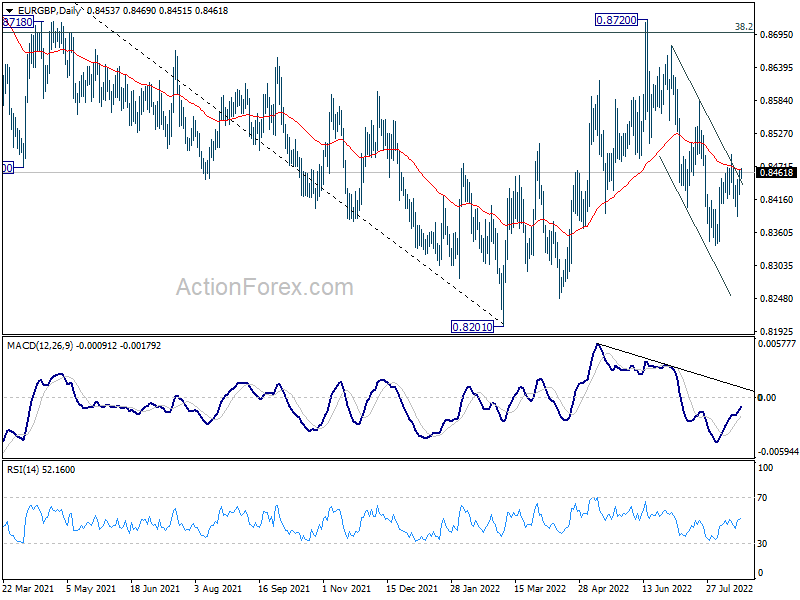
In the bigger picture, current development suggests rejection by 38.2% retracement of 0.9499 to 0.8201 at 0.8697. Medium term bearishness is maintained. Break of 0.8201 will resume larger down trend from 0.9499 (2020 high). Nevertheless, sustained break of 0.8697 will affirm the case that rise from 0.8201 is a medium term up trend itself.
EUR/AUD Daily Outlook
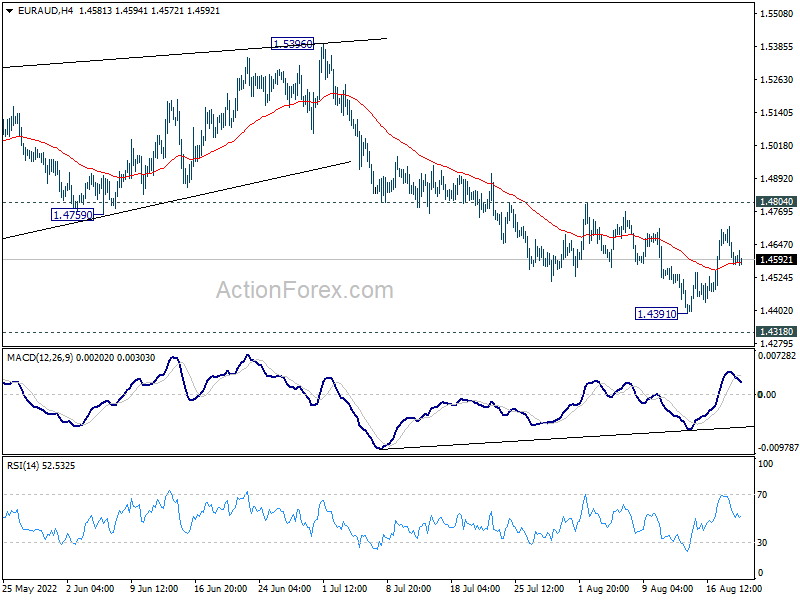
Daily Pivots: (S1) 1.4538; (P) 1.4627; (R1) 1.4677; More...
Intraday bias in EUR/AUD remains neutral and another fall is in favor with 1.4804 resistance intact. Firm break of 1.4318 low will resume larger down trend to medium term projection level at 1.3623. However, break of 1.4804 will delay the bearish case and turn bias to the upside for stronger rebound first.
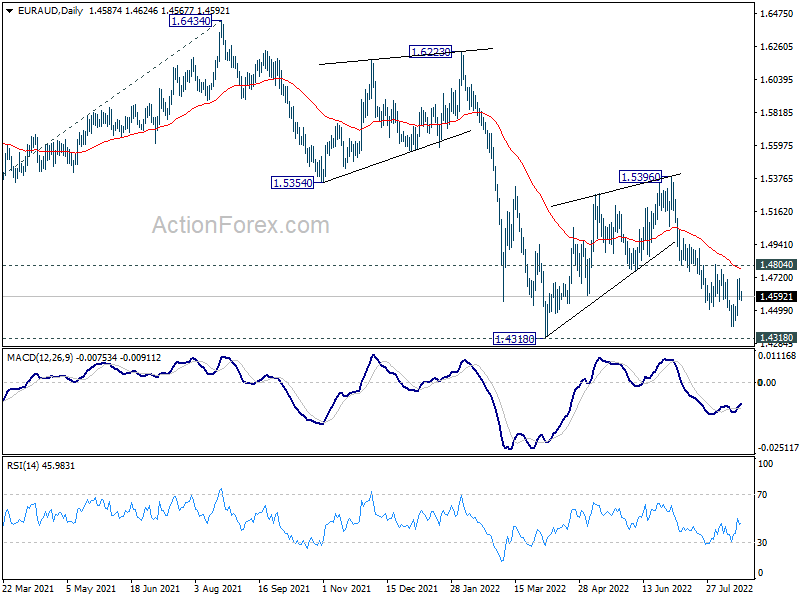
In the bigger picture, down trend from 1.9799 is still in progress. Break of 1.4318 low will target 61.8% projection of 1.9799 to 1.5250 from 1.6434 at 1.3623, which is close to 1.3624 long term support (2017 low). This will remain the favored case now as long as 1.5396 resistance holds.
EUR/CHF Daily Outlook
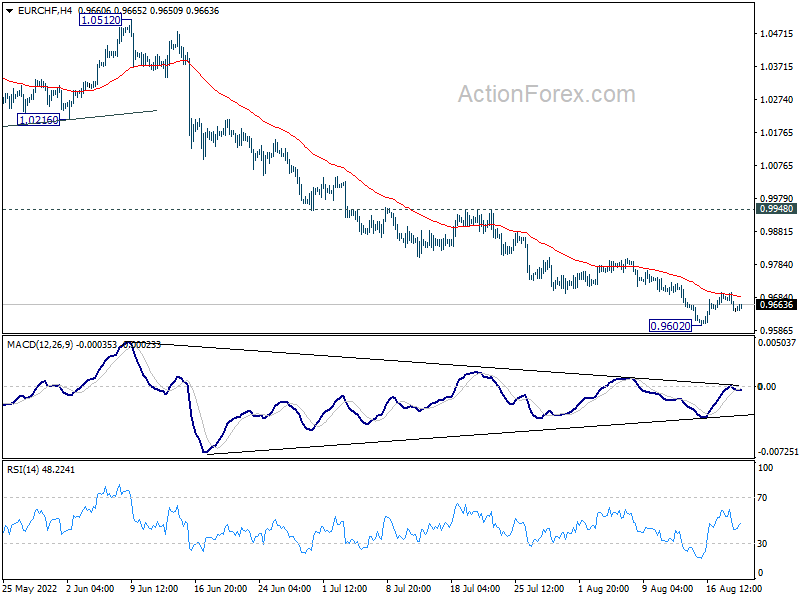
Daily Pivots: (S1) 0.9633; (P) 0.9666; (R1) 0.9688; More....
EUR/CHF is staying in consolidation from 0.9602 and intraday bias remains neutral. Upside of recovery should be limited well below 0.9948 resistance to bring another fall. Break of 0.9602 will resume larger down trend to 100% projection of 1.1149 to 0.9970 from 1.0513 at 0.9334.
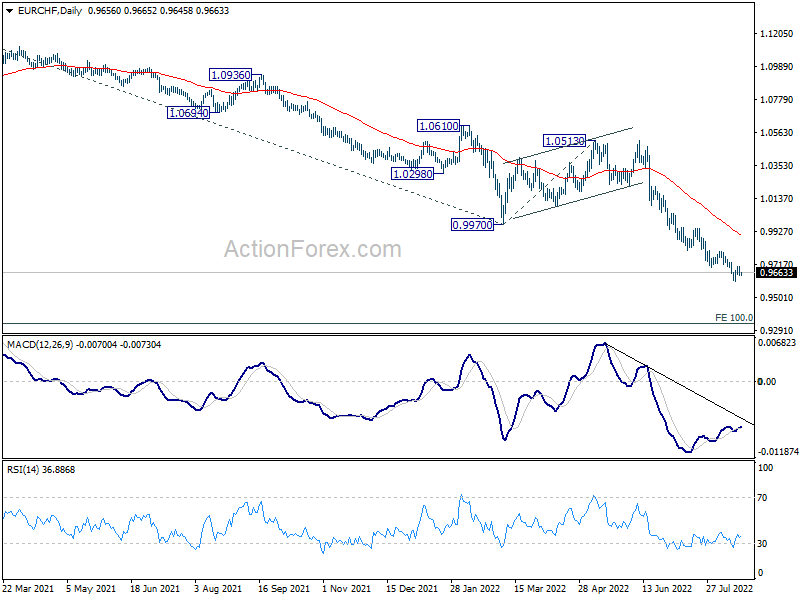
In the bigger picture, long term down trend from 1.2004 (2018 high) is still in progress. Next target is 138.2% projection of 1.2004 to 1.0505 to 1.1149 at 0.9033. On the upside, break of 0.9970 support turned resistance is needed to be the first sign of medium term bottoming. Otherwise, outlook will stay bearish in case of strong rebound.
USD/CAD Daily Outlook
Daily Pivots: (S1) 1.2896; (P) 1.2932; (R1) 1.2982; More...
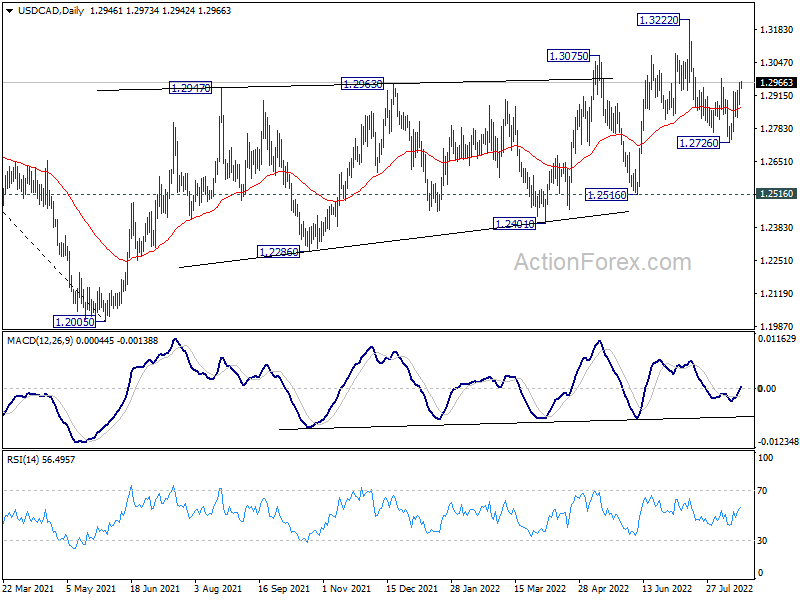
Intraday bias in USD/CAD remains neutral for the moment. On the upside, firm break of 1.2984 resistance will argue that corrective fall from 1.3222 has completed with three waves down to 1.2726. Further rally would be seen back to retest 1.3222 high. On the downside, break of 1.2726 will resume the fall from 1.3222 to 1.2516 key support instead.
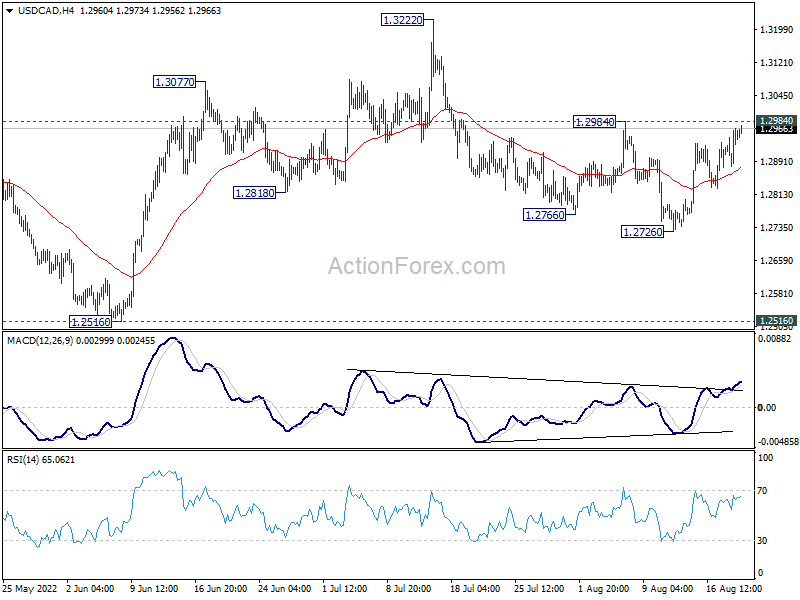
In the bigger picture, down trend from 1.4667 (2020 high) should have completed at 1.2005, after defending 1.2061 long term cluster support. Rise from there should target 61.8% retracement of 1.4667 to 1.2005 (2021 low) at 1.3650. This will remain the favored case now as long as 1.2516 support holds.