Sample Category Title
ECB Schnabel: Our concerns was not alleviated after Jul 50bps hike
ECB Executive Board member Isabel Schnabel said in an interview that there was a "strong indication that growth is going to slow". She would not rule out a technical recession in Eurozone, "especially if energy supplies from Russia are disrupted further". Downside risks also increased due to "additional supply-side shocks, caused by droughts or the low water levels in major rivers."
Regarding inflation she said the increasing inflation rates are a "broad-based development". "Inflationary pressures are likely to be with us for some time; they won't vanish quickly," she added. "I would not exclude that, in the short run, inflation is going to increase further.... it's very difficult to predict when inflation is going to peak."
Regarding September meeting, Schnabel said that "the concerns we had in July have not been alleviated". Back in July, ECB raised interest rate by 50bps. "At the moment I do not think this outlook has changed fundamentally," she added.
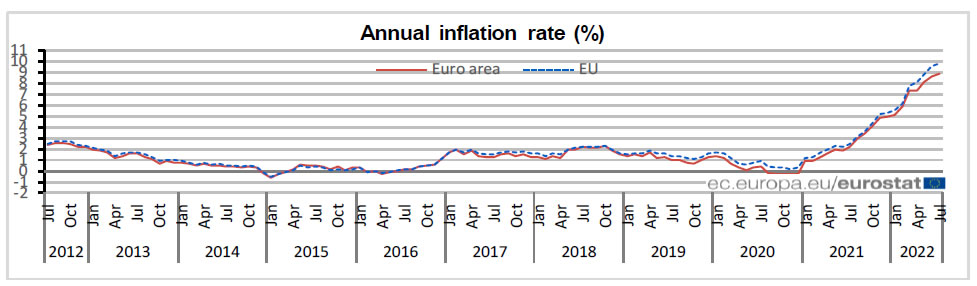
Eurozone CPI finalized at 8.9% yoy in Jul, core CPI at 5.4% yoy
Eurozone CPI was finalized at 8.9% yoy in July, comparing with June's 8.6% yoy. CPI ex-energy, food, alcohol, and tobacco was finalized at 5.4% yoy (up from June's 4.9% yoy). The highest contribution to the annual Eurozone inflation rate came from energy (+4.02%), followed by food, alcohol & tobacco (+2.08%), services (+1.60%) and non-energy industrial goods (+1.16%).
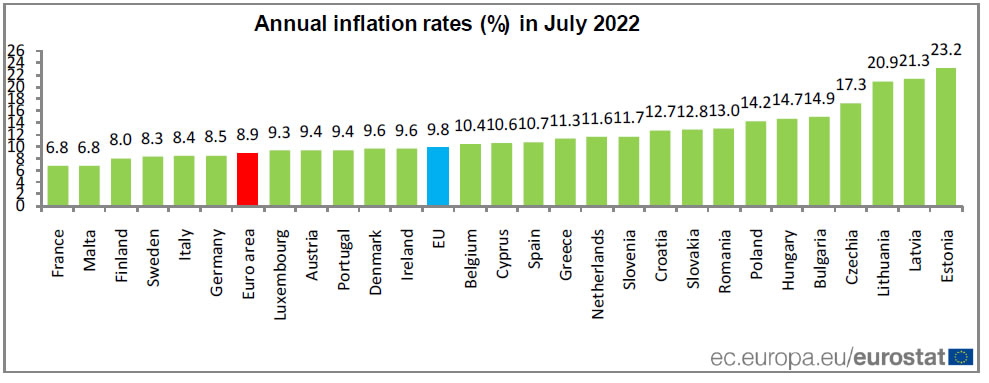
EU CPI was finalized at 9.8% yoy, up from June's 9.6% yoy. The lowest annual rates were registered in France, Malta (both 6.8%) and Finland (8.0%). The highest annual rates were recorded in Estonia (23.2%), Latvia (21.3%) and Lithuania (20.9%). Compared with June, annual inflation fell in six Member States, remained stable in three and rose in eighteen.
July Retail Sales for UK, Canada
Retail sales have become a bellwether of the economy, and consequently for the movement of currencies. Additionally, they can swing market sentiment, particularly if it's a major economy that's reporting. Tomorrow there are two currency majors reporting the latest figures, and that could shake up their respective pairs a bit.
Retail sales figures are particularly important now that fuel prices are coming down. The underlying components show how the consumer side of the economy is being impacted by inflation. Central banks - particularly relevant to the data tomorrow, the BOE and BOC - are going all-in on fighting inflation. Demand is one of the driving forces of inflation.
Balancing the factors
One of the things that can lead to confusion in the current environment is that some countries adjust for inflation in their surveys and others do not. The UK, for example, publishes inflation-adjusted retail sales data, while Canada (like their neighbor to the south) does not. Given how high inflation is among the reporting countries, this can lead to some very uneven numbers, which needs to be taken into context.
The main issue for now is volume. Are consumers buying more, or simply spending more? If consumers are spending more, even if volumes aren't going up, it could mean the situation isn't so dire. And if inflation gets under control, then volumes can potentially increase and the economy right-side. But, if retail sales are going down, and volume is going down, it could mean that consumers are simply running out of money, and that can imply a recession is imminent. Like the BOE already warned.
What's in the data? UK July retail sales are expected to show a monthly decline of -0.2% compared to -0.1% in the prior month. On an annual basis, however, the decline is expected to narrow th -3.3% compared to -5.8% prior. But this is likely explained by slowing sales last year as the delta variant took hold in the summer. The acceleration to the downside in the monthly figure might worry investors more.
UK July retail sales excluding fuel are also expected to see a -0.2% decline compared to 0.4% increase in June. In other words, the immediate spending impact of fuel is starting to diminish. Compared to the prior year, retail sales ex fuel are expected at -3.3% compared to -5.8% in the prior reading.
How does Canada compare?
Canada's expected figures are dramatically different, because they aren't adjusted for inflation which last came in at an annual rate of 7.6%, and a monthly rate of 0.1%. Canadian monthly retail sales are expected to have increased by 0.3% compared to 2.2% in the prior month (reflecting the improving inflation situation). Annual retail sales are expected to have grown 9% compared to 14.1% in the prior report. Again, the annual comparables likely due more to covid effects last year, than the current situation.
The Crypto Market Tests the Strength of Buyers
Market picture
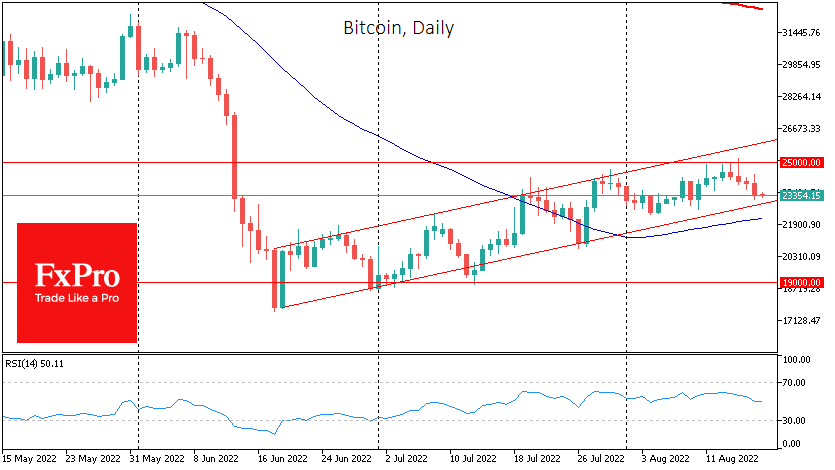
Bitcoin has lost 4% in the past 24 hours, falling to $23.3K. Ethereum lost 5.3% to $1840. Top altcoins are down 3% (XRP) to 8% (Solana).
Total crypto market capitalisation, according to CoinMarketCap, sank 3.4% to $1.12 trillion. The Crypto Fear and Greed Index fell 11 points to 30 by Thursday, tumbling deeper into “fear” territory.
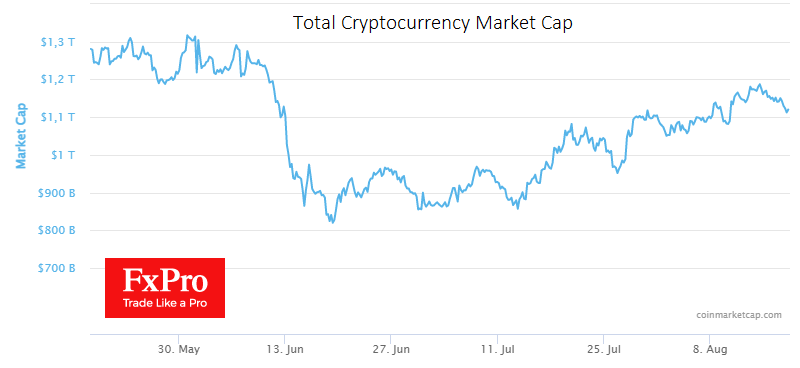
Once again, Bitcoin seems to have acted as a leading indicator of risk sentiment in global markets. The former cryptocurrency had been sluggishly correcting over the previous three days but only yesterday took a decisive step down, warning of a similar move in the US indices.
Right now, BTCUSD has rolled back to the area of previous local lows and is approaching the lower boundary of the uptrend channel. A break below $22.5K in a sharp move down would be evidence of a gap in the last two months’ trend and a deeper dive harbinger.
News background
According to Fox Business journalist Eleanor Terrett, the US Securities and Exchange Commission (SEC) may yet charge Ethereum creators with selling unregistered securities in the US.
Cryptocurrency hacking damage in 2022 was $1.9 billion, having doubled in a year and a half, according to analytics service Chainalysis.
The European Green Party has introduced legislative amendments to increase capital requirements for banks using cryptocurrencies.
Stablecoins backed by the US dollar, and other fiat currencies will expand access to financial services and Web3, according to cryptocurrency exchange Coinbase.
According to Blockckdata, Alphabet, Google’s parent company, has invested more than $1.5bn in four blockchain companies between September 2021 and June 2022. This is followed by Blackrock ($1.17bn) and Morgan Stanley ($1.11bn). Large public companies have invested about $6 billion in crypto.
AUDUSD Wave Analysis
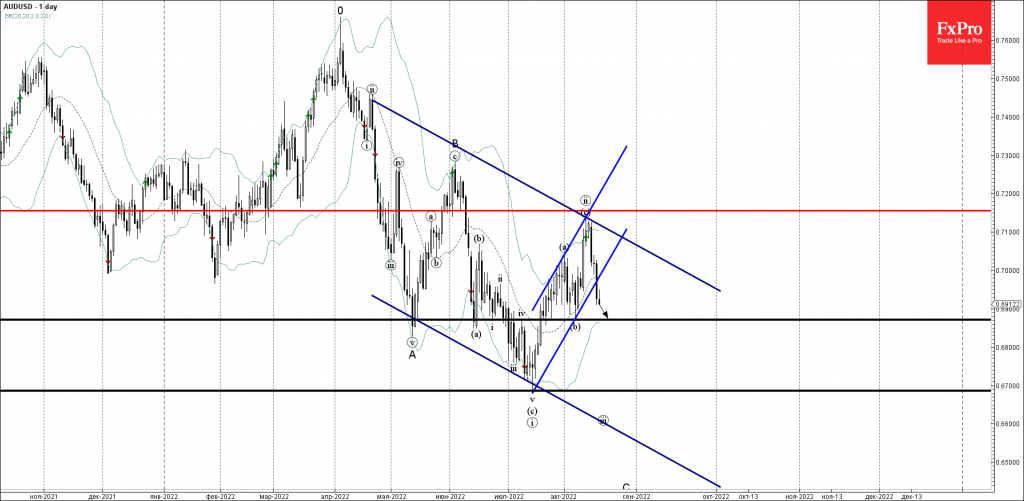
- AUDUSD broke daily up channel
- Likely to fall to support level 0.6870
AUDUSD recently broke the support trendline of the daily up channel, inside which the pair has been rising from the middle of July.
The breakout of this up channel continues the active multi-impulse downward sequence made out of the impulse waves (iii) and C.
Given strong daily downtrend – AUDUSD can be expected to fall further toward the next support level 0.6870 (low of the previous correction (b)).
EURNZD Wave Analysis
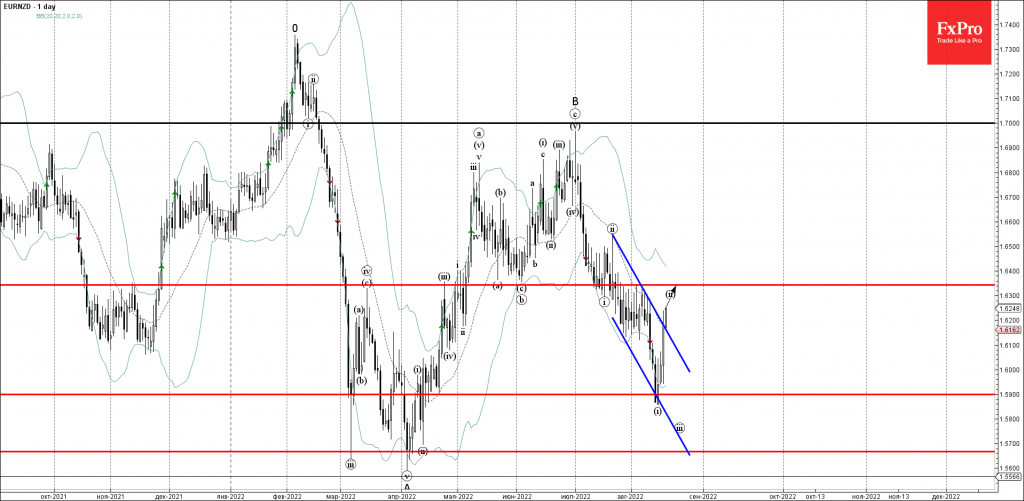
- EURNZD broke daily down channel
- Likely to rise to resistance level 1.6345
EURNZD recently broke the resistance trendline of the daily down channel, inside which the pair has been falling from July.
The breakout of this down channel accelerated the active short-term correction (ii) – which belongs to the sharp downward impulse wave C from June.
Given the bullish euro sentiment – EURNZD can be expected to rise further toward the next resistance level 1.6345 (target for the completion of the active short-term correction (ii)).
Silver Wave Analysis
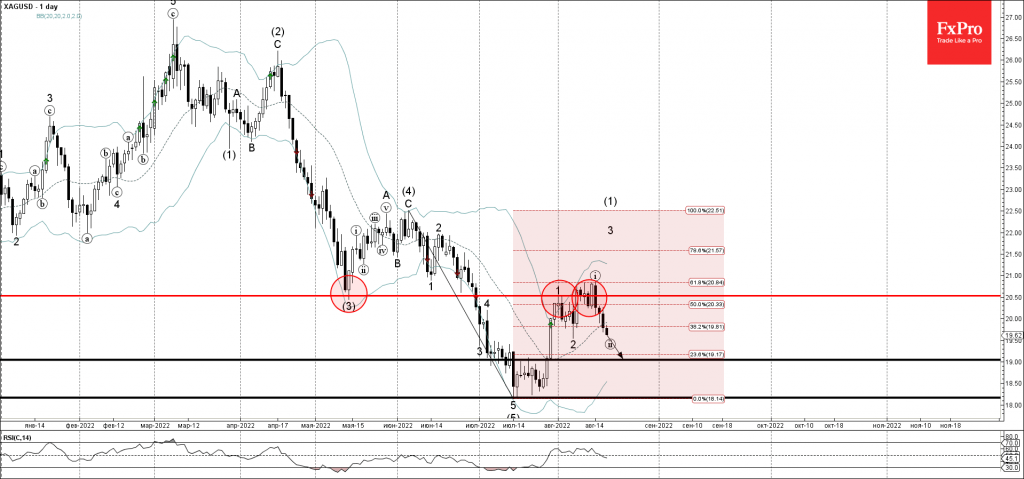
- Silver reversed from resistance level 20.50
- Likely to fall to support level 19.00
Silver recently reversed down from the key resistance level 20.50 (former monthly low from May), intersecting with the upper daily Bollinger Band and the 61.8% Fibonacci correction of the downward impulse from June.
The downward reversal from the resistance level 20.50 started the active short-term correction (ii).
Given the powerful daily downtrend, Silver can be expected to fall further toward the next support level 19.00.
NZDUSD Slides Below Bullish Channel but Remains Supported
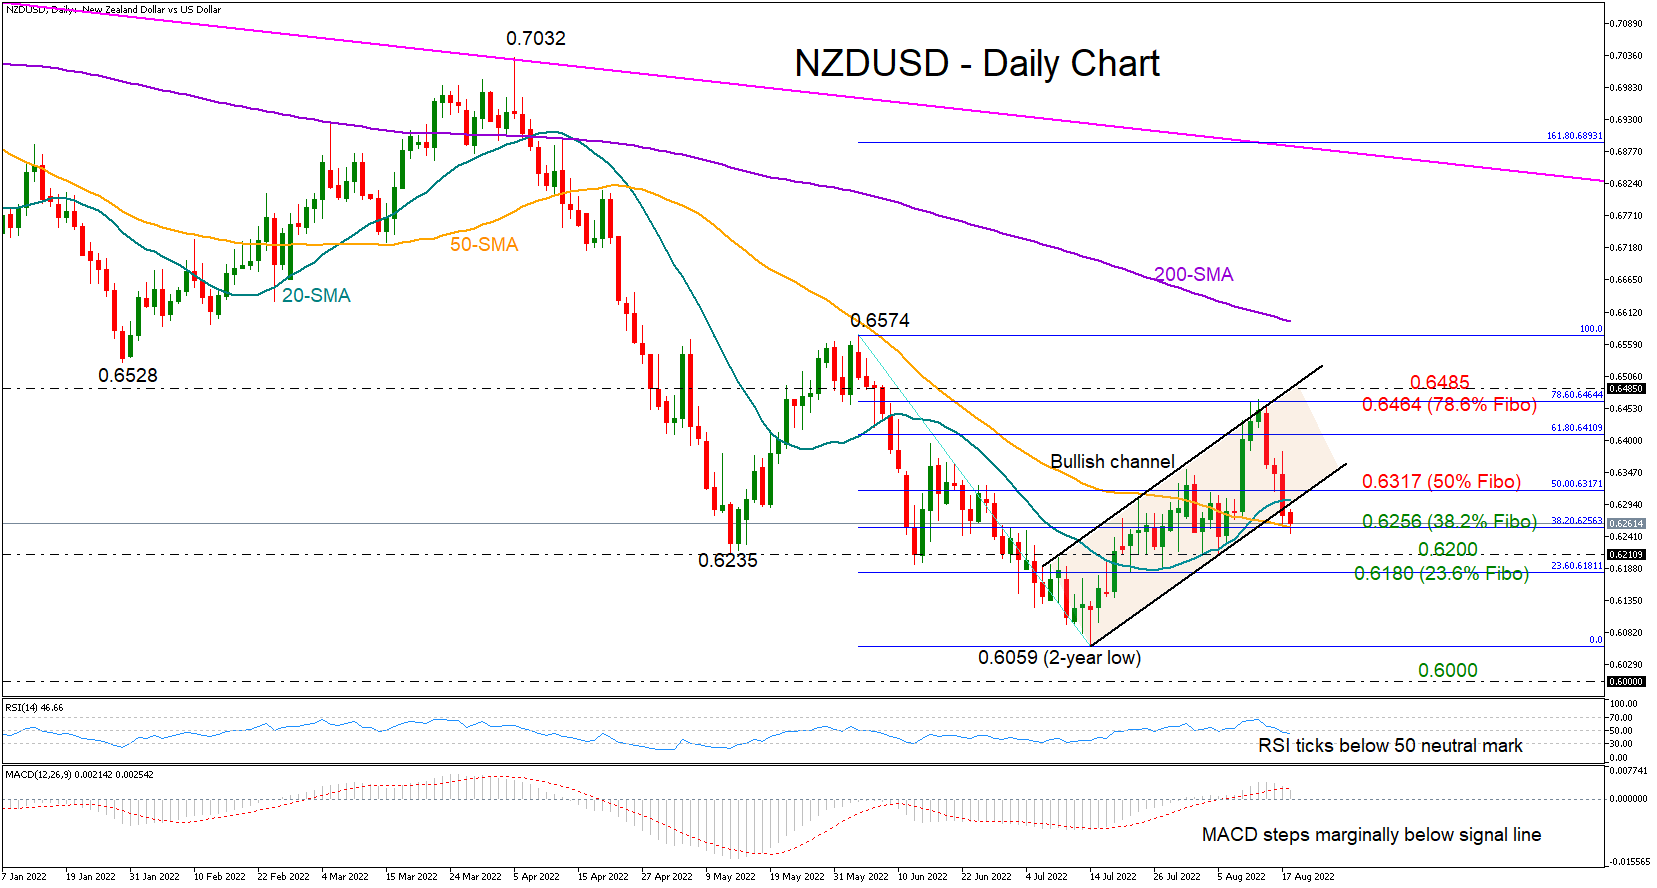
NZDUSD is in the fourth consecutive day of declines, set to confirm its exit from a short-term bullish channel at 0.6267.
While the momentum indicators suggest that the negative correction has just started, some confirmation is required since the RSI and the MACD have not significantly deviated below their neutral levels; the RSI is still close to its 50 neutral mark and the MACD marginally below its red signal line, reflecting a neutral-to-bearish short-term bias overall.
Moreover, the price itself is currently facing support around the 50-day simple moving average (SMA) and the 38.2% Fibonacci retracement of the 0.6574 – 0.6059 downfall at 0.6256. If that base holds, with the price immediately crawling back above the 50% Fibonacci of 0.6317, the bulls may again attempt to breach the 78.6% Fibonacci of 0.6464 and the channel’s upper boundary seen at 0.6485. Should they claim this zone, all attention will turn to June's peak of 0.6574. Note that the 200-day SMA is also converging to that number.
In the event the sell-off continues, the focus will initially turn to the 0.6200 – 0.6180 region. Another defeat at this point could aggressively press the pair towards the two-year low of 0.6059, while lower, the price may chart a new lower low at 0.6000.
Summarizing, despite the quick depreciation in NZDUSD, the pair might have another opportunity to improve its fortunes at 0.6256. Otherwise, the bearish wave could gain extra legs.
USDJPY Visits 40-Day SMA at 135.55; Bullish Bias
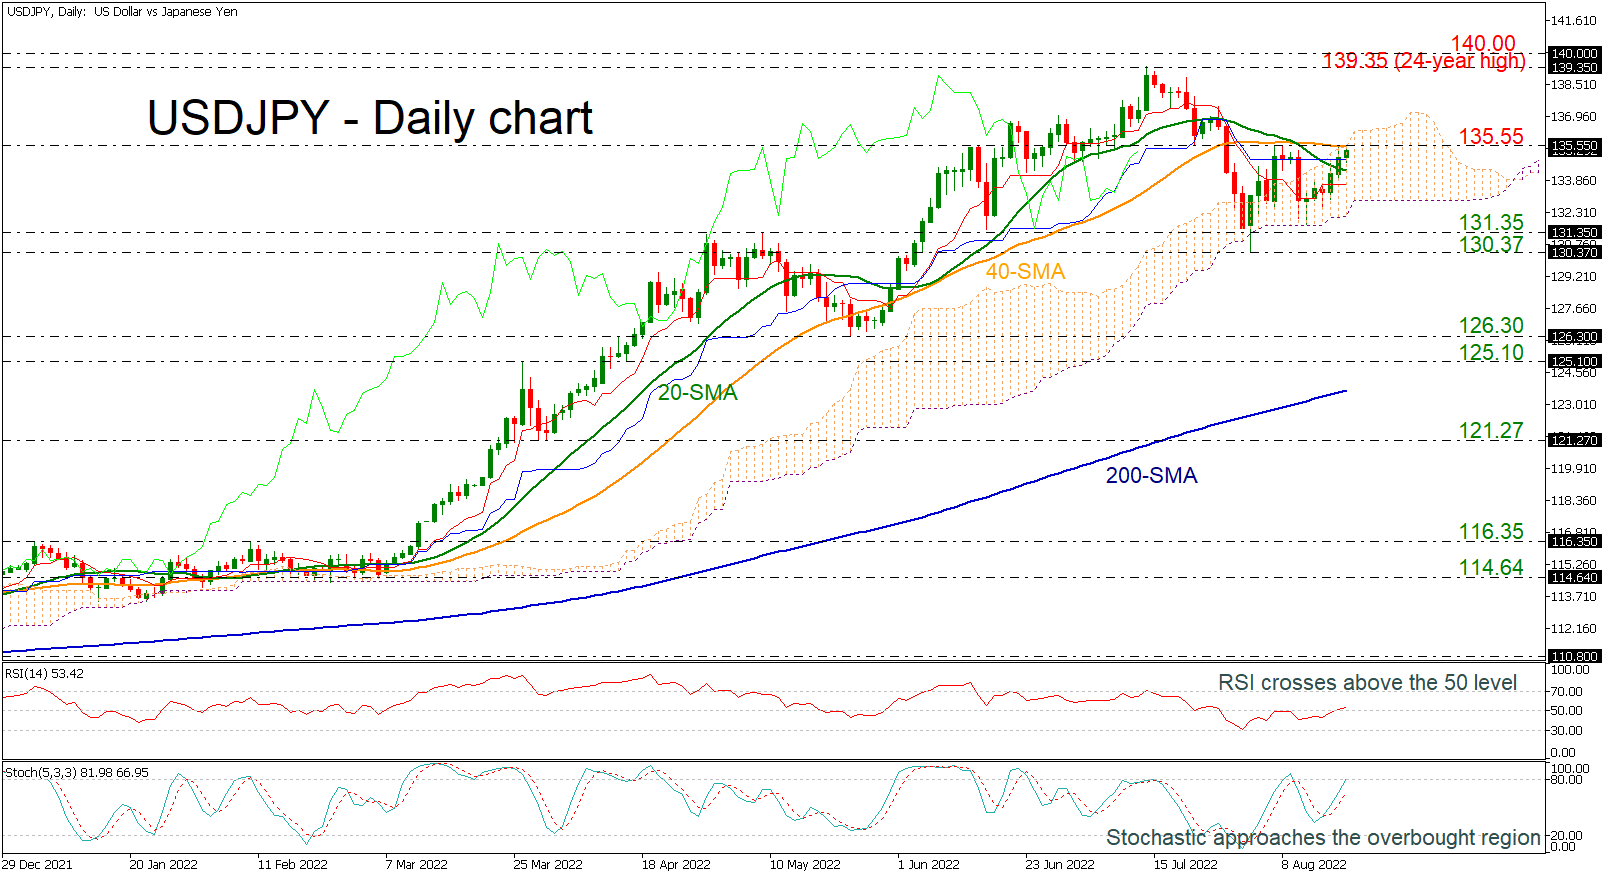
USDJPY is turning up, hitting the strong immediate resistance at 135.55, which overlaps with the 40-day simple moving average (SMA).
The pair remains inside the Ichimoku cloud, while the RSI is getting closer to the positive territory and the stochastic oscillator is moving up towards the 80 level after the bullish crossover between the %K and %D lines. Both suggest that the next move may be up instead of down in the near-term.
If the price closes decisively above the 135.55 resistance, the bulls could push up to the 24-year high of 139.35 before testing the psychological level of 140.00.
On the other hand, a drop could hit the support level of 131.35, which the market failed to break below since June. Even lower, the market could try to break through the 130.37 barrier again before falling to the 125.10–126.30 support zone.
Overall, USDJPY needs to climb above the 40-day SMA for a short-term bullish move to be confirmed, while a drop below 130.37 could generate a lower low and change the outlook to bearish.
BTCUSD Retraces after Hitting 2-Month High
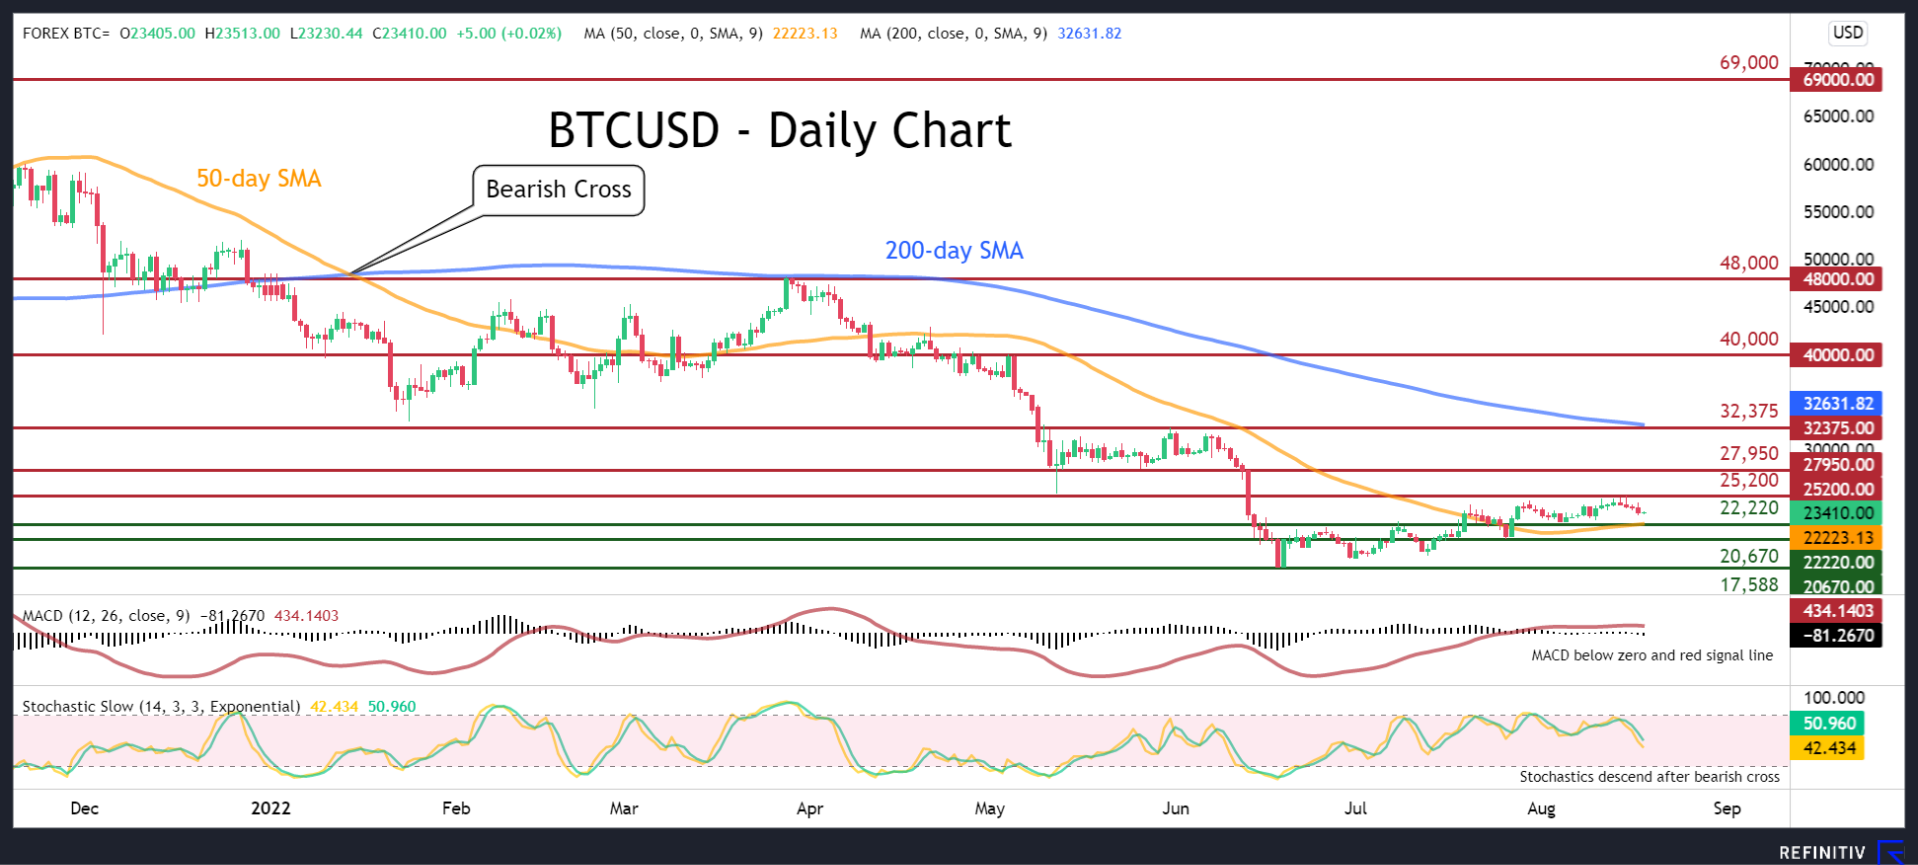
BTCUSD has been constantly gaining ground after its prolonged downtrend bottomed at the 2022 low of 17,588. However, in the last few daily sessions, the cryptocurrency has been experiencing a downside correction since its recent rebound failed to cross above the 25,200 region.
This loss of positive momentum is also reflected by the short-term indicators. Specifically, the MACD histogram has dived beneath both zero and its red signal line, while the stochastic oscillator is sloping downwards after posting a bearish cross.
Should the negative bias strengthen, initial support could be found at the 50-day simple moving average (SMA), currently at 22,220. Dropping beneath that zone, the bears could aim for the 20,670 barrier. A violation of the latter may pave the way for the 19-month low of 17,588.
On the flipside, bullish actions could propel the price higher to challenge the recent rejection point of 25,200. Conquering this barricade, further upside moves might stall at 27,950 before the May peak of 32,375 comes under examination. Even higher, the 40,000 psychological mark could prove to be a tough obstacle for the price to overcome.
In brief, Bitcoin’s latest recovery appears to be running out of steam, although it is still too early to call for a resumption of the broader downtrend. Therefore, a drop below the 50-day SMA could attract further selling interest, sending the price towards its recent lows.