Sample Category Title
RBNZ Orr: Monetary policy was too loose for a period
RBNZ Governor Adrian Orr told a parliamentary committee, "our core inflation is too high and that suggests at some point monetary policy was too loose for a period."
"I have already apologized for the current level of inflation. I have already said that the Reserve Bank was party to that," he added.
However, "the worst mistake we could be having would be fighting deflation, unnecessary unemployment and economic collapse," he said. "We have ended up with the better problem -- but it is a problem -- which is inflation, core inflation of 4-6% that we need to put back in the bottle."
Technical Outlook and Review
USD/JPY:
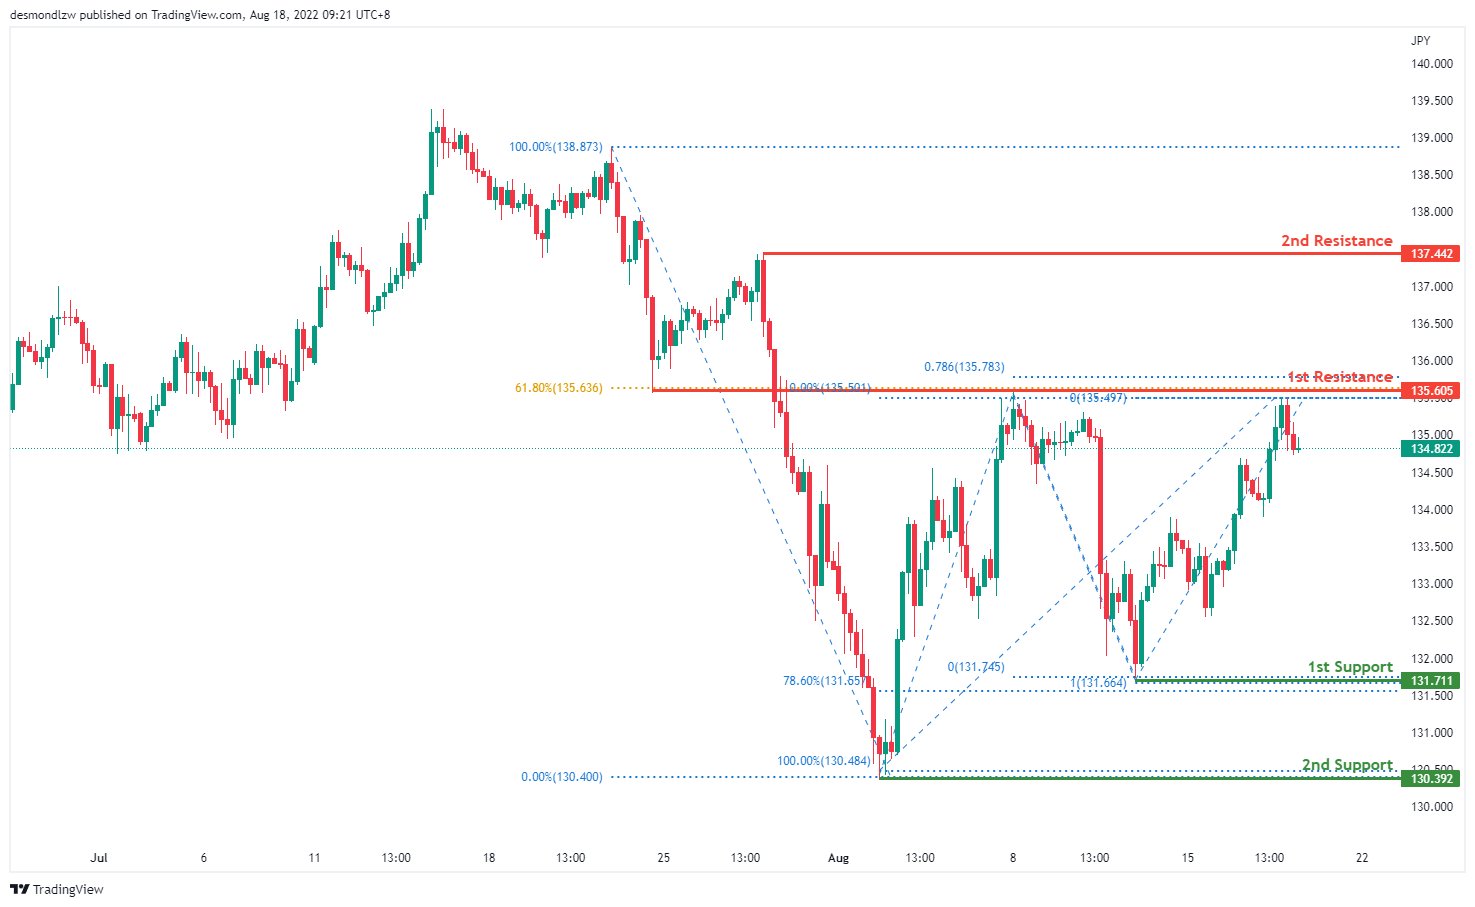
On the H4 chart, prices seem to have pulled back a little but the overall trend is still bearish biased. Price has broken the intermediate resistance at 133.908 which is the 50% Fibonacci retracement and is now testing the first resistance at 135.605 where the previous swing high. 61.8% fibonacci retracement and 78.6% projection sits.If the bearish momentum continues it will pull back to test the first support at 131.711 where the 78.6% retracement and 100% projection sits
Areas of consideration:
- H4 time frame, 1st resistance at 135.605
- H4 time frame, 1st support at 131.711
DXY:
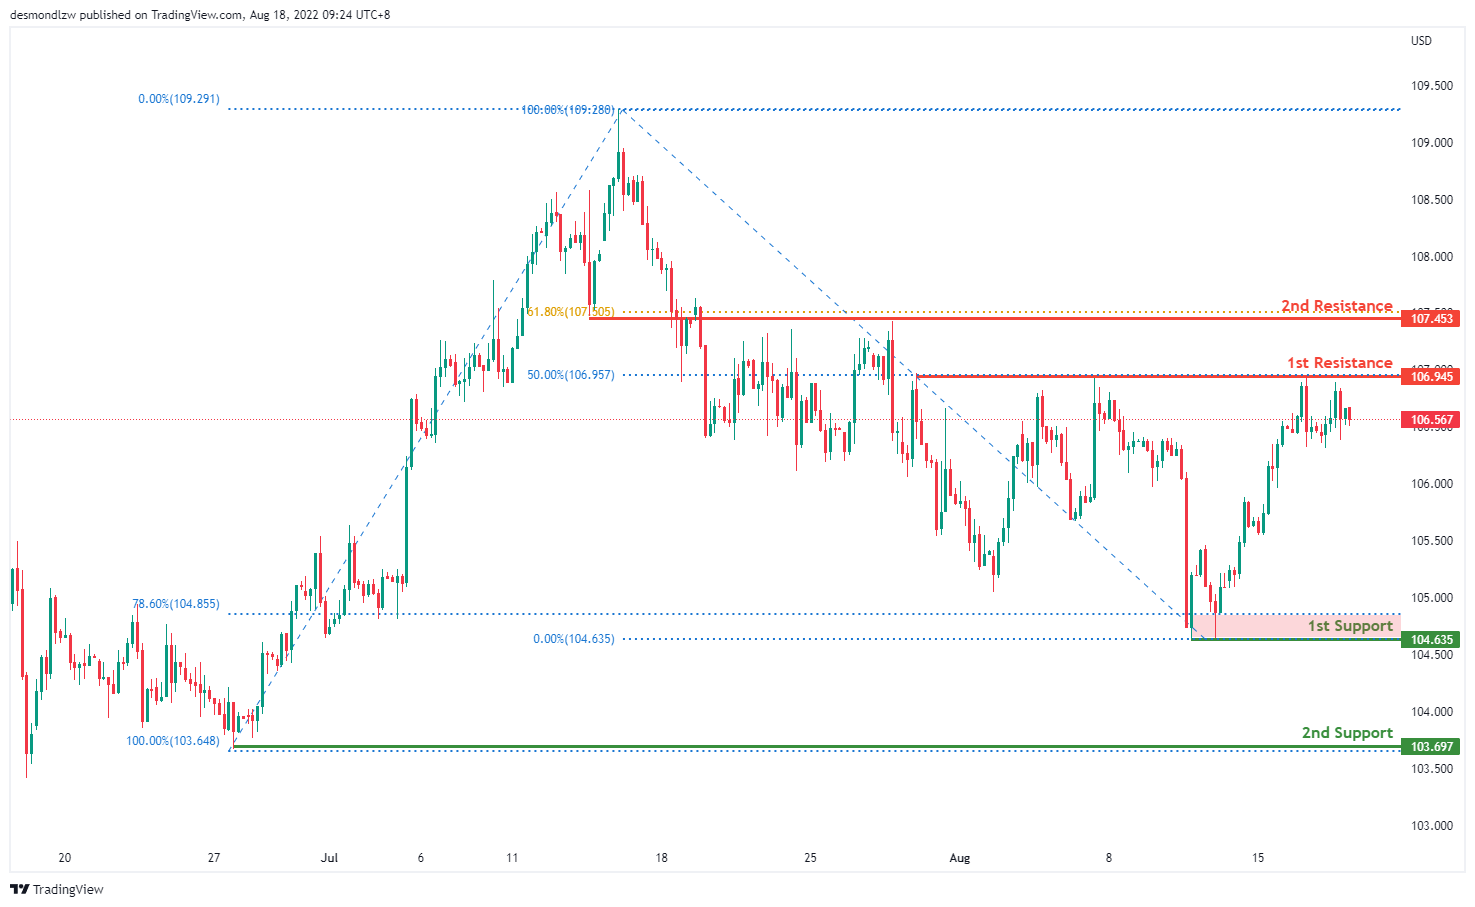
On the H4, prices seem to be moving in an ascending trend and is in a bullish momentum. Price is now around the first resistance at 106.945 where the 50% Fibonacci retracement and the previous swing high sits. We’re looking for price to test the first resistance again and if price continues with bullish momentum, it will test the second resistance at 107.453 where the 61.8% fibonacci retracement sits. If fails to break the first resistance, it will pull back to test the first support at 104.635 where the 78.6% retracement is and subsequently the second support at 103.697 which is the previous swing low
Areas of consideration:
- H4 time frame, 1st resistance at 106.945
- H4 time frame, 1st support at 104.635
EUR/USD :
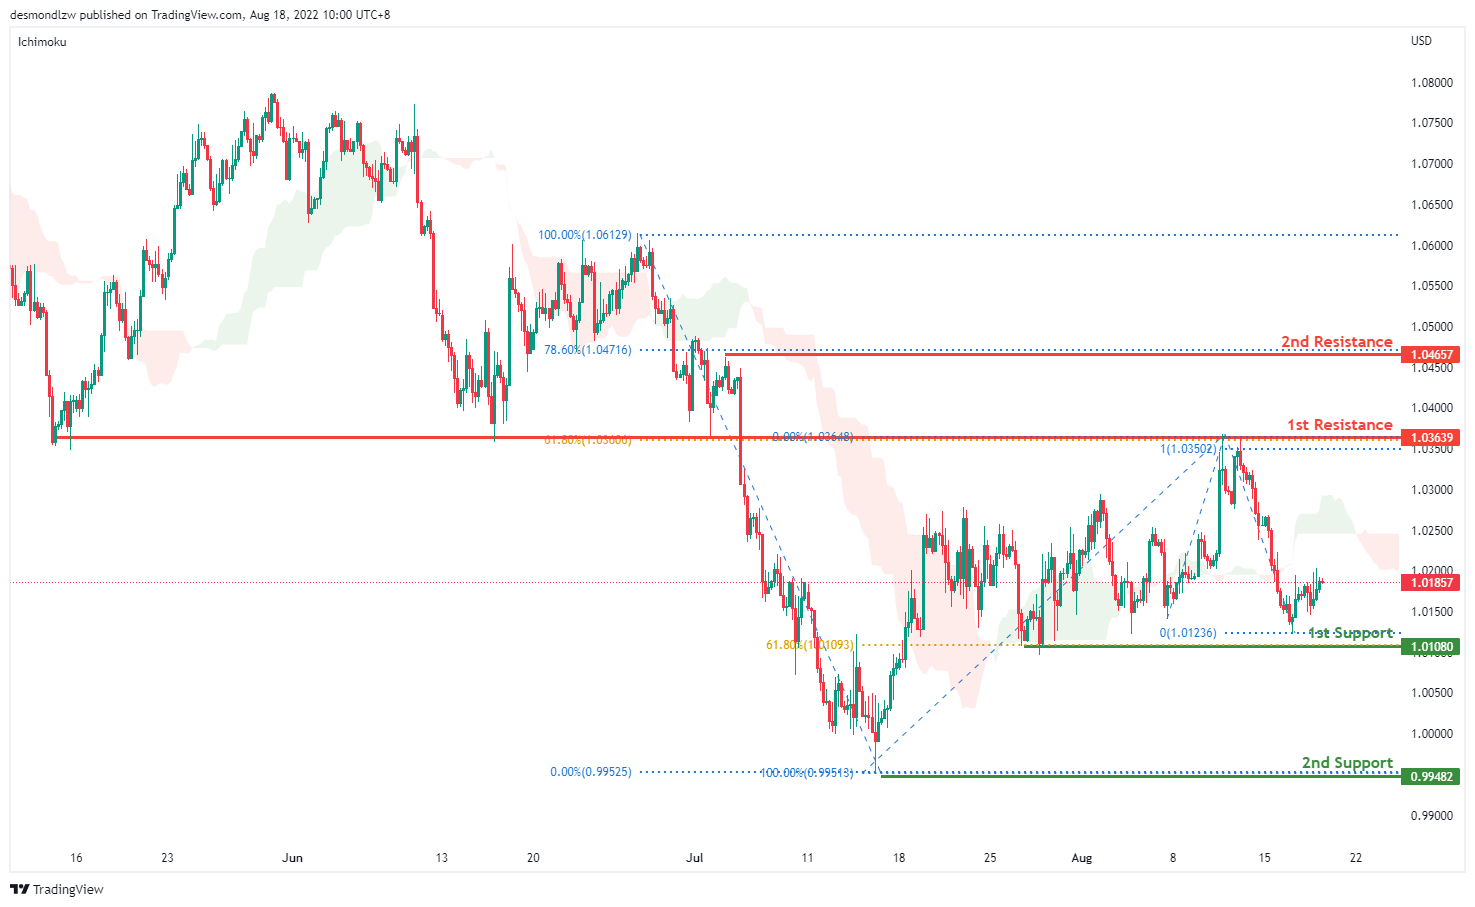
On the H4, prices have broken the ascending trend and are below the ichimoku indicator, we are bearish bias. Prices have ascended slightly but we’re looking for a pull back to test the first support at 1.0108 where the 61.8% Fibonacci retracement sits. If prices continue in the bearish momentum, it will test the second support at 0.9948. Alternatively price could go back to test the first resistance at 1.0363 where the 61.8% Fibonacci retracement sits and then the second resistance at 1.0465
Areas of consideration :
- H4 1st resistance at 1.0363
- H4 1st support at 1.0108
GBP/USD:
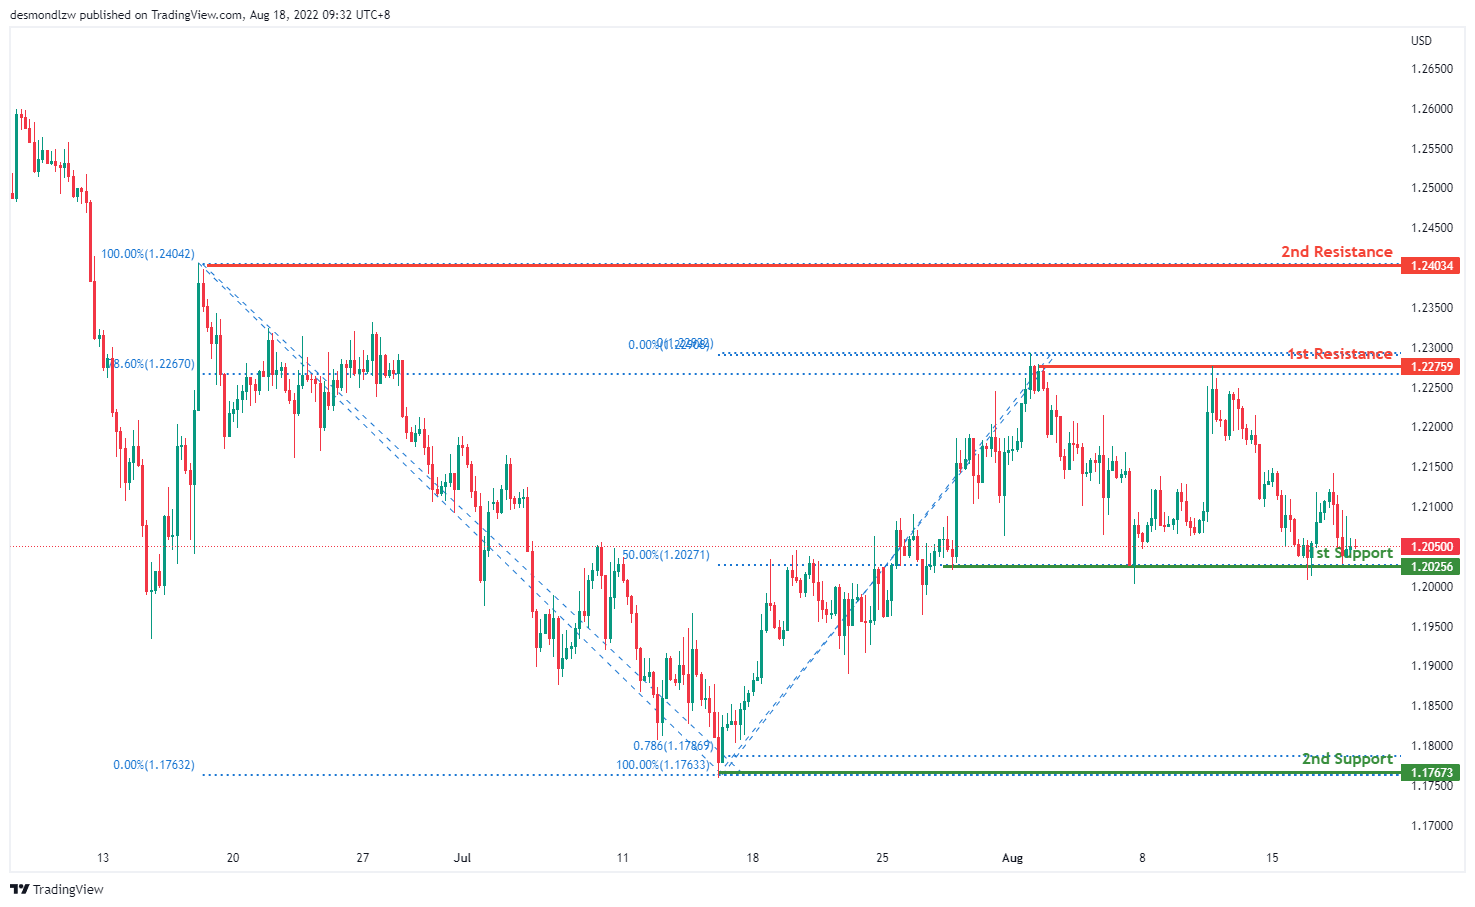
On the H4, prices seem to be in a bearish momentum. It is currently testing the 50% Fibonacci retracement and if the bearish momentum continues, it will pull prices to our first support 1.2025 where our swing low sits. If prices pull back further it will test the second support at 1.1767 where our 78.6% Fibonacci projection sits. Alternatively price could hit resistance at 1.2275 around the 78.6% projection and the first resistance at 1.2403 where the swing high sits
Areas of consideration:
- H4 1st resistance at 1.2275
- H4 1st support at 1.2025
USD/CHF:
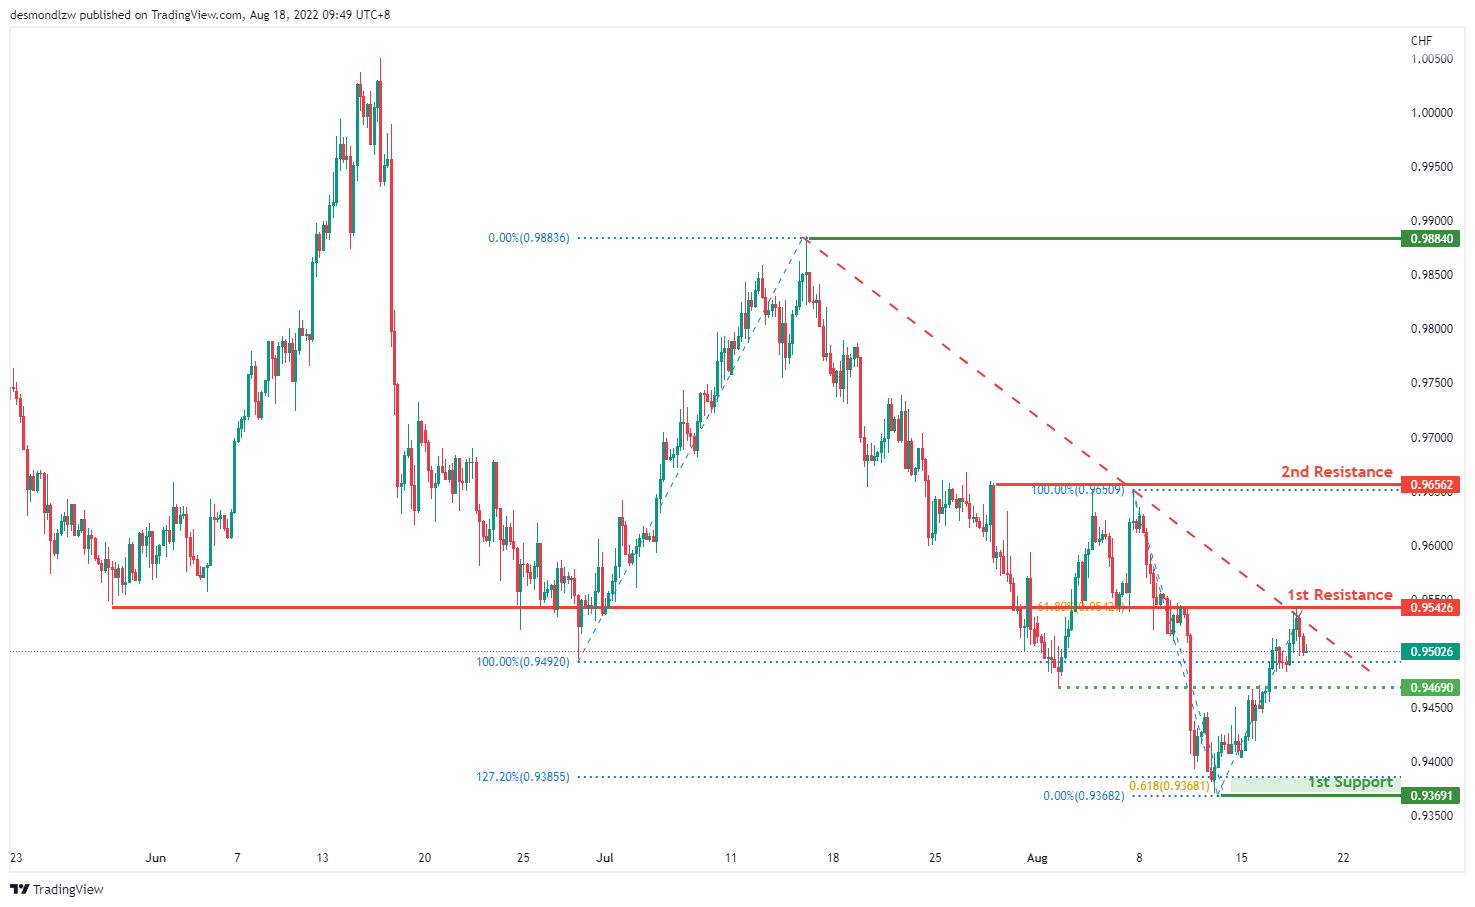
On the H4, with prices moving below the ichimoku cloud and along the descending trend, we are bearish bias that the price will continue with the bearish momentum. Price is now testing at the 61.8%% Fibonacci retracement and it may rise to test the first resistance at 0.9542 again. If bearish momentum continues, it should pull back to test at the intermediate support at 0.9468 where the previous swing low is then the first support at 0.9369 where the 61.8% projection and 127.2% extension sits
Areas of consideration
- H4 1st support at 0.9369
- H4 1st resistance at 0.9542
XAU/USD (GOLD):
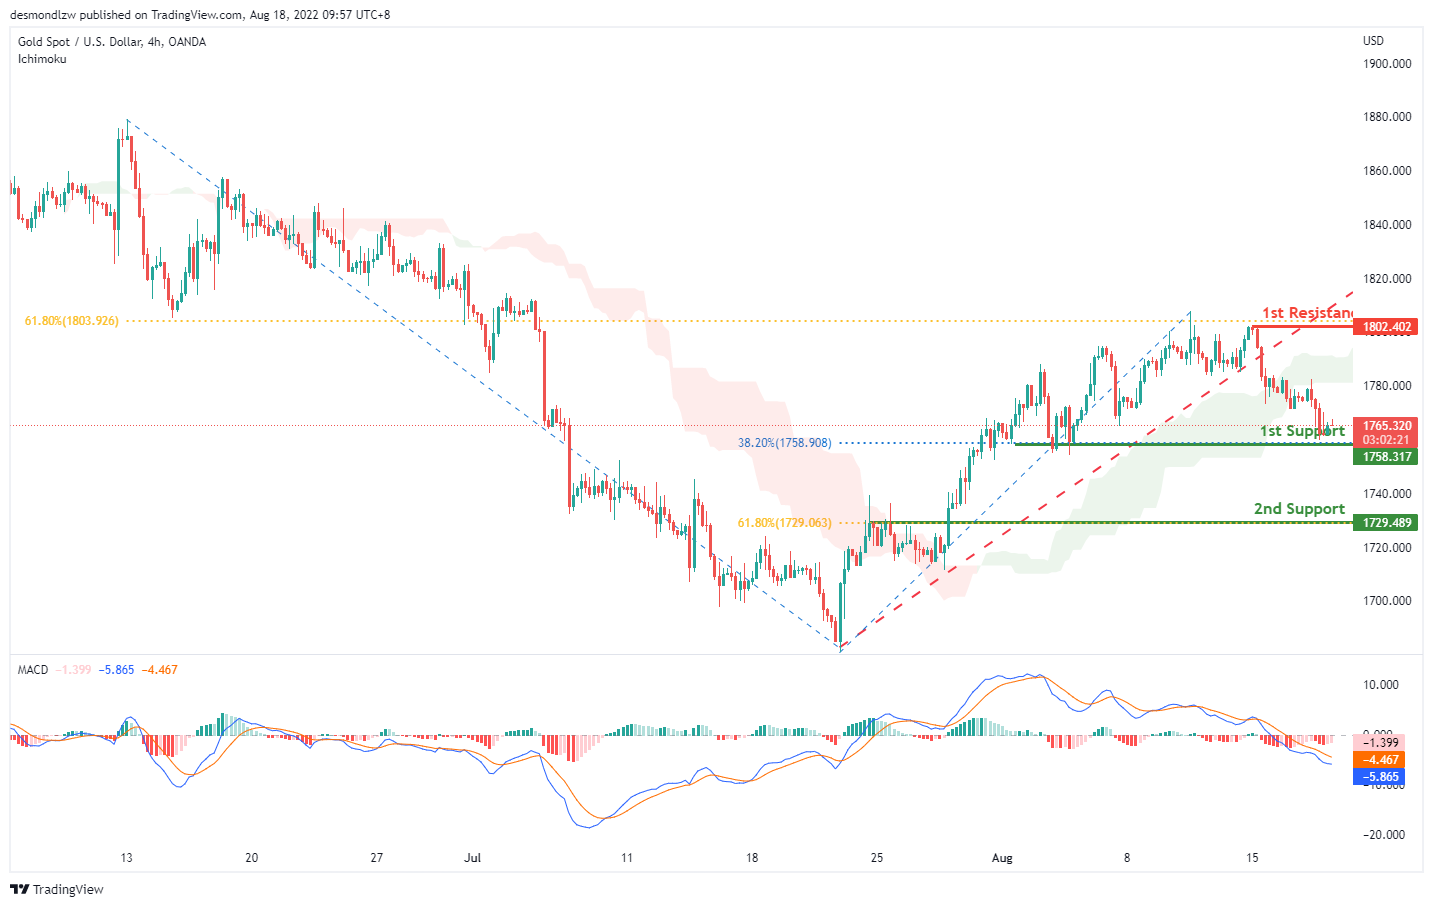
On the H4, with prices breaking the ascending trendline and MACD indicators are below zero, we have a bearish bias that the price may drop from the 1st support at 1758.317, which is in line with the overlap support to the 2nd support at 1729.489, which is in line with the pullback support and 61.8% fibonacci retracement. Alternatively, the price may rise to the 1st resistance at 1802.402, which is in line with the 61.8% fibonacci retracement and swing high.
Areas of consideration:
- H4 time frame, 1st support at 1758.317
- H4 time frame, 2nd support at 1729.489
AUD/USD:
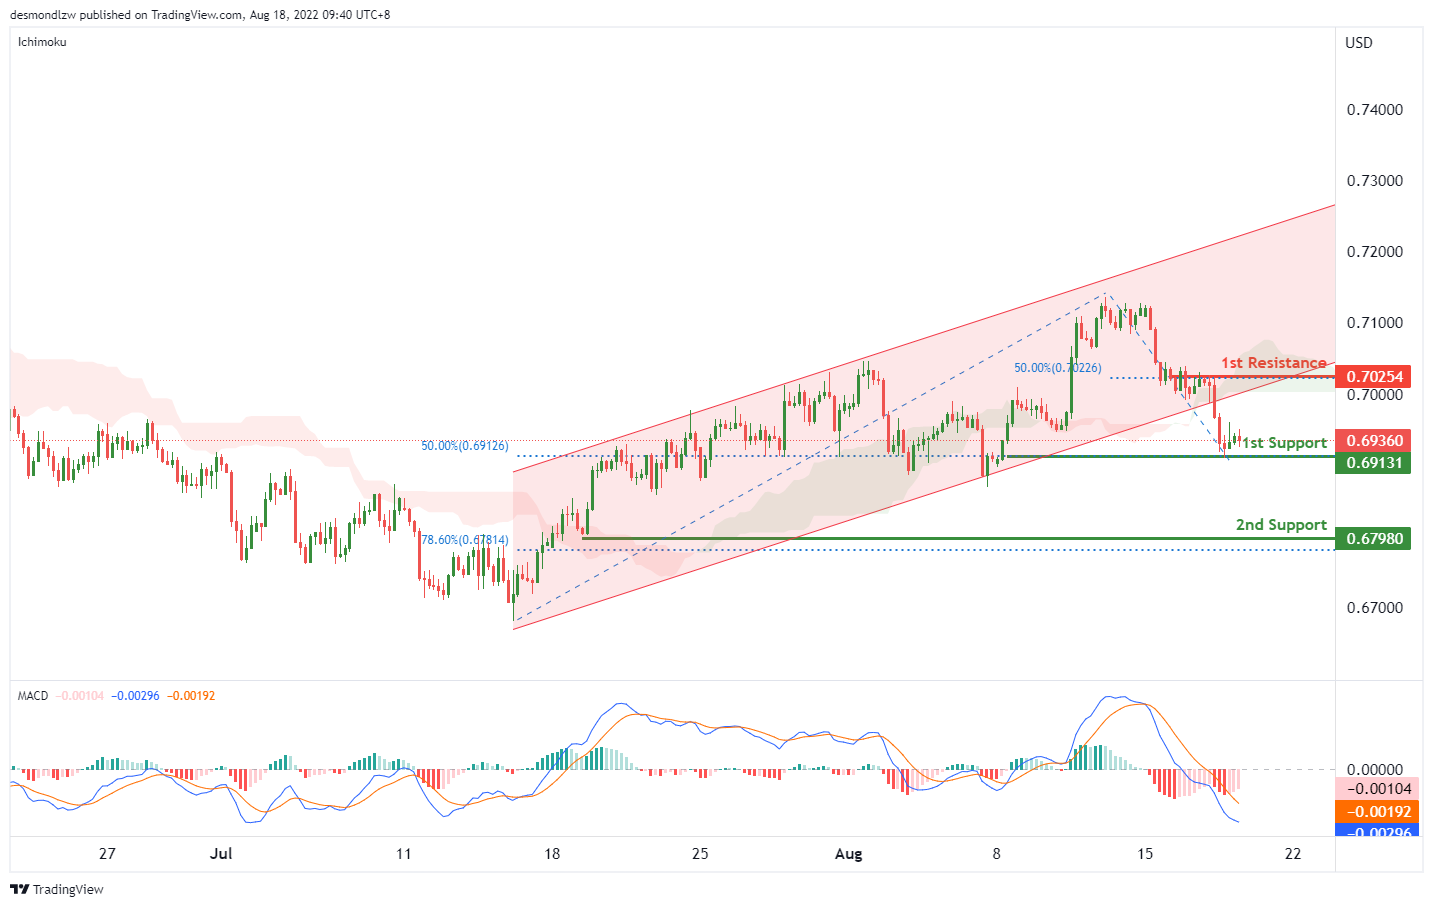
On the H4, with the MACD indicators are under zero, the price breaking the ascending channel and below the ichimoku cloud, we have a bearish bias that price may drop from the 1st support at 0.69131, where the 50% fibonacci retracement and pullback support are to the 2nd support at 0.67980, which is in line with the swing low and 78.6% fibonacci retracement. Alternatively, the price may rise to the 1st resistance at 0.70254 which is in line with 50% fibonacci retracement.
Areas of consideration
- H4 1st support at 0.69131
- H4 2nd support at 0.67980
NZD/USD:
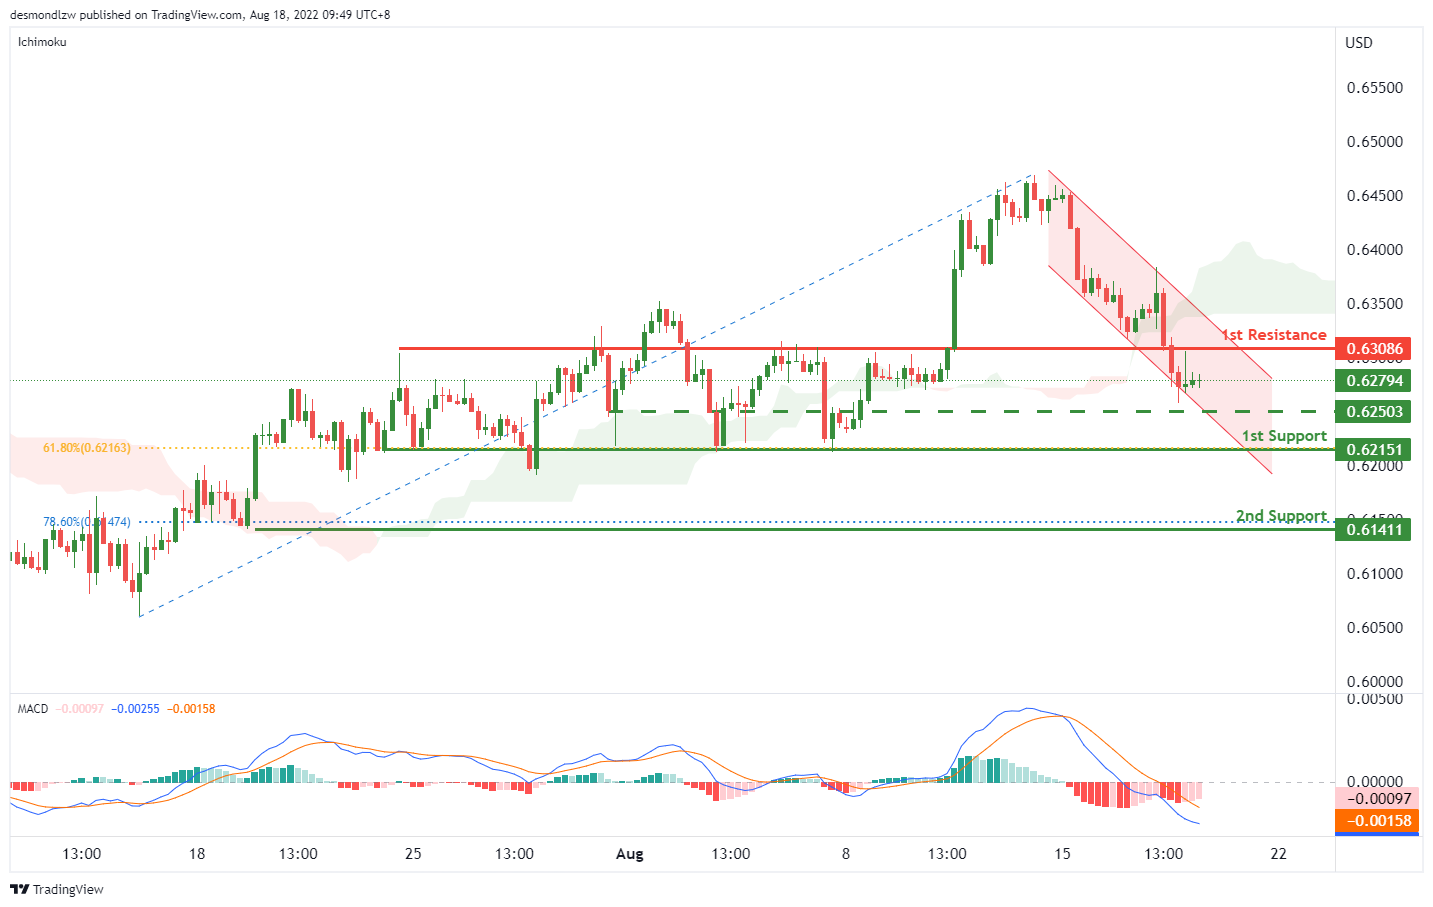
On the H4, with the price moving within the descending channel and below ichimoku cloud, we have a bearish bias that the price may drop to the 1st support at 0.62151, which is in line with the 61.8% fibonacci retracement and pervious swing lows, if the price continue dropping, the price may drop to the 2nd support at 0.61411, which is in line with the swing low and 78.6% fibonacci retracement. Alternatively, the price may rise to the 1st resistance at 0.63086, where the previous swing highs are.
Areas of consideration:
- H4 time frame, 1st support at 0.62151
- H4 time frame, 2nd support at 0.61411
USD/CAD:
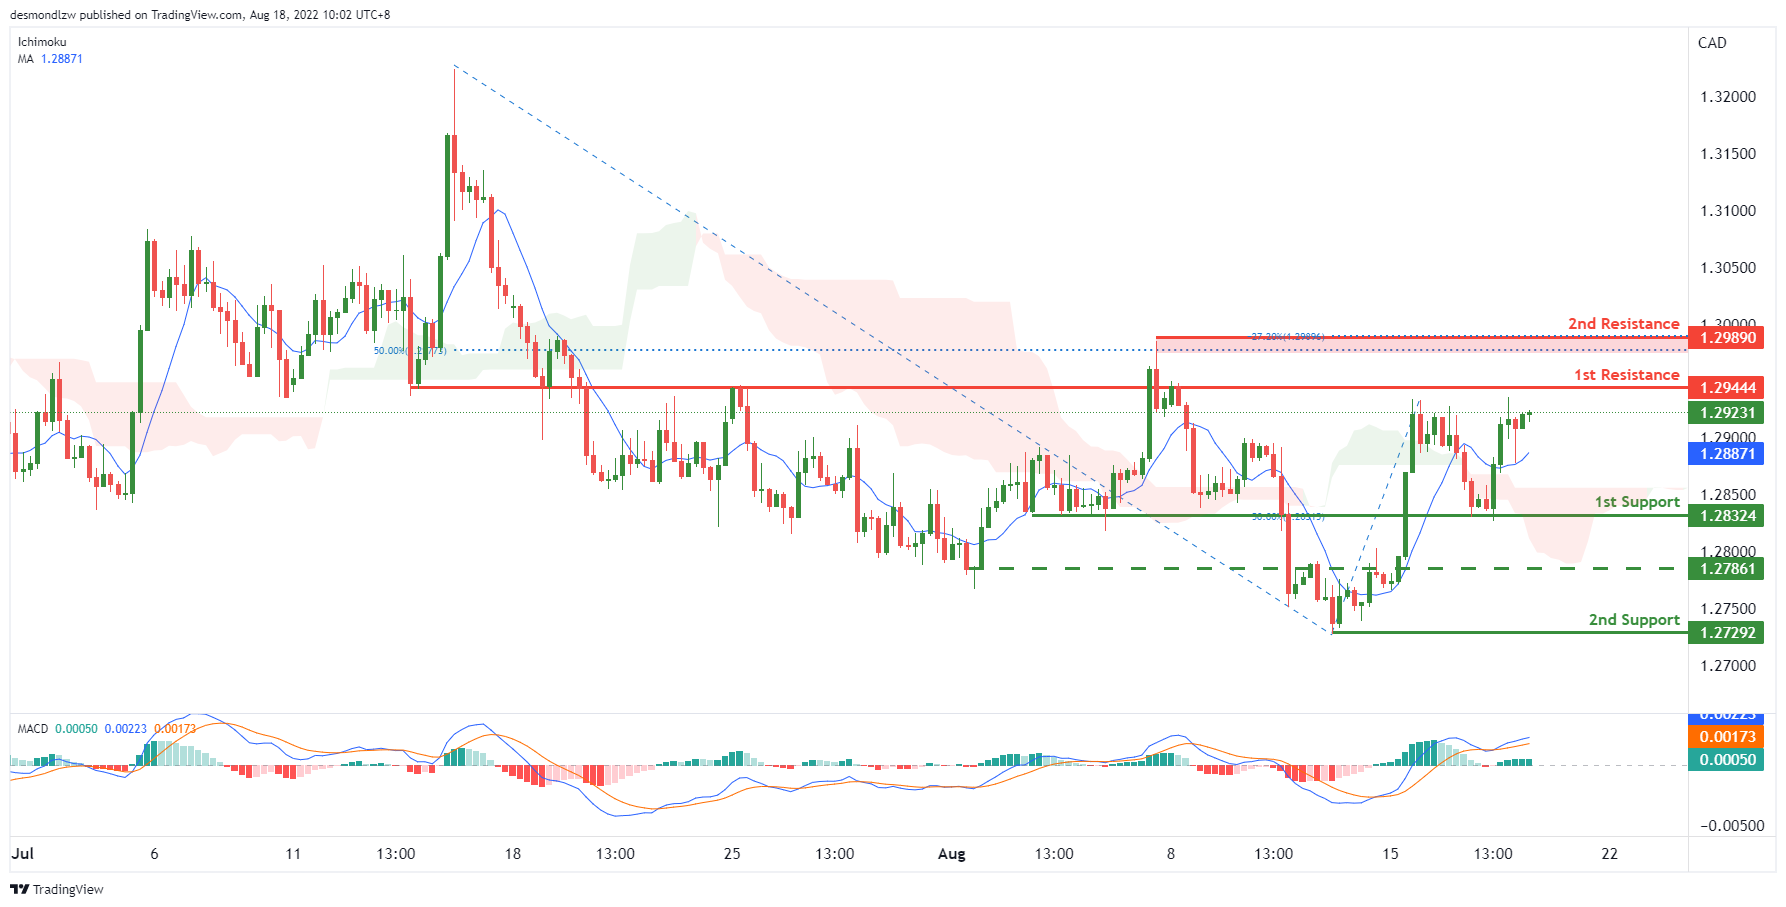
On the H4, with the MACD indicators above zero, the price is above the ichimoku cloud and MA, we have a bullish bias that the price may rise to the 1st resistance at 1.29444, which is the overlap resistance. If the price breaks the 1st resistance, it may rise to the 2nd resistance at 1.29890, where the swing high, -27.2% fibonacci expansion and 50% fibonacci retracement are. Alternatively, the piece may drop to the 1st support at 1.28324, where the swing low and 50% fibonacci retracement are. IF the price breaks the 1st support, we can expect the price drop down to the 2nd support at 1.27292, which is in line with the swing low. Take note the intermediate support at 1.27861, the price tested many times in this area.
Areas of consideration:
- H4 time frame, 1st resistance at 1.29444
- H4 time frame, 2nd resistance at 1.29890
OIL:
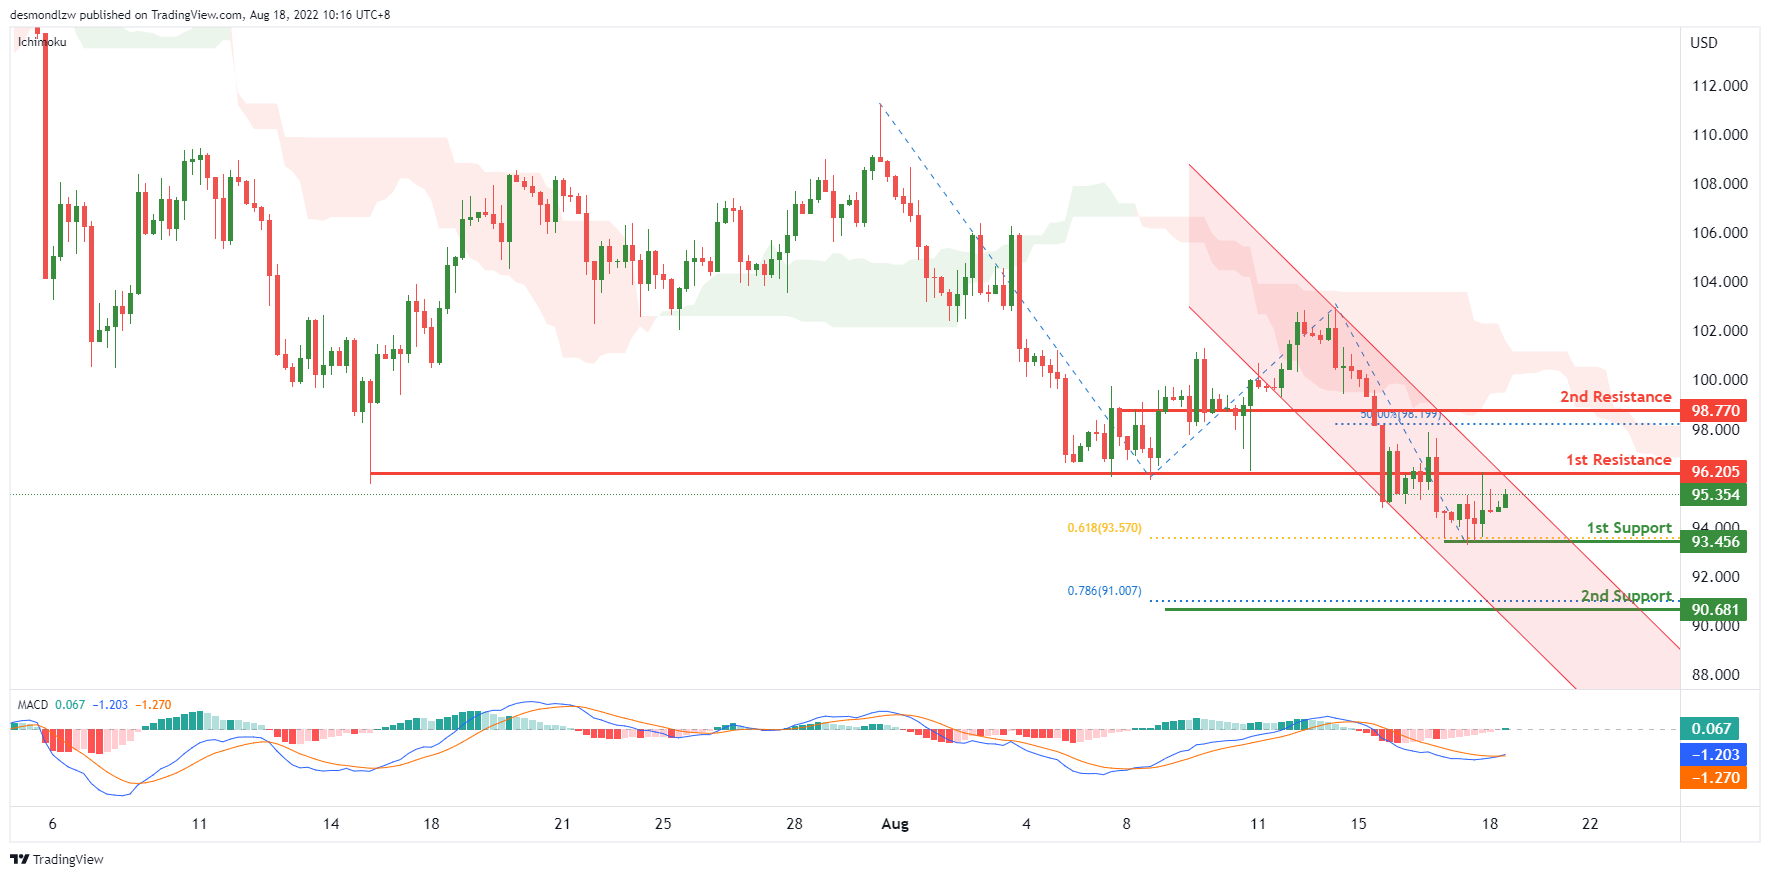
On the H4, with price moving within the descending channel, below ichimoku cloud and the MACD indicators are under zero, we have a bearish bias that the price may drop from our 1st support at 93.456, which is in line with the swing low and 61.8% fibonacci projection to the 2nd support at 90.681, which is in line with the 78.6% fibonacci projection. Otherwise, as the DIF is almost breaking the signal line, and the price is touching the upper boundary of the channel, if the price break the 1st resistance at 96.205, where the overlap resistance is , we can expect the price rise to the 2nd resistance at 98.770, where the 50% fibonacci retracement is.
Areas of consideration:
- H4 time frame, 1st support at 93.456
- H4 time frame, 2nd support at 90.681
Or
- H4 time frame, 1st resistance at 96.205
- H4 time frame, 2nd resistance at 98.770
Dow Jones Industrial Average:
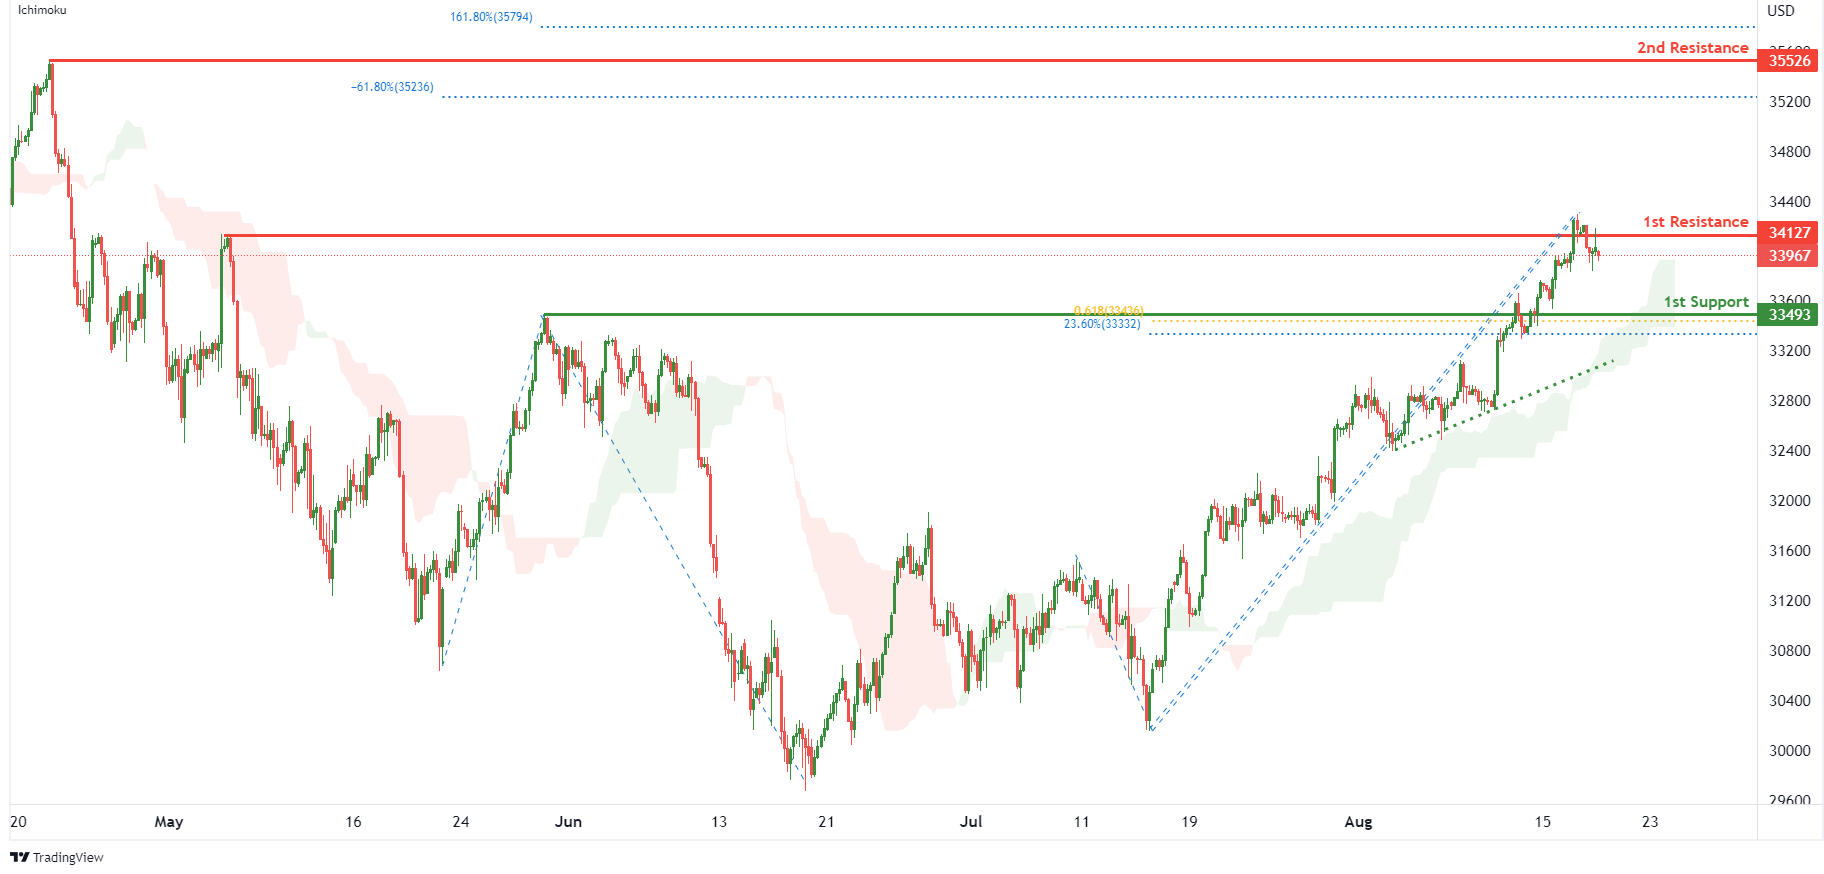
On the H4, with price moving above the ichimoku indicator and along an ascending trendline, we have a bullish bias that price will rise to 1st resistance at 34127 where the pullback resistance is. Once there is upside confirmation that price has broken 1st resistance structure, we would expect bullish momentum to carry price to 2nd resistance at 35526 where the swing high resistance, 161.8% fibonacci extension and -61.8% fibonacci expansion are. Alternatively, price could drop to 1st support at 33493 where the pullback support, 61.8% fibonacci projection and 23.6% fibonacci retracement are.
Areas of consideration:
- H4 time frame, 1st resistance of 34127
- H4 time frame, 1st support at 33493
DAX:
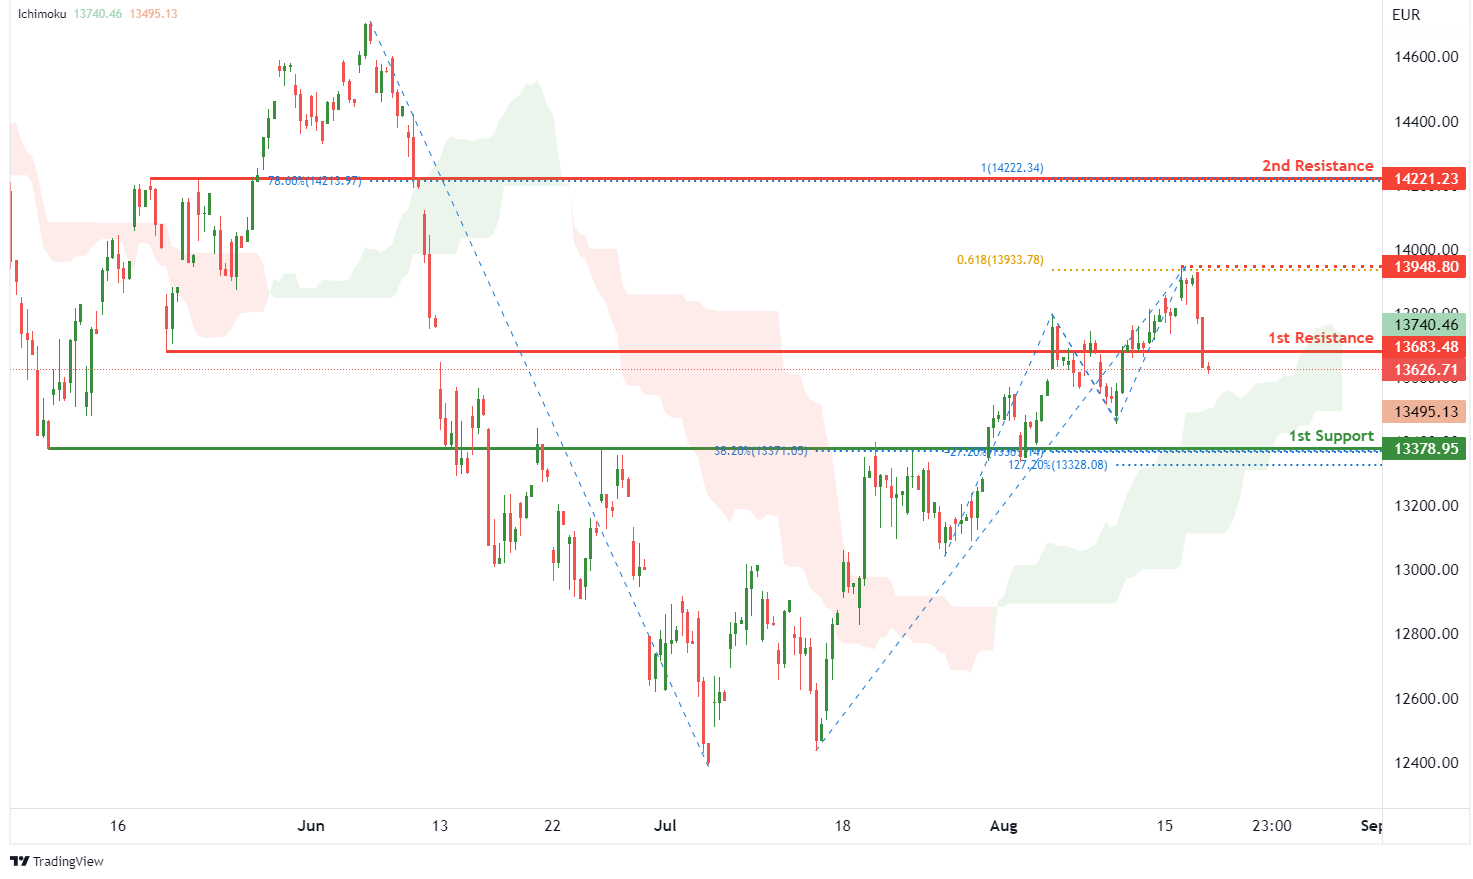
On the H4, with price moving above the ichimoku indicator, we have a bullish bias that price will rise to the 1st resistance at 13683.48 where the pullback resistance is. Once there is upside confirmation of price breaking the 1st resistance structure, we would expect price to rise to 2nd resistance at 14221.23 in line with 100% fibonacci projection and 78.6% fibonacci retracement. Take note of intermediate resistance at 13948.80 where the swing high resistance and 61.8% fibonacci projection are. Alternatively, price could drop to 1st support at 13378.95 where the overlap support, -27.2% fibonacci expansion, 127.2% fibonacci extension and 38.2% fibonacci retracement are
Areas of consideration:
- H4 time frame, 1st resistance of 13683.48
- H4 time frame, 1st support at 13378.95
ETHUSD:
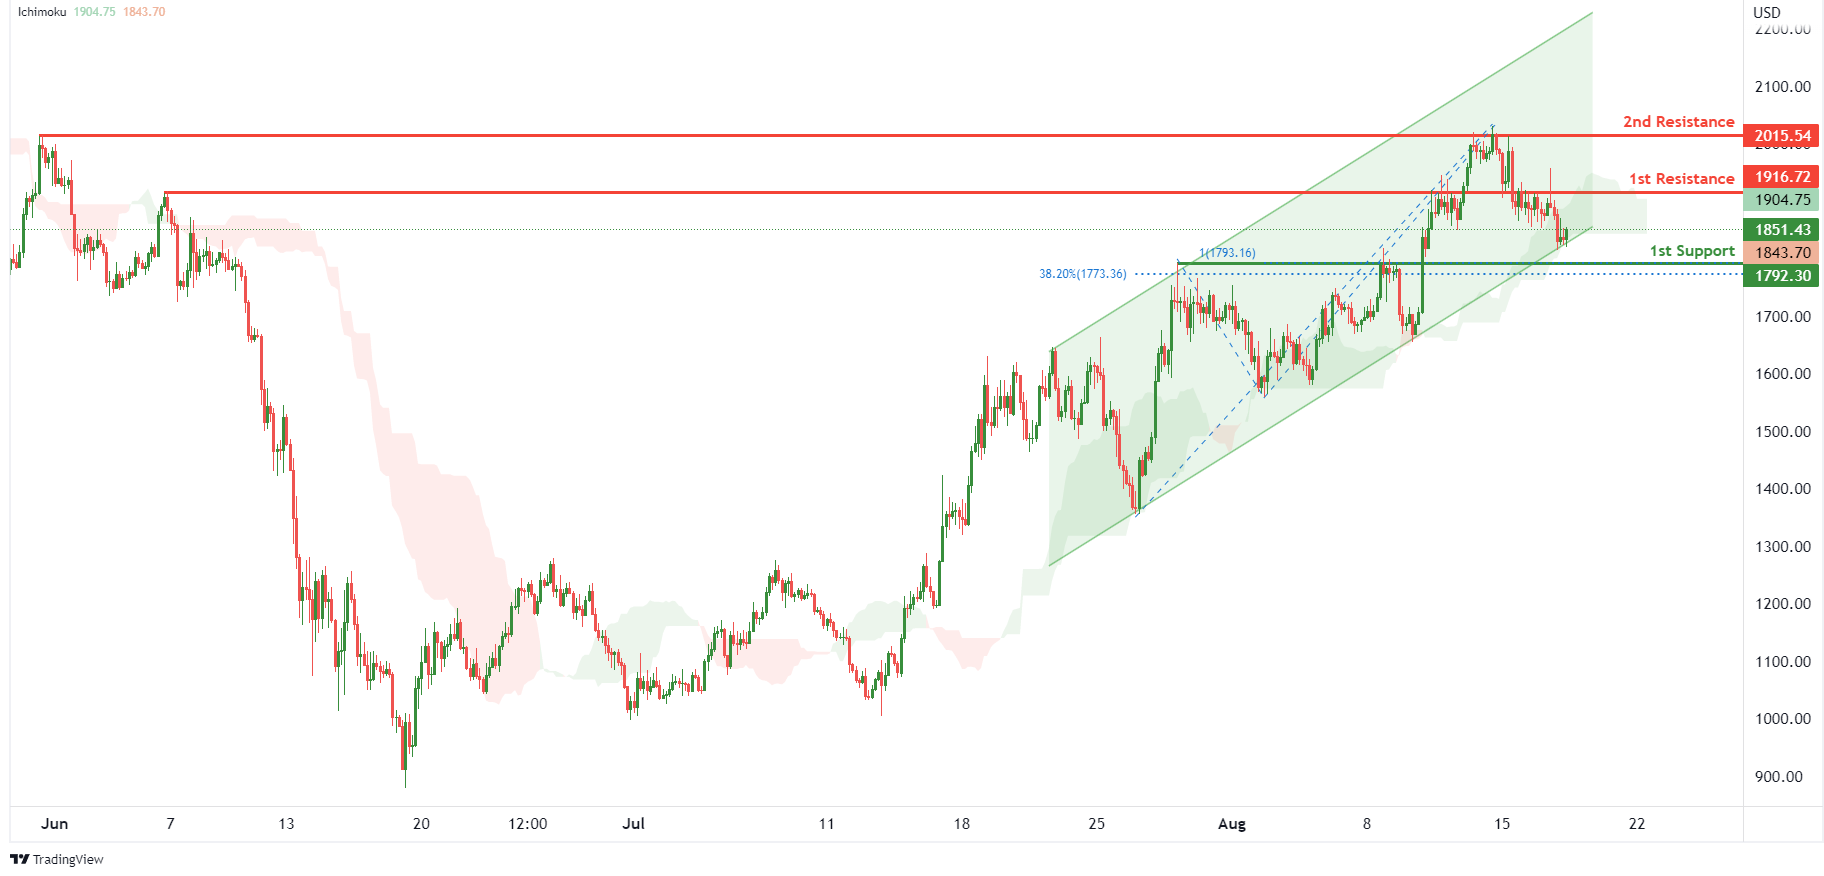
On the H4, with price moving within an ascending channel and bouncing off the ichimoku support, we have a bullish bias that price will rise to the 1st resistance at 1916.72 where the pullback resistance is. Once there is upside confirmation that price has broken 1st resistance structure, we would expect bullish momentum to carry price to 2nd resistance at 2015.54 where the swing high resistance is. Alternatively, price could drop to 1st support at 1792.30 where the overlap support, 38.2% fibonacci retracement and 100% fibonacci projection are.
Areas of consideration:
- H4 time frame, 1st resistance of 1916.72
- H4 time frame, 1st support at 1792.30
BTCUSD:
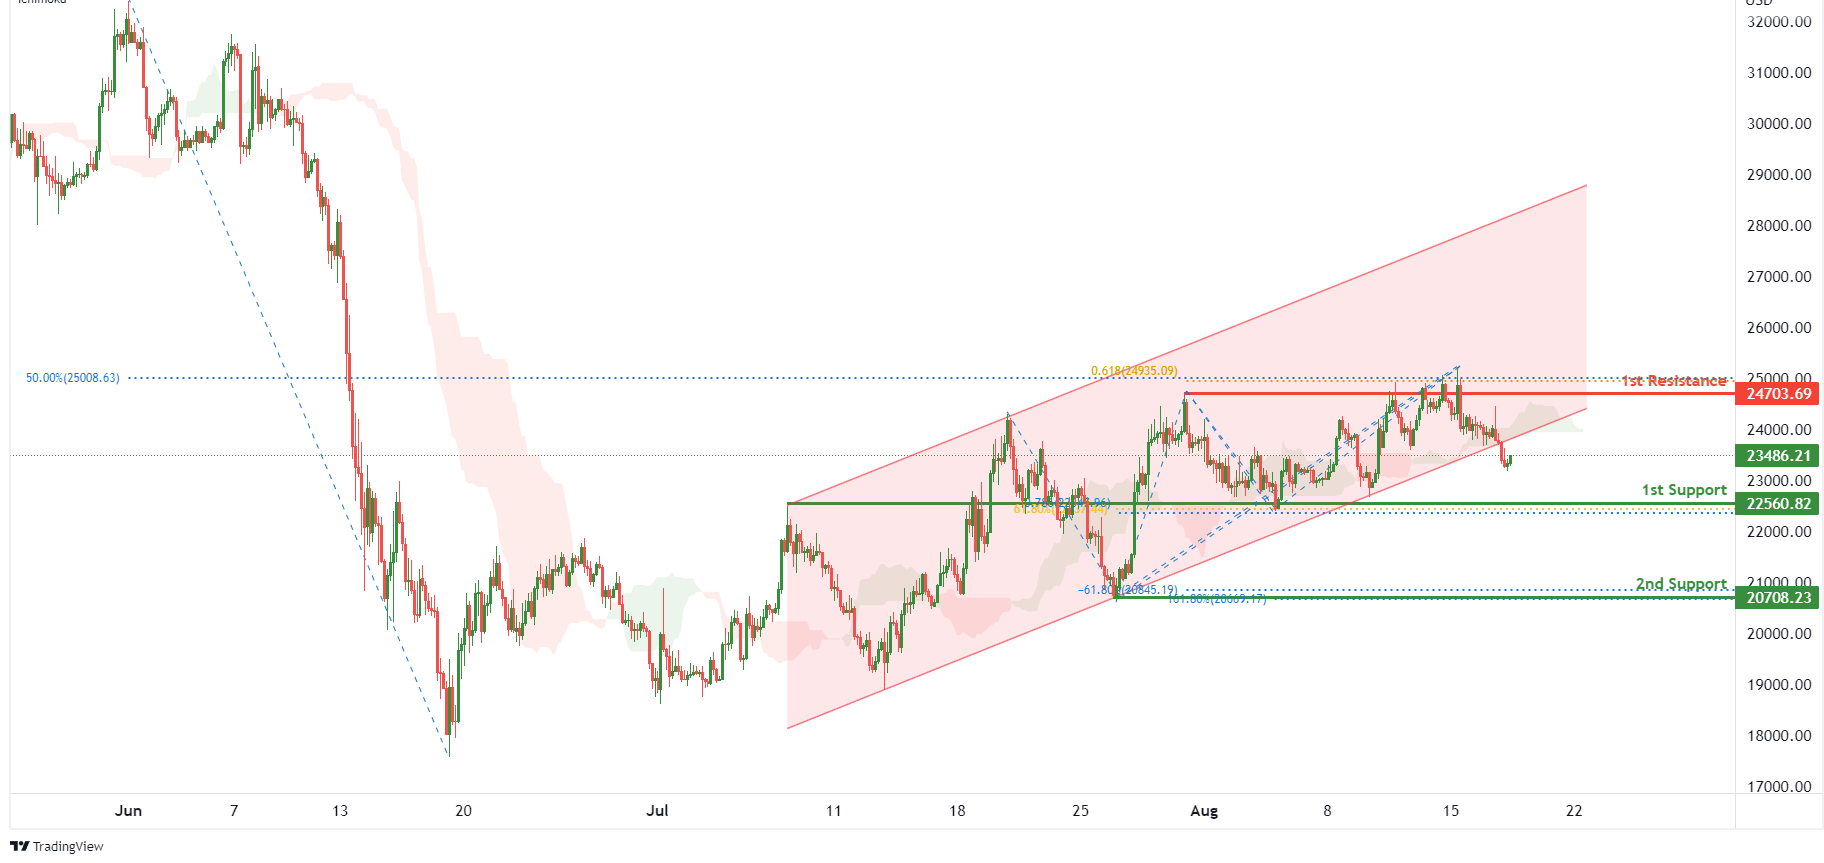
On the H4, with price breaking out of a bullish channel and moving below the ichimoku indicator, we have a bearish bias that price will drop to 1st support at 22560.82 where the pullback support, 61.8% fibonacci retracement and 78.6% fibonacci projection are. Once we have downside confirmation of price breaking 1st support structure,we would expect bearish momentum to carry price to 2nd support at 20708.23 where the -61.8% fibonacci expansion, 161.8% fibonacci extension and swing low support are. Alternatively, price could rise to 1st resistance at 24703.69 where the pullback resistance, 50% fibonacci retracement and 61.8% fibonacci projection are.
Areas of consideration:
- H4 time frame, 1st resistance of 24703.69
- H4 time frame, 1st support at 22560.82
S&P 500:
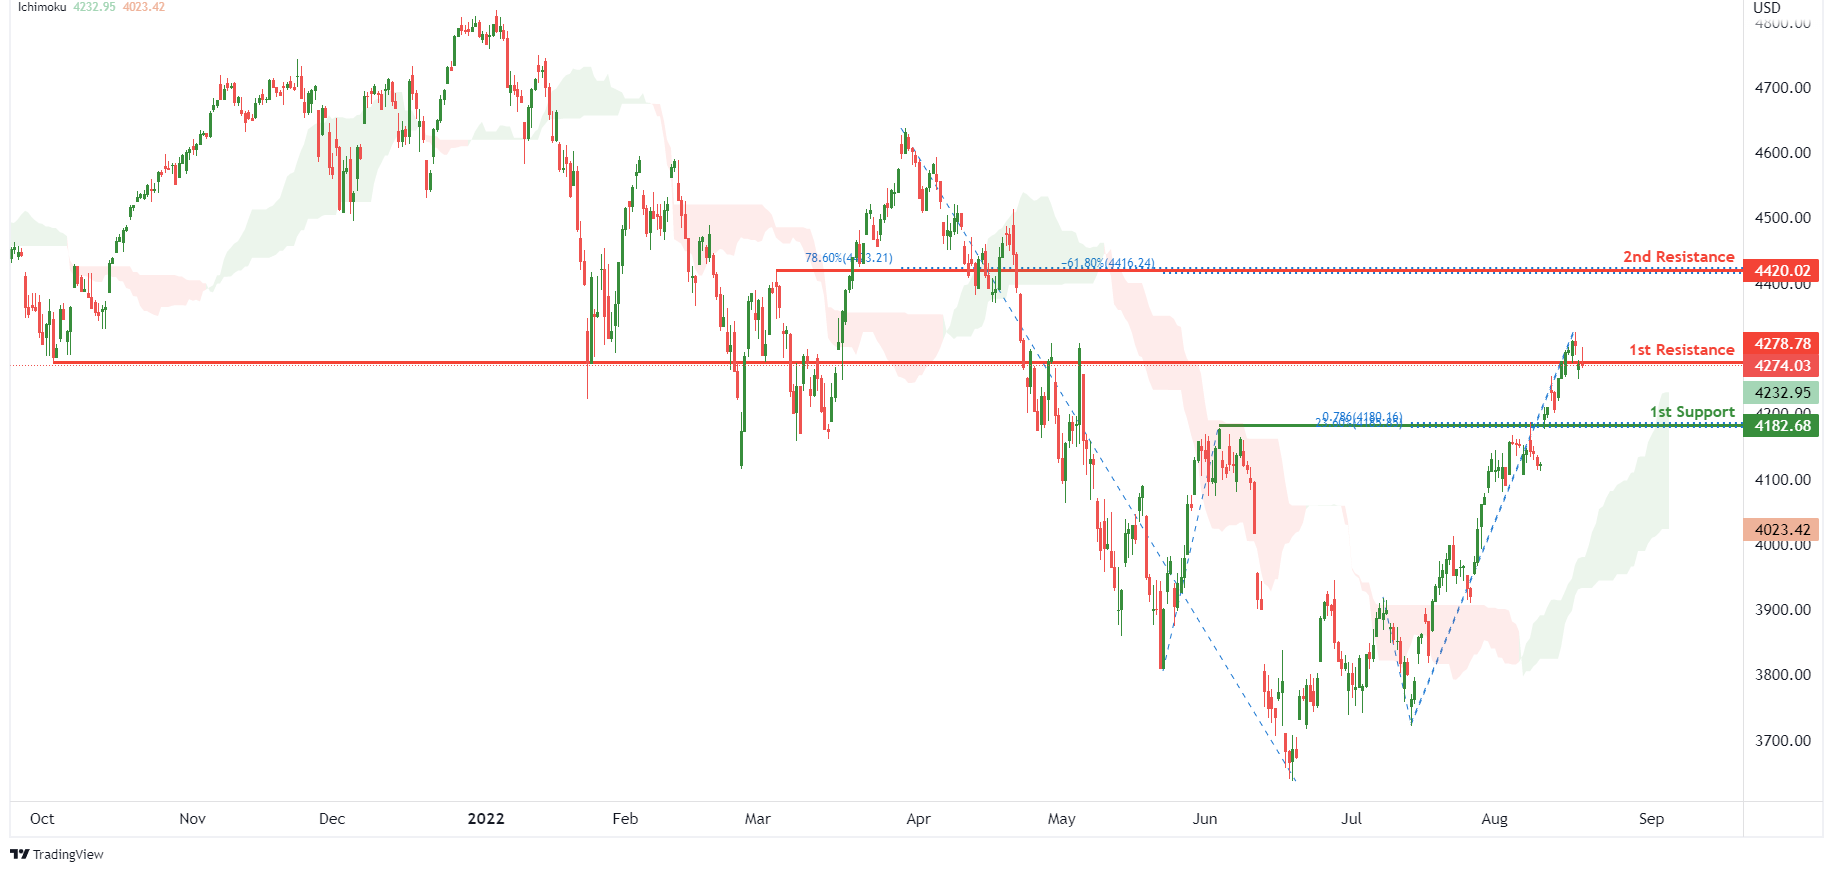
On the H4, with prices moving above the ichimoku indicator, we have a bullish bias that the price will rise to 1st resistance at 4278.78 where the overlap resistance is. Once there is upside confirmation that price has broken the 1st resistance structure, we would expect bullish momentum to carry price to 2nd resistance at 4420.02 where the pullback resistance, 78.6% fibonacci retracement and -61.8% fibonacci expansion are. Alternatively, price could drop to 1st support at 4182.68 where the pullback support, 78.6% fibonacci projection and 23.6% fibonacci retracement are.
Areas of consideration:
- H4 time frame, 1st resistance of 4278.78
- H4 time frame, 1st support at 4182.68
Crude Oil Price Drops To 6-Month Low, Upsides Limited
Key Highlights
- Crude oil price started a fresh decline from the $95.50 resistance.
- It is now facing hurdles near $89.50 and $90.00 on the 4-hours chart.
- Gold price corrected lower and traded below the $1,780 support.
- EUR/USD and GBP/USD remain at a risk of more losses.
Crude Oil Price Technical Analysis
After a minor recovery wave, crude oil price faced sellers near $95.50 against the US Dollar. The price started a fresh decline below the $92.50 support zone.
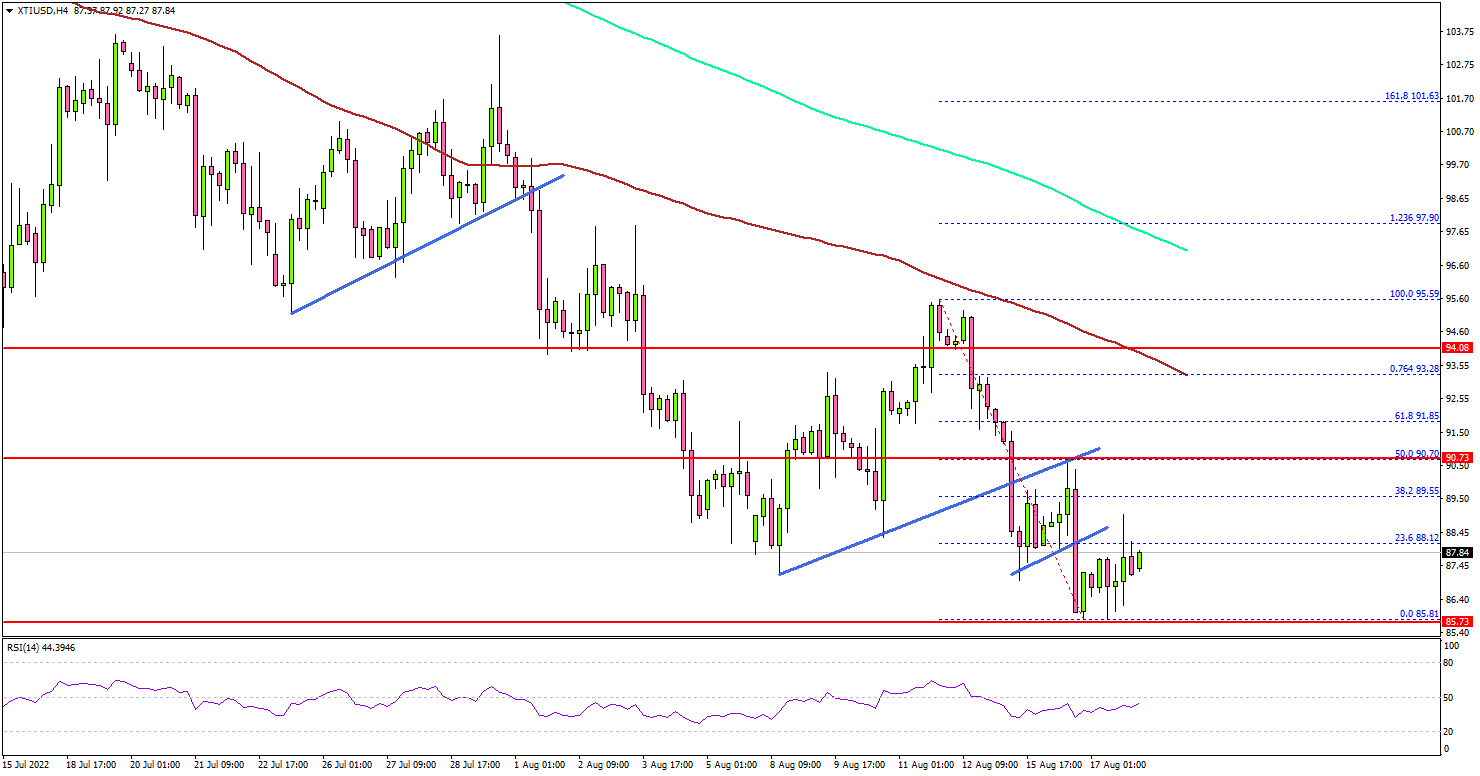
Looking at the 4-hours chart of XTI/USD, there was a break below the $92.00 and $90.00 levels. The price even settled below the $90 level, the 100 simple moving average (red, 4-hours) and the 200 simple moving average (green, 4-hours).
During the decline, the price traded below a couple of connecting trend lines at $89.50 and $88.10 on the same chart. The price traded as low as $85.81 and is currently consolidating losses.
On the upside, the price is facing resistance near the $89.50 and $90.00 levels. A clear move above the $90.00 resistance could set the pace for a larger increase towards $92.50. The next major resistance is near $95.50, above which the price could accelerate higher towards the $100 zone.
Conversely, the price might resume its decline below the $86.00 level. The next major support is near $85.50. The main support sits near $83.20, below which there is a risk of a move towards the $80.00 level. Any more losses might call for a test of the $78 zone.
Looking at the EUR/USD pair, the pair struggled to correct higher and there is a clear risk of a move below the 1.0100 support zone.
Economic Releases to Watch Today
- US Initial Jobless Claims - Forecast 265K, versus 262K previous.
- US Existing Home Sales for July 2022 (MoM) - Forecast -5.2%, versus -5.4% previous.
Fed Minutes Showed Continued Commitment to Bringing Inflation Back to Target
The minutes from the July 26-27, 2022 Federal Open Market Committee (FOMC) meeting showed that curtailing inflation remains of paramount importance to the Fed.
On the progression of the economy, the Committee members noted that "recent indicators of spending and production had softened. Nonetheless, job gains had been robust in recent months, and the unemployment rate had remained low. Inflation remained elevated, reflecting supply and demand imbalances related to the pandemic, higher food and energy prices, and broader price pressures."
The Committee also stated that "inflation remained unacceptably high and was well above the Committee’s longer run goal of 2 percent." Additionally, participants noted that increases in inflation were broad based and that they have seen little evidence that inflation has begun to abate.
Members of the Committee stated that "the war and related events were creating additional upward pressure on inflation and were weighing on global economic activity."
Committee members anticipated that "ongoing increases in the target range for the federal funds rate would be appropriate to achieve the Committee’s objectives." Nevertheless, the pace and extent of future policy tightening would depend on the prevailing macroeconomic backdrop.
For the first time FOMC members acknowledged that "the constantly changing nature of the economic environment and the existence of long and variable lags in monetary policy’s effect on the economy, there was also a risk that the Committee could tighten the stance of policy by more than necessary to restore price stability."
Key Implications
The minutes confirmed that re-establishing price stability remains the principal objective of the Fed. The uncertainty surrounding the Russia-Ukraine conflict will only add to the upside risk. Additionally, the labor market has continued to strengthen, with employment having surpassed pre-pandemic levels and the unemployment rate on par with its February 2020 level. The Fed also acknowledged that their task is highly uncertain, and there is a risk that it could tighten rates by "more than necessary".
Markets have been worried about exactly that risk. Recession fears have continued to mount, with some surveys showing that the probability of a recession within the next 12-months has increased to 50%. These fears have also been reflected in the spread between the U.S. 10-year and 2-year treasury yields, which remains in negative territory. We expect the Fed will continue to raise rates this year, before taking a pause to monitor the impacts of its actions on economic activity and inflation.
EURAUD Wave Analysis
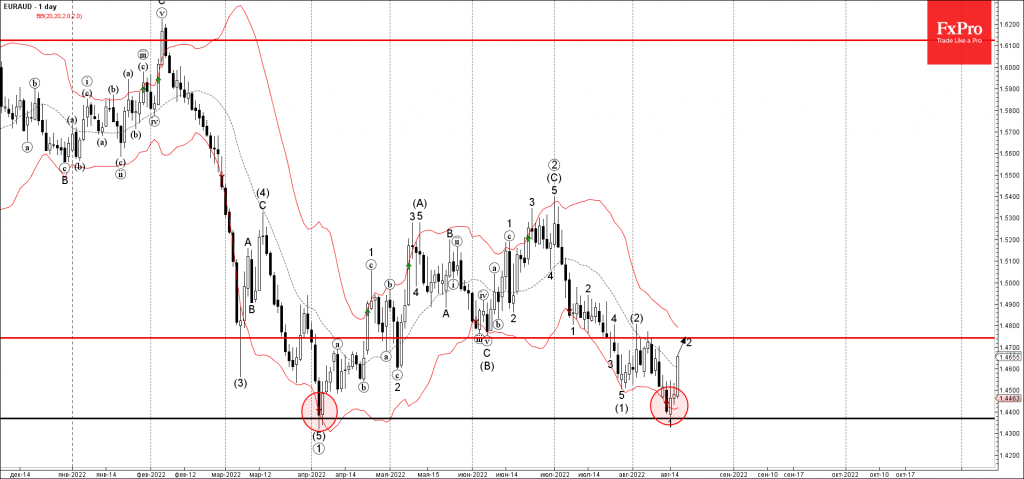
- EURAUD reversed from support level 1.44
- Likely to rise to resistance level 1.4740
EURAUD currency pair recently reversed up sharply from the powerful support level 1.4400 (which previous stopped the sharp downtrend in April, as can be seen below).
The upward reversal from the support level 1.4400 started the active minor correction 2.
Given the strength of the nearby support level 1.4400, strong bullish euro sentiment, EURAUD can be expected to rise further toward the next resistance level 1.4740 (former monthly low from June, target for the end of wave 2).
GBPNZD Wave Analysis
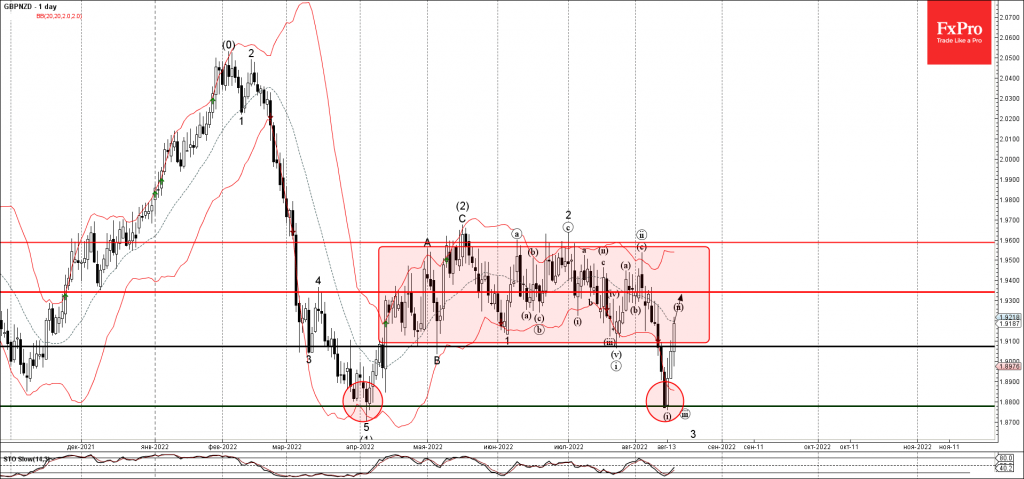
- GBPNZD broke key resistance level 1.9100
- Likely to rise to resistance level 1.9270
GBPNZD recently broke above the key resistance level 1.9100 (former lower boundary of the sideways price range inside which the pair has been trading from the middle of April).
The breakout of the resistance level 1.9100 accelerated the active short-term ABC correction (ii).
Given the bullish sterling sentiment seen today, GBPNZD can be expected to rise further toward the next resistance level 1.9270 (middle of the aforementioned sideways price range and the target for the completion of the active wave (ii)).
UK Inflation Unexpectedly Reached Double Digits (First Time Since 1982) in July
Markets:
A dramatic sell-off in core bonds marked today’s market action. A number of smaller events culminated an impressive move. Yesterday’s earnings by US retailers Wallmart and Home Depot set things in motion. They beat consensus, putting away most pessimistic growth scenarios. Today’s US retail sales flatlined for the headline numbers, but were more upbeat for the underlying trend (excluding auto and gas; +0.7% M/M). The retail sales control group, proxy for consumption in GDP calculations, even accelerated to 0.8% M/M. The data confirm the resilience of the US consumer amid galloping inflation.
This morning’s RBNZ meeting was a second eye-catcher. The New Zealand central bank, frontrunner amongst major central banks, hiked its policy rate as expected by 50 bps to 3%, but also signaled a more hawkish policy rate path ahead. This includes a higher policy rate peak (>=4%) and a longer period of time with a restrictive policy rate (first rate penciled in early 2025). The RBNZ meeting is a warning shot for investors betting that weak growth would soon sideline centrale banks in their inflation crusade.
Finally, and probably most importantly, UK inflation unexpectedly reached double digits (first time since 1982) in July. The data print put the onus back on price pressure following the July recession scare. Recall that the Bank of England accelerated its tightening cycle with a first 50 bps rate hike with BoE governor Bailey adding that markets shouldn’t take this for granted as becoming the new standard. Eco data would decide on the magnitude of future moves. Well, they have decided. Also taking into account yesterday’s decent UK labour market report. A similar sound came from the ECB and Fed gatherings.
We might see hawkish FOMC Minutes tonight against the background of the gloomy economic outlook. At least three Fed governors downplayed the possibility of pausing the rate hike cycle or thinking about 2023 policy rate cuts following last week’s US CPI print. US inflation decelerated more than expected, from 9.1% Y/Y to 8.5% Y/Y.
UK Gilts underperformed German Bunds and US Treasuries. The UK yield curve bear flattens with yields adding 24.5 bps (!) (2-yr) to 15.2 bps (30-yr). The UK 2-yr yield surged above the June peak, currently trading near 2.4%. UK money markets put the policy rate peak around 3.75% (currently 1.75%!) by May next year. German yields copy the yield move, though daily changes are “limited” to +14.2 bps at the front end and +6.8 bps at the very long end. The German 10-yr yield easily surpassed 1%, breaking out the downward corrective trend channel in place since mid-June and changing the technical picture. The US yield curve becomes more inverse with yields adding 8.6 bps (2-yr) to 4.9 bps (30-yr).
Sterling failed to profit from the interest rate advantage with EUR/GBP higher at 0.8425 in a technically insignificant move. EUR/USD in a same vein trades stable near 1.0160. Stock markets get a flashback to the tough ride ahead of June. The core bond sell-off spills into weaker equity markets with Europe losing up to 1.5% (German Dax) and main US indices ceding up to 1% (Nasdaq).
News Headlines:
Polish and Hungarian growth decoupled in the second quarter of the year. Hungarian GDP beat consensus by growing by 1.1% Q/Q (6.5% NSA Y/Y) whereas Polish GDP was weaker-than-expected, declining by 2.3% Q/Q (5.3% Y/Y). Neither country published details yet, but we expect net exports to be a huge drag for both. Poland is now probably headed for a technical recession. Other factors at play are likely the conflict in Ukraine and disappointing inflows from EU funds. Today’s surge in core bond yields continues to weigh on CEE currencies. EUR/HUF temporary approached 410 before falling back towards 405. The Polish zloty was local outperformer earlier this week, but can’t escape the laws of gravity this time. EUR/PLN rises from 4.67 to 4.70.
Aussie Slides Below 70
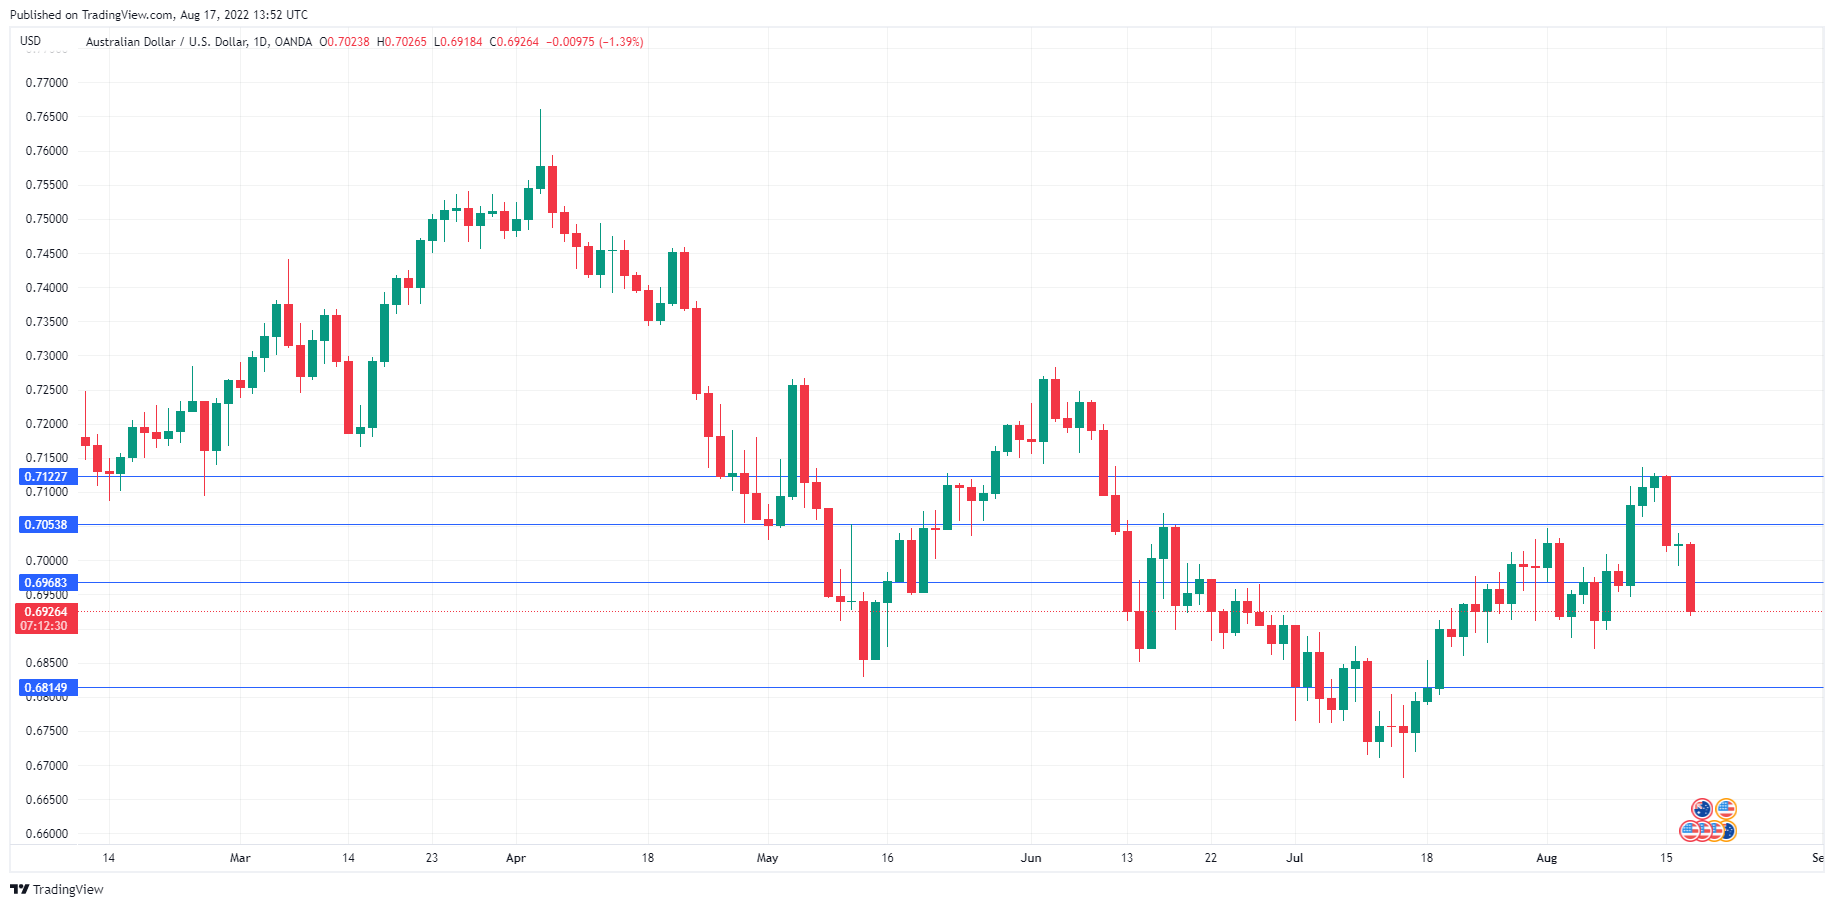
The Australian dollar is taking it on the chin today. In the North American session, AUD/USD is trading at 0.6925, down 1.30% on the day.
China’s weakness weighing on Aussie
The Australian dollar is having a miserable week, down 2.76%. This has wiped out almost all of last week’s gains of 3.05%, as the Aussie continues to show strong volatility.
This week’s woes have been driven by developments in China. The People’s Bank of China surprised the markets by lowering its 1-year MLF loans to 2.75%, down from 2.85%. The spike in Covid cases and the worsening property crisis have resulted in a decline in credit growth, and the PBOC has loosened policy in response to the deteriorating economic conditions. A sneeze in China can result in a nasty cut for Australia, as the Asian giant is Australia’s number one trading partner. Fears of a significant slowdown in China have sent commodity prices lower, including iron ore, a key Australian export.
Earlier today, Australian wage growth rose to 2.6% YoY in the second quarter, short of the estimate of 2.7% (2.4% prior). The RBA considers wage growth an important indicator of the resilience of inflation, and a lower-than-expected reading lends support to the argument that the RBA might ease up on the size of future rate increases. This has also weighed on the Australian dollar today.
The Federal Reserve has been consistent in its message that inflation is far from beaten and additional rate hikes are coming. But is anyone listening? Since the surprising inflation report which showed a decline in CPI, the markets have been holding onto the idea that the Fed will reverse directions next year, which has sent the US dollar sharply lower. The Fed minutes will be released later today, and it’s likely that the tone of the minutes will be hawkish. It will be interesting to how investors respond, and the minutes should be treated as a market-mover for the US dollar.
AUD/USD Technical
- There is resistance at 0.7053, followed by a monthly resistance line at 0.7122
- AUD/USD has support at 0.6968 and 0.6902
Japan CPI Inflation to Come in Hotter
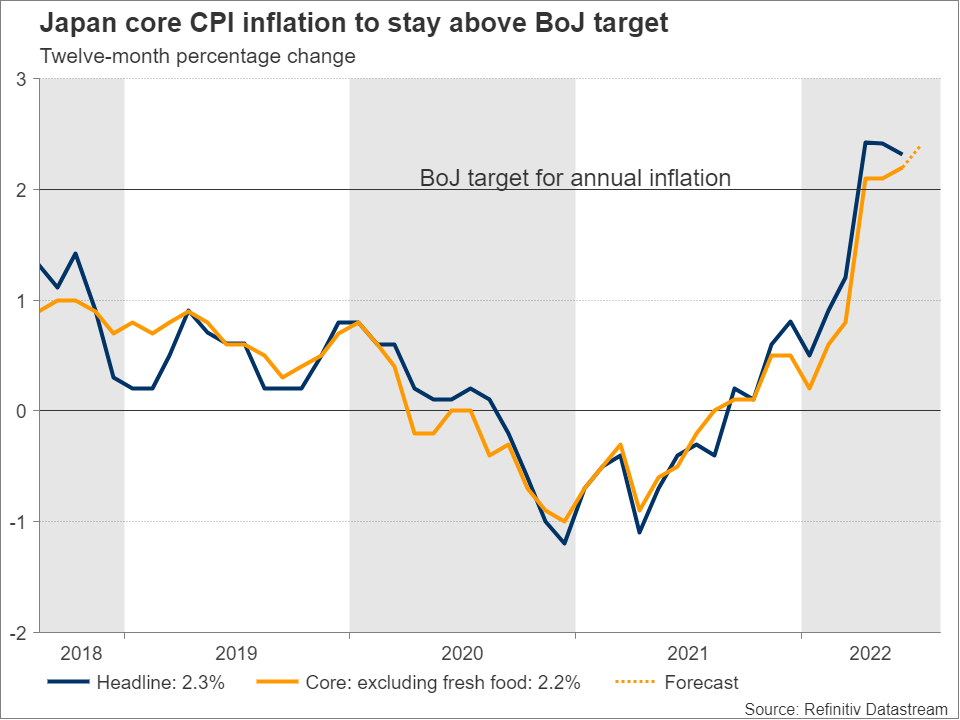
After an upbeat GDP report, July’s CPI inflation will take center stage on Friday at 00:30 GMT, likely testing the central bank’s policy commitment to an ultra-easy strategy for another month as growth in consumer prices, although gradual, is expected to stage another pickup. Despite that, the data may not be enough to change the yen’s short-term neutral status.
Japan's inflation to hit a new 8-year high
Central bank policy meetings have been so much agony for nothing in Japan lately. The unstoppable inflation, which is positively charged by supply jitters and the Ukrainian war, forced global central banks, even the dovish ones such as the ECB, to switch to the tightening phase sooner than later. The dove king BoJ, however, has been shrugging off investors’ growing expectations for a hawkish shift, stubbornly holding interest rates at a record low of -0.1% and its yield curve control steady back in July.
Well, despite anxiety thriving about when the central bank will change course, its stance looks reasonable for now. After years of missing the inflation target, policymakers are finally seeing consumer prices rising by more than 2.0% y/y over the past three months under a stimulative policy. Apparently for the wrong reason, as the drivers are more external than internal, but the wait is worth it since the pace of expansion is still relatively anemic when compared to those in other key advanced economies. Particularly, analysts expect the core nationwide CPI to have extended June’s climb to 2.4% y/y in July from 2.2% previously, the highest since December 2014.
Fundamentals still fragile
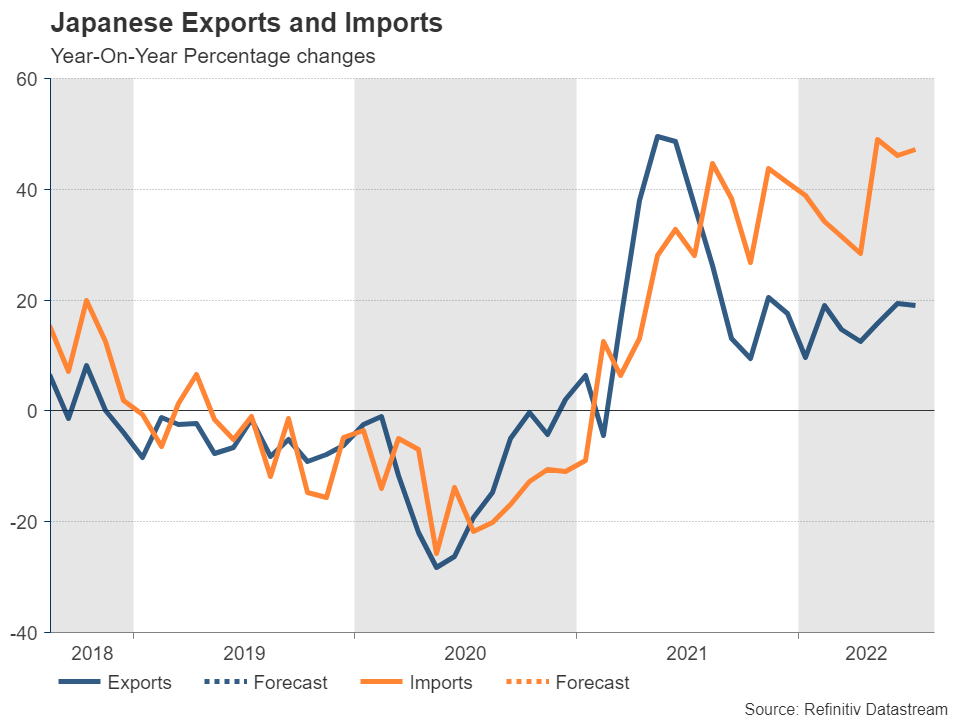
Economic growth is another area that requires caution amid a mixed batch of data. Encouragingly, Monday’s GDP data showed the economy returning to its pre-pandemic size in the second quarter, expanding by an annualized rate of 2.2% on the back of private consumption, which shot up following the lifting of covid curbs.
However, more evidence will be needed to prove that the modest recovery might develop into something more sustainable, especially as the trade deficit gets wider on the back of rising imports and outages in China’s power plants weigh on Japanese factories. Besides, in their latest commentary, policymakers appeared worried that consumer spending may slow down again in the third quarter because of the rising cost-of-living and a potential new covid wave given two months of declines in consumer sentiment.
What are the odds for a policy shift?
Apparently, maintaining the current super accommodative strategy is challenging, especially as Japanese overseas banking operations are facing some risks from higher US interest rates and potential losses from a possible recession in the US, which makes the BoJ more cautious to hike rates. The deputy governor Masayoshi Amamiya, who is considered a strong candidate to replace Kuroda when his term ends next April, has already cautioned that the central bank must always think of appropriate means to exit stimulus, while the new board members Hajime Takata and Naoki Tamura are already shifting the balance in favor of an exit plan.
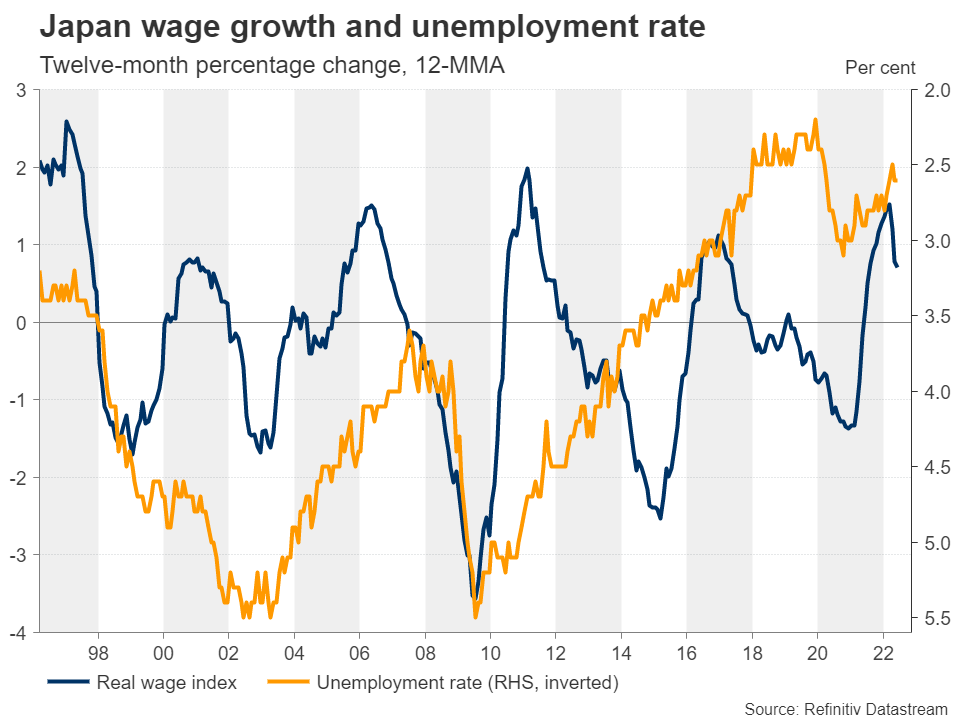
Nevertheless, the major game changer for the BoJ is wage growth. Particularly, policymakers would like to see wages rising at a faster pace than inflation to support consumption. However, the outlook is rather uncertain at the moment following the decline of 1.8% y/y in real wages, which was the biggest annual contraction in nearly two years.
In the meantime, the odds are very low for an immediate policy change according to the futures market, which are convinced interest rates will not change this year. A tweak in the yield curve control could be more likely if inflation sharpens in the coming months and recession risks prove not as severe to halt the tightening cycle in the US and therefore the long depreciation in the yen.
USD/JPY
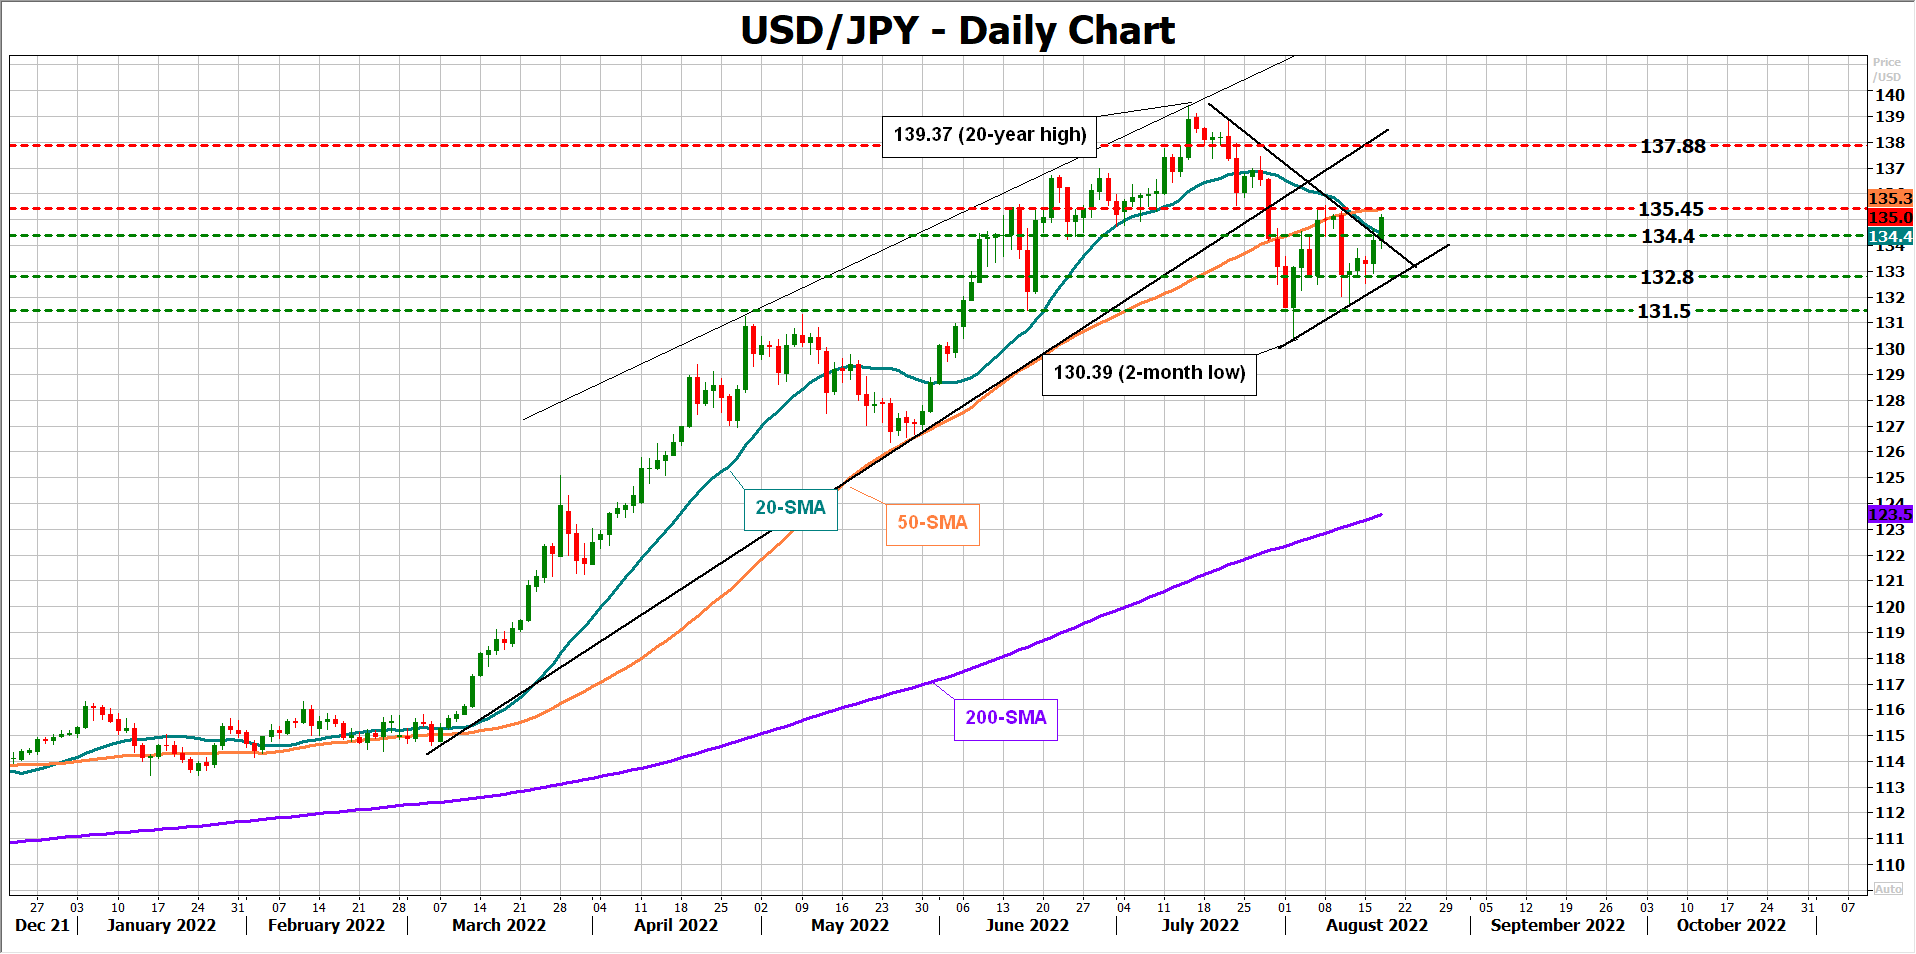
Hence, the yen’s battle against the safe-haven dollar could be tough if the BoJ stays out of the tightening camp. As regards the reaction to Friday's inflation readings, unless a significant upside surprise takes place, the yen may barely gain any momentum. Resistance is currently detected near the 50-day simple moving average (SMA) at 135.45. If the pair breaks that ceiling, it may speed up to 137.88.
On the downside, the 132.80 area has been an important support so far this month. Therefore, an extension beneath that and under the tentative short-term ascending trendline may push for a close below 131.50 with scope to reach the two-month low of 130.38.