Sample Category Title
US: Retail Sales Lose Steam in July
Retail sales were flat month-on-month (m/m) in July – a notch below the consensus forecast (+0.1% m/m) – and decelerating from June's reading, which was revised down to 0.8% m/m from 1.0% m/m reported earlier.
Sales at autos & parts dealers dropped 1.6% m/m from June's downwardly revised rate of 0.5% (+0.8% m/m, previously). Excluding autos, retail sales were up 0.4% m/m in July, above the consensus forecast of -0.1% m/m.
Sales at gasoline stations were down by 1.8% m/m, reflecting the 7.7% pullback in gas prices. Adjusted for prices, sales were up at 6.4% m/m. Meanwhile, sales at building materials retailers were up 1.5% in July.
The "control group", which excludes the most volatile components and is used in calculating personal consumption expenditures (and GDP), was up in July gaining 0.8% m/m - two tenths of a percentage points higher than expected by the consensus. July's reading was revised down to 0.7% m/m from 0.8% m/m reported previously.
Within the group, the biggest contributors to growth were sales at non-store retailers (+2.7% m/m), miscellaneous stores retailers (+1.5% m/m), furniture & electronics/appliance stores (+0.3% m/m), and health & personal care stores (+0.4% m/m). Food services & drinking places – the only service category in today's report – was up by 0.1% m/m, but it declined by 0.5% m/m in real terms.
The only two categories in the red were department stores (-0.7% m/m) and clothing & accessory stores (-0.6% m/m).
Key Implications
That’s more like it. Moderation in retail sales momentum has been expected as consumers continue to shift their attention to services spending. Price-adjusted, retail sales came in flat, which points to PCE growth of somewhere around 0.5-0.7% (annualized) in the third quarter.
Lower prices at the pump contributed to softer growth in today's report, despite freeing up some money to be spent elsewhere. Consumers directed their attention to bargains during Amazon's "biggest Prime Day Event ever", which, with $3 billion in sales, contributed handsomely to headline growth this month. Despite softness in the housing market, sales at building materials and equipment stores came in at one percent in real terms suggesting that consumers continue devote a sizeable share of spending to home improvements.
Like July's CPI reading, today's release suggests things are moving in the right direction, but it's still too early for the Fed to pivot away from the hiking cycle. We maintain the view that a 50 basis point hike will be considered enough in September but will have more clarity after the August jobs and inflation data give us a better understanding of whether the recent moderation has more legs.
New Zealand Dollar Slides after RBNZ Hike
RBNZ delivers another 0.50% hike
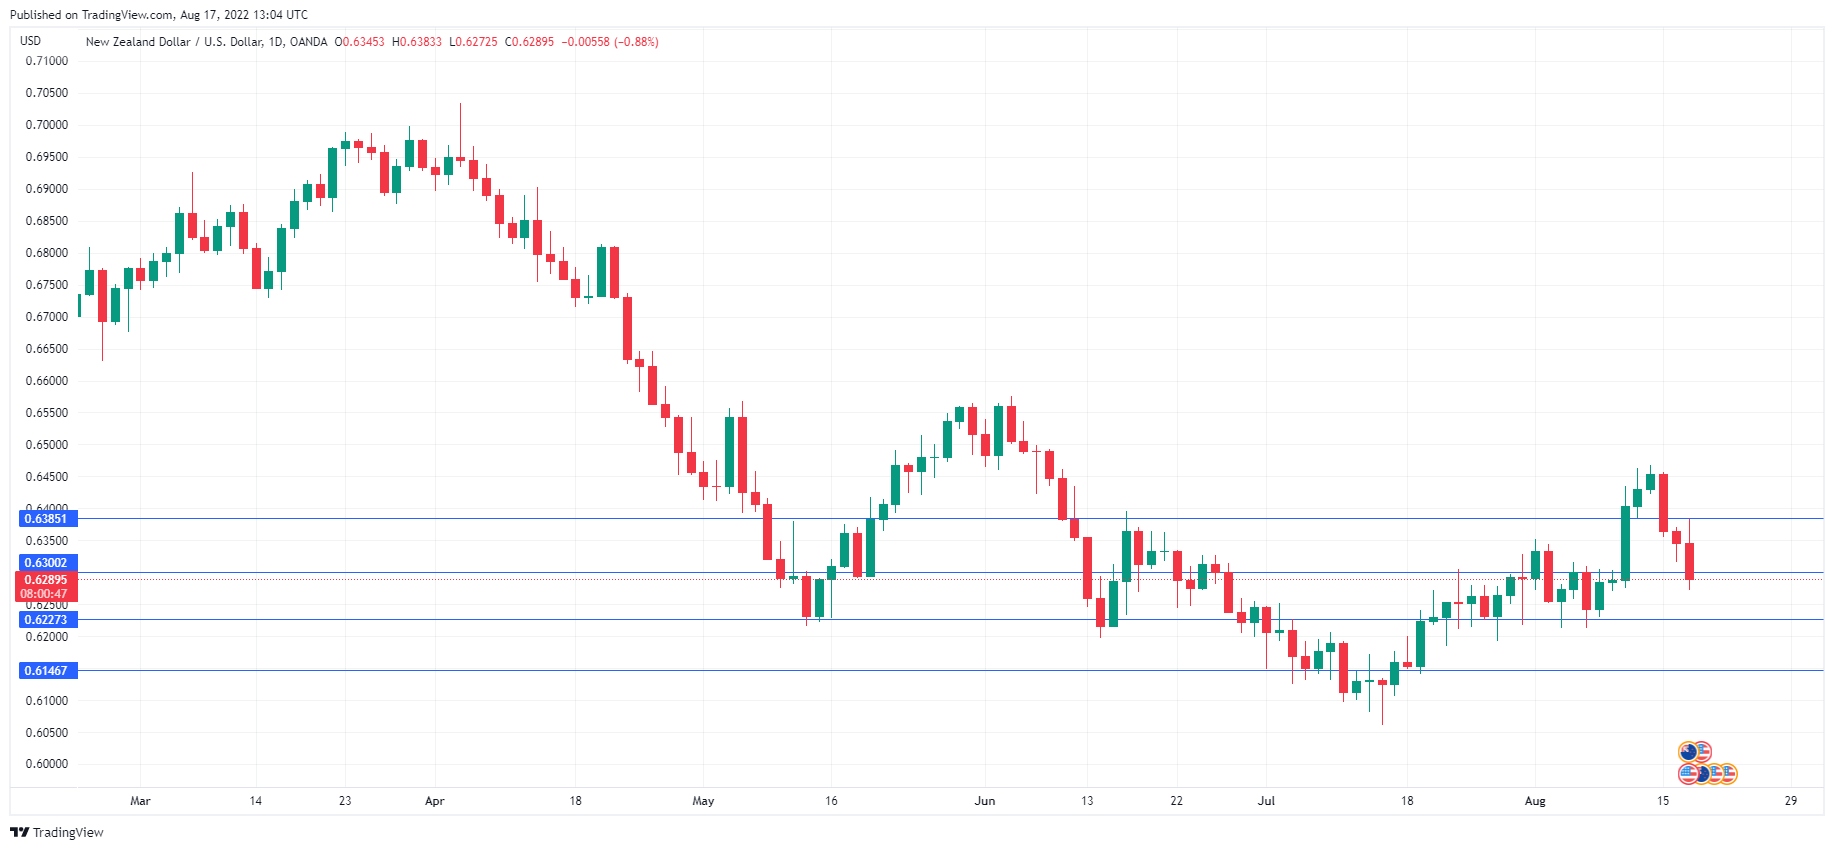
The New Zealand dollar has taken a tumble today. In the European session, NZD/USD has declined by 0.88% and is trading at 0.6289. We continue to see plenty of volatility from the New Zealand dollar. Last week, the currency rose 3.33%, but has pared those gains this week and is down 2.47%.
The RBNZ dutifully raised interest rates by 0.50%, for a fourth straight time. This brings the cash rate to an even 3.00%. However, the New Zealand dollar has responded with sharp losses, as the central bank’s inflation and unemployment forecasts have been revised upwards. In its monetary statement, the RBNZ said it expected inflation to start to drop from the current level of 7.3%, but said that inflation will not fall below 3% until June 2024. As well, unemployment is expected to rise to 5% in 2025. In May, the central bank projected inflation would drop under 3% in September 2023 and inflation would rise to 4.7% in 2025.
The central bank holds its next meeting in October. Governor Orr flatly ruled out any predetermination as to what the RBNZ would do. Still, short of a spectacular turnaround in inflation, odds are that the Bank will deliver another 0.50% hike, as its primary focus is to ensure that inflation does not become entrenched. There is the danger that the sharp rate tightening could cause a recession, but that is a price the RBNZ is willing to pay.
The Federal Reserve is doing its best to convey the message that inflation is far from beaten and additional rate hikes are coming. Since the surprising inflation report which showed a decline in CPI, the markets have been holding onto the idea that the Fed will reverse directions next year, which has sent the US dollar sharply lower. The Fed minutes will be released later today, and I expect the Fed to continue to drum out its hawkish stance. Will investors finally buy into the Fed’s hawkish message or ignore what they don’t want to hear? Stay tuned – the dollar could show some volatility after the release of the minutes.
NZD/USD Technical
- NZD/USD is testing support at 0.6300. Below, there is support at 0.6227
- There is resistance at 0.6385 and 0.6495
EUR/USD Mid-Day Outlook
Daily Pivots: (S1) 1.0131; (P) 1.0163; (R1) 1.0203; More...
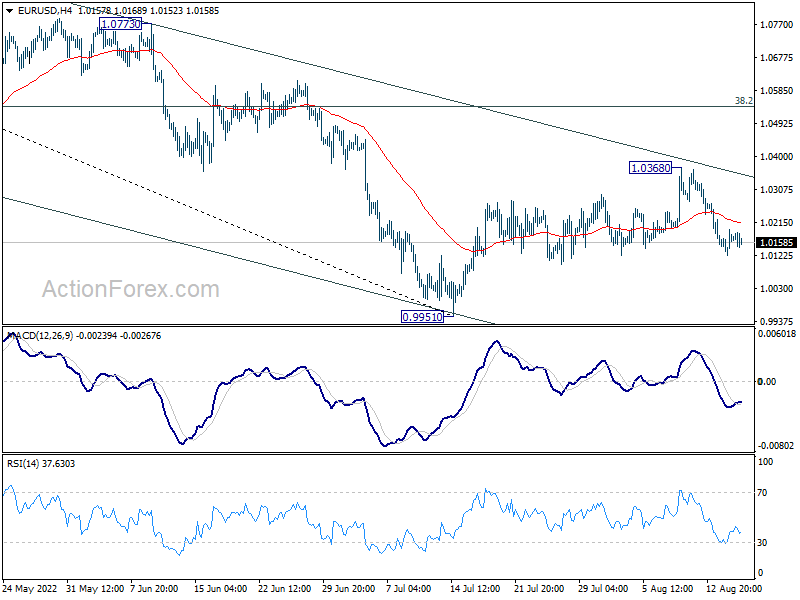
Intraday bias in EUR/USD remains mildly on the downside despite loss of downside momentum. Rebound from 0.9951 should have completed at 1.0368 after rejection by 55 day EMA, as well as falling channel resistance. Deeper fall would be seen to retest 0.9951 low. Firm break there will resume larger down trend. For now, risk will stay on the downside as long as 1.0368 resistance holds, in case of recovery.
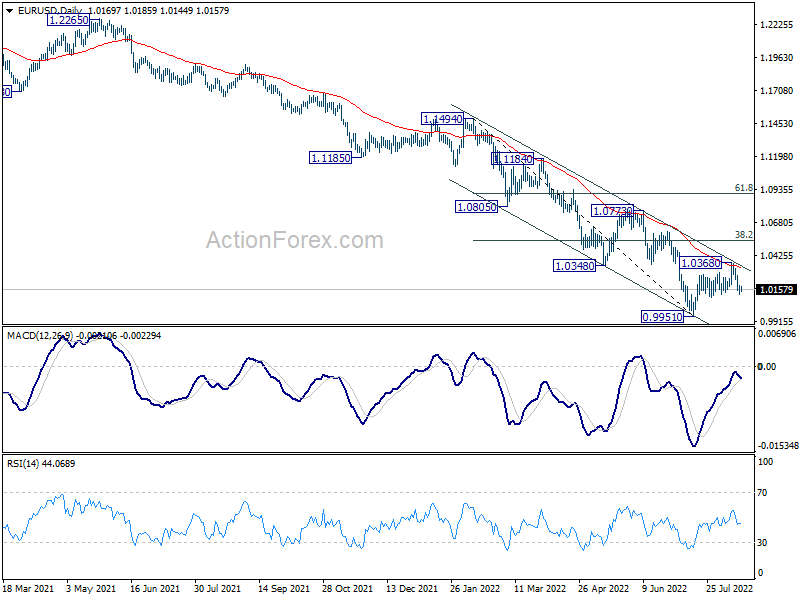
In the bigger picture, down trend from 1.6039 (2008 high) is still in progress. Next target is 100% projection of 1.3993 to 1.0339 from 1.2348 at 0.8694. In any case, outlook will stay bearish as long as 1.0773 resistance holds, in case of strong rebound.
GBP/USD Mid-Day Outlook
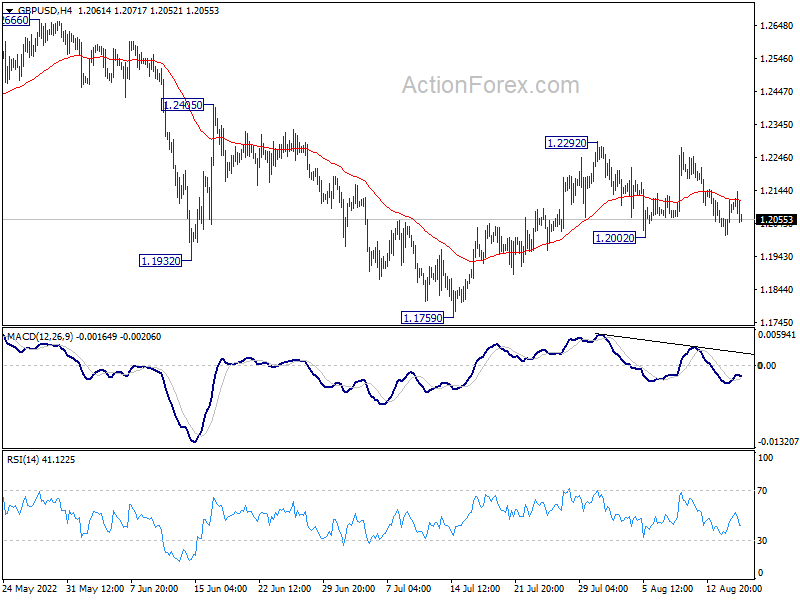
Daily Pivots: (S1) 1.2031; (P) 1.2075; (R1) 1.2141; More...
Range trading continues in GBP/USD and intraday bias remains neutral. On the downside, break of 1.2002 minor support will argue that rebound from 1.1759 has completed, after rejection by 55 day EMA. Intraday bias will be back on the downside for retesting 1.1759 low first. Break there will resume larger down trend. On the upside, above 1.2922 will resume the rebound from 1.1759 towards 1.2666 resistance.
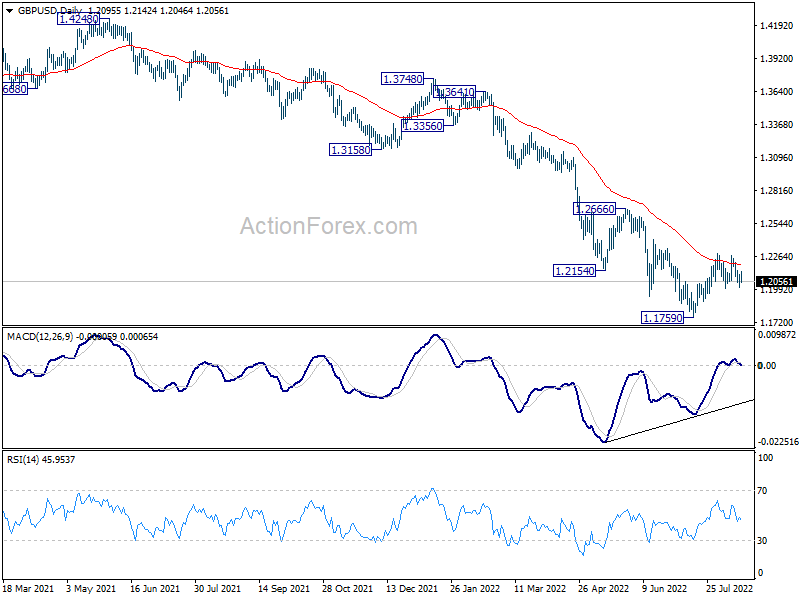
In the bigger picture, fall from 1.4248 (2018 high) could be a leg inside the pattern from 1.1409 (2020 low), or resuming the longer term down trend. Deeper decline is expected as long as 1.2666 resistance holds. Next target is 1.1409 low. However, firm break of 1.2666 will bring stronger rise back to 55 week EMA (now at 1.2897).
USD/CHF Mid-Day Outlook
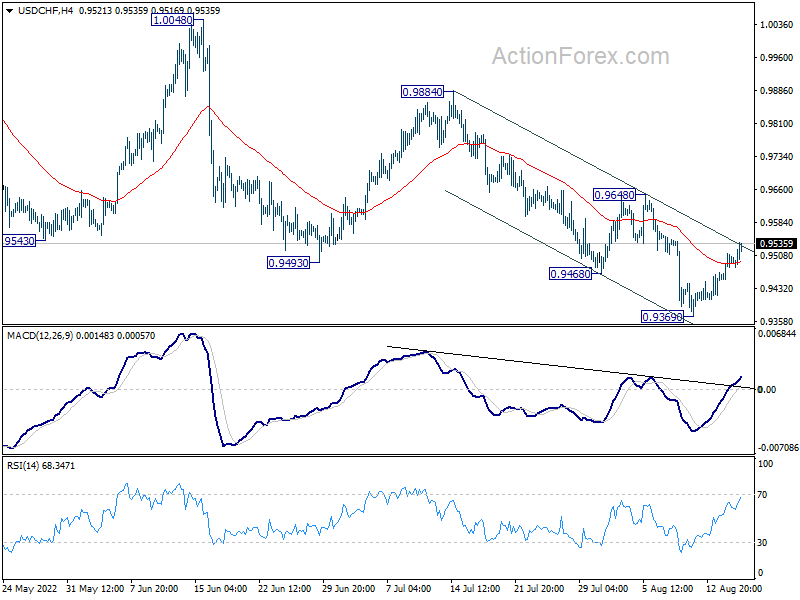
Daily Pivots: (S1) 0.9461; (P) 0.9488; (R1) 0.9522; More...
Intraday bias in USD/CHF stays neutral at this point. Recovery from 0.9369 should be limited well below 0.9648 resistance to bring another fall. On the downside, break of 0.9369 will resume larger decline from 1.0063 towards 0.9149 support next. However, firm break of 0.9648 will turn bias back to the upside for 0.9884 resistance instead.
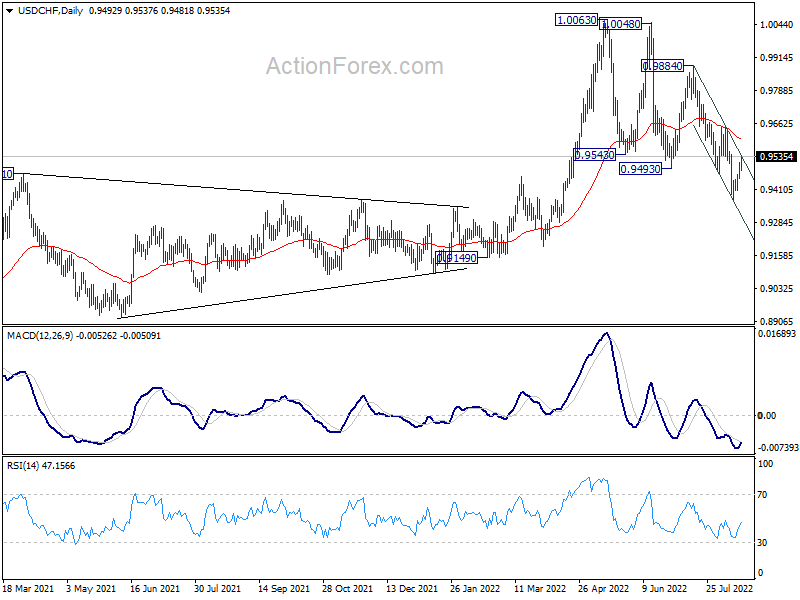
In the bigger picture, break of 0.9471 support turned resistance argues that medium term up trend from 0.8756 has completed with three waves up to 1.0063. Long term sideway pattern might have started another falling leg. Deeper decline would now be in favor as long as 0.9648 resistance holds, to 0.9149 structural support. Sustained break there could pave the way back to 0.8756.
Dollar Rises as Risk Sentiment Turns Sour, Sterling Shrugs Strong Inflation
Overall risk sentiment appears to have turned sour again today, with major European indexes trading in red, while US futures point to lower open. Australian Dollar is leading commodity currencies lower. Even New Zealand Dollar wasn't supported by the hawkish RBNZ hike. At the same time, Yen is also among the weakest, as pressured by rise in major European and US yields. Dollar is the strongest one, followed by Euro and then Swiss Franc. Sterling is just mixed despite another month of strong inflation reading.
Technically, USD/JPY is now pressing 135.57 minor resistance. Firm break there will resume the rebound from 130.38 towards 139.37 high. The move could take EUR/JPY through corresponding resistance at 138.38, and GBP/JPY through 163.91.
In Europe, at the time of writing, FTSE is down -0.35%. DAX is down -1.55%. CAC is down -0.84%. Germany 10-year yield is up 0.110 at 1.082. Earlier in Asia, Nikkei rose 1.23%. Hong Kong HSI rose 0.46%. China Shanghai SSE rose 0.45%. Japan 10-year JGB yield rose 0.0156 to 0.186.
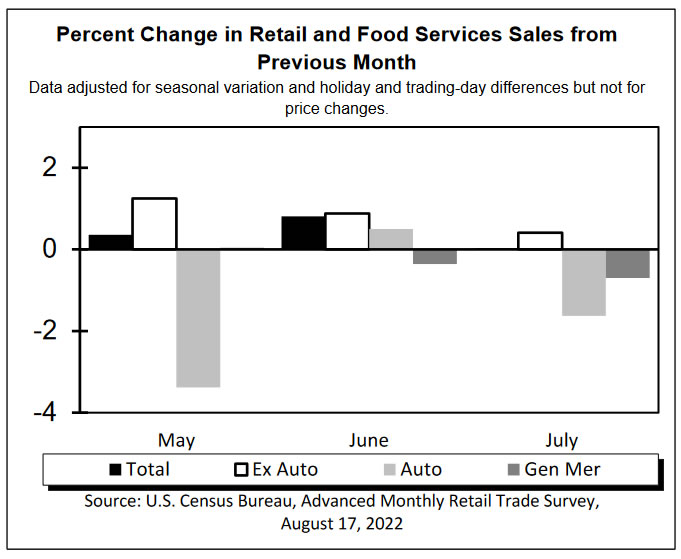
US retail sales rose 0.0% mom in Jul, ex-auto sales up 0.4% mom
US retail sales rose 0.0% mom to USD 682.8B in July, below expectation of 0.2% mom. Ex-auto sales rose 0.4% mom, above expectation of 0.1% mom. Ex-gasoline sales rose 0.2% mom. Ex-auto, gasoline sales rose 0.7% mom.
Also total sales were up 10.3% yoy comparing with July 2021. Total sales for the May through July 2022 period were up 9.2% from the same period a year ago.
UK CPI jumped to 10.1% yoy in Jul, core CPI up to 6.2% yoy
UK CPI rose 0.6% mom in July, largest monthly rise between June and July since the start of the series in 1988. The food and non-alcoholic beverages, and transport divisions made the largest upward contributions.
For the 12 month period, CPI accelerated from 9.4% yoy to 10.1% yoy, above expectation of 9.8% yoy. Indicative models suggest that CPI was last high in 1982, estimated at around 11%. Core CPI accelerated from 5.8% yoy to 6.2% yoy, below expectation of 6.4% yoy.
RPI rose 0.9% mom, 12.3% yoy, versus expectation of 0.8% mom, 12.9% yoy. PPI input came in at 0.1% mom, 22.6% yoy, versus expectation of 1.0% mom, 24.8% yoy. PPI output was at 1.6% mom, 17.1% yoy, versus expectation of 1.6% mom, 17.6% yoy. PPI core output was at 1.0% mom, 14.6% yoy, versus expectation of 0.0% mom, 15.9% yoy.
Japan export rose 19.0% yoy in Jul, imports rose 47.2% yoy
Japan exports rose 19.0% yoy to JPY 8753B in July, with gains led by auto shipments to US and chips to China. Imports rose 47.2% yoy to JPY 10190B, driven by higher costs of crude oil, coal and liquid natural gas. Trade deficit came in at JPY -1437B. July's figure marked a full straight year of monthly trade deficits, the longest streak since the 32-month run to February 2015.
In seasonally adjusted terms, exports rose 2.1% mom to JPY 8437B. Imports rose 3.5% mom to JPY 10570B. Trade deficit widened to JPY -2133B.
RBNZ hikes 50bps, monetary conditions needed to continue to tighten
RBNZ raises the Official Cash Rate by 50bps to 3.00% as widely expected, as "core consumer price inflation remains too high and labour resources remain scarce". It also maintains hawkish bias as "committee members agreed that monetary conditions needed to continue to tighten until they are confident there is sufficient restraint on spending to bring inflation back within its 1-3 percent per annum target range."
The central bank noted domestic spending has "remained resilient", supported by a "robust employment level, continued fiscal support, an elevated terms of trade, and sound household balance sheets in aggregate." Production is being "constrained by acute labour shortages", heightened by seasonal illnesses and COVID-19. Spending and investment continues to "outstrip supply capacity". Wage pressures are "heightened". A range of indicators highlight broad-based domestic pricing pressures.
USD/JPY Mid-Day Outlook
Daily Pivots: (S1) 133.25; (P) 133.96; (R1) 134.97; More...
Intraday bias in USD/JPY remains neutral first and range trading continues. Overall, corrective pattern from 139.37 will extend further. On the upside, above 135.57 will resume the rebound to retest 139.37 high. But a decisive break there is not expected this time. On the downside, below 131.72 will resume the fall from 139.37 through 130.38 support.
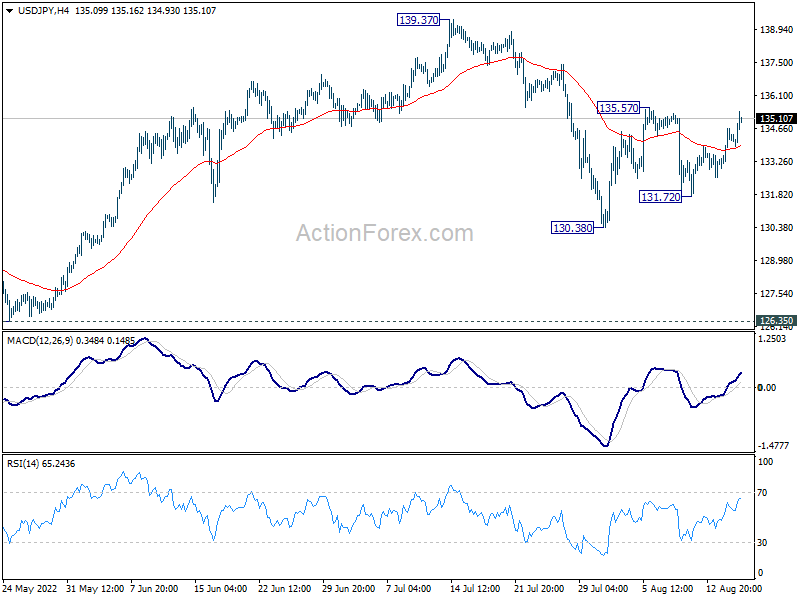
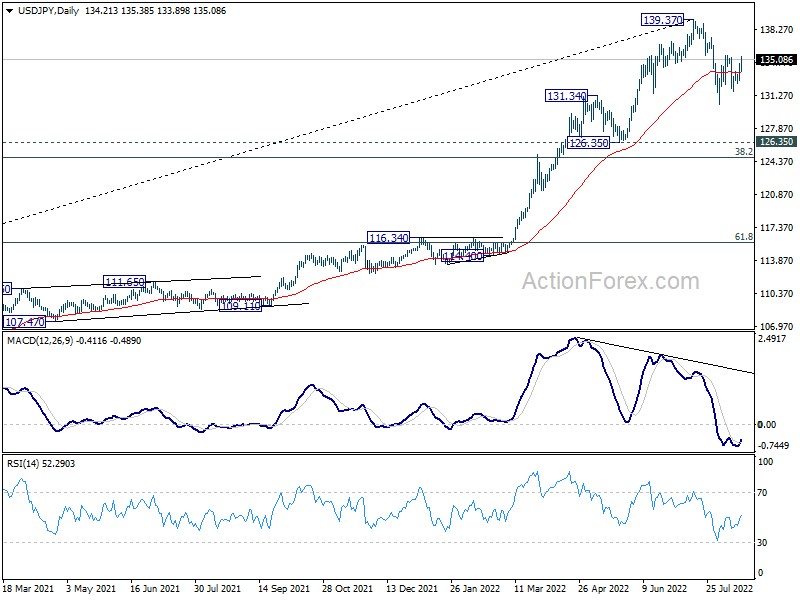
In the bigger picture, fall from 139.37 medium term top is seen as correcting whole up trend from 101.18 (2020 low). While deeper decline cannot be ruled out, outlook will stays bullish as long as 55 week EMA (now at 122.70) holds. Long term up trend is expected to resume through 139.37 at a later stage, after the correction finishes.
Economic Indicators Update
| GMT | Ccy | Events | Actual | Forecast | Previous | Revised |
|---|---|---|---|---|---|---|
| 22:45 | NZD | PPI Input Q/Q Q2 | 3.10% | 2.10% | 3.60% | 3.40% |
| 22:45 | NZD | PPI Output Q/Q Q2 | 2.40% | 1.90% | 2.60% | |
| 23:50 | JPY | Trade Balance (JPY) Jul | -2.13T | -1.94T | -1.93T | -1.95T |
| 23:50 | JPY | Machinery Orders M/M Jun | 0.90% | 1.30% | -5.60% | |
| 00:30 | AUD | Westpac Leading Index M/M Jul | -0.20% | -0.20% | ||
| 01:30 | AUD | Wage Price Index Q/Q Q2 | 0.70% | 0.80% | 0.70% | |
| 02:00 | NZD | RBNZ Interest Rate Decision | 3.00% | 3.00% | 2.50% | |
| 06:00 | GBP | CPI M/M Jul | 0.60% | 0.00% | 0.80% | |
| 06:00 | GBP | CPI Y/Y Jul | 10.10% | 9.80% | 9.40% | |
| 06:00 | GBP | Core CPI Y/Y Jul | 6.20% | 6.40% | 5.80% | |
| 06:00 | GBP | RPI M/M Jul | 0.90% | 0.80% | 0.90% | |
| 06:00 | GBP | RPI Y/Y Jul | 12.30% | 12.90% | 11.80% | |
| 06:00 | GBP | PPI Input M/M Jul | 0.10% | 1.00% | 1.80% | |
| 06:00 | GBP | PPI Input Y/Y Jul | 22.60% | 24.80% | 24.00% | 24.10% |
| 06:00 | GBP | PPI Output M/M Jul | 1.60% | 1.60% | 1.40% | |
| 06:00 | GBP | PPI Output Y/Y Jul | 17.10% | 17.60% | 16.50% | 16.40% |
| 06:00 | GBP | PPI Core Output M/M Jul | 1.00% | 0.00% | 0.80% | 0.70% |
| 06:00 | GBP | PPI Core Output Y/Y Jul | 14.60% | 15.90% | 15.20% | 14.90% |
| 09:00 | EUR | Eurozone GDP Q/Q Q2 P | 0.60% | 0.70% | 0.70% | |
| 09:00 | EUR | Eurozone Employment Change Q/Q Q2 P | 0.30% | 0.60% | 0.60% | |
| 12:30 | USD | Retail Sales M/M Jul | 0.00% | 0.20% | 1.00% | 0.80% |
| 12:30 | USD | Retail Sales ex Autos M/M Jul | 0.40% | 0.10% | 1.00% | 0.90% |
| 14:00 | USD | Business Inventories Jun | 1.40% | 1.40% | ||
| 14:30 | USD | Crude Oil Inventories | 0.3M | 5.5M | ||
| 18:00 | USD | FOMC Minutes |
USD/JPY Mid-Day Outlook
Daily Pivots: (S1) 133.25; (P) 133.96; (R1) 134.97; More...
Intraday bias in USD/JPY remains neutral first and range trading continues. Overall, corrective pattern from 139.37 will extend further. On the upside, above 135.57 will resume the rebound to retest 139.37 high. But a decisive break there is not expected this time. On the downside, below 131.72 will resume the fall from 139.37 through 130.38 support.
In the bigger picture, fall from 139.37 medium term top is seen as correcting whole up trend from 101.18 (2020 low). While deeper decline cannot be ruled out, outlook will stays bullish as long as 55 week EMA (now at 122.70) holds. Long term up trend is expected to resume through 139.37 at a later stage, after the correction finishes.
US retail sales rose 0.0% mom in Jul, ex-auto sales up 0.4% mom
US retail sales rose 0.0% mom to USD 682.8B in July, below expectation of 0.2% mom. Ex-auto sales rose 0.4% mom, above expectation of 0.1% mom. Ex-gasoline sales rose 0.2% mom. Ex-auto, gasoline sales rose 0.7% mom.
Also total sales were up 10.3% yoy comparing with July 2021. Total sales for the May through July 2022 period were up 9.2% from the same period a year ago.
Inflation in Britain Hasn’t Peaked, and the GBPUSD is Not Bottomed Out
While economists in the US and Canada, and later policymakers, are talking about peak inflation, that moment is yet to come for the UK. Annual inflation has reached double-digit territory at 10.1%. At the same time, the monthly price growth rate remains elevated.
It is also important to note the spread of inflation beyond energy. The core CPI has accelerated from 5.8% to 6.2%, higher than the expected 5.9%, indicating an active consumer cost pass-through.
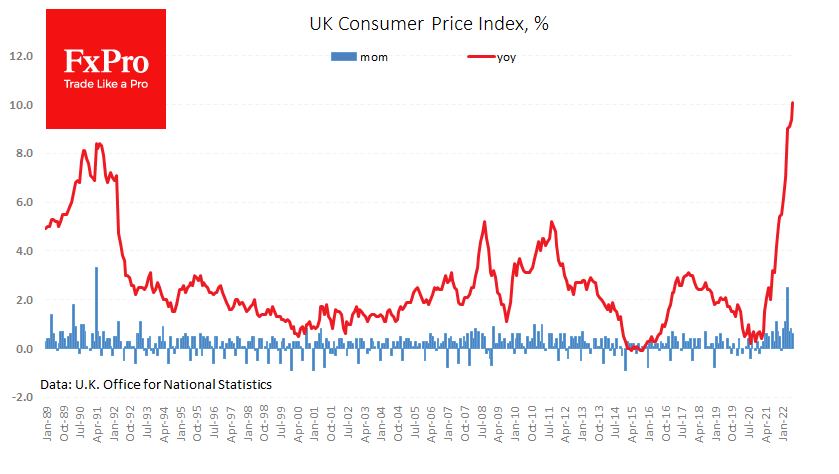
Retailers are finding it difficult to avoid as manufacturers raised their selling prices by 1.6% over July and have increased by 17.1% over the past 12 months.
However, one of the leading inflation indicators – the Input Producer Price Index – indicated light at the end of the tunnel. This indicator rose by only 0.1% in July, sharply below the forecasted 0.7%. The annual rate slowed down from 24.1% to 22.6%.
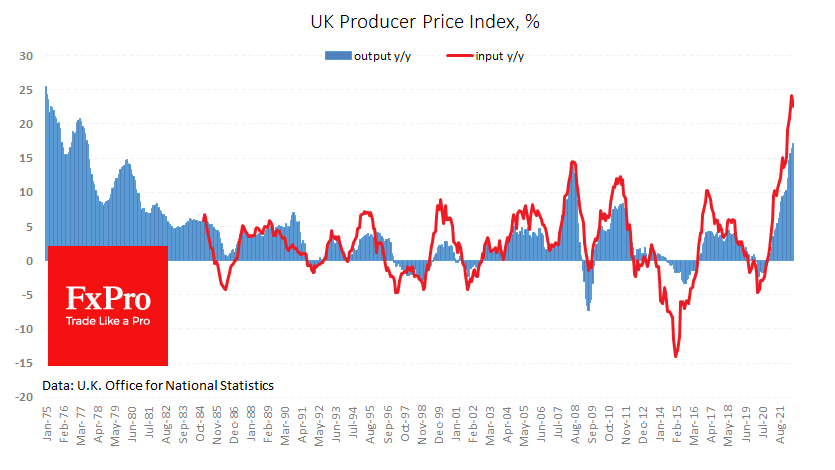
This cooling of the early price indicator further fuels confidence in the Bank of England’s forecasts that consumer inflation will peak in November and levels near 11%.
It is difficult for the Bank of England to maintain the same rate hikes as the Fed due to a less bright labour market picture, which thickens the cloud over the economic outlook. As a result, the British pound is under additional pressure, losing more than 12.5% to the dollar.
Historically, due to higher inflation in the UK compared to the US, GBPUSD has been dominated by a downtrend. Currently, the pair is testing the area near 1.20 for the fourth time in modern history. The difference in monetary policy potential and actual inflation data are set up that the GBPUSD will finally dip into lower territory in the coming weeks.
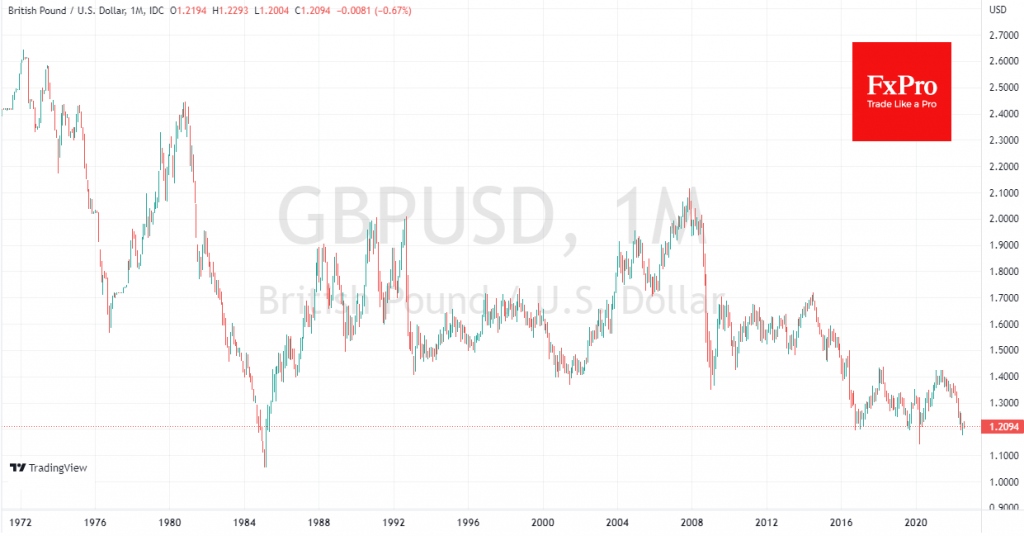
There is a considerable risk that, unlike the episodes of the last six years, this time, investors will not rush to buy the pound but will sell it out, repeating the 1984 dynamic. Having settled at 1.20 in November of that year, the pound plummeted to 1.05 in the next four months, and only Plaza Accord reversed the trend. But the big question now is whether the US need a new such accord.
AUDUSD Breaks Below an Upside Support Line
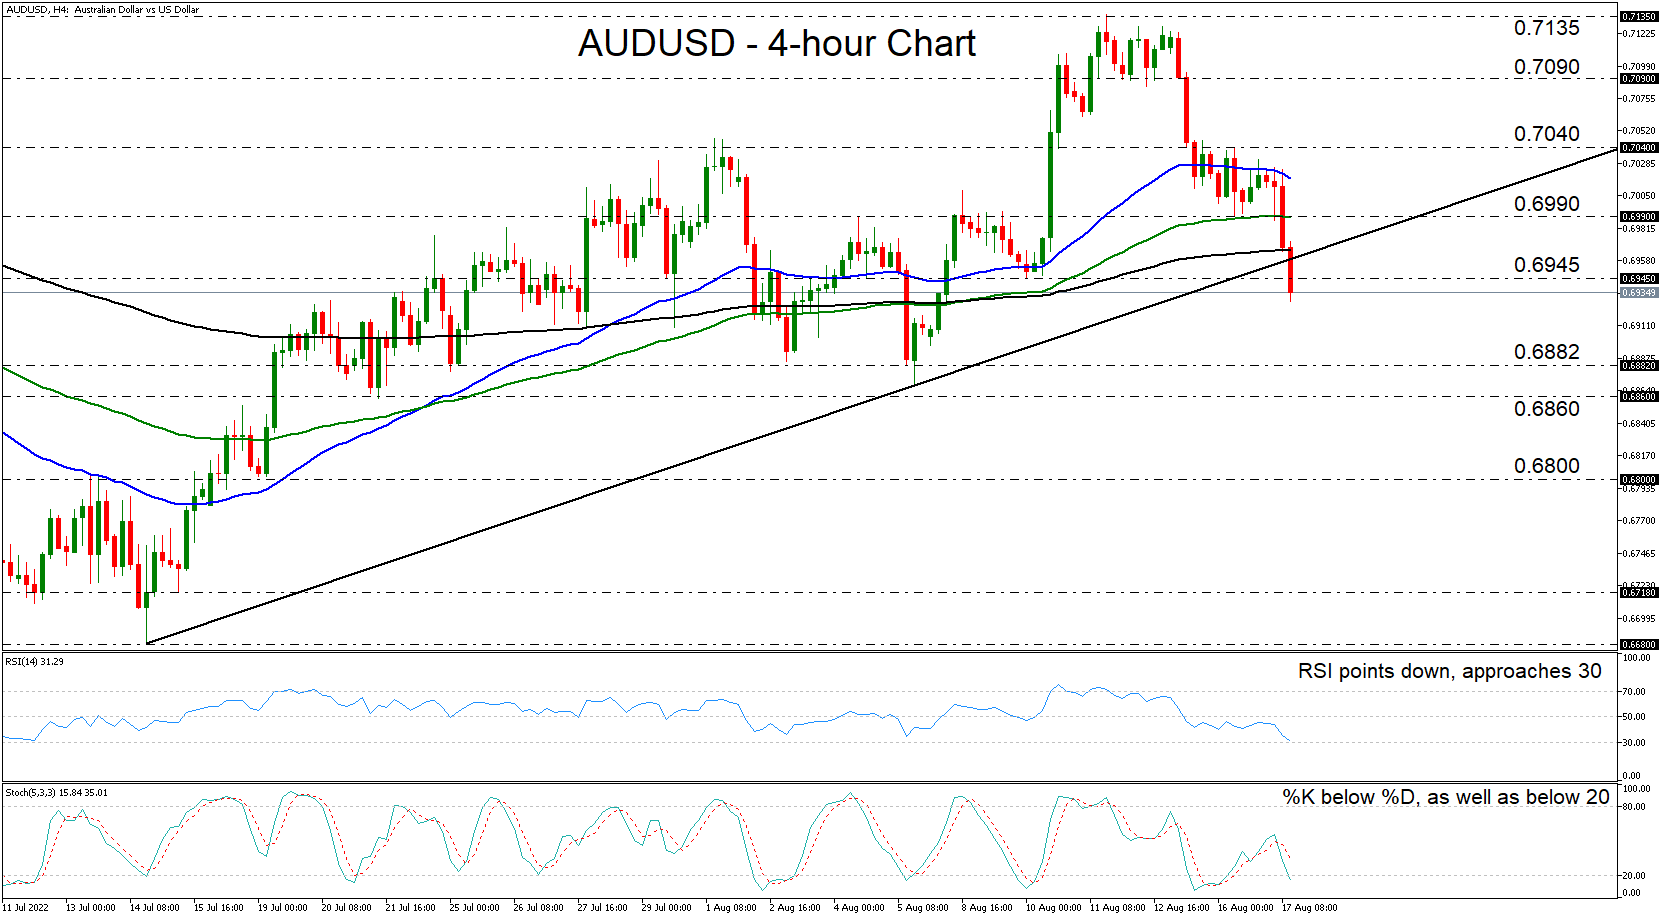
AUDUSD entered a phase of steep declines on Monday, after hitting resistance a few pips below the peak of Friday, at around 0.7135. Although some buyers sought to take advantage of the slide between the 0.6990 and 0.7040 levels, they were unable to withhold the pressure. This resulted in another round of selling and a break below the upside line drawn from the low of July 14th.
The switch in the short-term bias is also confirmed by our short-term oscillators. The RSI moved lower and is now flirting with its 30 line, while in the stochastic, the %K lies below the %D. Although it also dipped below 20, it continues to point south, which implies strong downside momentum.
After breaking the aforementioned upside line, the pair also dropped below the low of August 10, which could be seen as the confirmation of a short-term bearish reversal. More bears could join the action soon and perhaps shoot for the 0.6882 hurdle, which provided decent support between July 25 and August 5. That said, for more declines to be considered, a dip below 0.6860 may be required. Such a move could see scope for extensions towards the low of July 19, at around 0.6800.
On the upside, a rebound back above 0.6990 may signal that the bulls are reigniting attempts to steal the bears’ swords, as it would take the pair back above the upside support line. The next stop might be yesterday’s peak, at around 0.7040, the break of which could encourage advances towards the 0.7090 zone, near the inside swing low of August 12.
To wrap up, AUDUSD has been under selling pressure since Monday, with the price slipping below an upside line and a key support territory today. From a technical standpoint, this suggests a short-term trend reversal.