Sample Category Title
EUR/CHF Daily Outlook
Daily Pivots: (S1) 0.9615; (P) 0.9647; (R1) 0.9690; More....
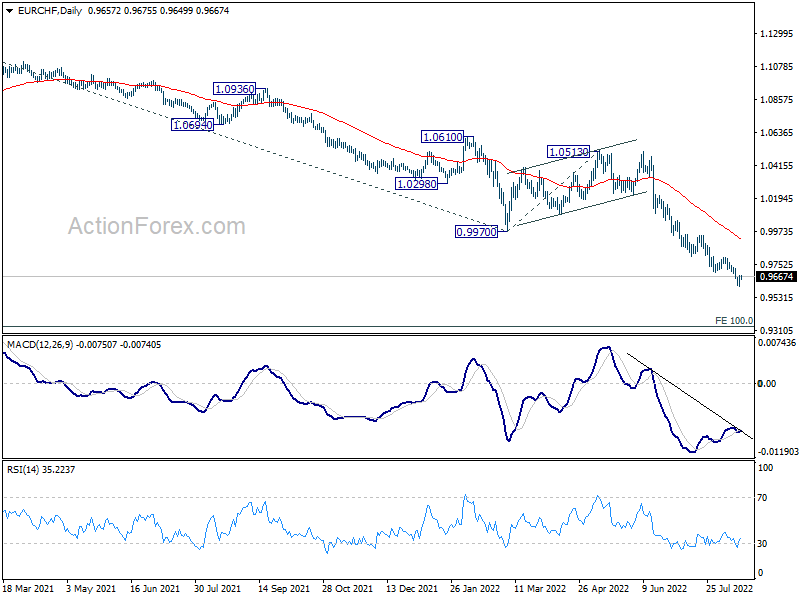
A temporary low is formed at 0.9602 and intraday bias in EUR/CHF is turned neutral first. Upside should be limited well below 0.9948 resistance to bring another fall. Break of 0.9602 will resume larger down trend to 100% projection of 1.1149 to 0.9970 from 1.0513 at 0.9334.
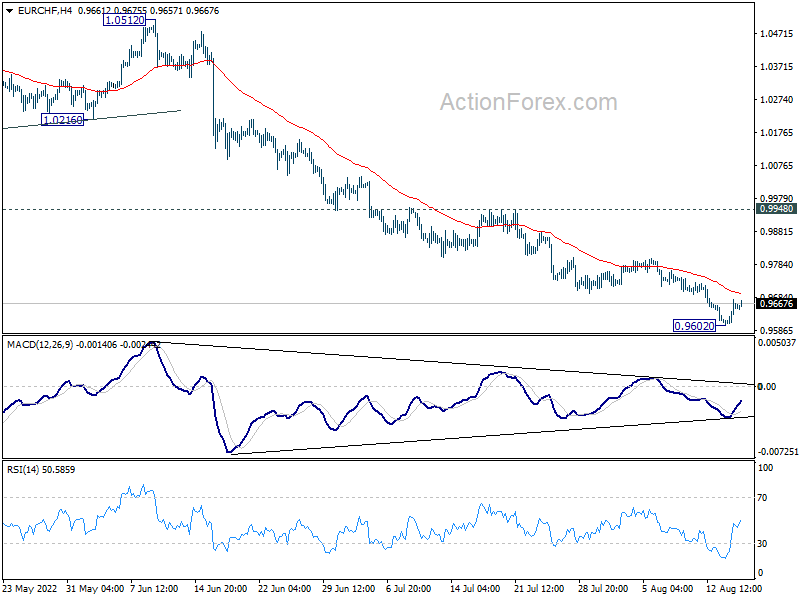
In the bigger picture, long term down trend from 1.2004 (2018 high) is still in progress. Next target is 138.2% projection of 1.2004 to 1.0505 to 1.1149 at 0.9033. On the upside, break of 0.9970 support turned resistance is needed to be the first sign of medium term bottoming. Otherwise, outlook will stay bearish in case of strong rebound.
Daily Technical Analysis
EUR/USD
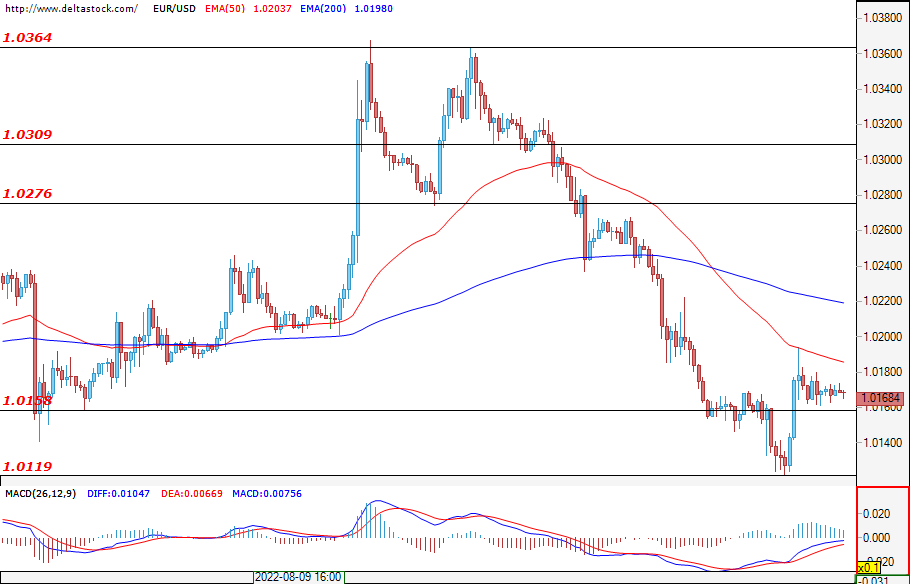
During yesterday's trading session, the single European currency managed to register some growth and to overcome the nearest resistance at 1.0158. At the time of writing, neither the bears nor the bulls are able to prevail and move away from the level at 1.0158. This is likely to remain the case until 12:30 GMT, when the retail price index and the business investment index data will be released. Another major news that could cause high volatility is that of crude oil stocks at 14:30 GMT. If the news is positive for the bulls, then they could make an attempt to reach the next resistance at 1.0276.
USD/JPY
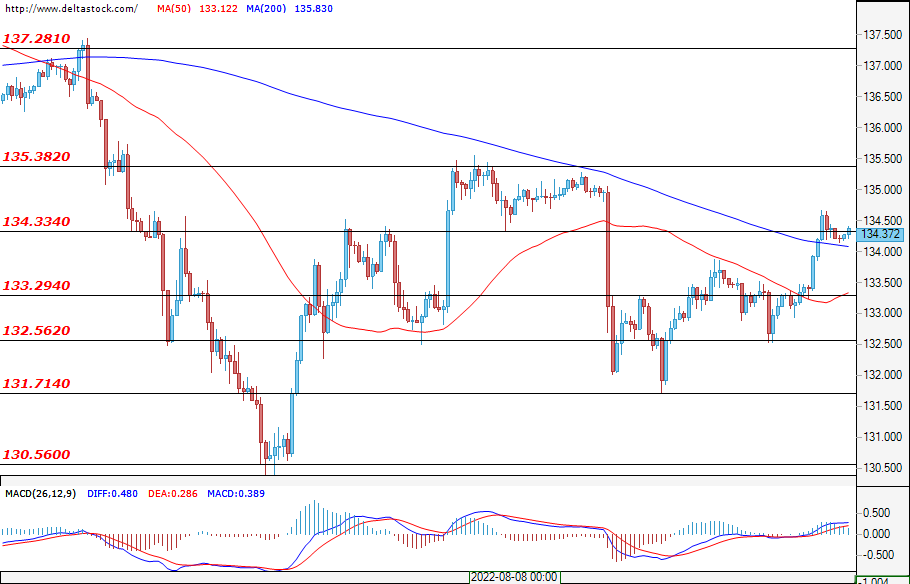
During yesterday's trading session for the Ninja, the bulls managed to consolidate the resistance breach at 133.29 and to reach and test the next one at 134.33. Their breach is still not confirmed, and at the time of writing, the levels are moving around the mentioned resistance. If investors maintain their momentum, then the next resistance for them would be the level at 135.38.
GBP/USD
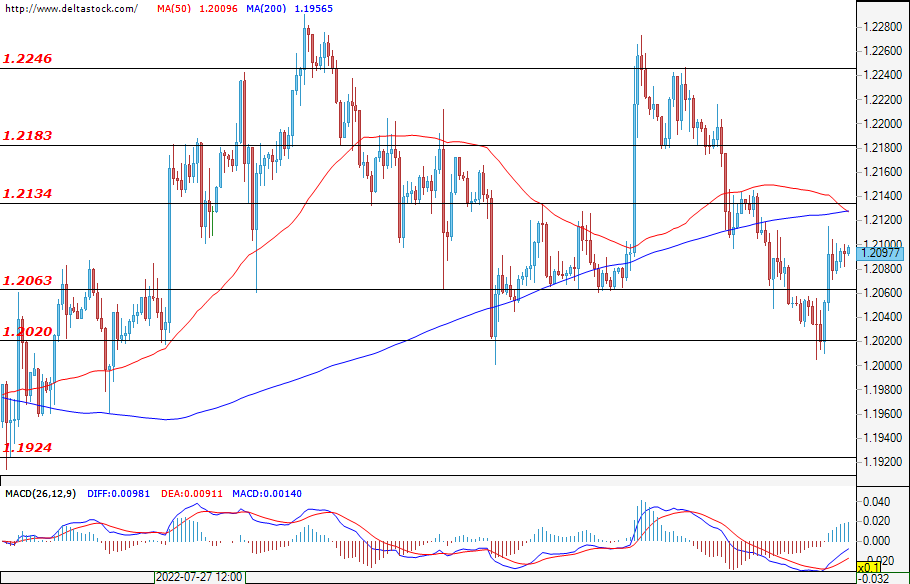
The sterling’s situation is similar to that of the USD/JPY, with the bulls managing to gain the upper hand. During yesterday's trading session, they managed to breach the resistance at 1.2063, but made an unsuccessful attempt to breach the next one at 1.2134. From the end of yesterday's session right up until now, we have been observing the so-called "sideways movement". If, however, the bulls manage to overcome the resistance at 1.2134, then they would have to face the next one at 1.2183 as well. On the other hand, if the bears manage to recover yesterday's losses, then they could test the support at 1.2020.
EUGERMANY40
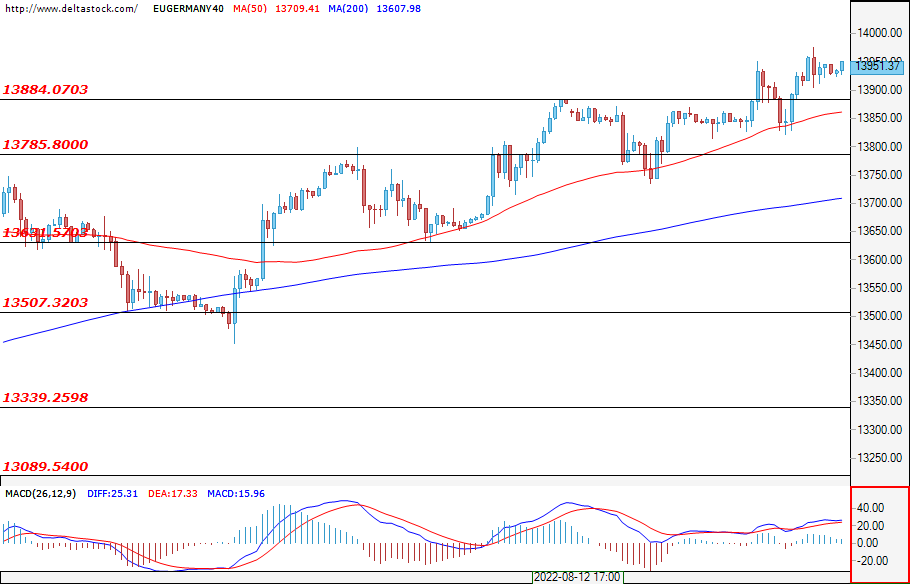
The bullish trend seems to have prevailed in the German index as well. During yesterday's trading session, investors managed to consolidate the resistance breach at 13.884. The next psychological resistance – the level of 14000 – can be seen from the higher time frames. If the bulls lose their ground and the bears regain their lost positions, then the latter could test the support at 13785.
US30
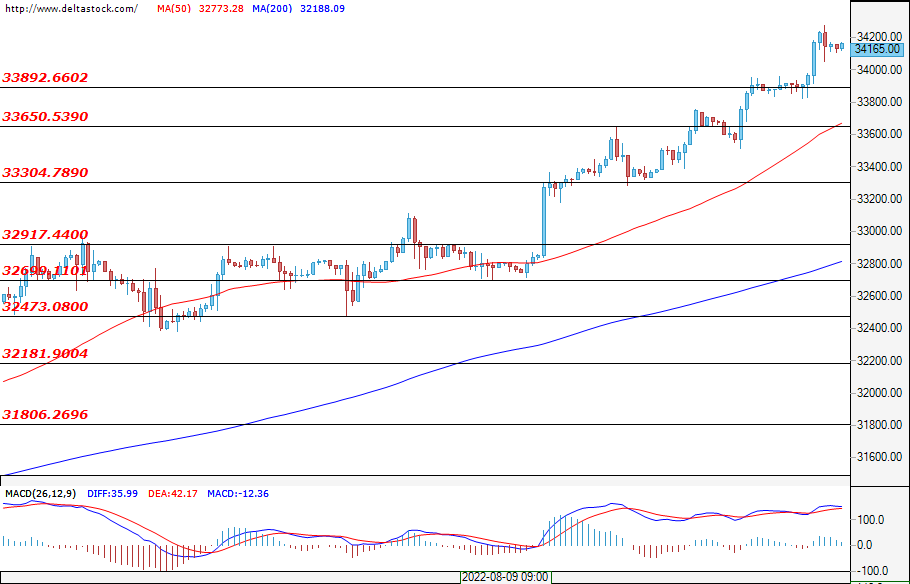
The bulls are reigning supreme in the U.S. blue-chip market as well. So far, they managed to breach the key resistance at 33900 and are now heading for the next one at 34300. If the bears manage to turn around and show their teeth, then a successful recovery of their losses could result in a test of the support at 33650.
USD/CAD Daily Outlook
Daily Pivots: (S1) 1.2806; (P) 1.2868; (R1) 1.2904; More...
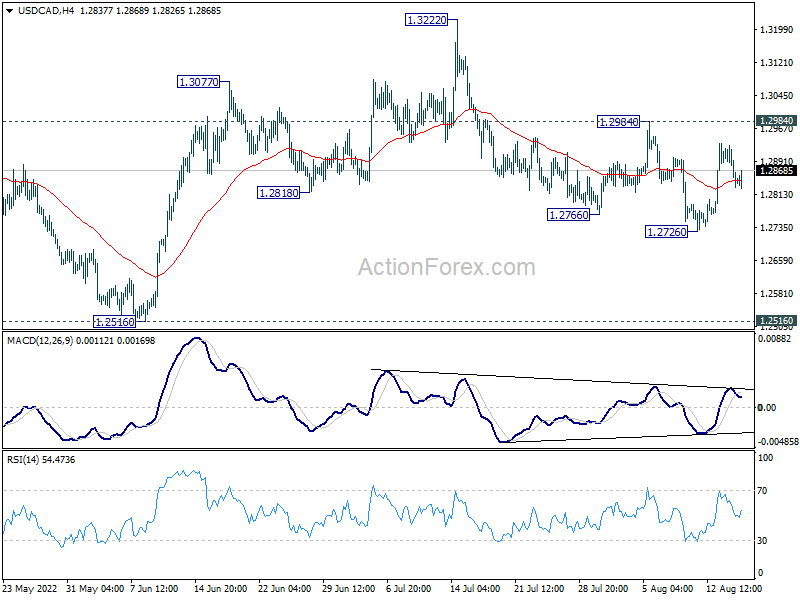
USD/CAD retreated ahead of 1.2984 resistance and intraday bias is turned neutral first. On the upside, firm break of 1.2984 will argue that corrective fall from 1.3222 has completed with three waves down to 1.2726. Further rally would be seen back to retest 1.3222 high. On the downside, break of 1.2726 will resume the fall from 1.3222 to 1.2516 key support instead.
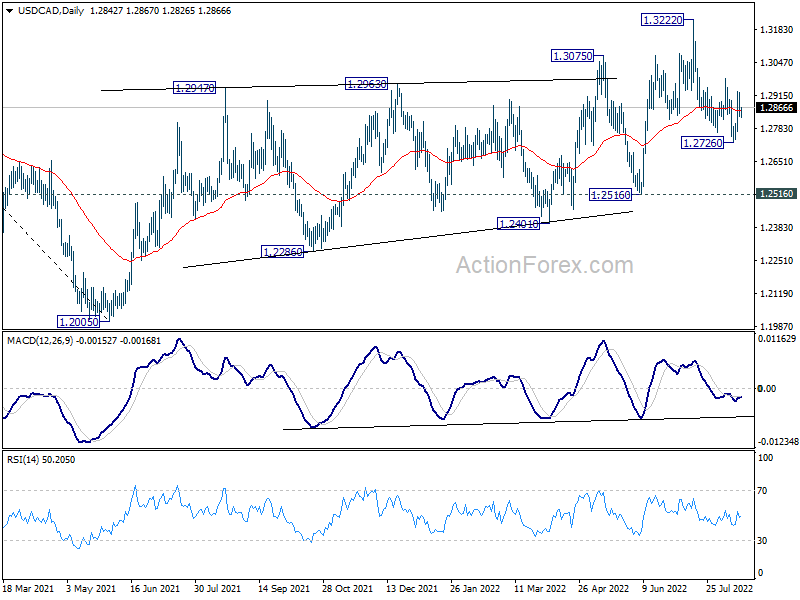
In the bigger picture, down trend from 1.4667 (2020 high) should have completed at 1.2005, after defending 1.2061 long term cluster support. Rise from there should target 61.8% retracement of 1.4667 to 1.2005 (2021 low) at 1.3650. This will remain the favored case now as long as 1.2516 support holds.
AUD/USD Daily Report
Daily Pivots: (S1) 0.6997; (P) 0.7018; (R1) 0.7046; More...
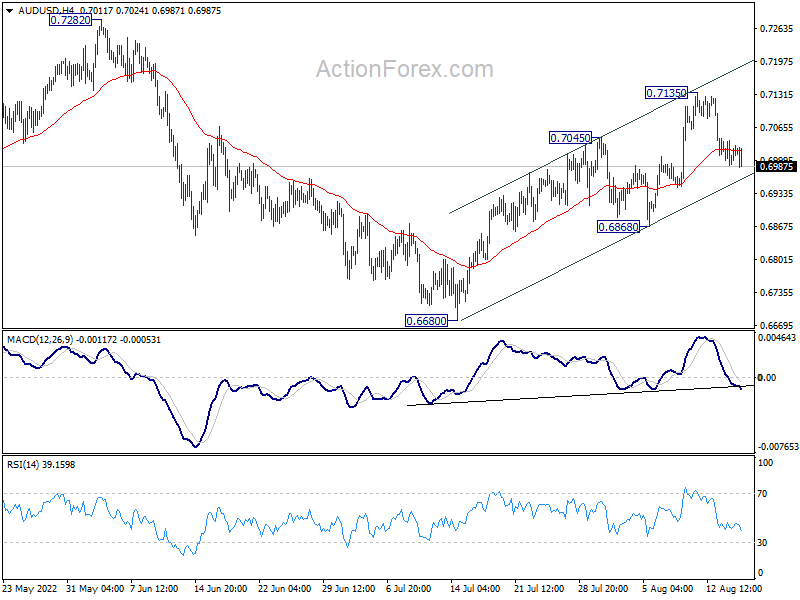
Intraday bias in AUD/USD is mildly on the downside at this point, for 0.6868 support. Decisive break there will argue that whole rebound from 0.6680 is finished. On the upside, break of 0.7135 will resume the rise from 0.6680 towards 0.7282 resistance.
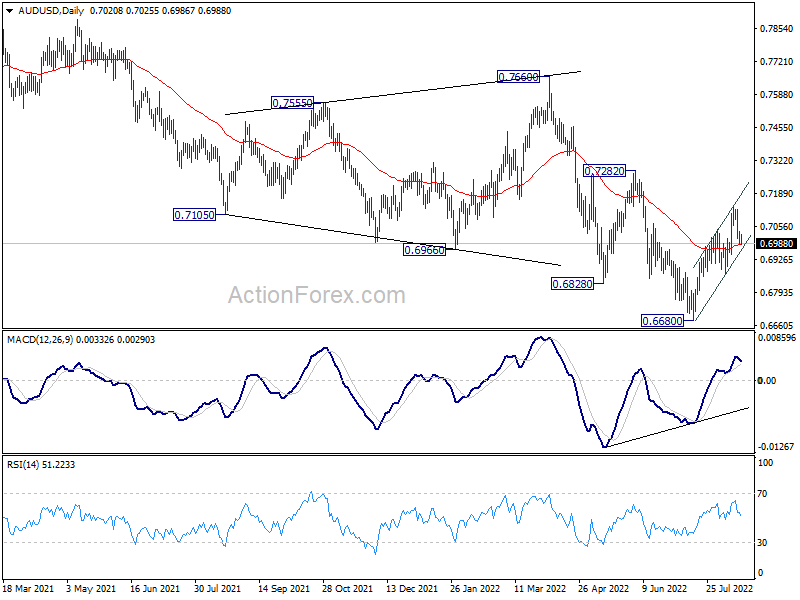
In the bigger picture, price actions from 0.8006 (2021 high) is seen more as a corrective pattern to rise from 0.5506 (2020 low). Or it could be a bearish impulsive move. In either case, outlook will remain bearish as long as 0.7282 resistance holds. Next target is 61.8% retracement of 0.5506 to 0.8006 at 0.6461.
USD/JPY Daily Outlook
Daily Pivots: (S1) 133.25; (P) 133.96; (R1) 134.97; More...
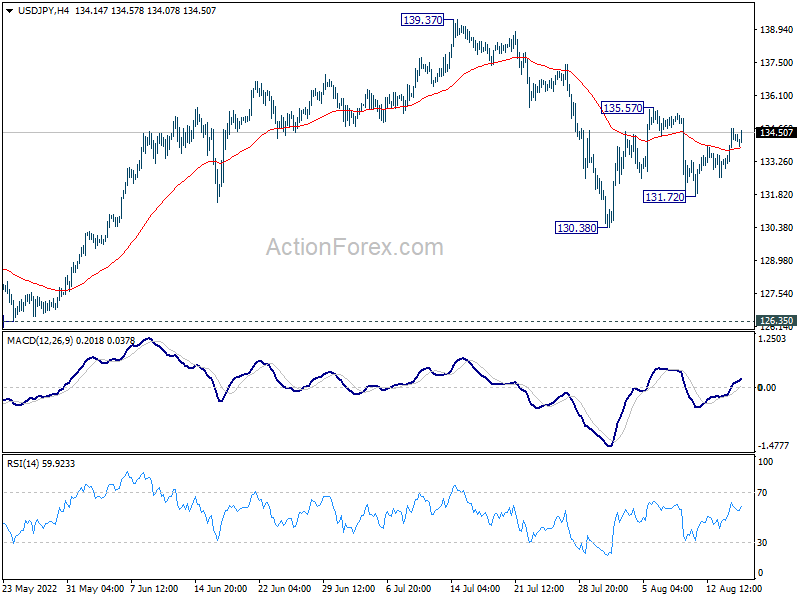
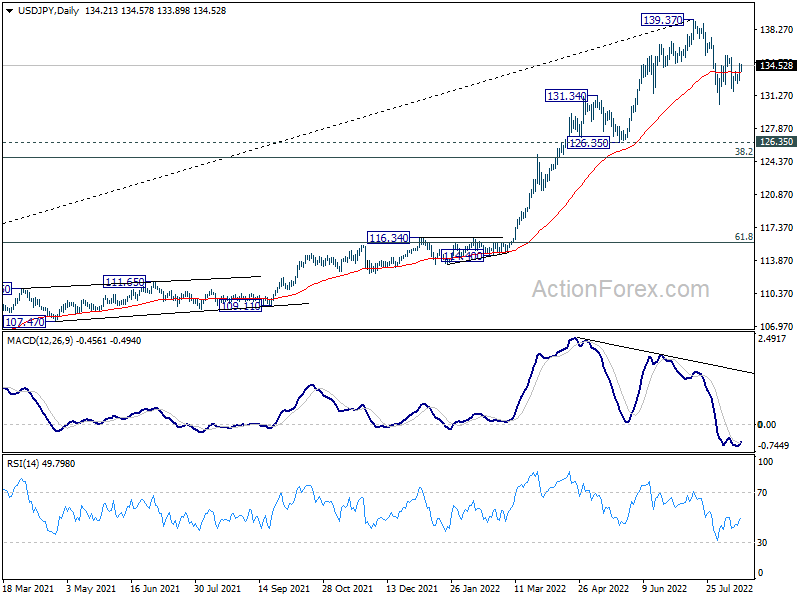
Range trading continues in USD/JPY inside 131.72/135.57 and intraday bias stays neutral first. Overall, corrective pattern from 139.37 will extend further. On the upside, above 135.57 will resume the rebound to retest 139.37 high. On the downside, below 131.72 will resume the fall from 139.37 through 130.38 support.
In the bigger picture, fall from 139.37 medium term top is seen as correcting whole up trend from 101.18 (2020 low). While deeper decline cannot be ruled out, outlook will stays bullish as long as 55 week EMA (now at 122.70) holds. Long term up trend is expected to resume through 139.37 at a later stage, after the correction finishes.
USD/CHF Daily Outlook
Daily Pivots: (S1) 0.9461; (P) 0.9488; (R1) 0.9522; More...
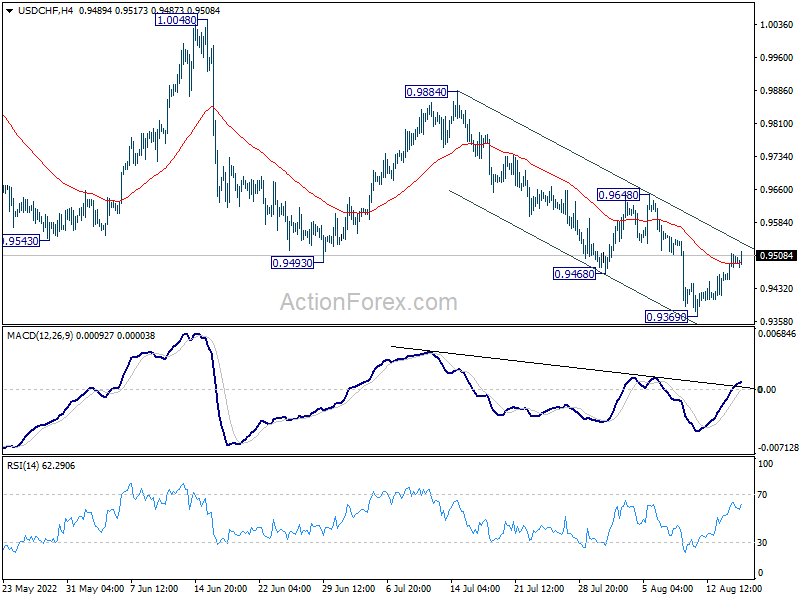
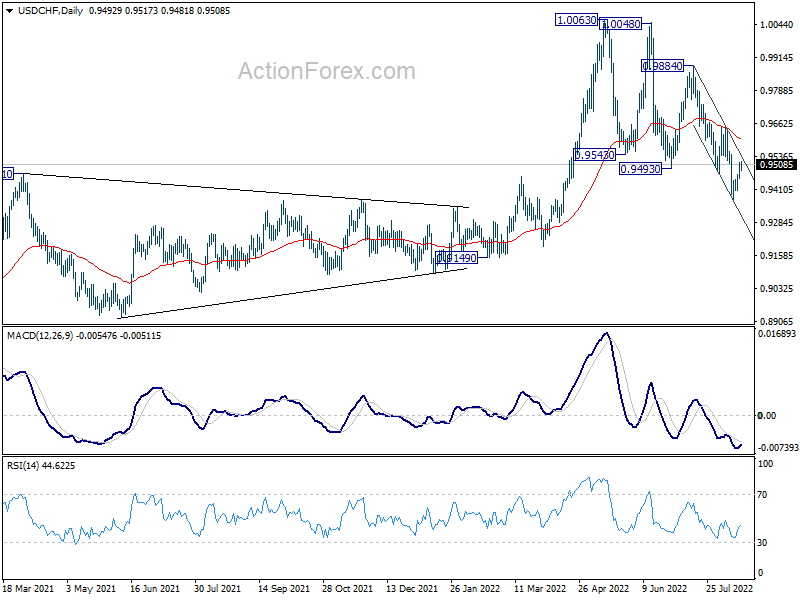
USD/CHF's recovery from 0.9369 is still in progress and intraday bias stays neutral. Upside should be limited well below 0.9648 resistance to bring another fall. On the downside, break of 0.9369 will resume larger decline from 1.0063 towards 0.9149 support next. However, firm break of 0.9648 will turn bias back to the upside for 0.9884 resistance instead.
In the bigger picture, break of 0.9471 support turned resistance argues that medium term up trend from 0.8756 has completed with three waves up to 1.0063. Long term sideway pattern might have started another falling leg. Deeper decline would now be in favor as long as 0.9648 resistance holds, to 0.9149 structural support. Sustained break there could pave the way back to 0.8756.
EUR/USD Daily Outlook
Daily Pivots: (S1) 1.0131; (P) 1.0163; (R1) 1.0203; More...
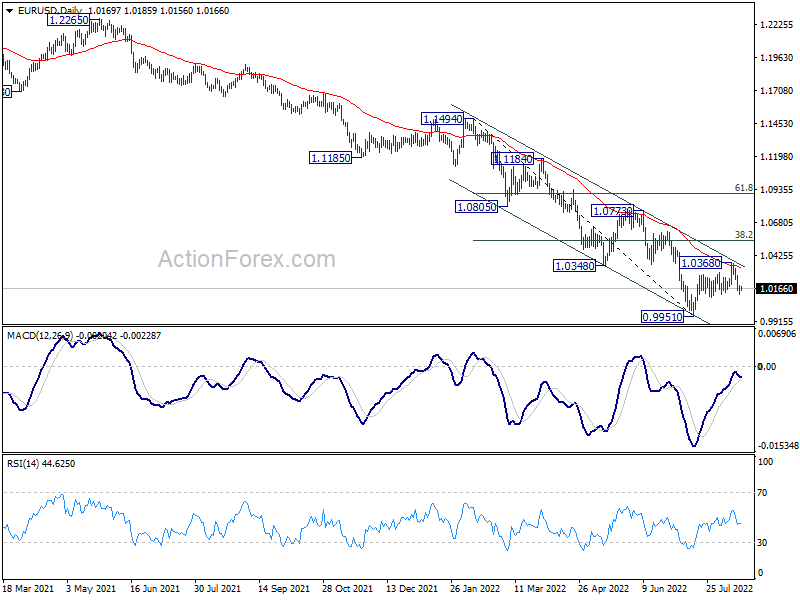
EUR/USD recovers mildly today, but intraday bias stays on the downside at this point. Rebound from 0.9951 should have completed at 1.0368 after rejection by 55 day EMA, as well as falling channel resistance. Deeper fall would be seen to retest 0.9951 low. Firm break there will resume larger down trend. For now, risk will stay on the downside as long as 1.0368 resistance holds, in case of recovery.
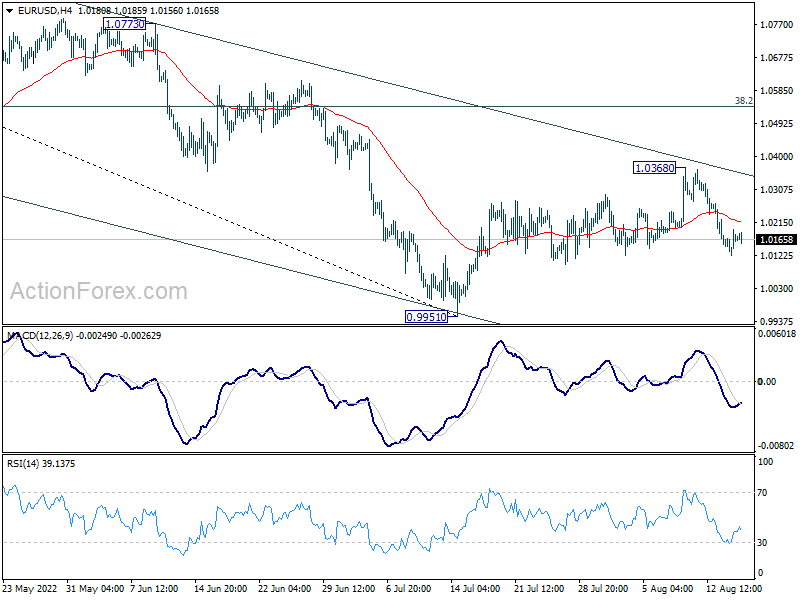
In the bigger picture, down trend from 1.6039 (2008 high) is still in progress. Next target is 100% projection of 1.3993 to 1.0339 from 1.2348 at 0.8694. In any case, outlook will stay bearish as long as 1.0773 resistance holds, in case of strong rebound.
GBPUSD Returns above 1.2100; Bullish Cross Within SMAs Remains Intact
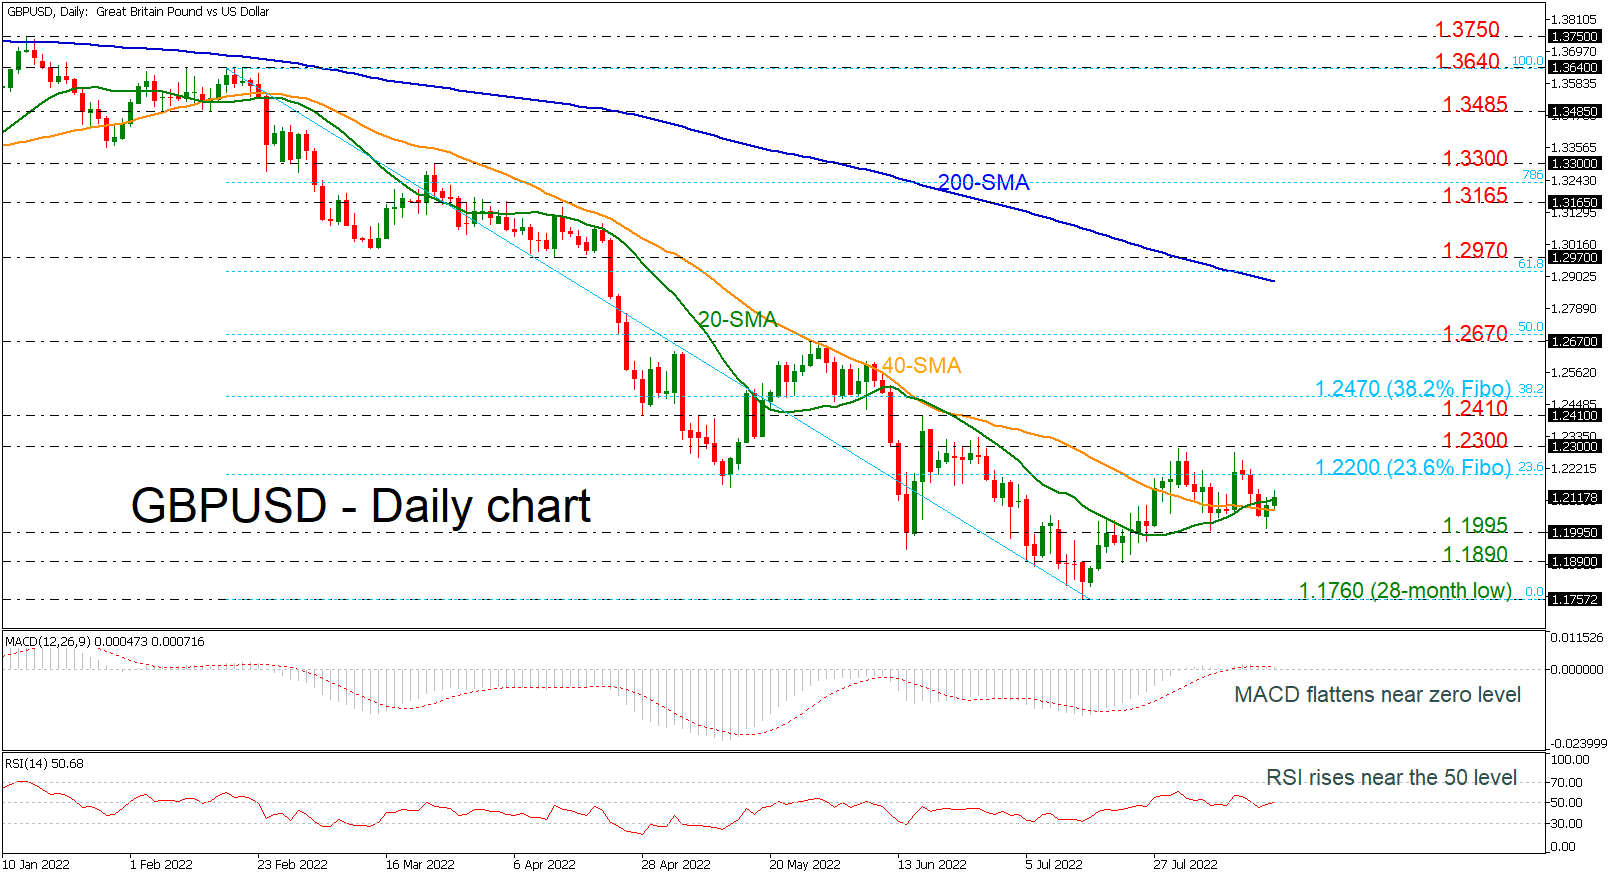
GBPUSD rebounded off the 1.2000 psychological level in the preceding session, flirting with the 20- and 40-day simple moving averages (SMAs). The bullish crossover within the SMAs remains intact, suggesting that a bullish correction may be on the radar in the short-term timeframe. The MACD oscillator is moving sideways near its trigger and zero lines, while the RSI is approaching the neutral threshold of 50.
If the market manages to gain momentum, the 23.6% Fibonacci retracement level of the decline from 1.3640 to 1.1760 at 1.2200 may act as nearby resistance ahead of the 1.2300 barrier. A sustained close above the latter may pave the way for 1.2410 and the 38.2% Fibonacci level at 1.2470.
On the other hand, a move lower again may find next support at 1.1995, a level that has acted as both resistance and support throughout the month of July and the beginning of August. When that level is broken, the next potential support is at 1.1890, after which the attention can turn to the 28-month low at 1.1760.
Since prices are still below the 1.2200 resistance, the medium-term picture is unfavorable and only a successful climb above the 200-day SMA may switch the outlook to bullish.
EURJPY Steps on Familiar Support Zone; 20-SMA in Target
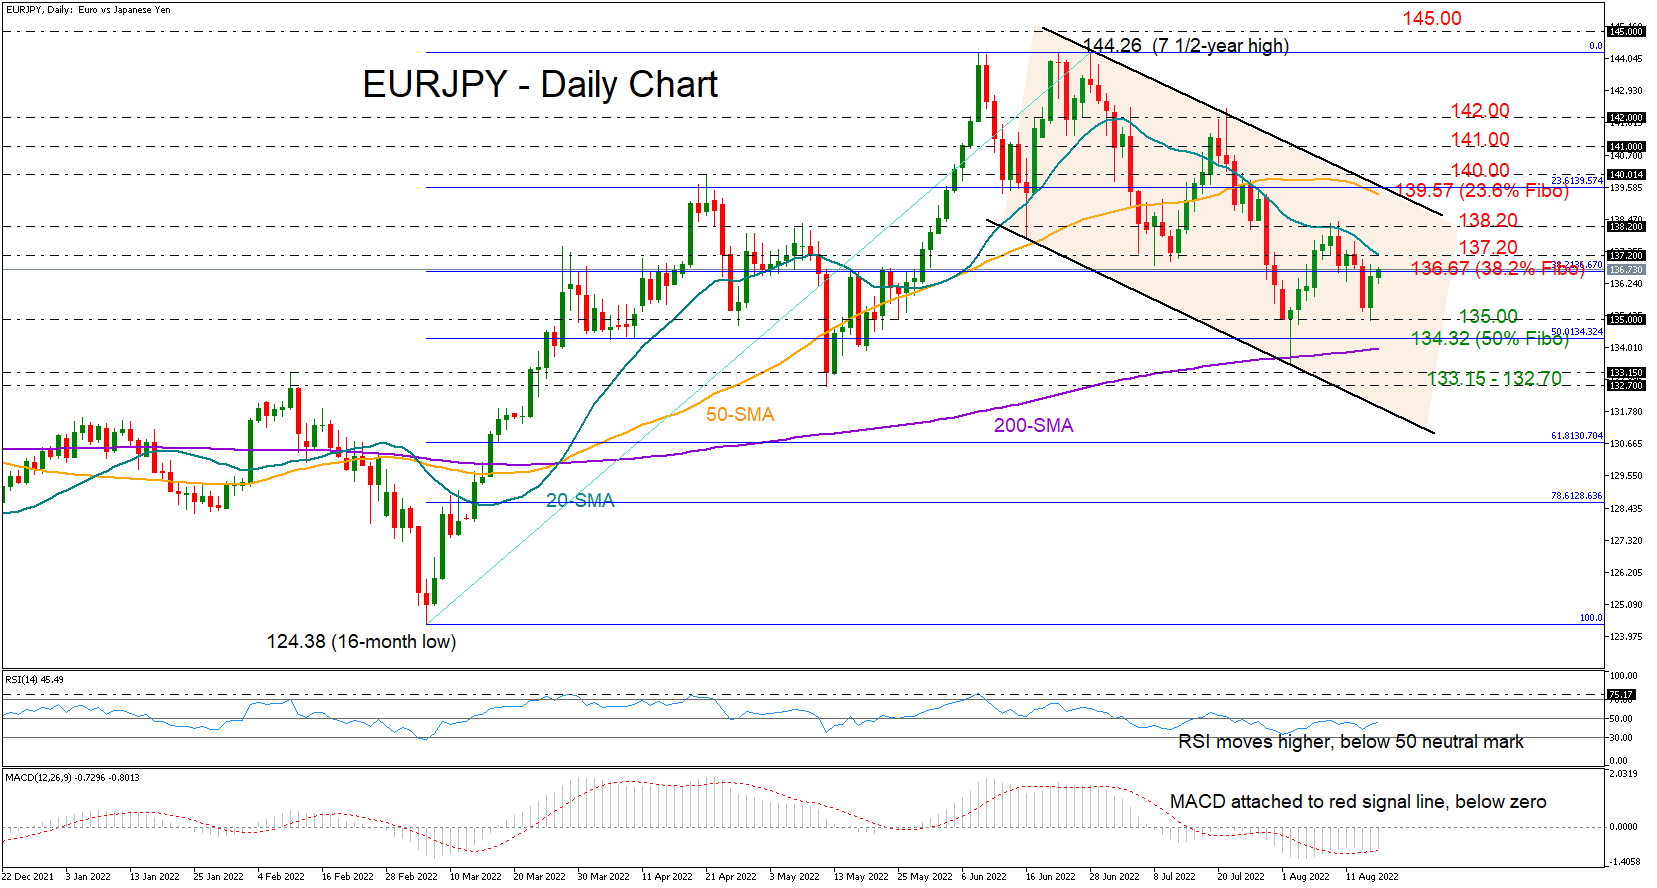
EURJPY stood firm again around the 135.00 support region on Tuesday, which triggered the preceding bullish wave, increasing hopes that the latest bearish correction has found a bottom.
The tough 20-day simple moving average (SMA), however, is still overhead, keeping downside risks alive at 137.20, while the 38.2% Fibonacci of the 124.38 – 144.26 upleg also seems a struggle to overcome today as it lies slightly lower at 136.67.
In other discouraging signs, the RSI and the MACD, although having pivoted northwards, remain within the negative area, with the former below its 50 neutral mark and the latter attached to its red signal line below zero.
Unless the bulls sustain their strength above 137.20, the price could flip back to test the 135.00 base. Failure to bounce here this time may initially see an extension towards the 50% Fibonacci of 134.32 and the 200-day SMA, and then a continuation towards the key constraining zone of 133.15 -132.70. Should selling pressures persist at this point, all eyes will turn to the channel's lower boundary at 131.86.
In the bullish scenario, where the pair finally closes above the 20-day SMA, the first obstacle could pop up around 138.20. A decisive step higher may run until the channel’s surface and the 50-day SMA at 139.42, where the 23.6% Fibonacci is also positioned. Beyond that, the 140.00 psychological mark, which halted April’s upside sequence, could immediately block the way towards the 141.00 and 142.00 round levels.
Summarizing, EURJPY seems to have set the stage for its next upside reversal, though whether it will be successful may depend on the restrictive 20-day SMA.
US 30 Stays Up
The Dow Jones 30 continues upward supported by upbeat outlooks from blue chip retail stocks. Confidence has shot up after a rise above the daily resistance at 33000 and then May’s high at 34000, setting 34500 at the origin of the liquidation in April as the target. A break above that supply zone would intensify the short squeeze. The RSI’s overbought situation on the daily chart may weigh on the enthusiasm. A retreat below 33850 could trigger a wave of profit-taking, and 33400 would test short-term buyers’ resolve.