Sample Category Title
ECB consumer survey: Inflation expectations up, growth expectations down
In ECB's Consumer Expectations Survey, consumers' mean perceived inflation over the past 12 months increased markedly from May's 8.2% to June's 8.6%. Median inflation perceptions over the previous 12 months rose from 6.6% to 7.2%.
Mean inflation expectations for 12 month ahead rose from 6.3% to 6.6%. Median inflation expectations for 12 months ahead rose from 4.9% to 5.0%.
Mean economic growth expectations for the next 12 months dropped from -1.0% to -1.3%. Median economic growth expectations was unchanged at 0%.
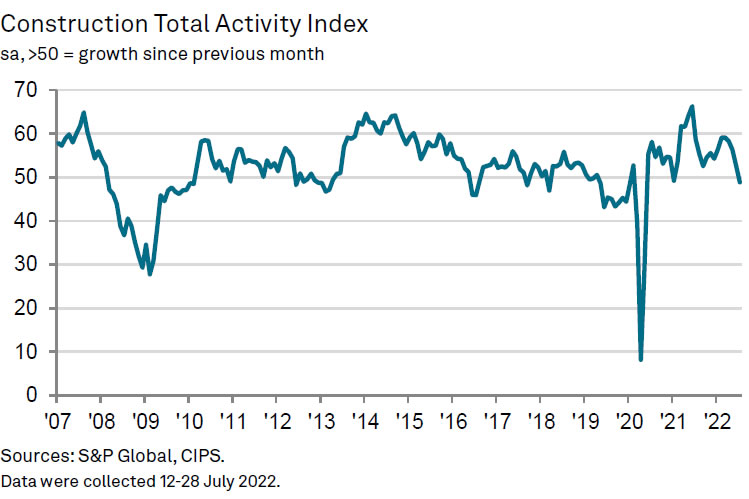
UK PMI construction dropped to 48.9, first contraction since since start of 2021
UK PMI Construction dropped from 52.6 to 48.9 in July, below expectation of 52.1. That's the first contraction reading since January 2021, and worst since May 2020.
Tim Moore, Economics Director at S&P Global Market Intelligence, said:
"July data illustrated that cost of living pressures, higher interest rates and increasing recession risks for the UK economy are taking a toll on construction activity. Total industry output fell for the first time since the start of 2021 as civil engineering joined house building in contraction territory.... Expectations for output growth in the next 12 months are far less exuberant than those seen over the past two years, amid concerns that elevated inflation and higher borrowing costs will constrain demand."
WTI Futures Break Below 200-Day SMA, Approaching Crucial Area
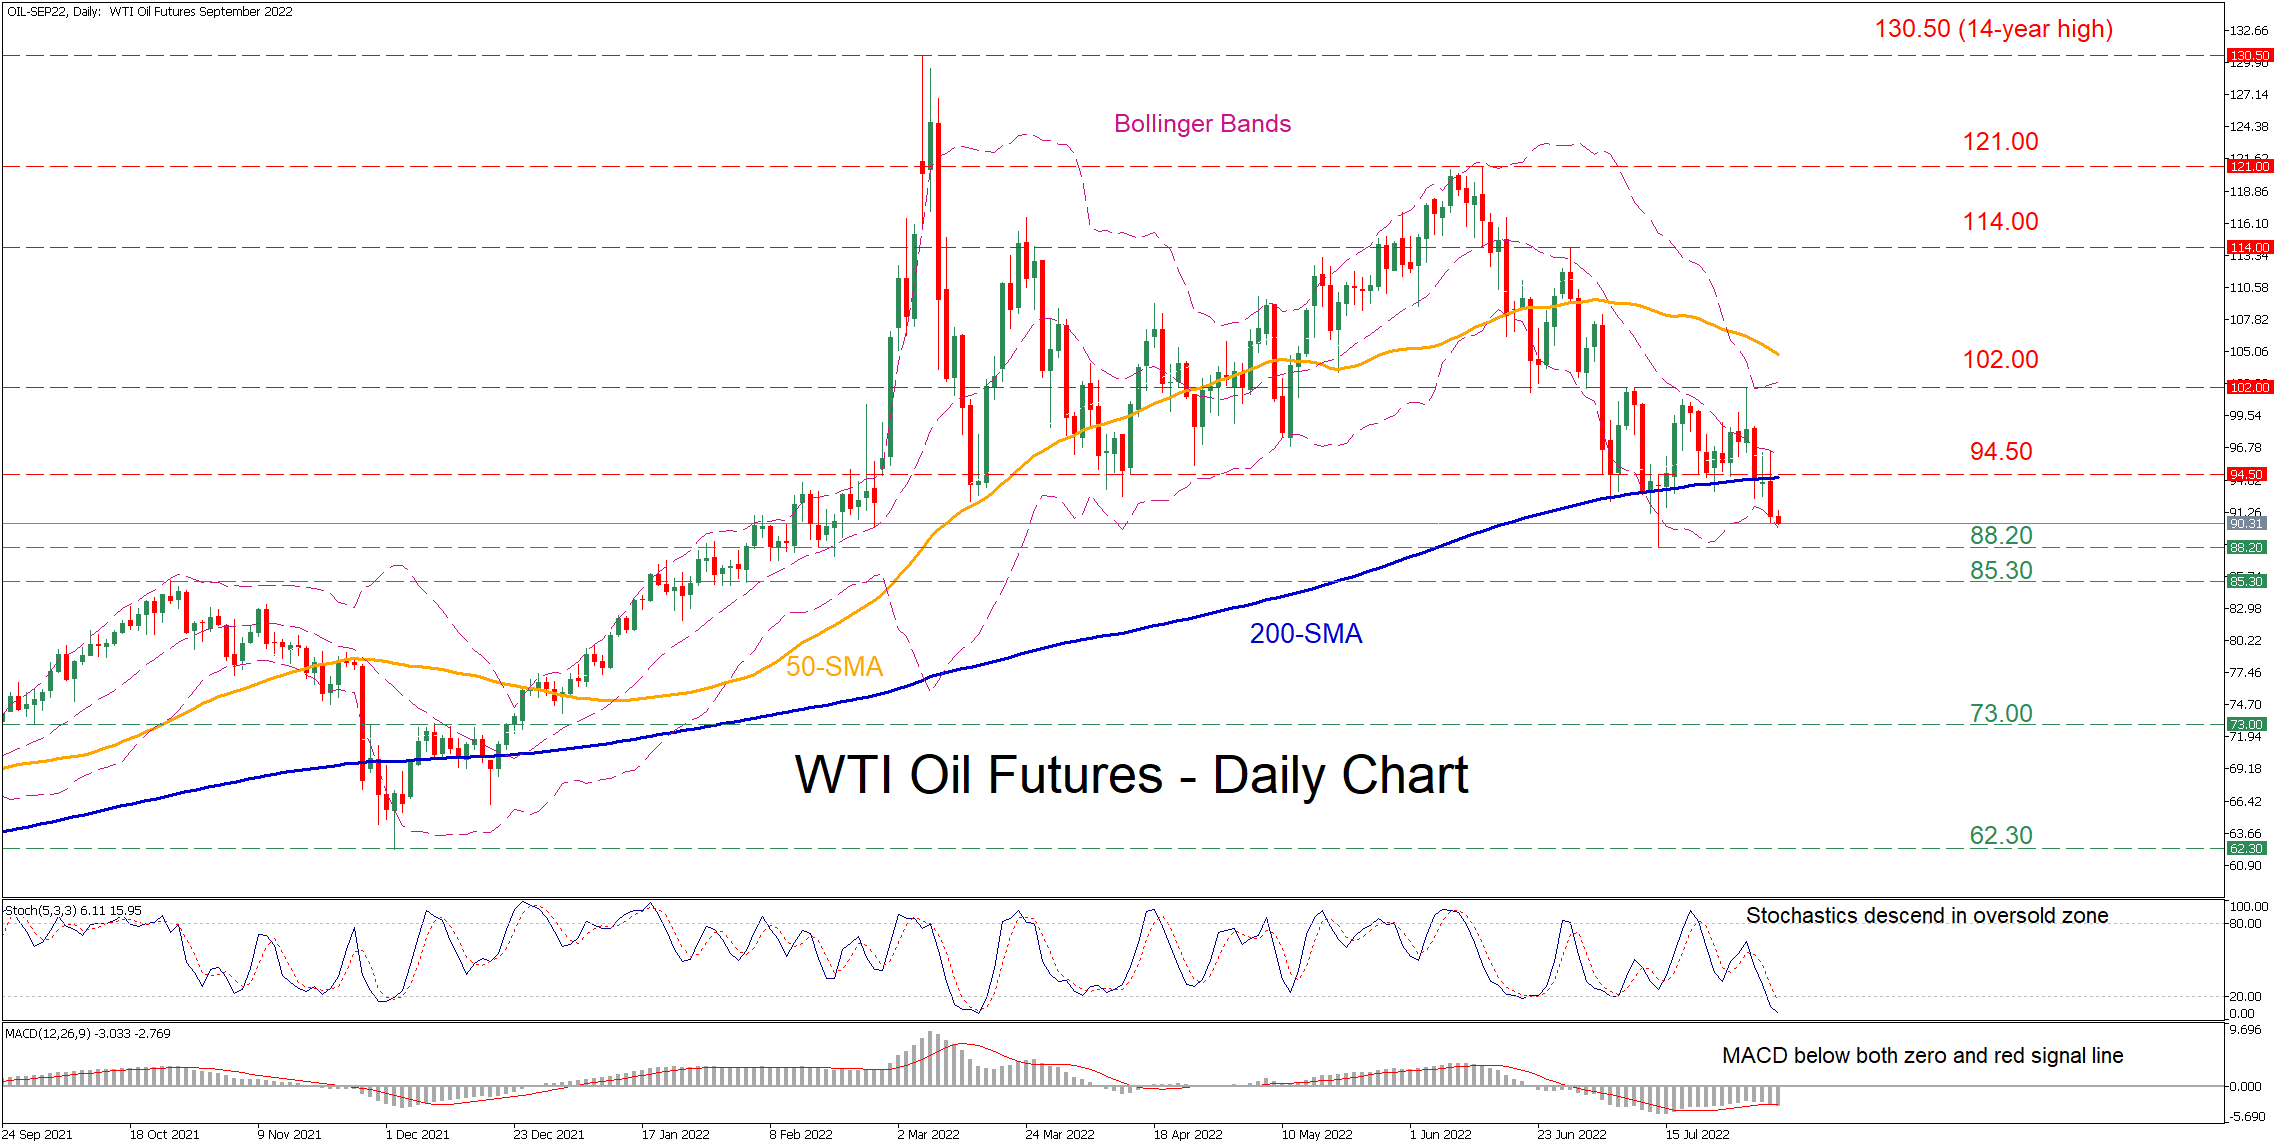
WTI oil futures (September delivery) have been losing ground since early June when the price failed to surpass the 121.00 mark. Although a further decline had been rejected multiple times by the 200-day simple moving average (SMA), the price managed to close below this important barrier, endorsing a broader bearish technical picture.
The momentum indicators suggest that near-term risks are tilted to the downside. Specifically, the stochastic oscillator is sloping downwards in the oversold zone, while the MACD histogram is currently below both zero and its red signal line.
Should the selling pressure persist, the recent low of 88.20 could act as the first line of defence. Sliding beneath that floor, the commodity could challenge 85.30, which has provided both support and resistance in the past, before 73.00 appears on the radar. Failing to halt there, the December low of 62.30 might prove to be a tough obstacle for the price to overcome.
On the flipside, the price could ascend to re-test the 200-day SMA, currently at 94.50. Conquering this barricade, the bulls could aim for the recent peak of 102.00 before the attention shifts to the 114.00 hurdle. An upside violation of the latter could open the door for the trend reversal point of 121.00.
Overall, the recent sell-off in WTI oil futures is likely to resume since the price managed to cross below the crucial 200-day SMA. Therefore, a break beneath the 88.20 floor could attract further selling interest, sending the price to form fresh multi-month lows.
AUDUSD Retraces Weekly Losses
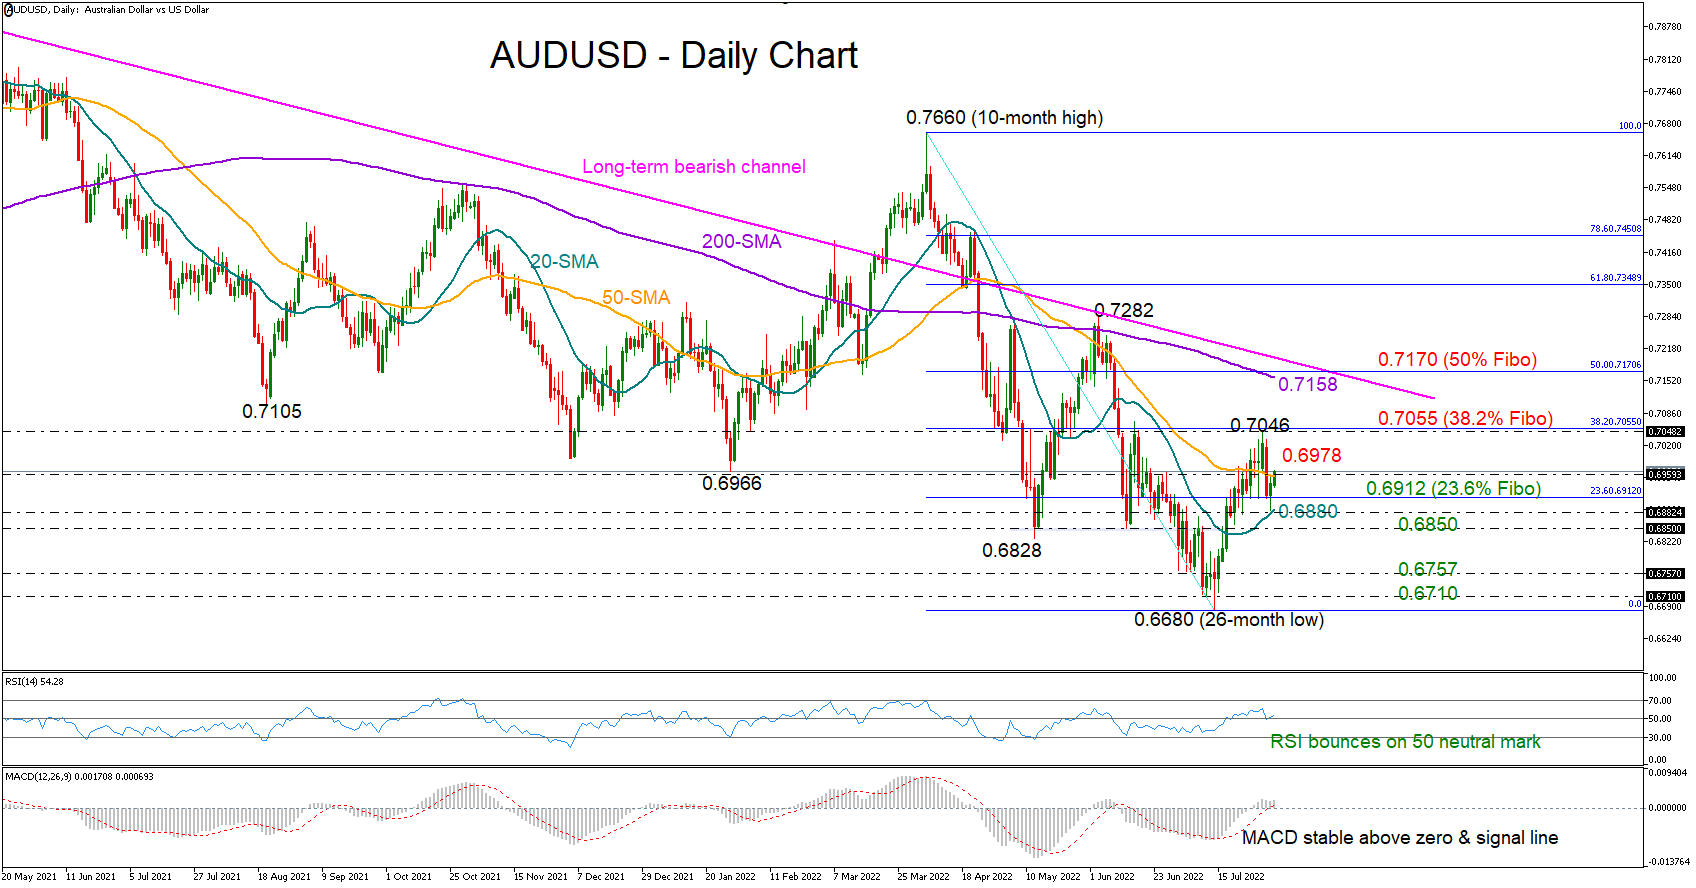
AUDUSD is tipping upwards again after setting a foothold around the 20-day simple moving average (SMA) at 0.6880 earlier this week.
Likewise, the RSI has avoided a drop below its 50 neutral mark, rotating northwards as well, while the MACD remains stable marginally above its zero and signal lines, both endorsing the positive momentum in the pair.
The 50-day SMA is currently constraining any additional increases at 0.6960. If it soon gives up, the door will open for the 0.7046 resistance zone, where the 38.2% Fibonacci retracement of the 0.7660 – 06680 downleg is placed. Above that, the price could advance towards the 200-day SMA at 0.7158 and the long-term descending trendline drawn from the 2021 top, which resumed its resistance role back in June.
In the event of a downside reversal, the bears will again push for a close below the 23.6% Fibonacci of 0.6912 and the 20-day SMA. If their efforts prove successful, with the price tumbling below the 0.6850 barrier too, the sell-off could proceed quickly towards the 0.6750 – 0.6710 key support area.
Summing up, AUDUSD is showing an appetite for some recovery, though only a sustainable extension above the previous high of 0.7046 would boost market sentiment.
US July NFP Expected to Slow
The headline number of job gains so far this year has left policymakers quite happy. But a look under the surface shows some troubling signs. And they are expected to be exacerbated by the data forecast for tomorrow.
In the context of the Fed reasserting its intention to keep raising rates to control inflation, jobs numbers aren't as important for monetary policy at the moment. But they are an important indicator for the underlying health of the economy. Which is particularly relevant now that many people are using large job numbers as an explanation for why the US shouldn't be considered in a recession.
Taking a deeper dive
The total number of employed persons in the US has yet to reach pre-pandemic levels, despite substantial jobs gains over the last couple of years. With this data release, the total number of people employed could finally surpass the total number in Jan 2020. But that's still a problem, since the "normal" projection of population would have implied employment growth during the period. The US is still over 4 million jobs behind where the labor market would be without the pandemic recession.
That can be seen in the labor force participation rate which remains stubbornly at 62.2%. It recovered somewhat last year, but since then has been well below pre-pandemic levels. Actually, it's equivalent to where it was in the early 80s (you know, back when there was massive inflation for the last time). This goes hand in hand with the remarkable phenomenon that despite adding massive amounts of jobs in the last several months, the unemployment rate has remained pretty steady at 3.6%. And both of those figures are expected to remain changed in July.
A possible (worrying) explanation
The total number of open jobs still nearly doubles the number of jobseekers. The latest BLS report showed there were 10.7M job openings with just 5.9M people looking for work. More importantly, though, is that last month there were 372K new hires, but the number of job openings diminished by 605K.
In normal market conditions, the number of job openings and the number of job seekers is largely matched. So, there is a reduction in job offers, that rather quickly correlates with a drop off in hiring. However, with such a large difference between the number of job offers and job seekers, there can be substantial reductions in the number of new jobs, and still have substantial job increases. Effectively, masking a deteriorating labor market.
What to look out for
The consensus is that the US created net 250K jobs in July, down from the 372K reported in June. Usually, a result above 200K is seen as really good, but these aren't normal conditions.
Perhaps of even more importance is average hourly earnings which are also expected to slow growth to 4.9% from 5.1%. Since inflation was last reported at 9.1%, that implies that real wages have continued to fall. Implies less disposable income among consumers to keep supporting the economy.
GBP/JPY Daily Outlook
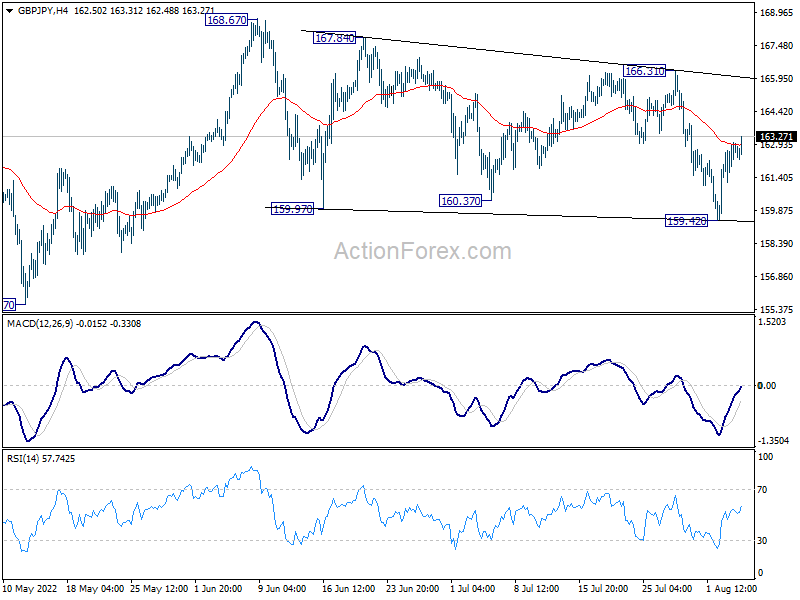
Daily Pivots: (S1) 161.55; (P) 162.30; (R1) 163.38; More...
Range trading continues in GBP/JPY and intraday bias remains neutral first. Consolidation from 168.67 could still extend further. Break of 166.31 resistance will be the first sign of up trend resumption. meanwhile, break of 159.42 will bring deeper fall towards 155.57 support next.
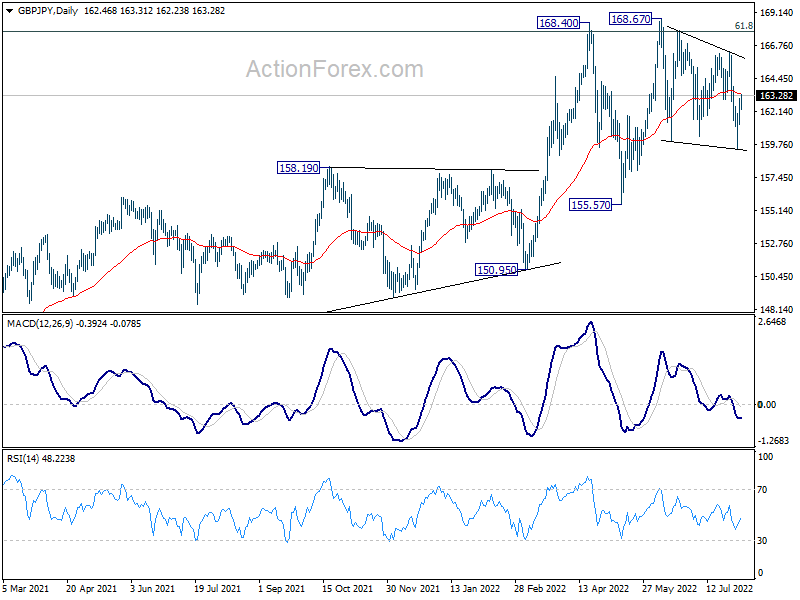
In the bigger picture, up trend from 123.94 (2020 low) is still in progress. Sustained break of 61.8% retracement of 195.86 (2015 high) to 122.75 (2016 low) at 167.93 will be a long term bullish signal, and could pave the way back to 195.86 high. This will now remain the favored case as long as 155.57 support holds, even in case of deep pull back.
EUR/JPY Daily Outlook
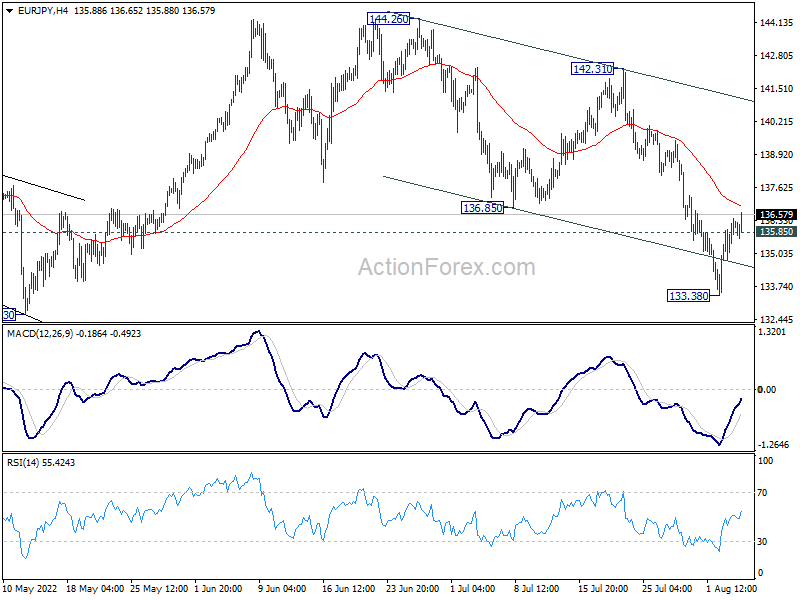
Daily Pivots: (S1) 135.18; (P) 135.80; (R1) 136.76; More....
EUR/JPY's break of 135.85 minor resistance suggests short term bottoming at 133.38, after defending 134.11 key support. Intraday bias is back on the upside for 55 day EMA (now at 138.54). Sustained break there will suggest that whole correction from 144.26 has completed. This will now remain the favored case as long as 133.38 support holds.
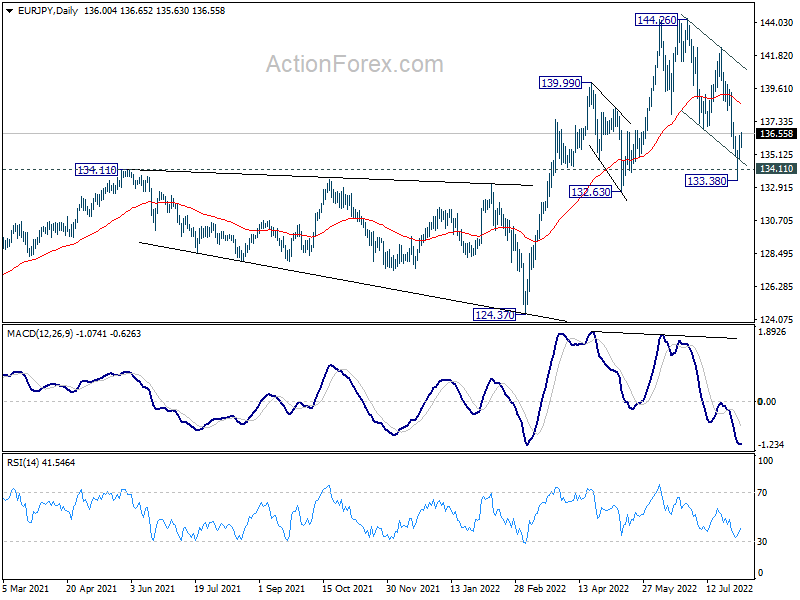
In the bigger picture, up trend from 114.42 (2020 low) is seen as the third leg of the pattern from 109.30 (2016 low). Further rally is in favor as long as 134.11 resistance turned support holds, even in case of deep pull back. Next target is 149.76 (2015 high). However, sustained break of 134.11 will be a sign of medium term bearish reversal and turn focus to 124.37 support for confirmation.
EUR/AUD Daily Outlook
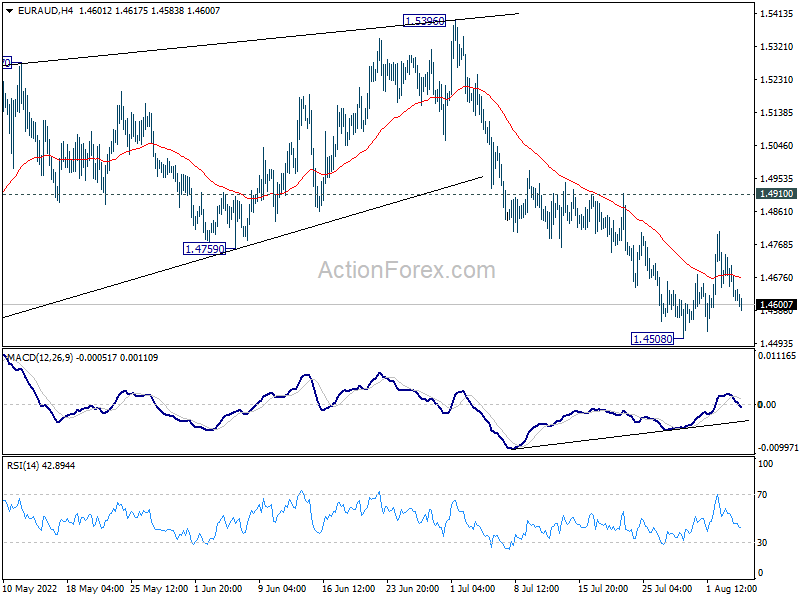
Daily Pivots: (S1) 1.4584; (P) 1.4663; (R1) 1.4711; More...
Intraday bias in EUR/AUD remains neutral for the moment. While stronger recovery cannot be ruled out, upside should be limited below 1.4910 resistance to bring fall resumption. On the downside, break the 1.4508 will resume the decline from 1.5396 to retest 1.4318 low. However, firm break of 1.4910 will dampen this bearish view and bring stronger rally.
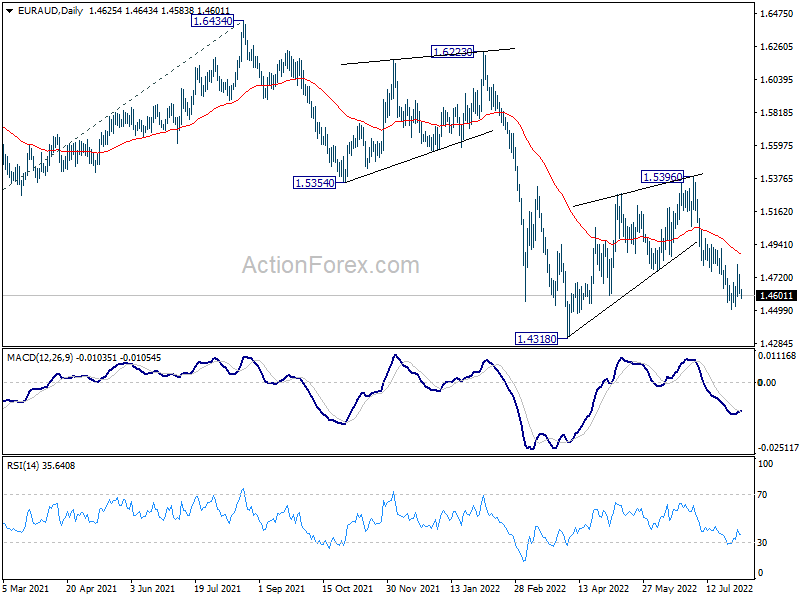
In the bigger picture, rejection by 1.5354 support turned resistance, as well as 55 week EMA (now at 1.5378), maintain medium term bearishness. That is, larger down trend from 1.9799 is not completed yet. Break of 1.4318 low will target 61.8% projection of 1.9799 to 1.5250 from 1.6434 at 1.3623, which is close to 1.3624 long term support (2017 low). This will remain the favored case now as long as 1.5396 resistance holds.
EUR/GBP Daily Outlook
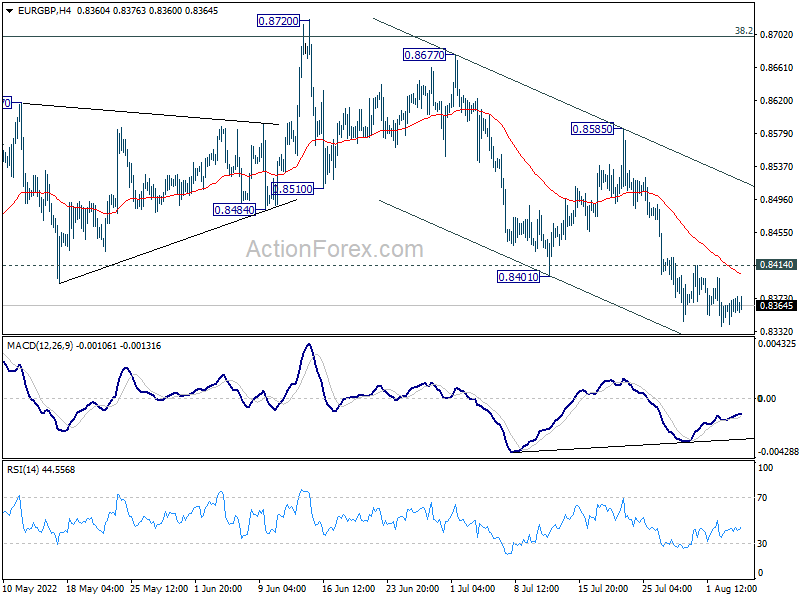
Daily Pivots: (S1) 0.8351; (P) 0.8363; (R1) 0.8383; More...
Intraday bias in EUR/GBP stays on the downside. Current fall from 0.8720 should target a retest on 0.8201 low. On the upside, above 0.8414 minor resistance will turn intraday bias neutral again. But outlook will stays cautiously bearish as long as 0.8585 resistance holds.
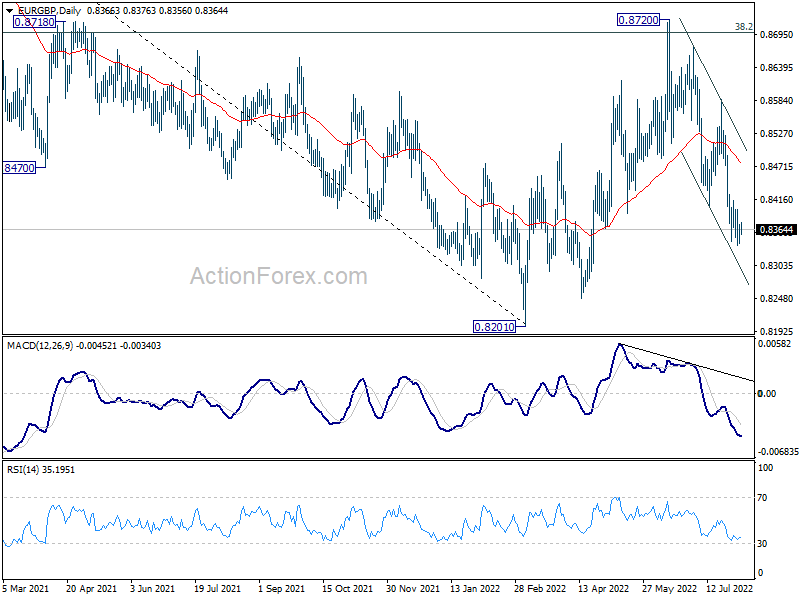
In the bigger picture, current development suggests rejection by 38.2% retracement of 0.9499 to 0.8201 at 0.8697. Medium term term bearishness is maintained. Break of 0.8201 will resume larger down trend from 0.9499 (2020 high). Nevertheless, sustained break of 0.8697 will affirm the case that rise from 0.8201 is a medium term up trend itself.
EUR/CHF Daily Outlook
Daily Pivots: (S1) 0.9732; (P) 0.9758; (R1) 0.9791; More....
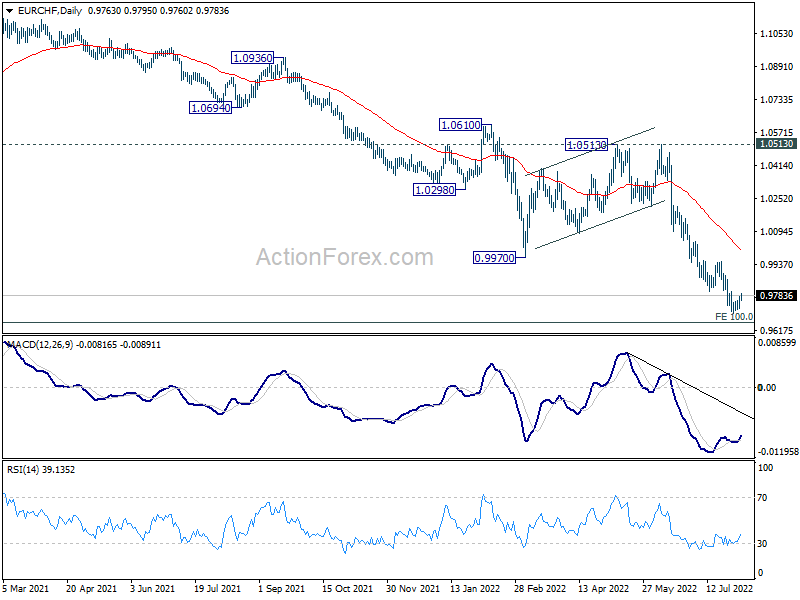
Intraday bias in EUR/CHF remains neutral for consolidation above 0.9697. While further fall cannot be ruled out, some support might be seen from 0.9650 long term projection level to bring rebound. Break of 0.9948 resistance will indicate short term bottoming. Nevertheless, firm break of 0.9650 will target 100% projection of 1.1149 to 0.9970 from 1.0513 at 0.9334.
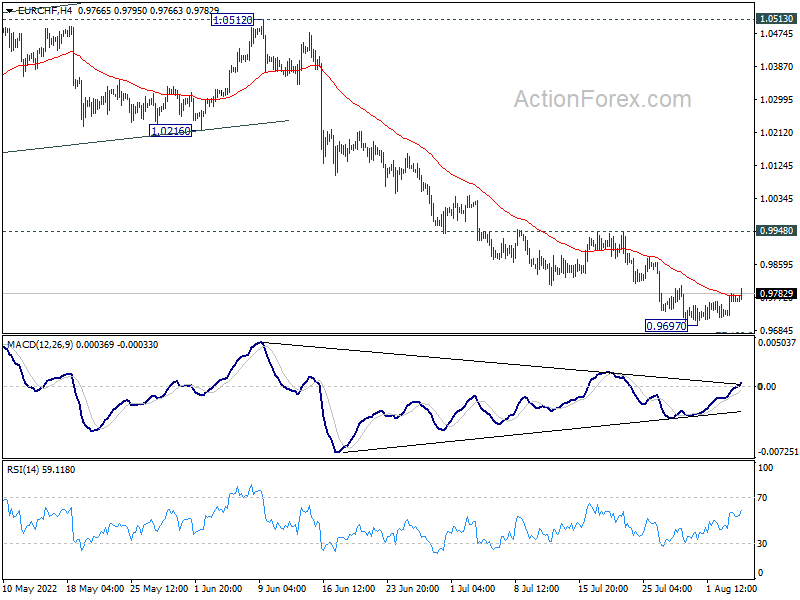
In the bigger picture, long term down trend from 1.2004 (2018 high) is expected to target 100% projection of 1.2004 to 1.0505 to 1.1149 at 0.9650. Firm break there will target 138.2% projection at 0.9033. On the upside, break of 1.0513 resistance is needed to indicate medium term bottoming. Otherwise, outlook will stay bearish in case of strong rebound.