Sample Category Title
Not Yet time for BoE to Pause, Let Alone Flip
Markets
The Bank of England policy meeting was widely watched yesterday, not only by UK but also by European and US markets. Governor Bailey’s MPC raised rates by 50 bps to 1.75%, following global peers in larger-sized increases. The BoE will start selling UK gilts actively shortly after the September meeting, tightening policy on another front. Inflationary pressure have intensified markedly. Both external (near doubling of gas prices) as domestic (increased wage pressures) lie at the roots of inflation that may peak at more than 13% in Q4 this year. But the economy is expected to have entered a recession at that same point in time. It is projected to last all the way through 2023 as real household income drops sharply this year and the next and consumption growth turns negative. Regarding future policy moves, the BoE has tweaked guidance into being open-minded but above all data-dependent. The grim economic assessment triggered a hefty repositioning especially at the front end of the UK curve. But much of that was reversed shortly after as markets assume it’s not yet time for the BoE to pause let alone flip the tightening cycle. The 2y UK yield undid an 11 bps drop to finish 1.1 bps higher. Yields with longer tenors shed a mere 1.7 to 2.3 bps. German yields were unable to stage such intraday comeback. They finished up to 7.1 bps lower (10y). Swap yields dropped between 2.9 and 7.2 bps, the belly outperforming. US yields due to recent Fed comments were a bit better protected but not immune. Changes on the curve varied from -3.3 bps in the middle segment to +2 bps at the longest tenors. A further decline in oil prices also weighed on core bond yields. Brent slid 2.75% to $94.12/b amid rising inventories and slowing demand. It’s the lowest level since the Russian invasion. Sterling took a hit. Despite policy rate expectations not having changed that much, the currency did anticipate quite a bit on today’s meeting with some profit-taking as a result. EUR/GBP jumped from 0.837 to 0.843. EUR/USD didn’t budge for most of the day before dollar weakness kicked in as US dealings got rolling. The pair settled around 1.025. Trade-weighted DXY slipped sub 106 again. Equity markets traded choppy and without a clear direction.
Asian stocks this morning trade mostly in the green following a mixed/choppy performance on WS the day before. Core bonds trade flat and the dollar tries to recuperate some of yesterday’s losses as it heads into the US labour market report for July. Analysts expect job growth to have slowed from previous months but to remain at solid 250k. Pay growth is expected to be at 0.3% m/m and 4.9% y/y. In terms of the market reaction, there’s an asymmetric risk. We expect a (more than) decent jobs report that will back this week’s Fed comments and underscore the need for more tightening. Yields may bottom out further in such circumstances. However, as markets are still in a recessionary state of mind an undershoot will be seen as validating their recent dovish repositioning and may trigger a heftier response. In our base scenario though, we believe the USD along with US yields to come out stronger today.
News Headlines
The Reserve Bank of India raised rates from 4.90% to 5.40% today. Consensus expected a smaller increment to 5.25%. The decision was unanimous and brings the policy rate at levels last seen before the pandemic. Inflationary pressures are broad based and core inflation remains elevated, governor Das said. He added that price pressures, 7.01% y/y in June are expected to remain above the 2-6% target range for some time. Relieve from softening global commodity prices are unlikely to pass through in the short run because of the dramatic weakening of the rupee to record lows. USD/INR hit 80 mid-July. The rupee has recovered only marginally since then. The couple is trading around 79.10 in the wake of the RBI decision.
EUR/USD Daily Outlook
Daily Pivots: (S1) 1.0183; (P) 1.0219; (R1) 1.0282; More...
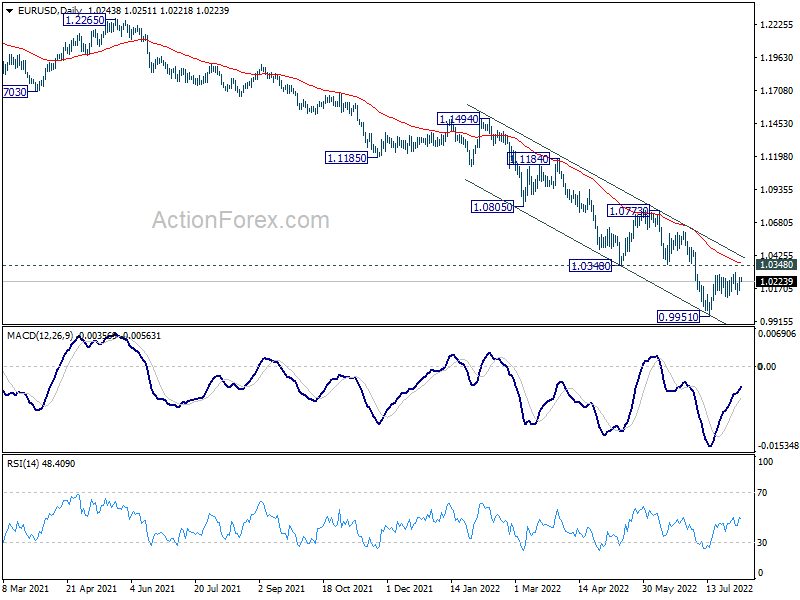
Range trading continues in EUR/USD and intraday bias remains neutral. With 1.0095 minor support intact, further rise is still mildly in favor. Rebound from 0.9951 will target 1.0348 support turned resistance. Break there will target channel resistance at 1.0432. On the downside, break of 1.0095 minor support will turn bias back to the downside, and bring retest of 0.9951 low instead.
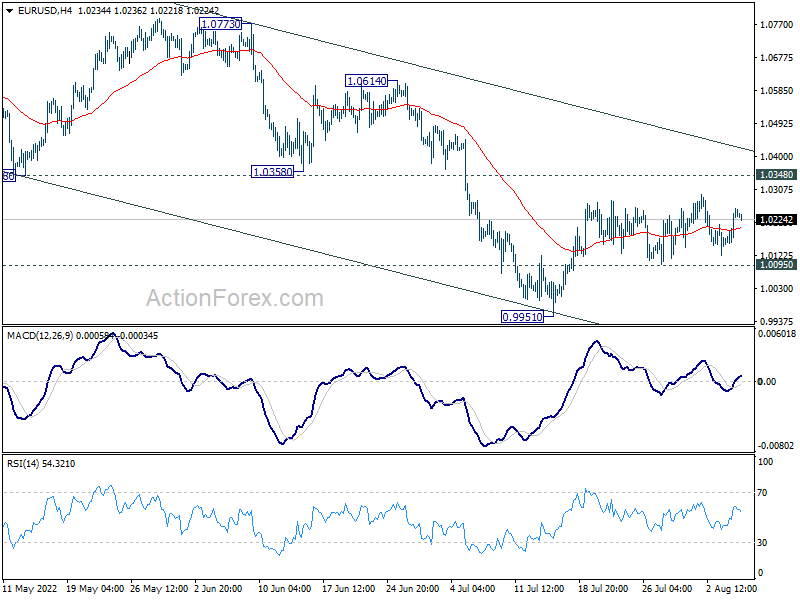
In the bigger picture, down trend from 1.6039 (2008 high) is still in progress. Next target is 100% projection of 1.3993 to 1.0339 from 1.2348 at 0.8694. In any case, outlook will stay bearish as long as 1.0773 resistance holds, in case of strong rebound.
Markets in Quiet Mode, Awaiting US Job Data
The currency markets are quiet overall as focus now turns to US job data. The post BoE selloff in Sterling didn't last long. Meanwhile, Dollar is still range bound against Euro and Yen. The greenback's rally attempt against Swiss Franc also faltered rather quickly. Commodity currencies are steady. Most major pairs and crosses are stuck inside last week's range. Hopefully, today's non-farm payroll will bring some life back to the markets.
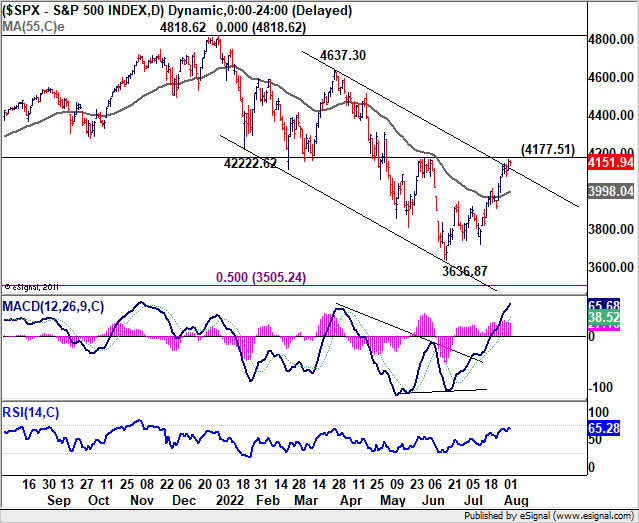
Technically, the development in US stock markets, in reaction to NFP, could be the leading factor in other markets. S&P 500 has been making some progress in securing a near term bullish reversal. Immediate focus will be on 4177.51 resistance. Strong break there and a weekly close above should confirm that whole correction from 4818.52 has completed with three waves down to 3636.87. That would set the stage for more upside in SPX for the rest of Q3, and set the risk-on tone which would give Dollar and Yen some extended pressure.
In Asia, Nikkei closed up 0.85%. Hong Kong HSI is up 0.25%. China Shanghai SSE is up 0.59%. Singapore Strait Times is up 0.30%. Japan 10-year JGB yield is down -0.0084 at 0.167. Overnight, DOW dropped -0.26%. S&P 500 dropped -0.08%. NASDAQ rose 0.41%. 10-year yield dropped -0.072 to 2.676.
Australia AiG services rose to 51.7, two-speed sector emerges
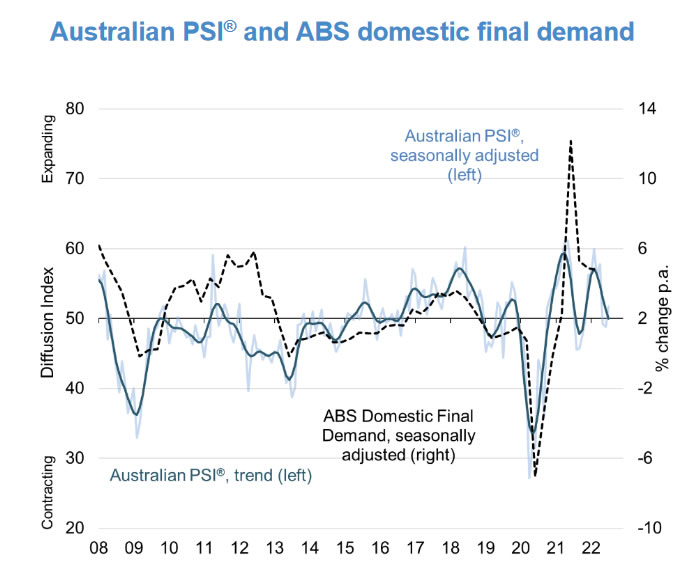
Australia AiG Performance of Services rose 2.9 pts to 51.7 in July. Sales jumped 7.4 to 49.3. However, employment dropped -2.9 to 52.4. New orders rose 1.7 to 50.6. Supplier deliveries rose 5.9 to 47.6. Input prices rose 5.3 to 74.3. Selling prices dropped -3.8 to 63.4.
Innes Willox, Chief Executive of Ai Group, said: "We are seeing a 'two-speed' services sector emerge as businesses contend with labour shortages and rising interest rates. Business & property and personal services grew dramatically in July, while retail & hospitality and logistics fell dramatically. Chronic labour shortages and a super-charged winter spike in absenteeism are large and growing challenges for labour-intensive service industries. And rising interest rates are dampening consumer sentiment, casting a shadow over consumer-facing sectors."
Fed Mester: Interest rates continue to rise this year and into next through first half
Cleveland Fed President Loretta Mester said that "interest rates continue to rise this year and into next year through the first half and maybe by then we can pause and we can start bringing them back down." She would "pencil in going a bit above four as appropriate".
As for September meeting, she said, "it's not unreasonable to think we might have to do a 75 (basis point move) but I can imagine it could be a 50. We'll just have to look at the data as it comes in."
Gold resumes rally as focus turns to NFP
US non-farm payroll report is a major focus today. Employment is expected to grow 250k in July. Unemployment rate is forecast to be unchanged at 3.6%. Average hourly earnings would maintain a growth pace of 0.3% mom.
Looking at related data, ISM manufacturing employment ticked up from 47.3 to 49.9. ISM services employment rose from 47..4 to 49.1. Four-week moving average of initial claims rose from 233k to 255k. Overall, these data suggest that there won't be a blockbuster NFP today. Wage growth would likely be the more market moving part.
Here are some readings on NFP:
- NFP Preview: Will We See the Lowest Jobs Reading Since 2020?
- US July NFP Expected to Slow
- Dollar Awaits Nonfarm Payrolls as Recession Worries Mount
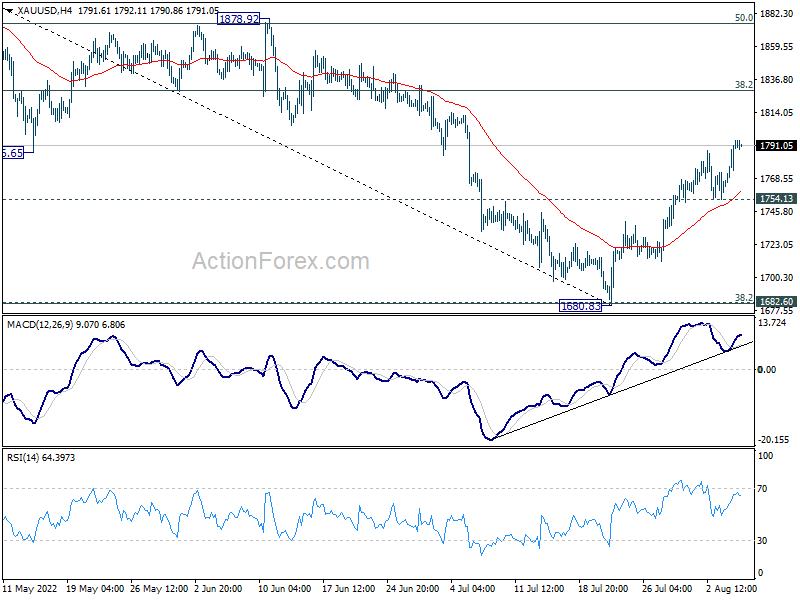
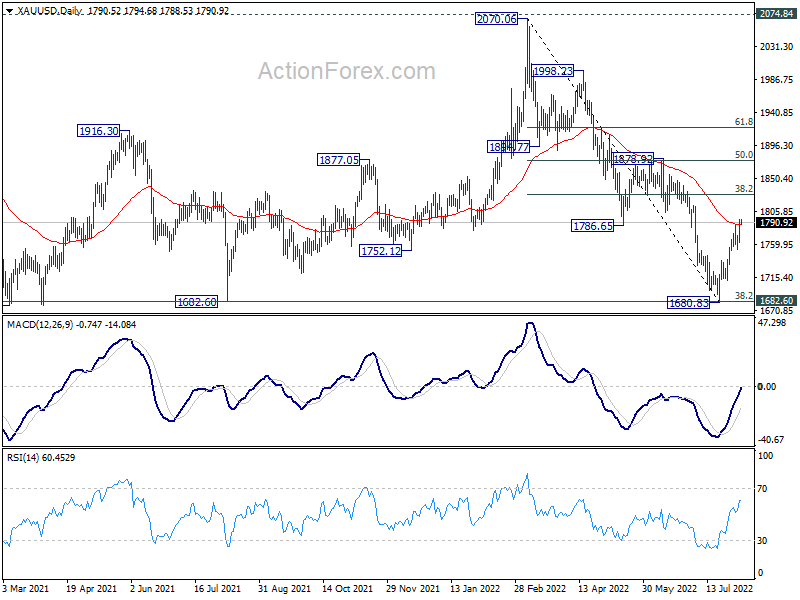
Gold's rally from 1680.83 resumed after brief retreat and breaks through 1786.65 resistance. The development adds to the case that whole decline from 2070.06 has completed after defending 1682.60 key support. Further rally is now in favor as long as 1754.13 minor support holds, for 38.2% retracement of 2070.06 to 1680.83 at 1829.51. The move could be accompanied by another round of near term selloff in Dollar.
Elsewhere
Japan labor cash earnings rose 2.2% yoy in June versus expectation of 1.9% yoy. Household spending rose 3.5% yoy versus expectation of 1.5% yoy. Germany industrial production rose 0.4% mom in June, versus expectation of -0.2% mom decline.
France trade balance and Italy industrial production will be released in European session. Later in the data, in addition to US NFP, Canada will also publish job data and Ivey PMI.
EUR/USD Daily Outlook
Daily Pivots: (S1) 1.0183; (P) 1.0219; (R1) 1.0282; More...
Range trading continues in EUR/USD and intraday bias remains neutral. With 1.0095 minor support intact, further rise is still mildly in favor. Rebound from 0.9951 will target 1.0348 support turned resistance. Break there will target channel resistance at 1.0432. On the downside, break of 1.0095 minor support will turn bias back to the downside, and bring retest of 0.9951 low instead.
In the bigger picture, down trend from 1.6039 (2008 high) is still in progress. Next target is 100% projection of 1.3993 to 1.0339 from 1.2348 at 0.8694. In any case, outlook will stay bearish as long as 1.0773 resistance holds, in case of strong rebound.
Economic Indicators Update
| GMT | Ccy | Events | Actual | Forecast | Previous | Revised |
|---|---|---|---|---|---|---|
| 22:30 | AUD | AiG Performance of Services Index Jul | 51.7 | 48.8 | ||
| 23:30 | JPY | Labor Cash Earnings Y/Y Jun | 2.20% | 1.90% | 1.00% | |
| 23:30 | JPY | Overall Household Spending Y/Y Jun | 3.50% | 1.50% | -0.50% | |
| 05:00 | JPY | Leading Economic Index JunP | 100.6 | 101.2 | 101.2 | |
| 06:00 | EUR | Germany Industrial Production M/M Jun | 0.40% | -0.20% | 0.20% | |
| 06:45 | EUR | France Trade Balance (EUR) Jun | -12.3B | -13.0B | ||
| 08:00 | EUR | Italy Industrial Output M/M Jun | -0.30% | -1.10% | ||
| 12:30 | USD | Nonfarm Payrolls Jul | 250K | 372K | ||
| 12:30 | USD | Unemployment Rate Jul | 3.60% | 3.60% | ||
| 12:30 | USD | Average Hourly Earnings M/M Jul | 0.30% | 0.30% | ||
| 12:30 | CAD | Net Change in Employment Jul | 25.0K | -43.2K | ||
| 12:30 | CAD | Unemployment Rate Jul | 5.00% | 4.90% | ||
| 14:00 | CAD | Ivey PMI Jul | 60.3 | 62.2 |
Gold resumes rally as focus turns to NFP
US non-farm payroll report is a major focus today. Employment is expected to grow 250k in July. Unemployment rate is forecast to be unchanged at 3.6%. Average hourly earnings would maintain a growth pace of 0.3% mom.
Looking at related data, ISM manufacturing employment ticked up from 47.3 to 49.9. ISM services employment rose from 47..4 to 49.1. Four-week moving average of initial claims rose from 233k to 255k. Overall, these data suggest that there won't be a blockbuster NFP today. Wage growth would likely be the more market moving part.
Here are some readings on NFP:
- NFP Preview: Will We See the Lowest Jobs Reading Since 2020?
- US July NFP Expected to Slow
- Dollar Awaits Nonfarm Payrolls as Recession Worries Mount
Gold's rally from 1680.83 resumed after brief retreat and breaks through 1786.65 resistance. The development adds to the case that whole decline from 2070.06 has completed after defending 1682.60 key support. Further rally is now in favor as long as 1754.13 minor support holds, for 38.2% retracement of 2070.06 to 1680.83 at 1829.51. The move could be accompanied by another round of near term selloff in Dollar.
Australia AiG services rose to 51.7, two-speed sector emerges
Australia AiG Performance of Services rose 2.9 pts to 51.7 in July. Sales jumped 7.4 to 49.3. However, employment dropped -2.9 to 52.4. New orders rose 1.7 to 50.6. Supplier deliveries rose 5.9 to 47.6. Input prices rose 5.3 to 74.3. Selling prices dropped -3.8 to 63.4.
Innes Willox, Chief Executive of Ai Group, said: "We are seeing a 'two-speed' services sector emerge as businesses contend with labour shortages and rising interest rates. Business & property and personal services grew dramatically in July, while retail & hospitality and logistics fell dramatically. Chronic labour shortages and a super-charged winter spike in absenteeism are large and growing challenges for labour-intensive service industries. And rising interest rates are dampening consumer sentiment, casting a shadow over consumer-facing sectors."
Fed Mester: Interest rates continue to rise this year and into next through first half
Cleveland Fed President Loretta Mester said that "interest rates continue to rise this year and into next year through the first half and maybe by then we can pause and we can start bringing them back down." She would "pencil in going a bit above four as appropriate".
As for September meeting, she said, "it's not unreasonable to think we might have to do a 75 (basis point move) but I can imagine it could be a 50. We'll just have to look at the data as it comes in."
Technical Outlook and Review
USD/JPY:
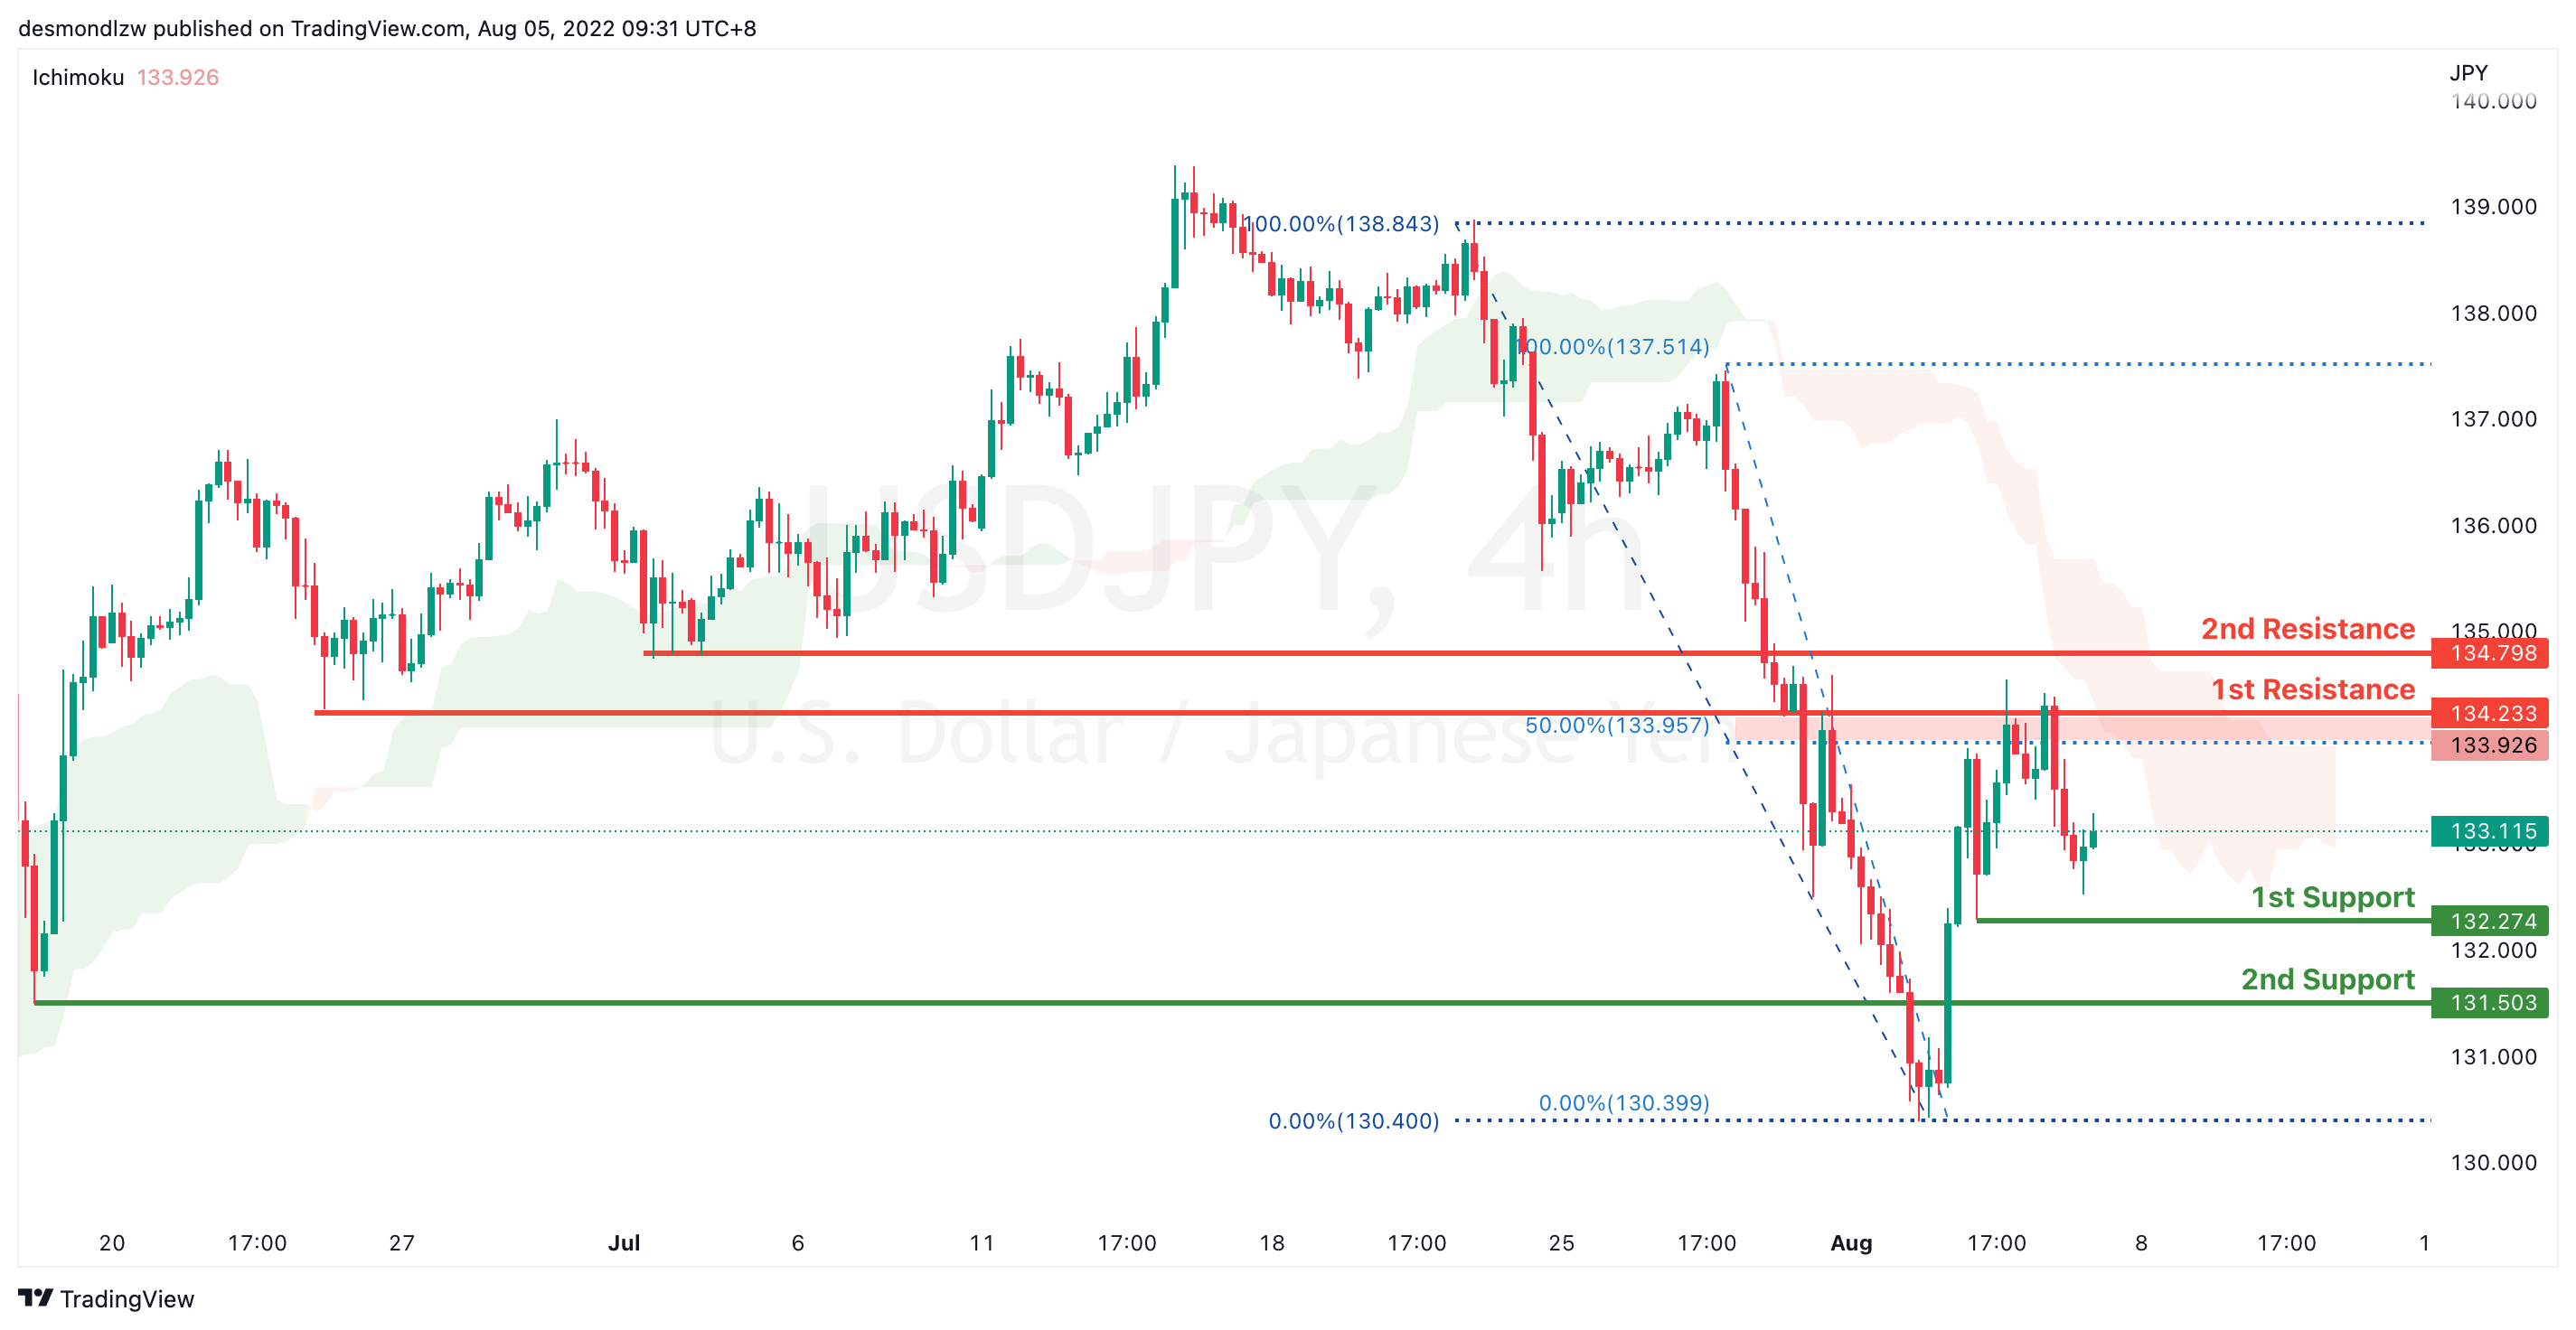
On the H4, price is slightly bullish biased as it fails to break the first support. It is now going to test at the first support at the first resistance where the 50% retracement sits at 134.233. If prices were to break the first resistance it will go to the second resistance at the previous swing low 134.798. Alternatively, price could pull back to test at the first support 132.274
Areas of consideration:
- H4 time frame, 1st resistance at 134.233
- H4 time frame, 1st support at 132.274
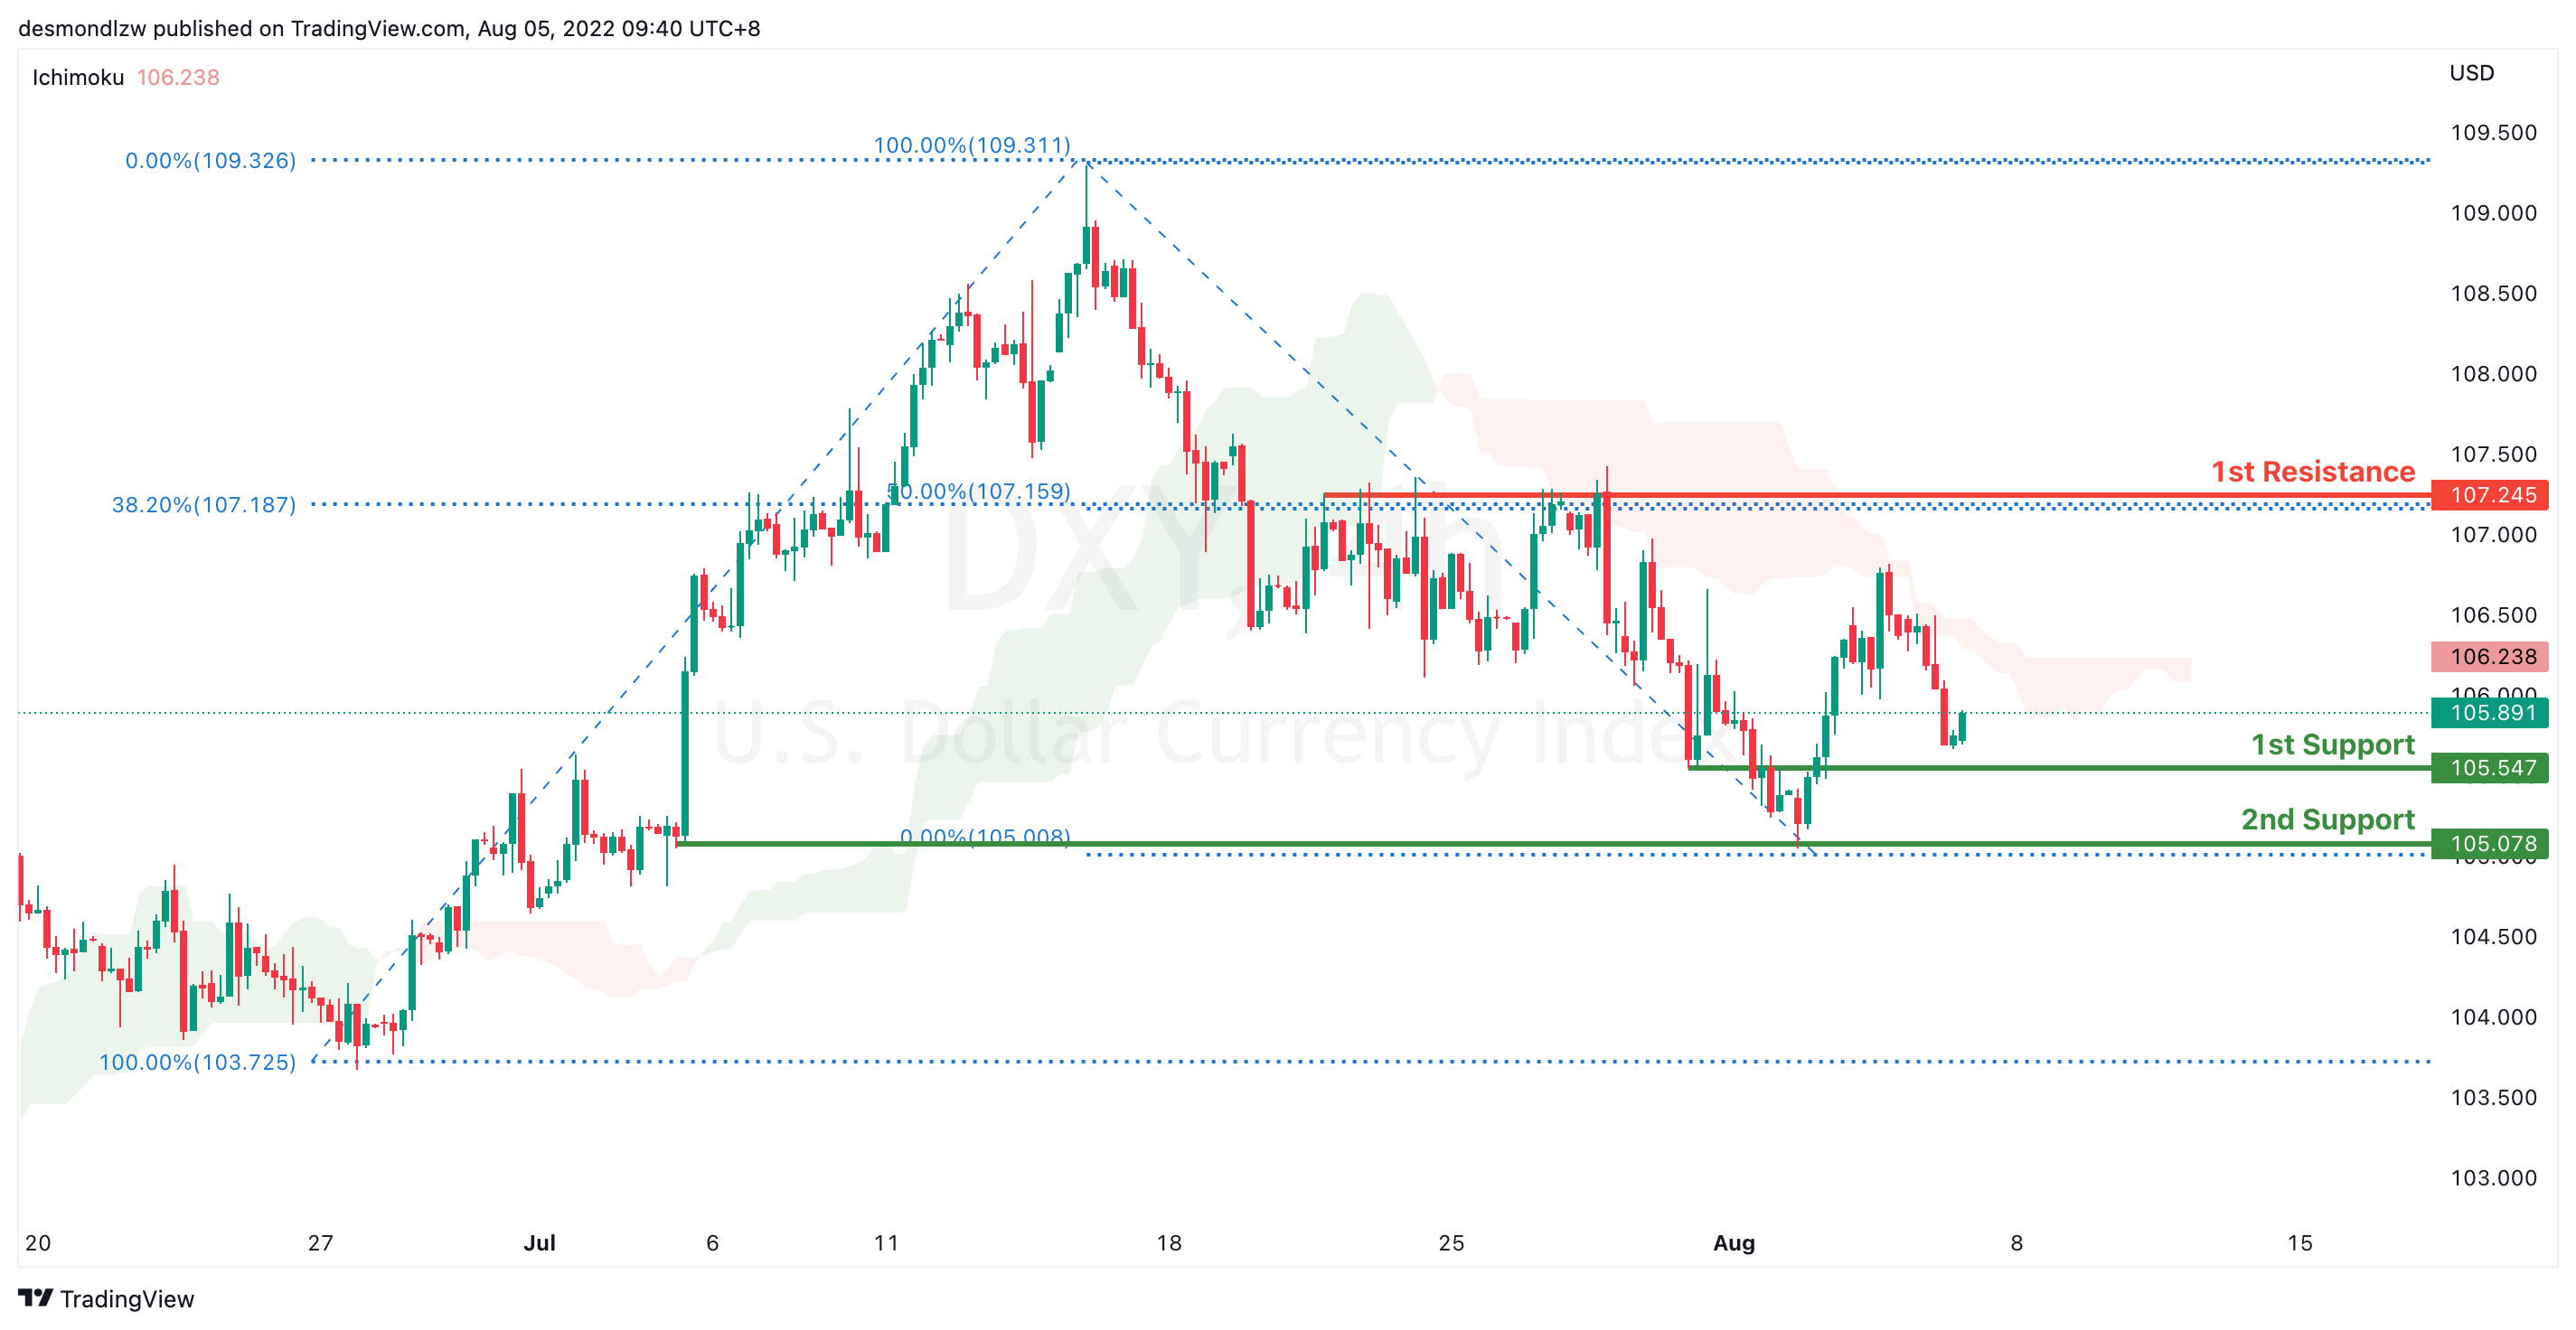
DXY:
On the H4, prices have broken the ascending trend into an overall bearish biased trend. Prices has confirmed descending momentum, still respecting the Ichimoku cloud. It is now pulling back to test first support at 105.547 which is the previous swing low. If price were to break this key level, it will pull back further to test at second support 105.078. Alternatively, price could bounce back and test at 107.245 which coincides with 38.2% Fibonacci retracement
Areas of consideration:
- H4 time frame, 1st resistance at 107.245
- H4 time frame, 1st support at 105.547
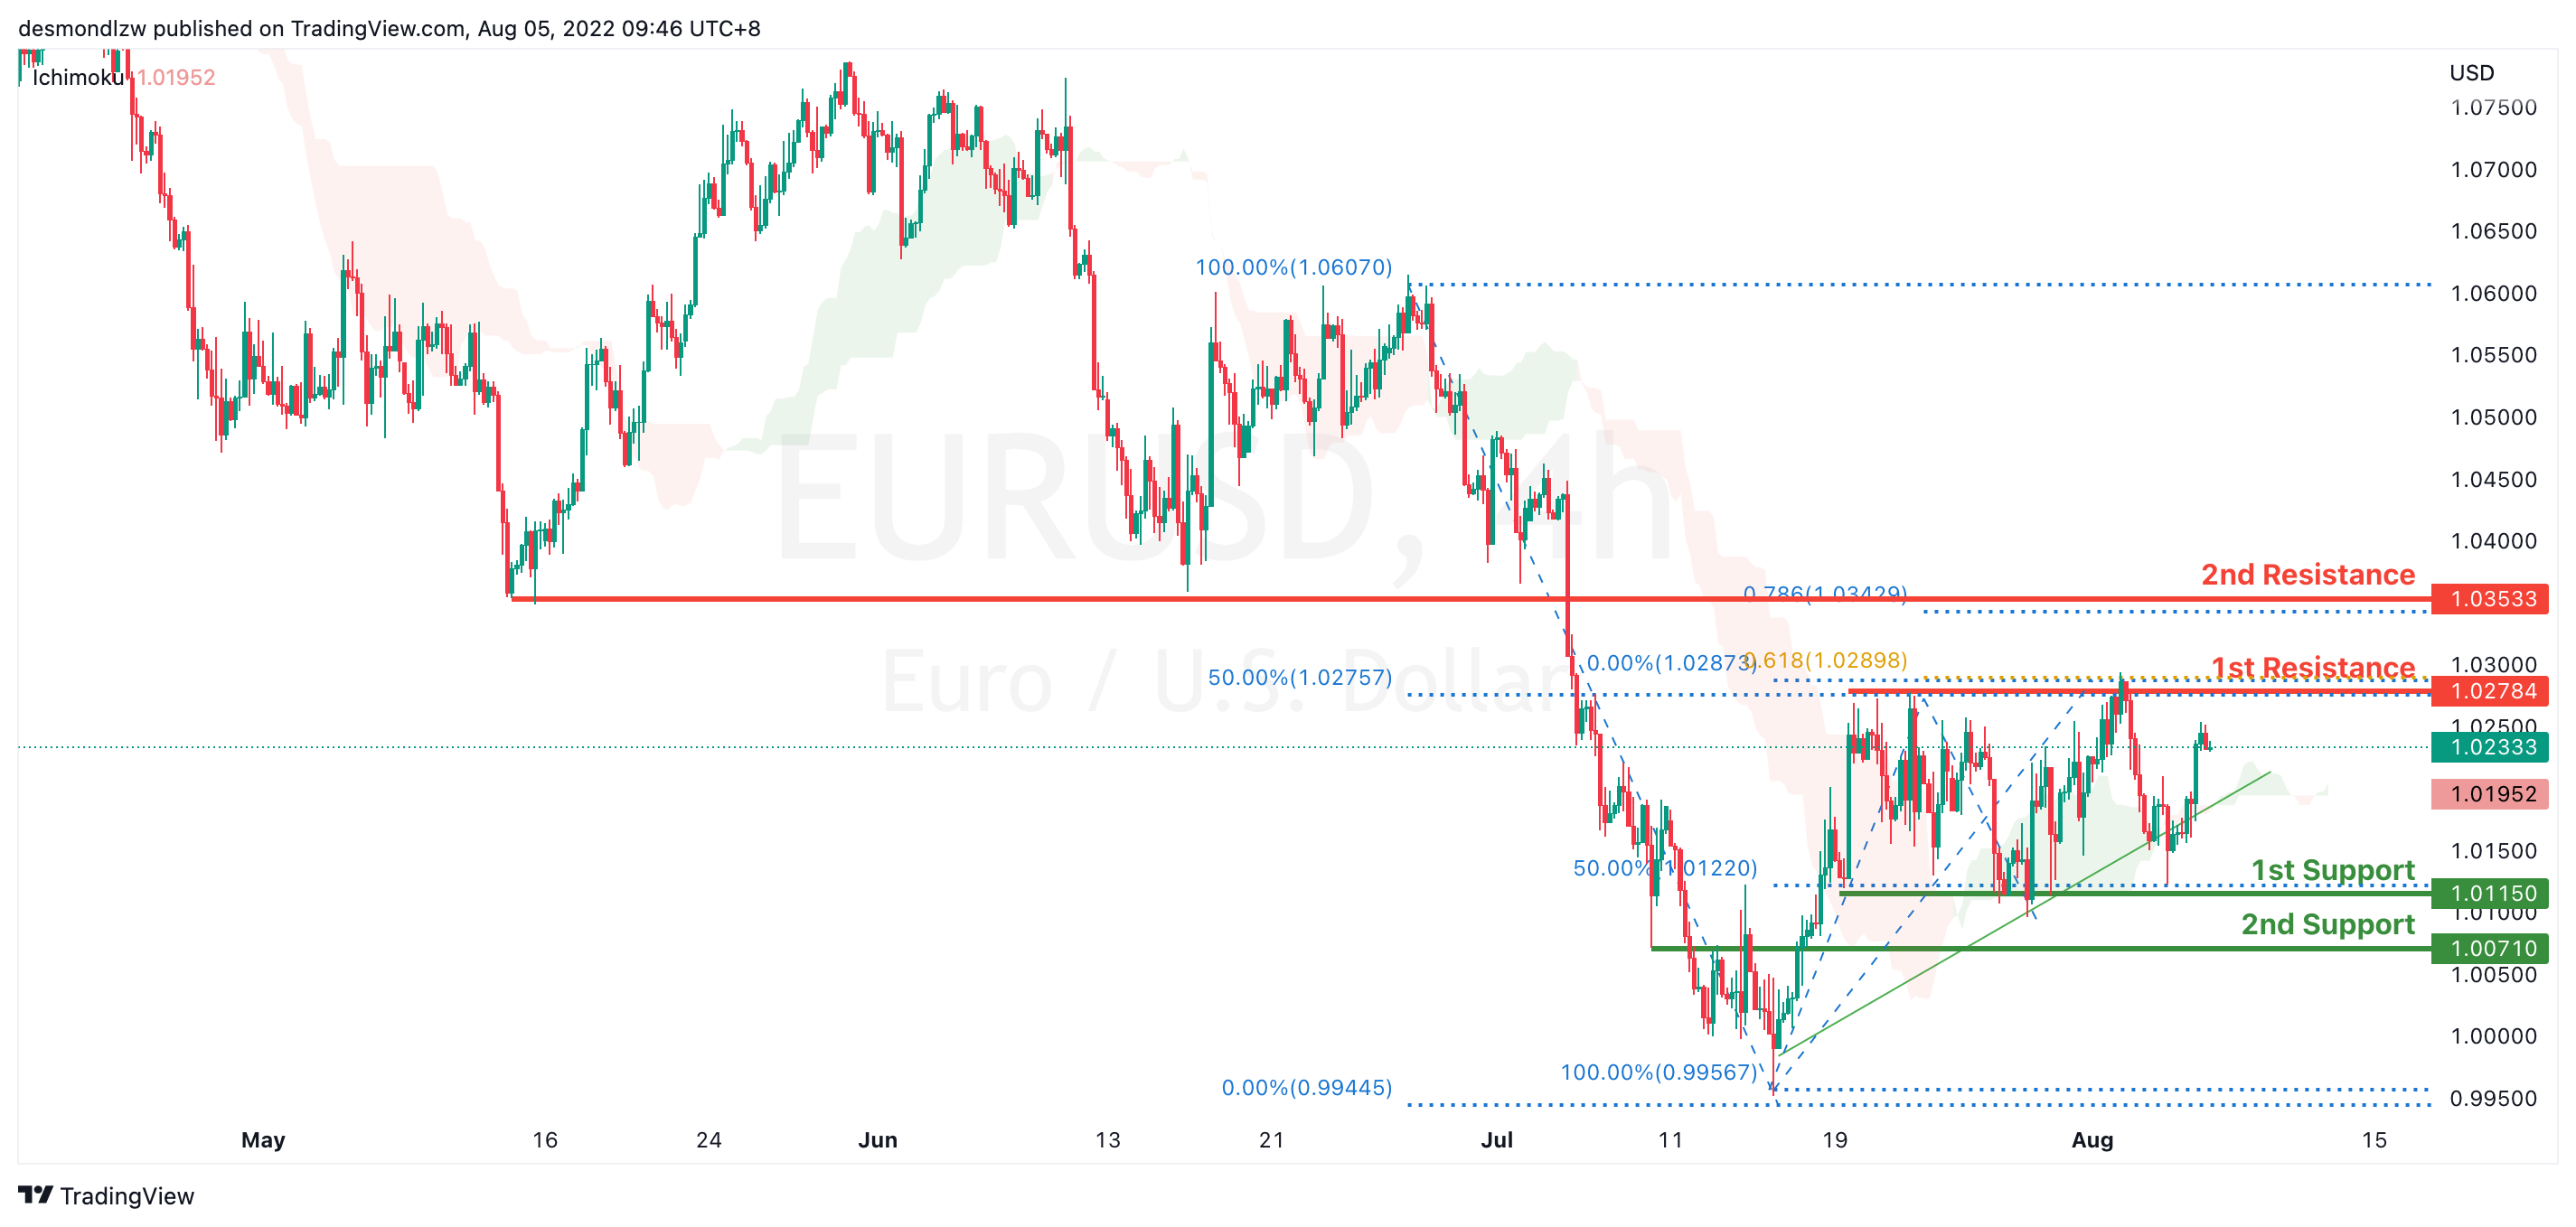
EUR/USD :
On the H4, prices have broken the bearish trend moving into a bullish biased trend. Price is pulling back to test the first resistance 1.027, which coincides with 61.8% Fibonacci projection and 50% retracement. If prices break 1st resistance, it will test the 2nd resistance at 1.03533. Alternatively, If price fails to break the first resistance it might test the first support at 1.011 level
Areas of consideration :
- H4 1st resistance at 1.027
- H4 1st support at 1.011
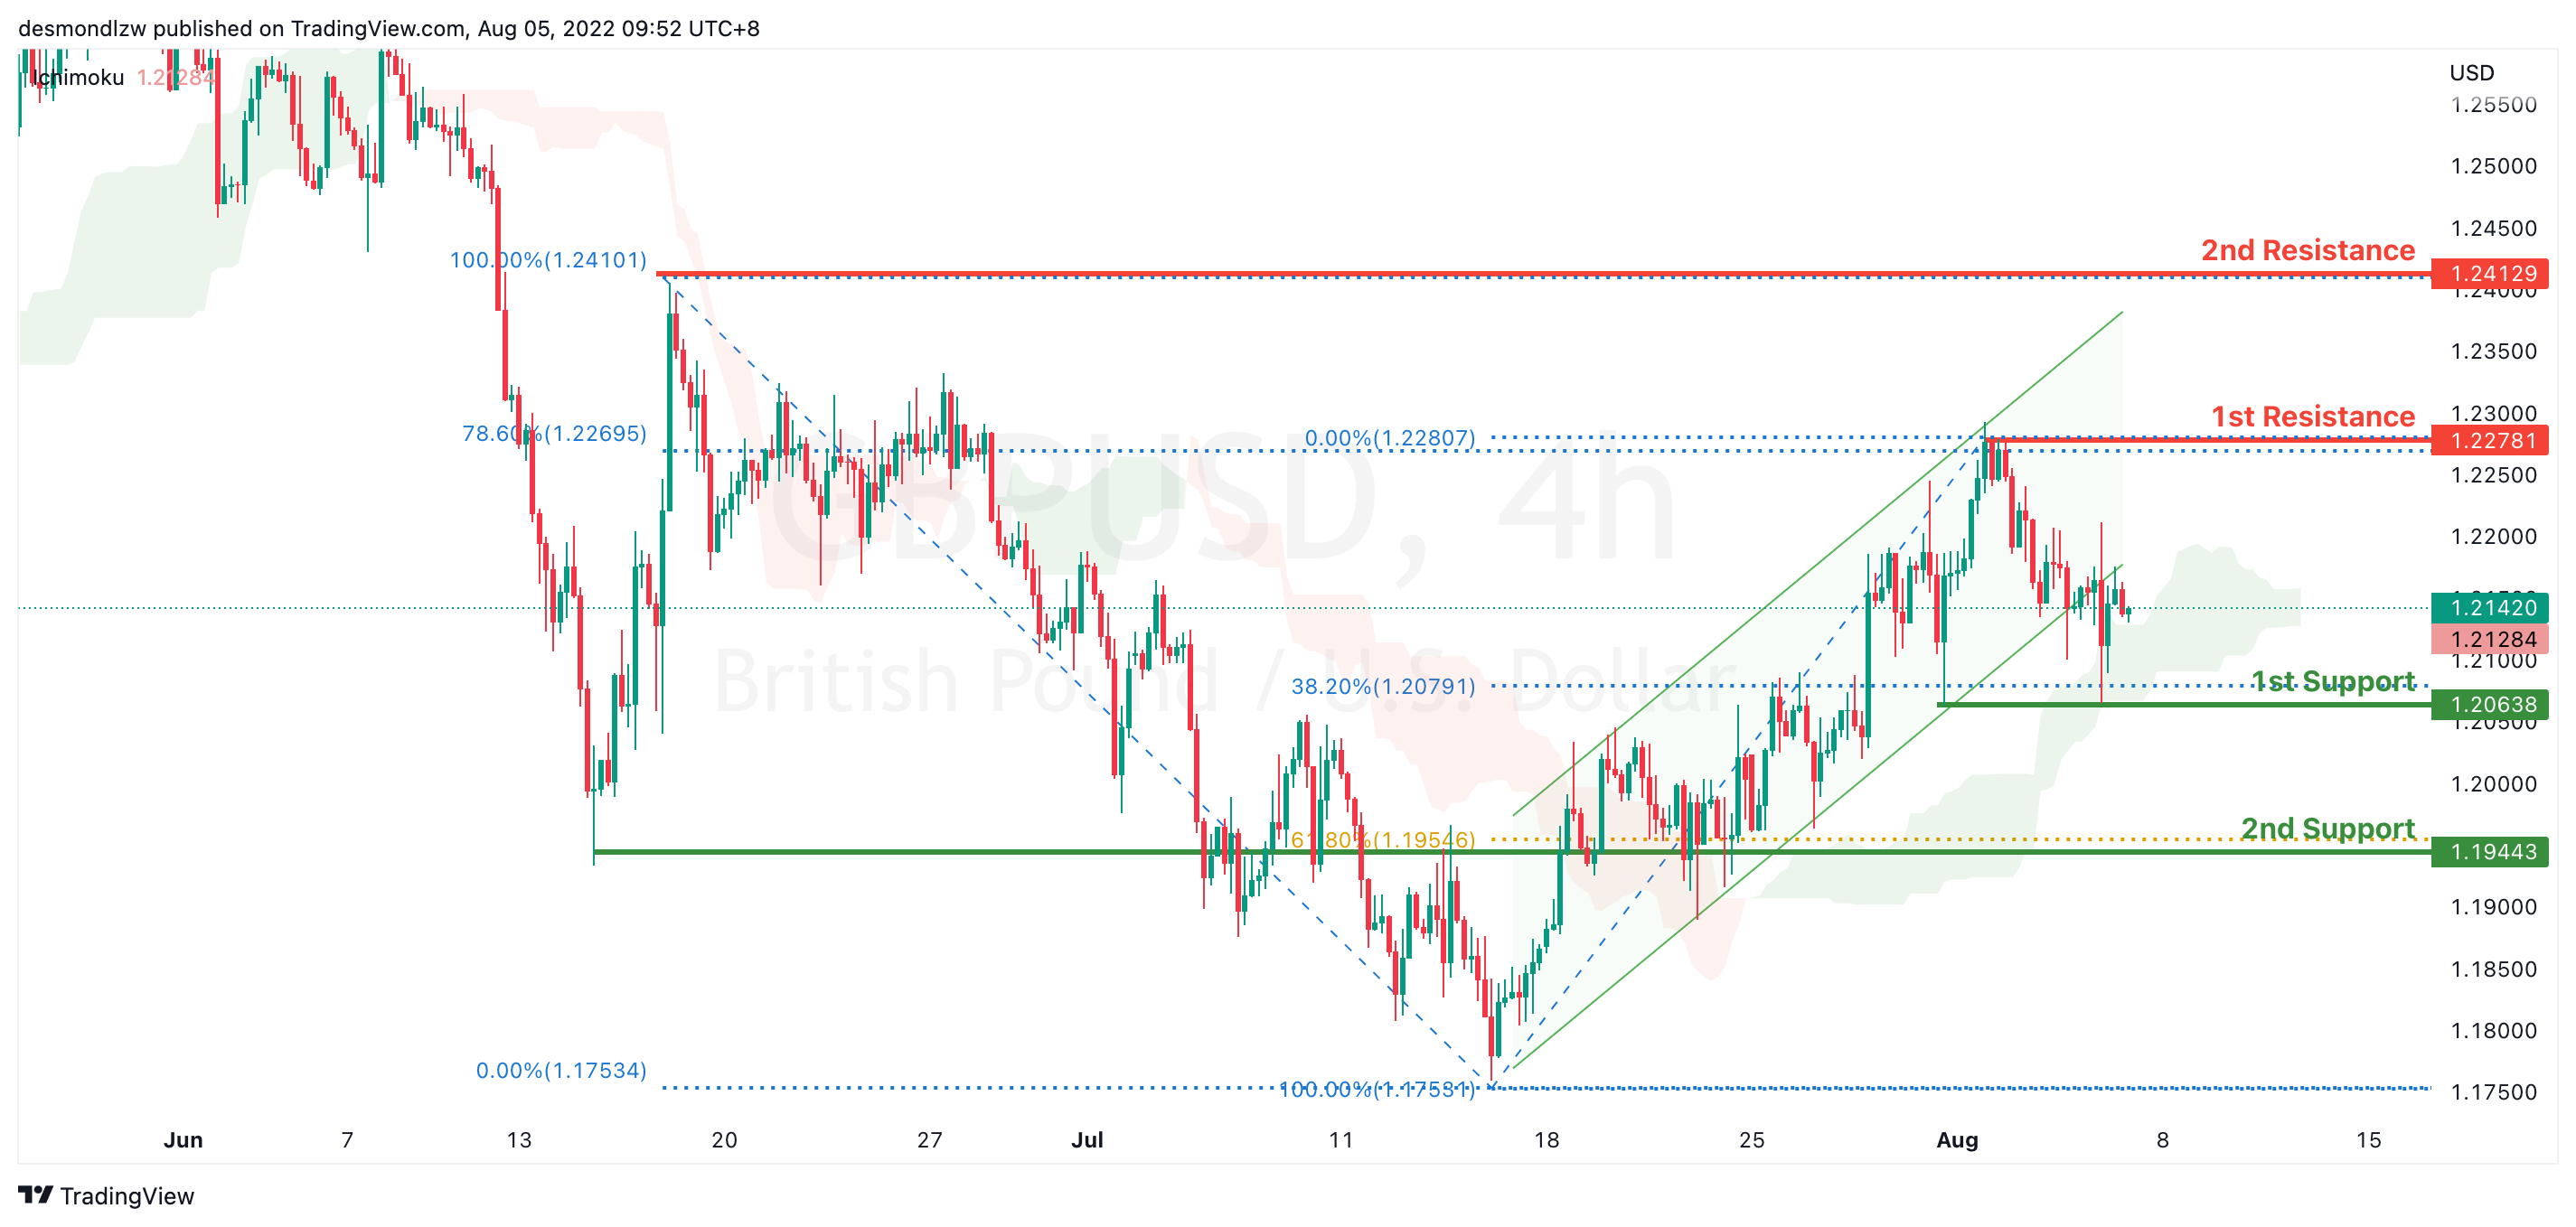
GBP/USD:
On the H4, with prices breaking the ascending channel we are now slightly bearish biased. Price is now testing the first support at 1.208 which coincides with 38.2% Fibonacci retracement. If price break supports and confirms downside trend, we would expect downside momentum to carry price to 2nd support at 1.194 61.8% Fibonacci retracement. Alternatively, price could bounce back to test at 78.6% Fibonacci retracement at 1.227
Areas of consideration:
- H4 1st resistance at 1.227
- H4 1st support at 1.2106
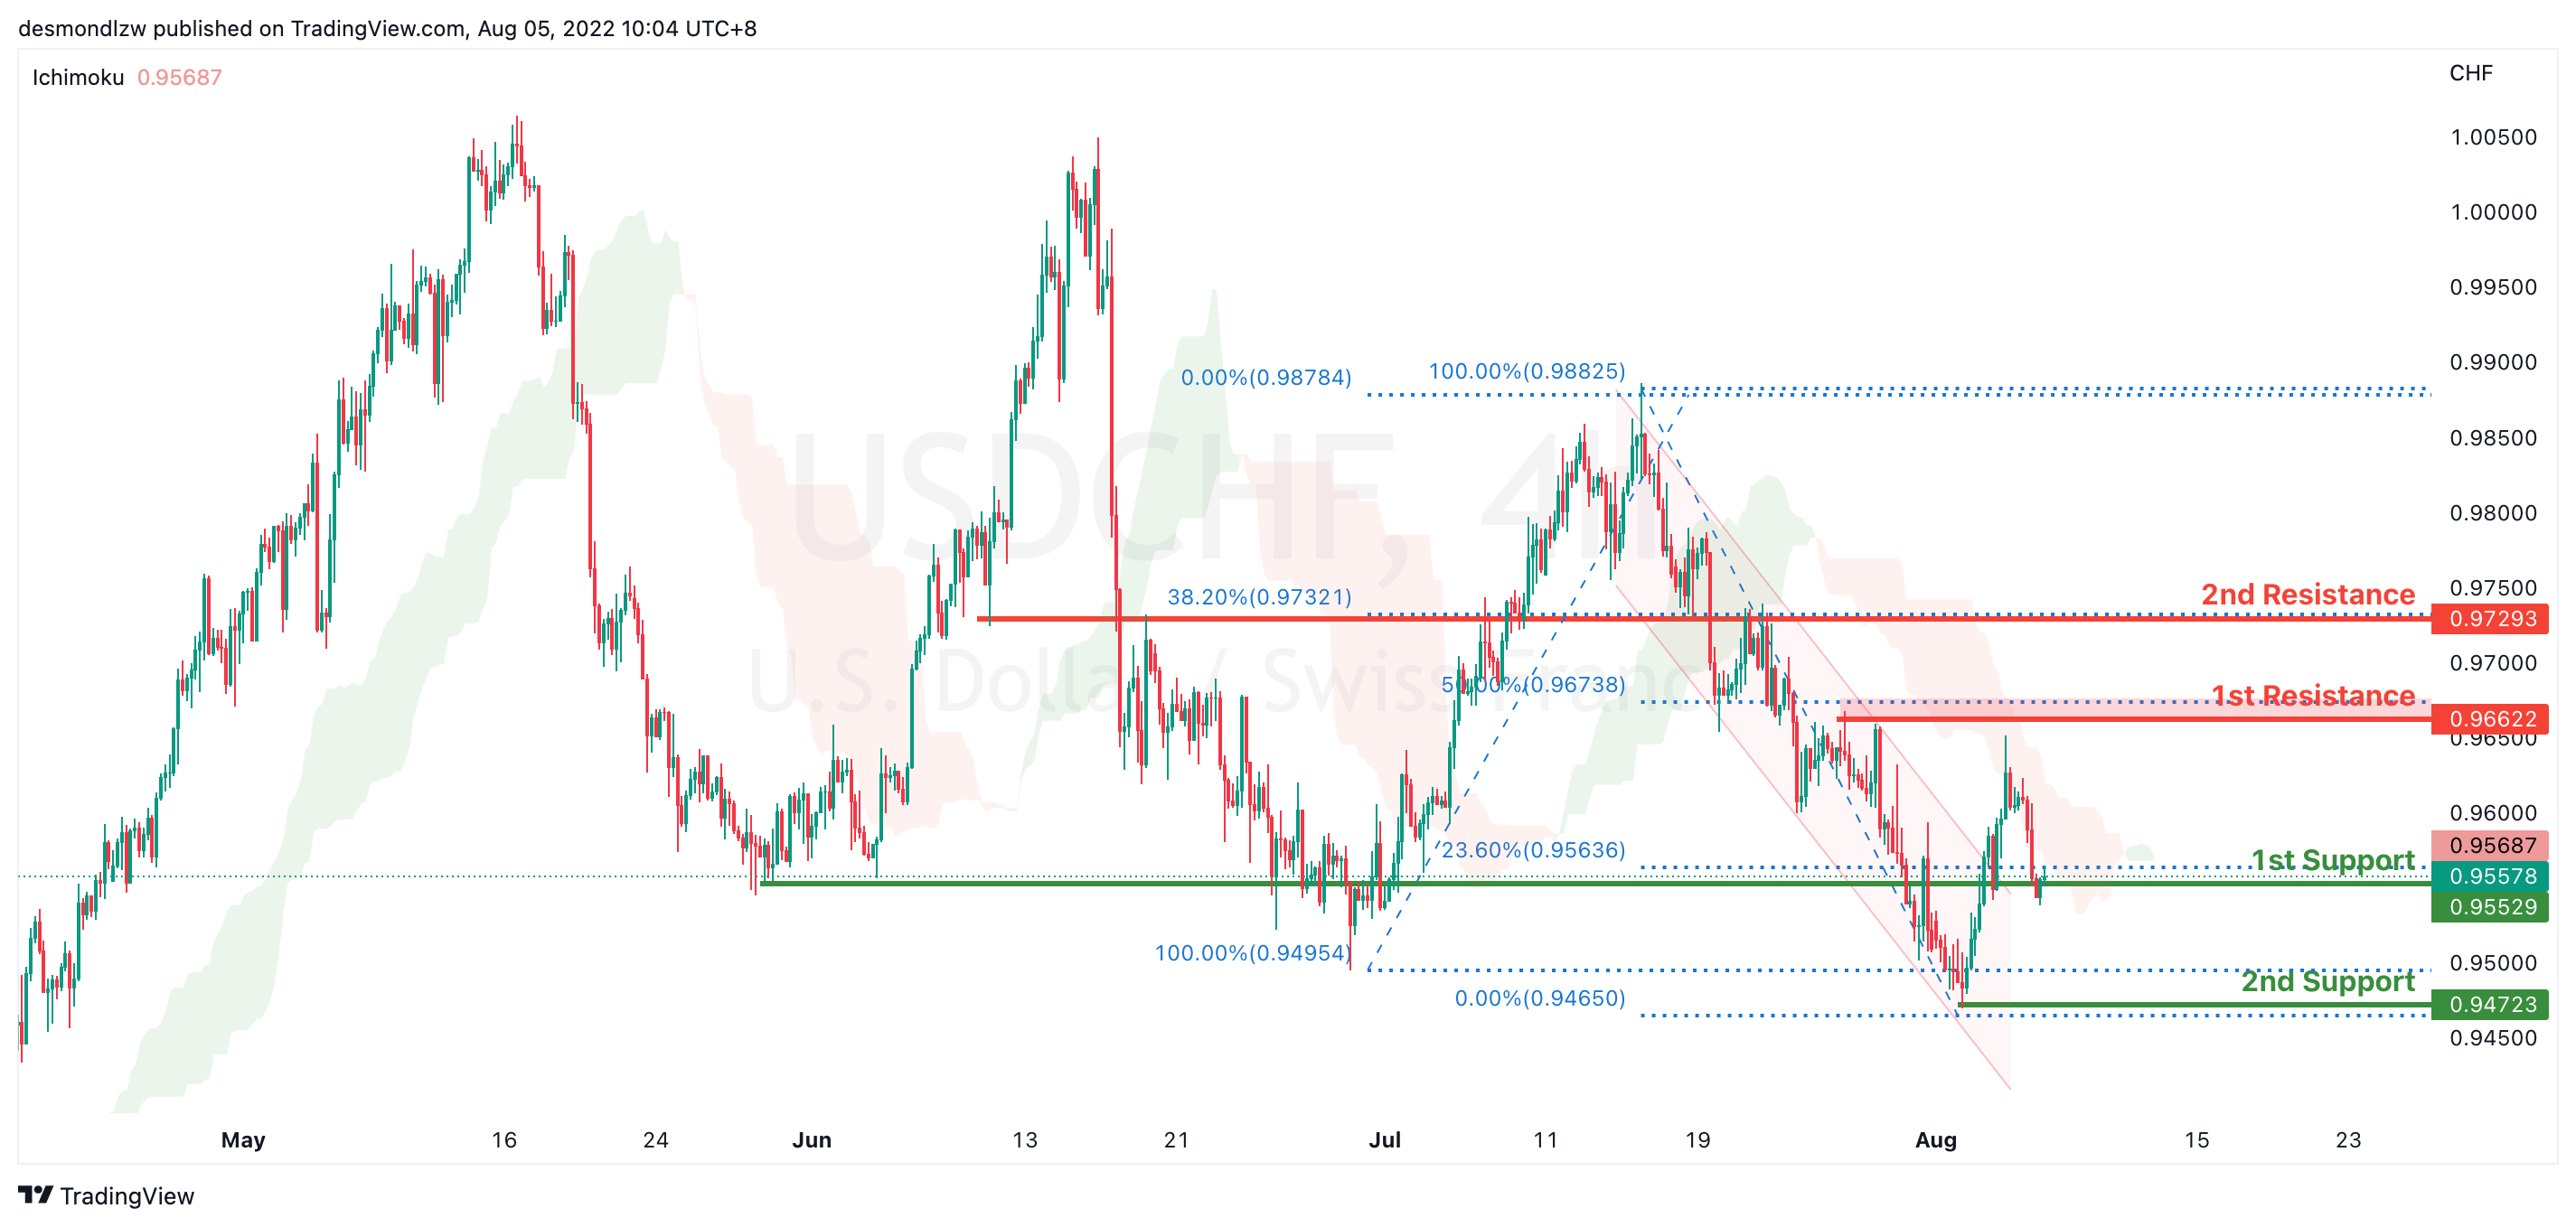
USD/CHF:
On the H4, prices have signalled a slightly bearish momentum. It has rejected the 1st resistance at 0.966 which is also the 50% Fibonacci retracement to test at the 1st support 0.955 23.6% fibonacci retracement. If prices break this key level, it will pull back further to test at the second support at 0.947. Alternatively price could bounce back to test at 1st resistance 0.966
Areas of consideration
- H4 1st resistance at 0.966
- H4 1st support at 0.955
XAU/USD (GOLD):
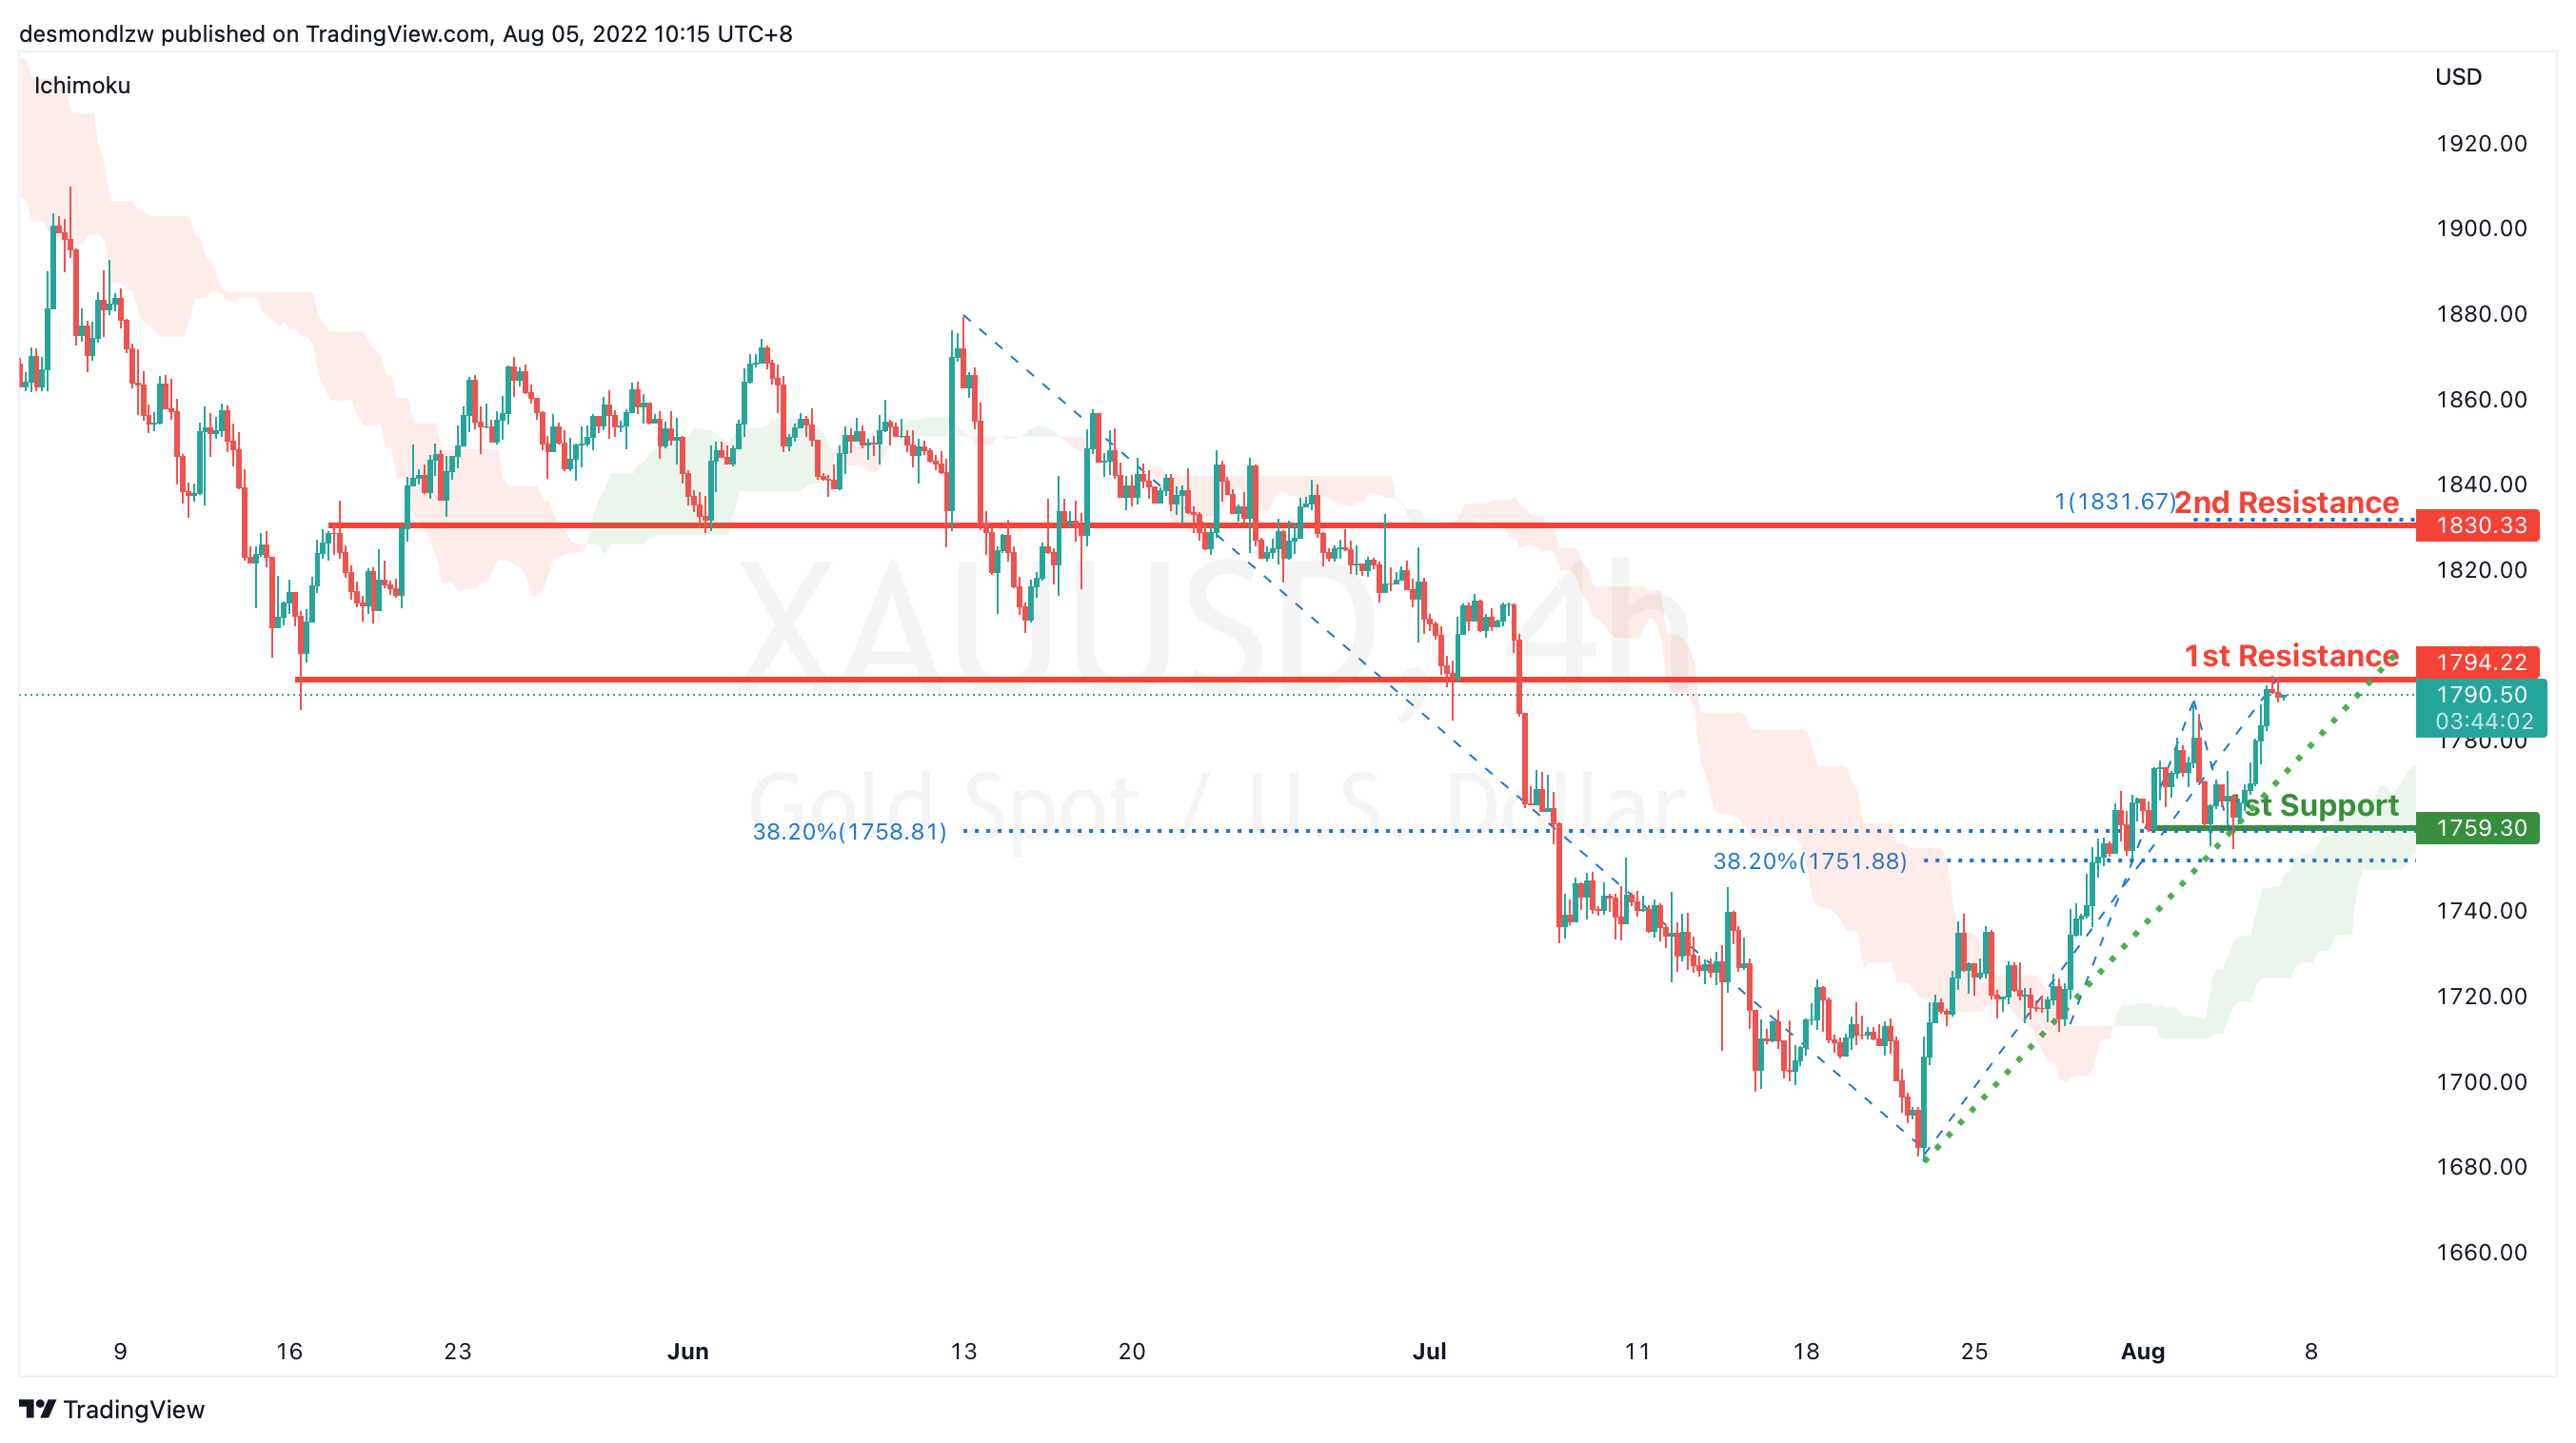
On the H4, with prices going along the ascending trendline and moving above ichimoku cloud, we have a bullish bias that price may rise from the 1st resistance at 1794.22, which is in line with the overlap support to 2nd resistance at 1830.33 where the 100% fibonacci projection is. Alternatively, prices may drop to 1st support at 1759.30,which is in line with 38.2% fibonacci retracement.
Areas of consideration:
- H4 time frame, 1st resistance at 1794.22
- H4 time frame, 2nd resistance at 1830.33
AUD/USD:
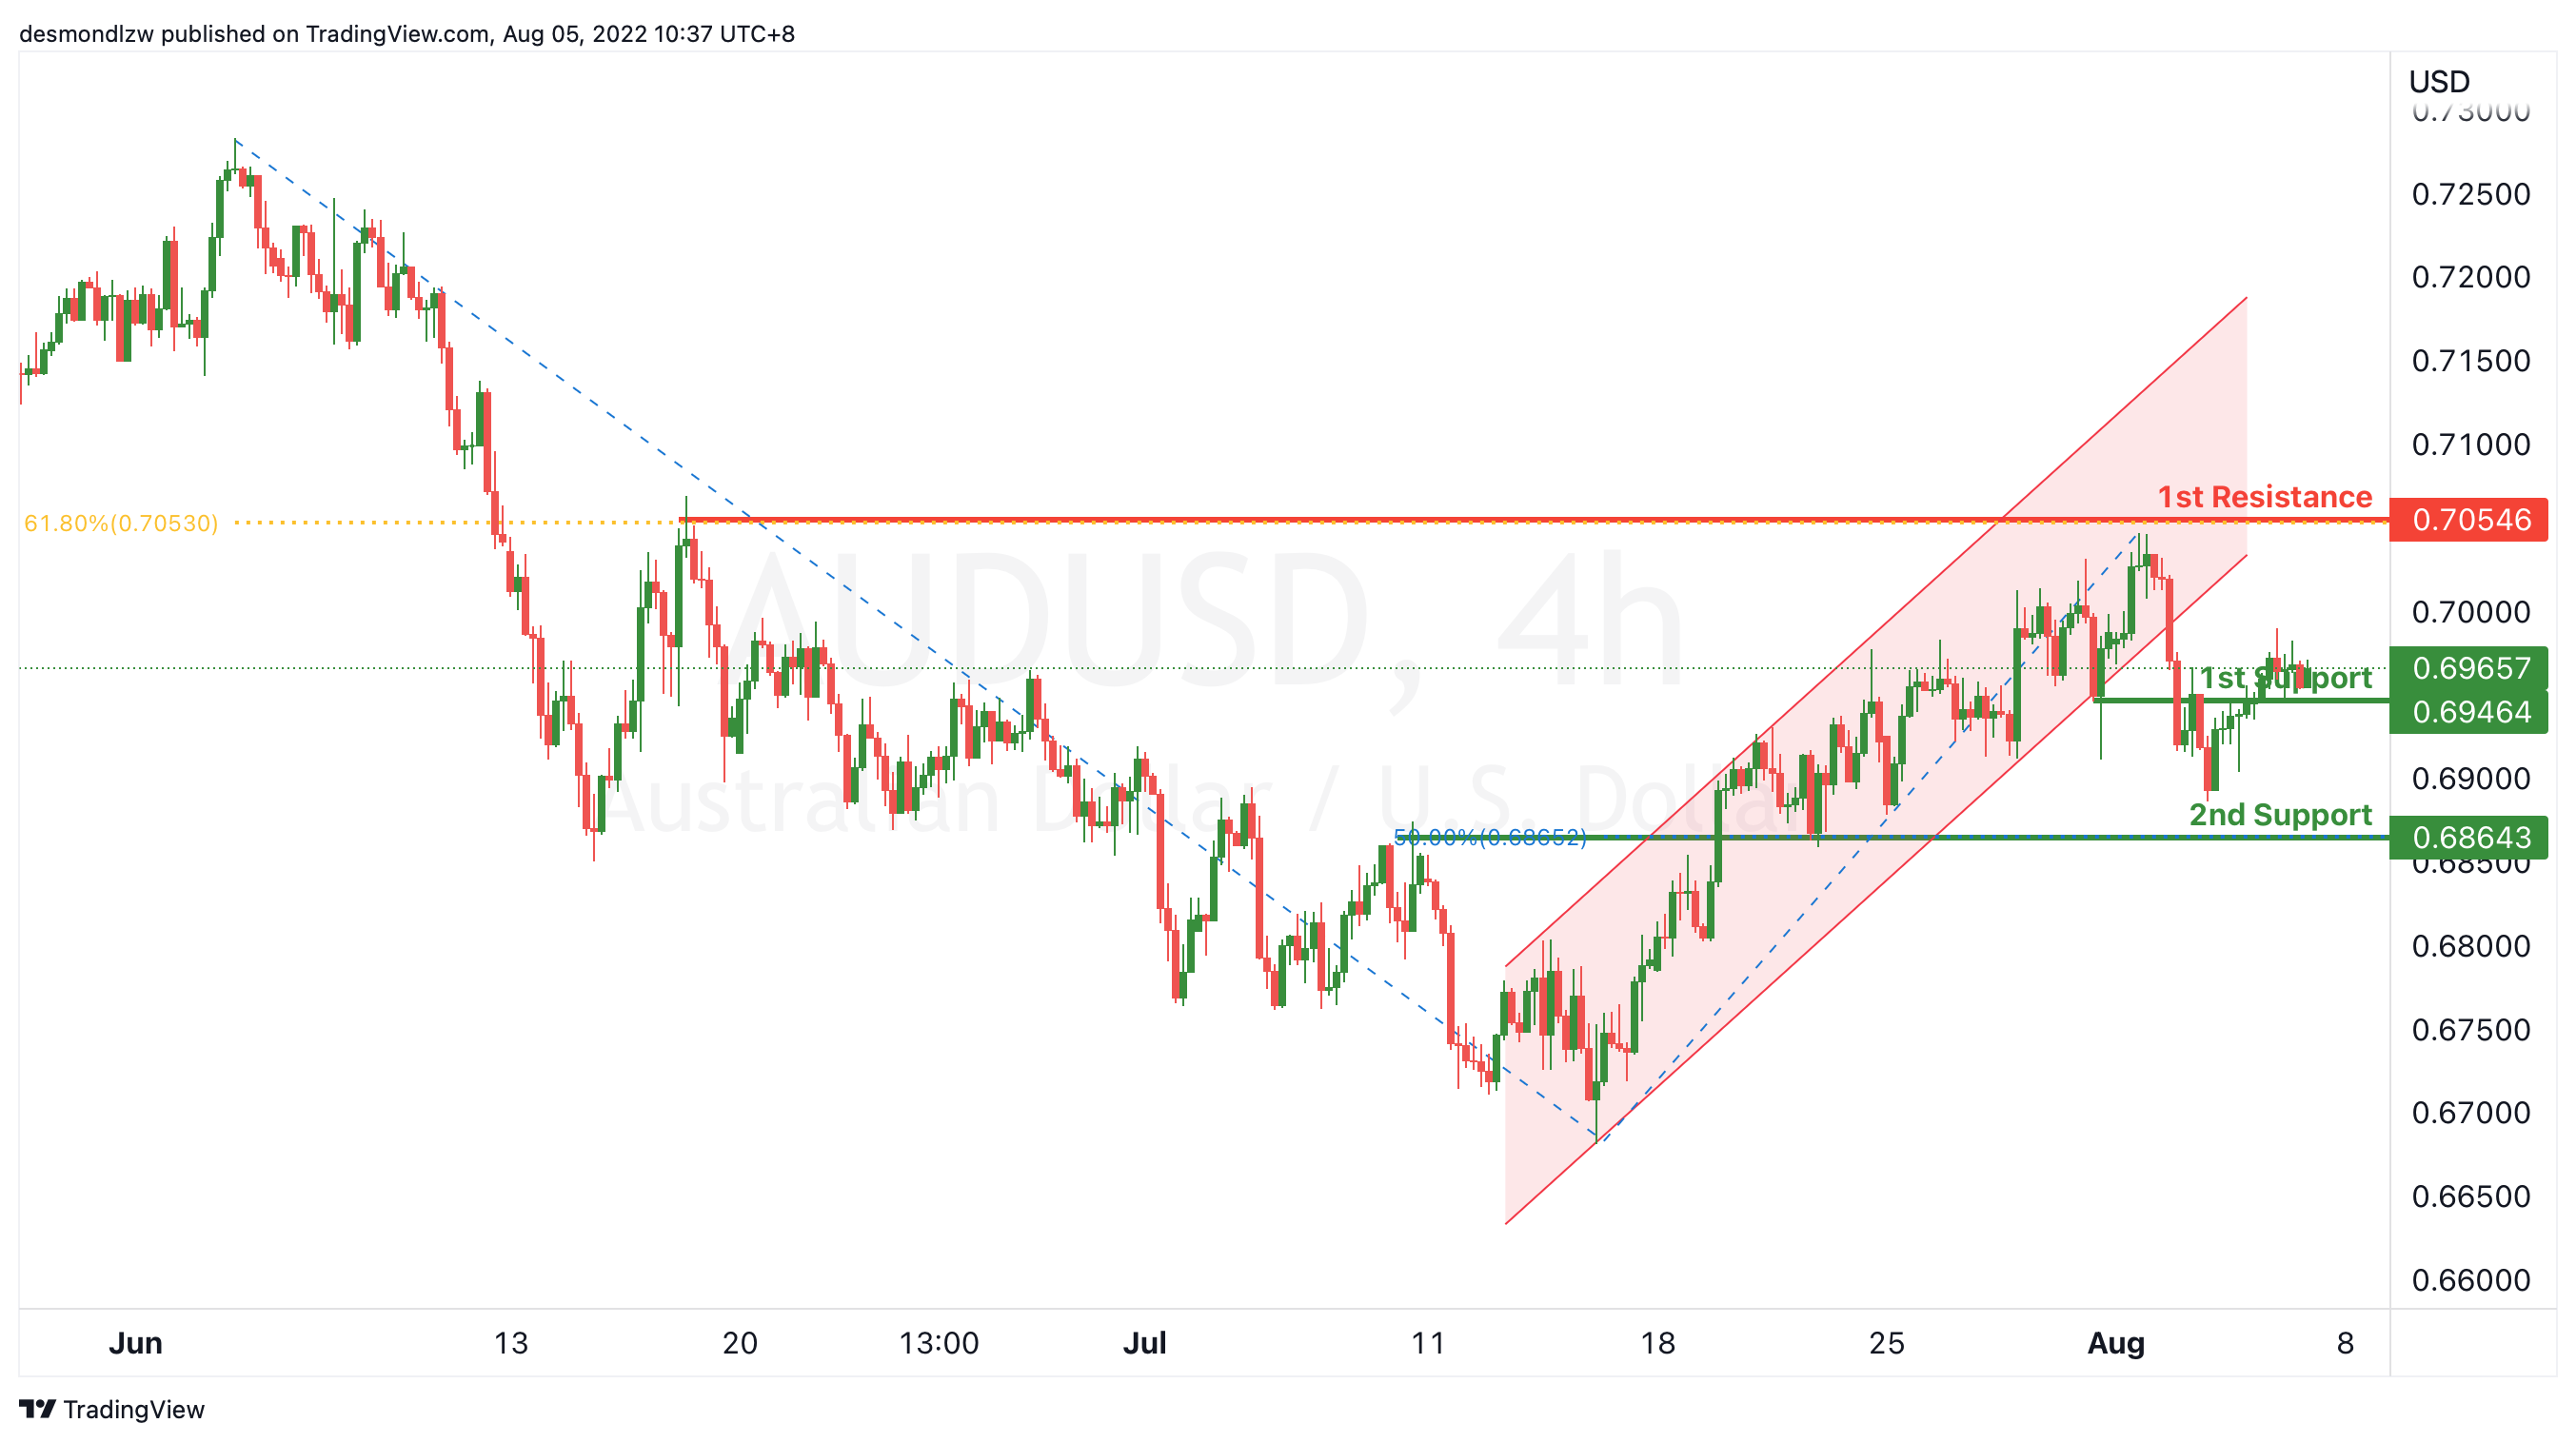
On the H4, with price breaking the ascending trend channel, we have a bearish bias that price will drop from the 1st support at 0.69657, where the pullback resistance is to the 2nd support at 0.68643 where the 50% fibonacci retracement is. Alternatively, price may rise to the 1st resistance at 0.70546 which is in line with 61.8% fibonacci retracement.
Areas of consideration
- H4 1st support at 0.69657
- H4 2nd support at 0.68643
NZD/USD:
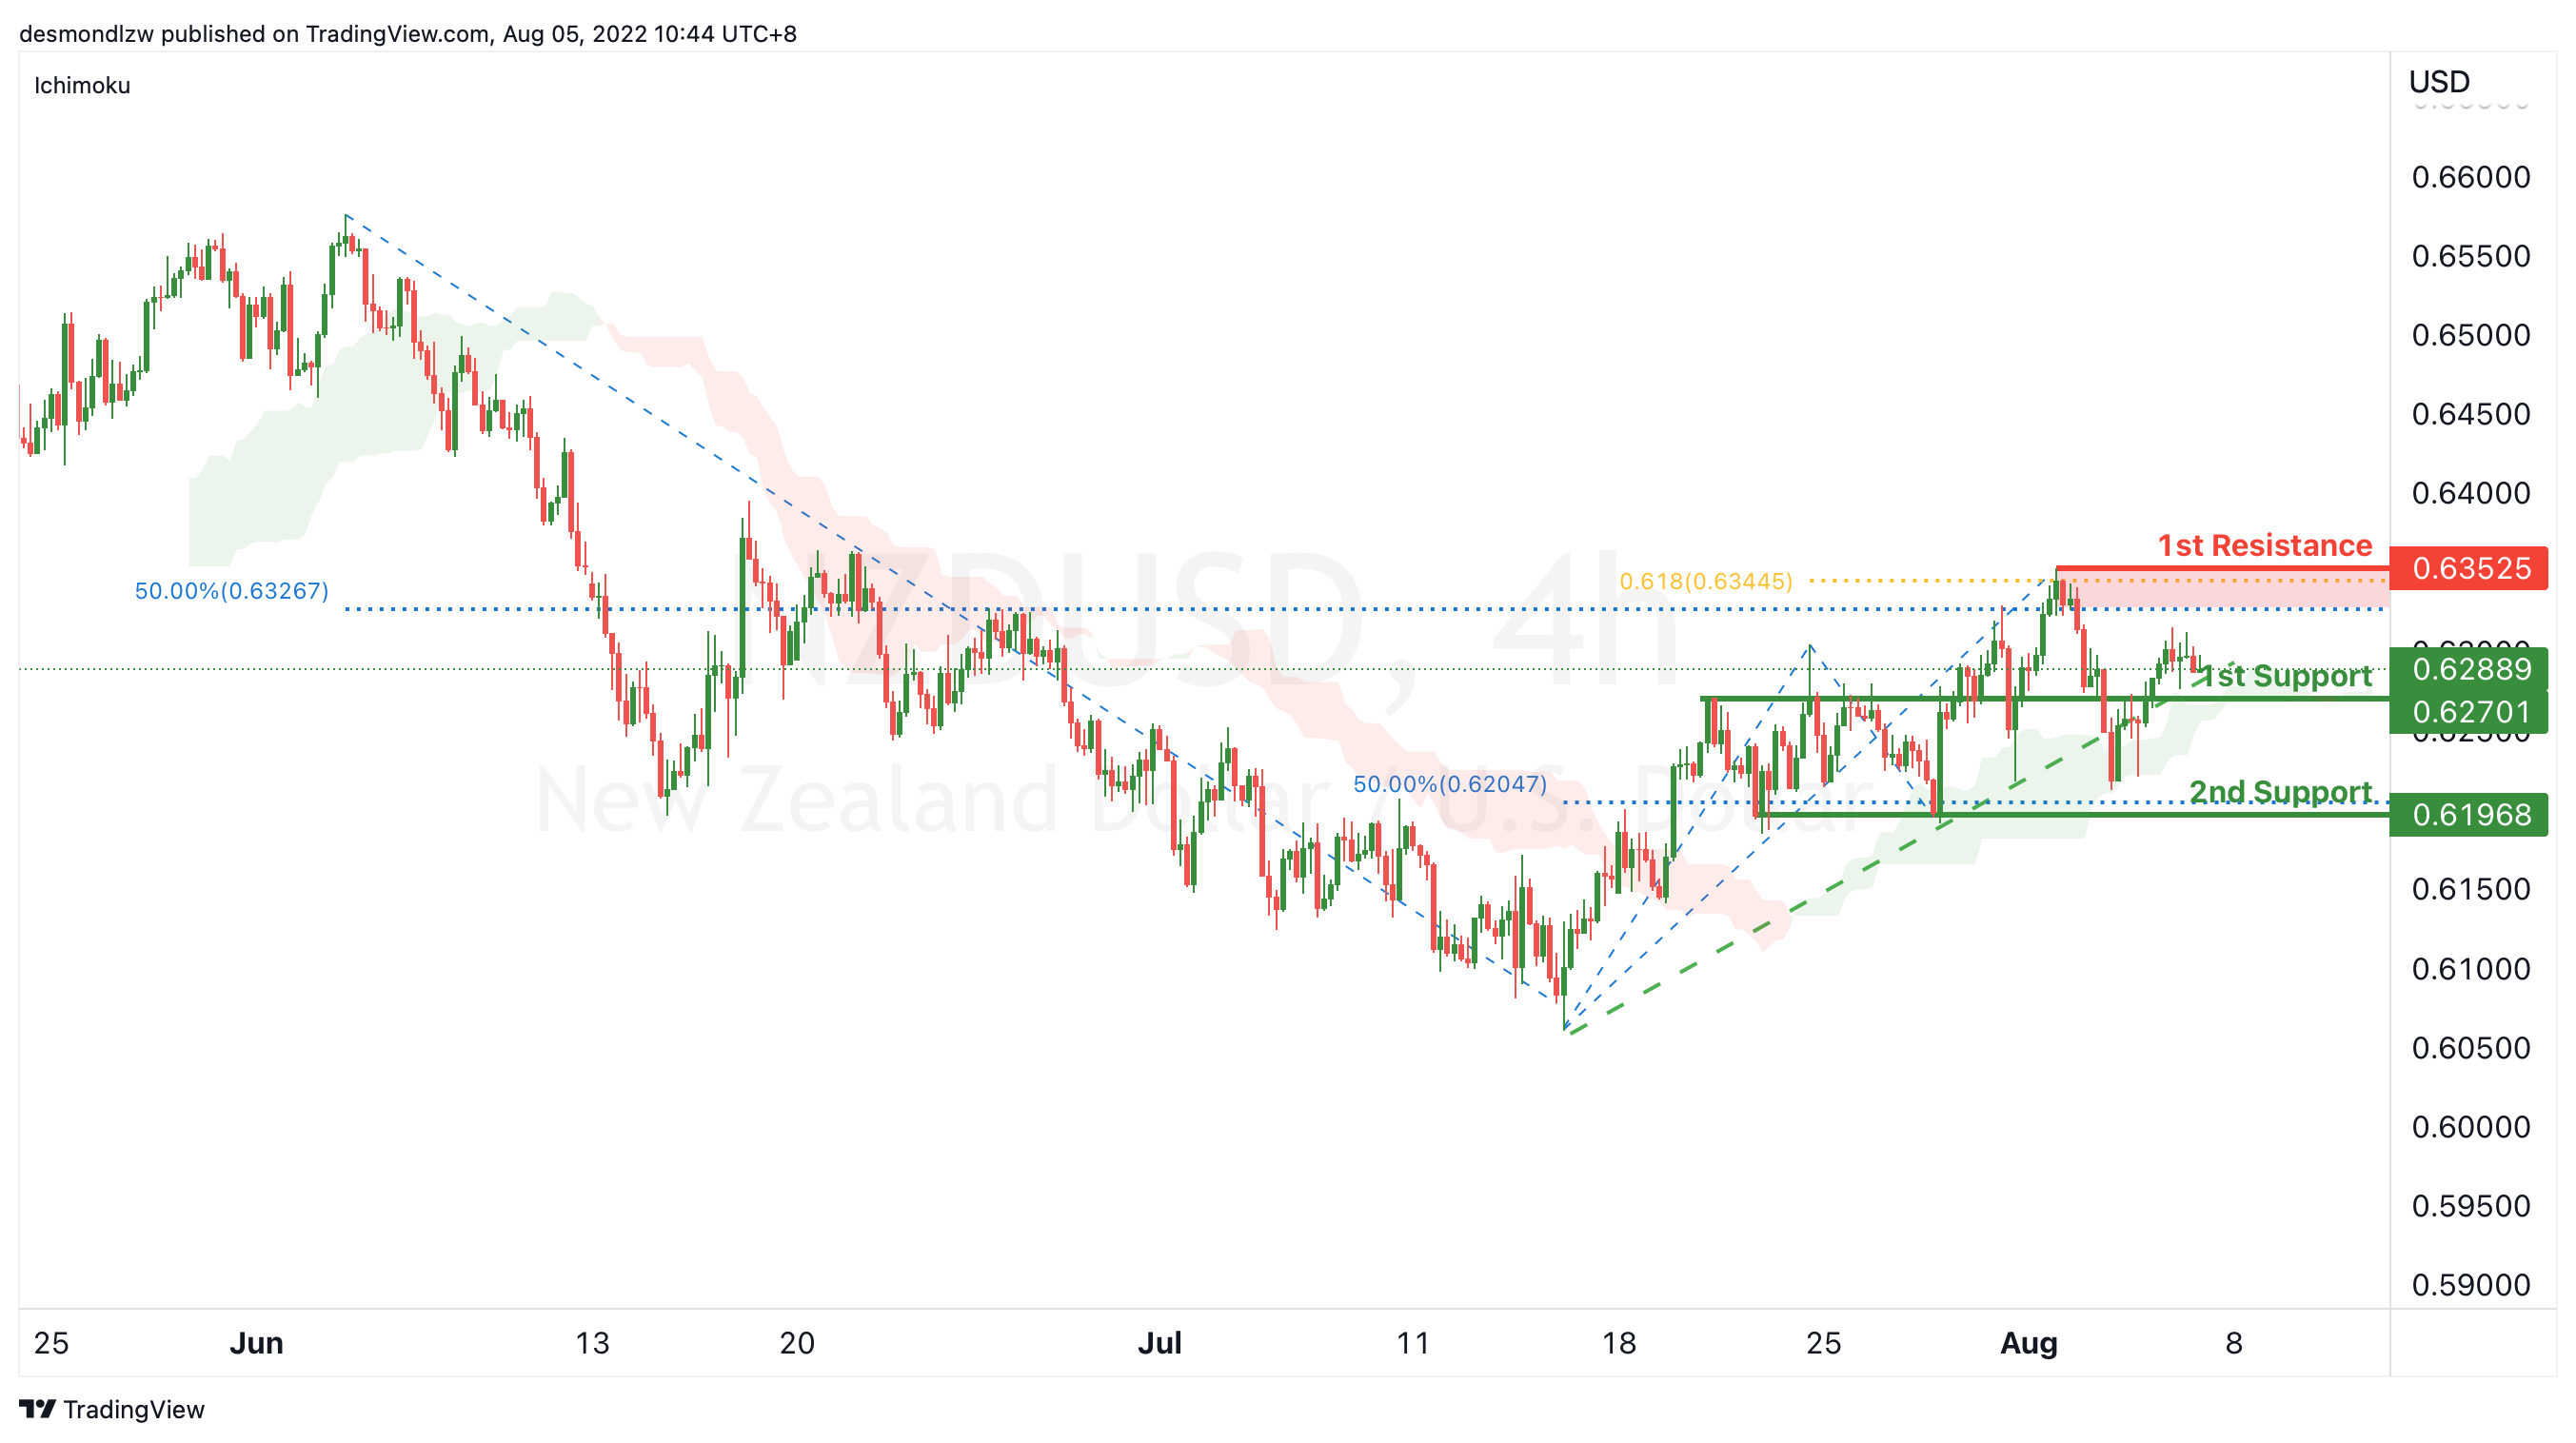
On the H4, with price moving along the ascending trendline, we have a bullish bias that price may rise from the 1st support at 0.62701 where overlap resistance is to the 1st resistance at 0.63525 at the swing high, 61.8% fibonacci projection and 50% fibonacci retracement. Alternatively, price may reverse off the 1st support and drop to 2nd support at 0.61968 where the swing low support and 50% fibonacci retracement are.
Areas of consideration:
- H4 time frame, 1st support at 0.62701
- H4 time frame, 1st resistance at 0.63525
USD/CAD:
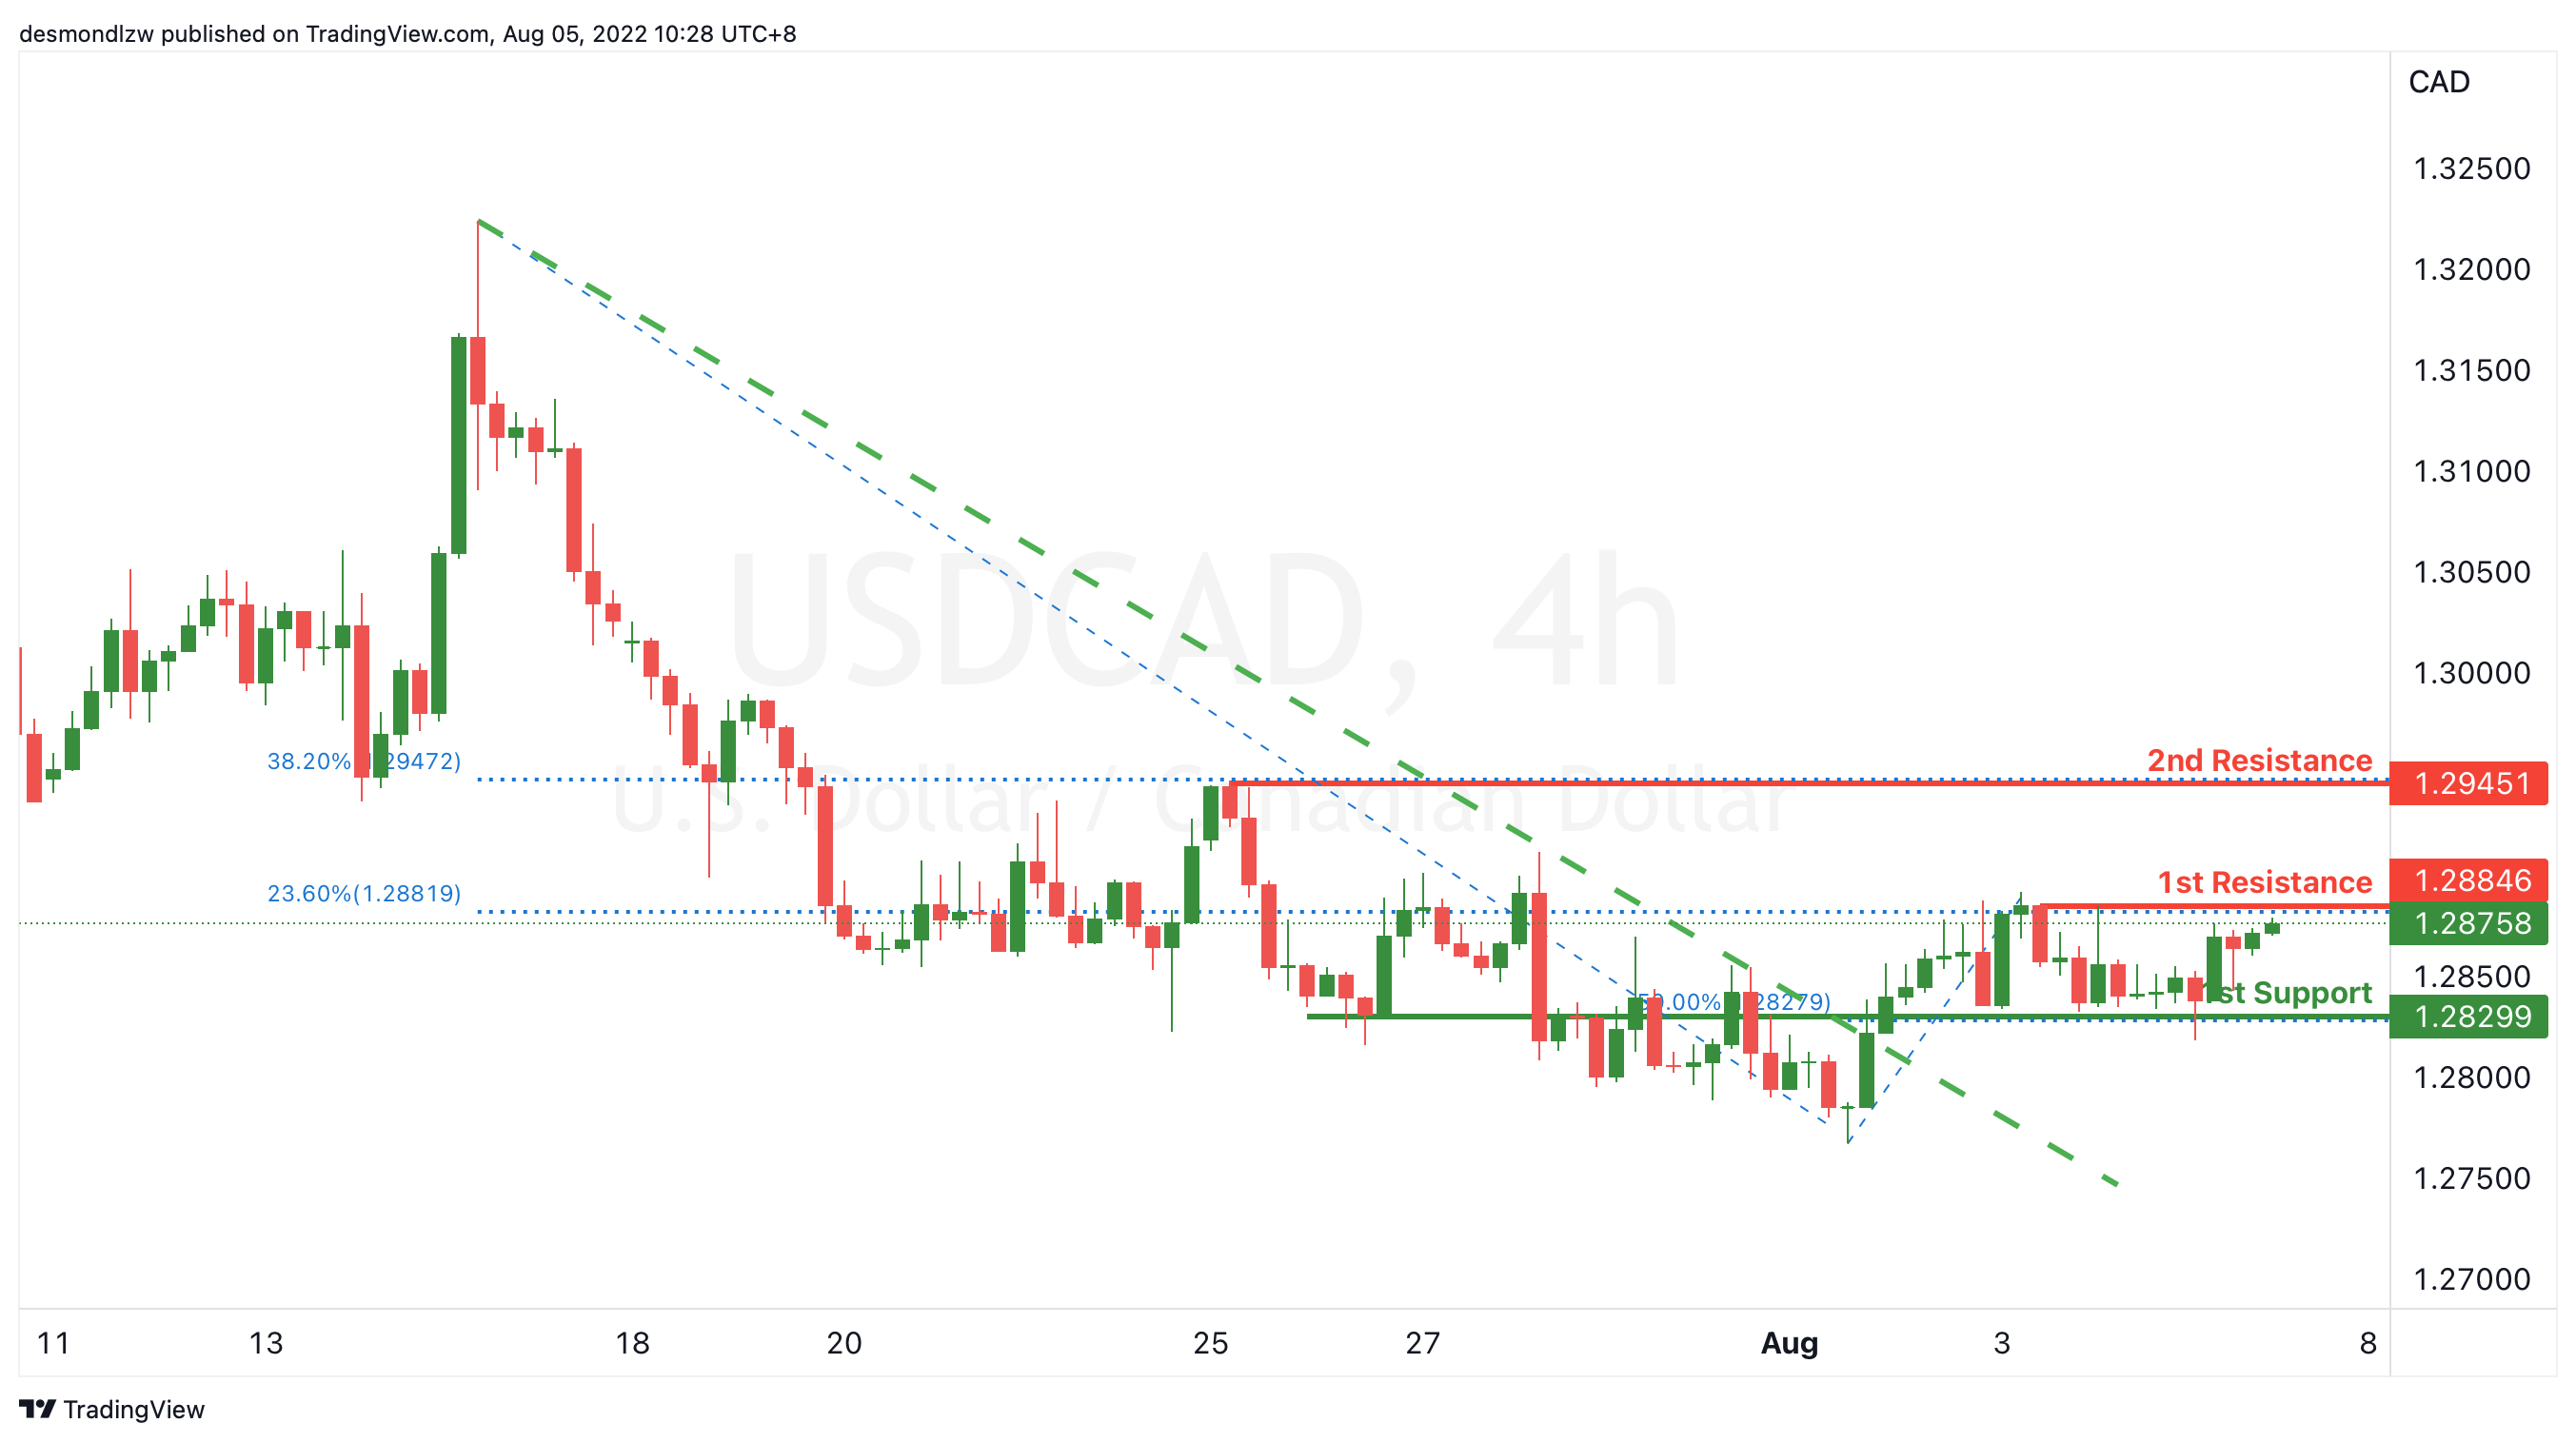
On the H4, with the price breaking the descending trendline and below ichimoku cloud, we have a bullish bias that the price may rise from our 1st resistance at 1.28846, which is in line with 23.6% fibonacci retracement to our 2nd resistance at 1.29451, which is in line with the 38.2% fibonacci retracement. Alternatively, the price may drop to the 1st support at 1.28299, which is in line with 50% fibonacci retracement.
Areas of consideration:
- H4 time frame, 1st resistance at 1.28846
- H4 time frame, 2nd resistance at 1.29451
OIL:
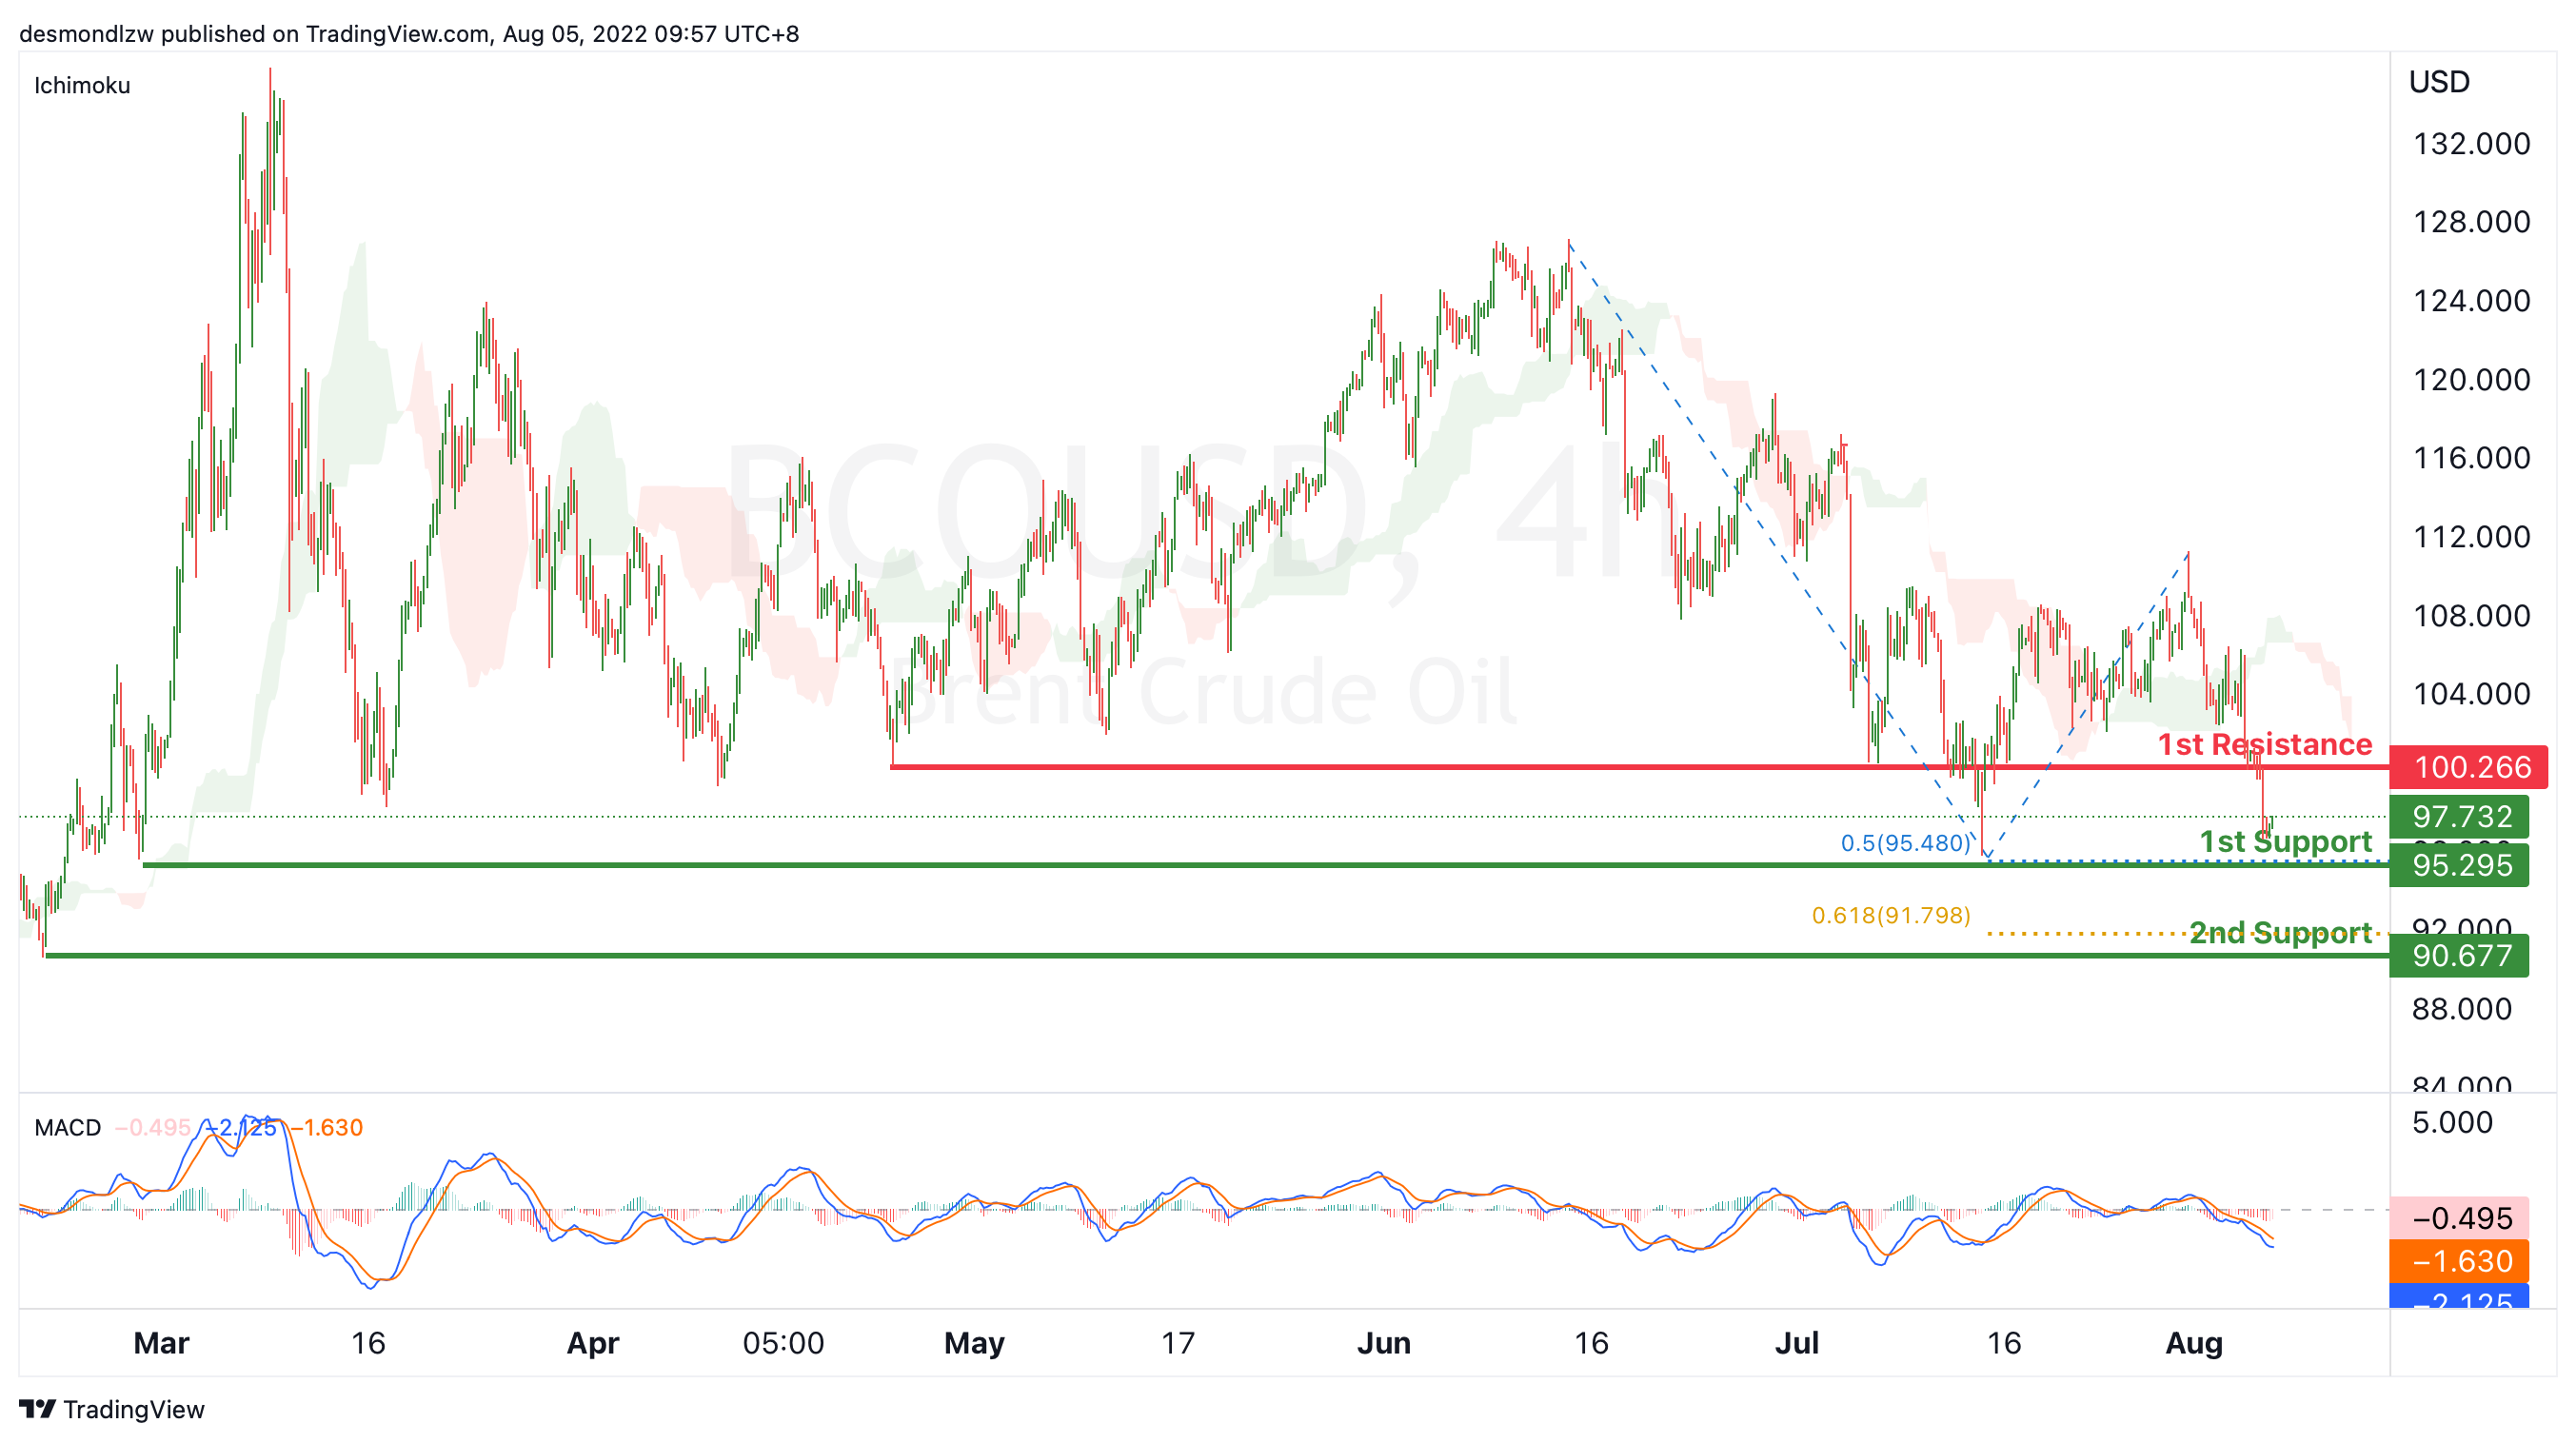
On the H4, with price going below the ichimoku cloud and the momentum of MACD histogram is decreasing under zero axis, we have a bearish bias that price might drop from the 1st support at 95.295, where the swing low support and 50% fibonacci projection are to 2nd support at 90.677, where the pullback support and 61.8% fibonacci projection are. Otherwise, the price may rise to our 1st resistance at 100.266, where the swing low support is.
Areas of consideration:
- H4 time frame, 1st support of 95.295
- H4 time frame, 2nd support of 90.677
Dow Jones Industrial Average:
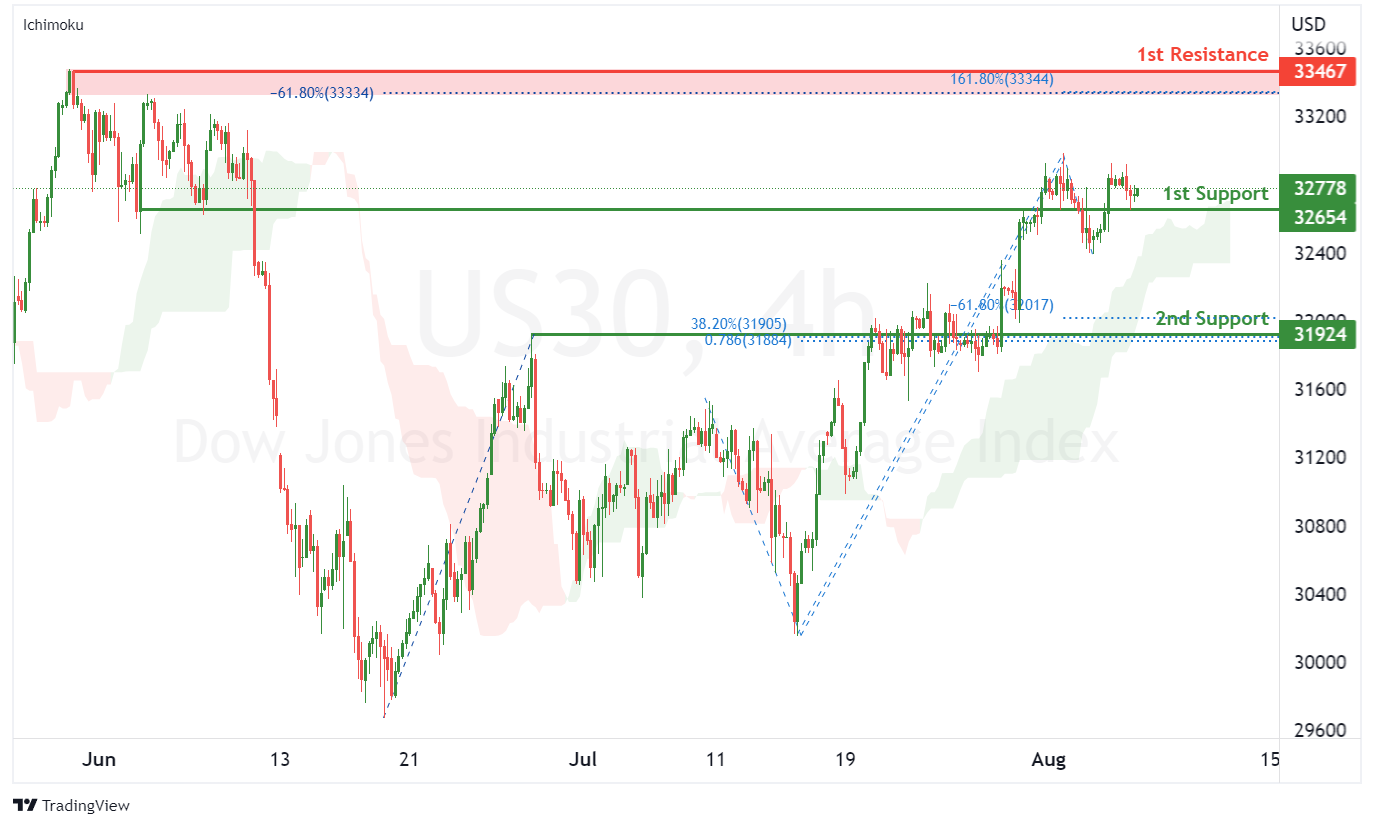
On the H4, with price moving above the ichimoku indicator, we have a bullish bias that price will rise from the 1st support at 32654 where the pullback support is to the 1st resistance at 33467 where the swing high resistance, 161.8% fibonacci extension and -61.8% fibonacci expansion are. Alternatively, price could break 1st support structure and drop to 2nd support at 31924 where the pullback support, -61.8% fibonacci expansion, 38.2% fibonacci retracement and 78.6% fibonacci projection are.
Areas of consideration:
- H4 time frame, 1st resistance of 33467
- H4 time frame, 1st support at 32654
DAX:
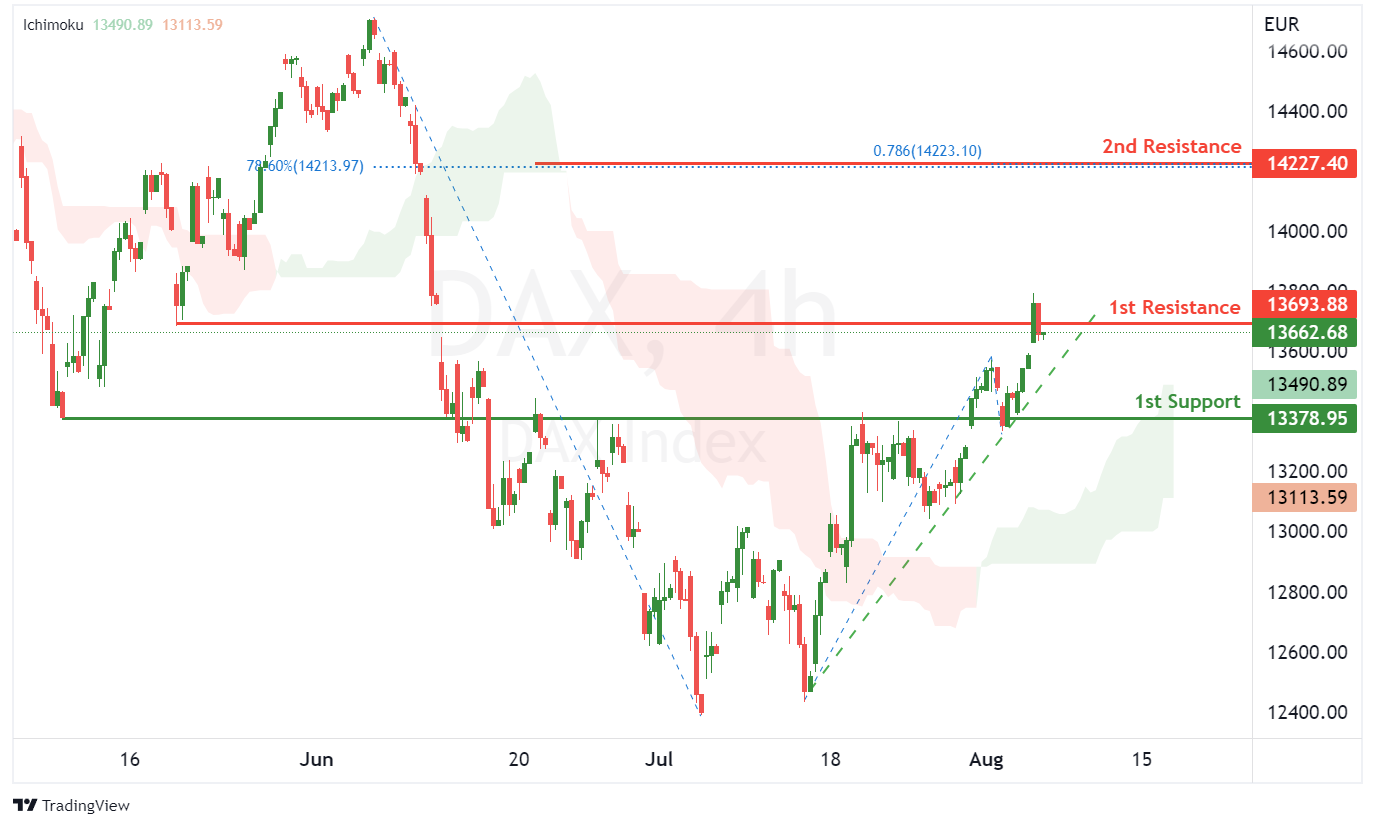
On the H4, with price moving above the ichimoku indicator and along the ascending trendline, we have a bullish bias that price will rise to 1st resistance at 13693.88 where the pullback resistance is. Once there is upside confirmation of price breaking 1st resistance structure, we would expect bullish momentum to carry price to 2nd resistance at 14227.40 in line with 78.6% fibonacci projection and 78.6% fibonacci retracement. Alternatively, price could drop to 1st support at 13378.95 where the overlap support is.
Areas of consideration:
- H4 time frame, 1st resistance of 13693.88
- H4 time frame, 1st support at 13378.95
ETHUSD:
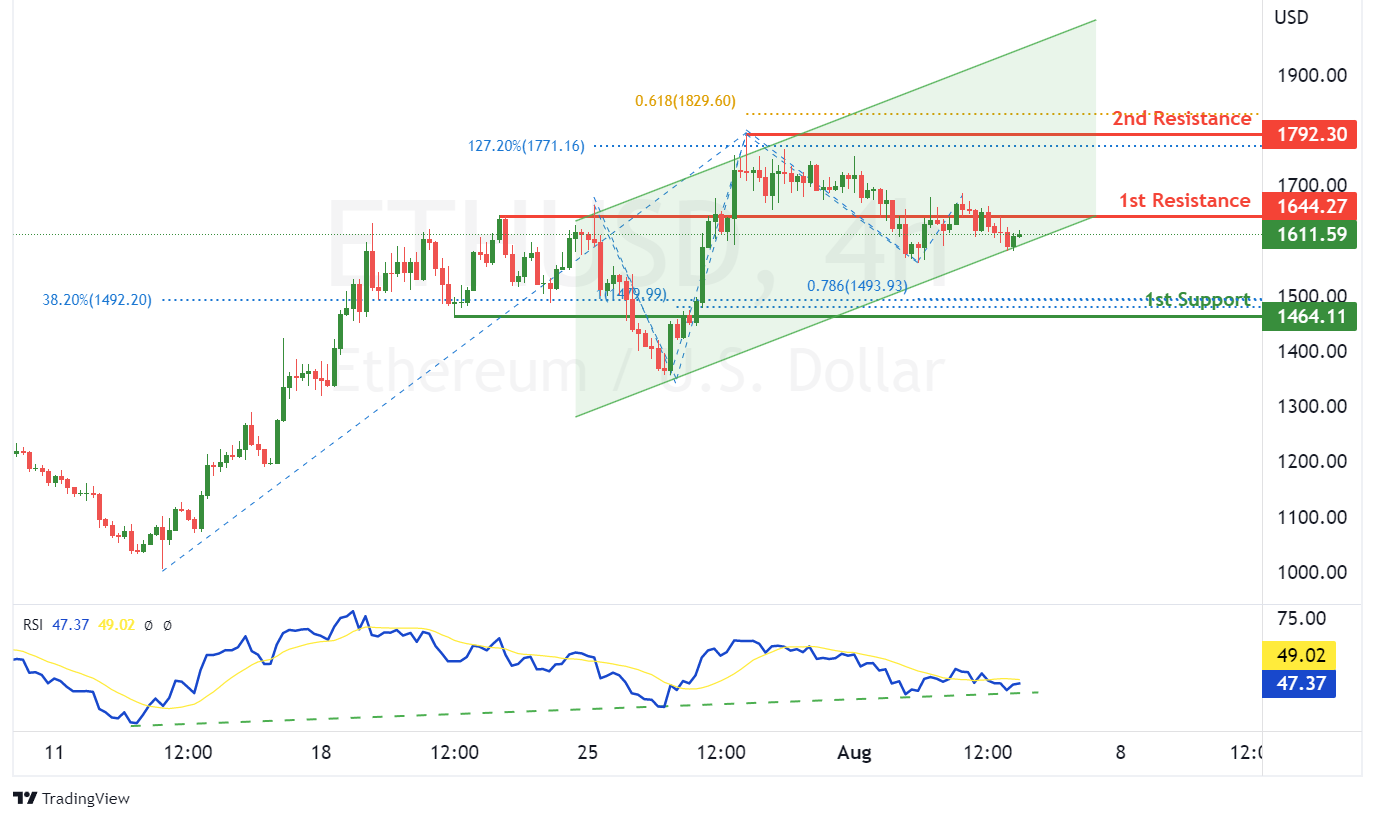
On the H4, with RSI moving along an ascending trendline and price moving within an ascending channel, we have a bullish bias that price will rise to 1st resistance at 1644.27 where the overlap support is. Once there is upside confirmation that price has broken 1st resistance structure, we would expect bullish momentum to carry price to 2nd resistance at 1792.30 where the swing high resistance, 127.2% fibonacci extension and 61.8% fibonacci projection are. Alternatively, price could drop to 1st support at 1464.11 where the pullback support, 78.6% fibonacci projection, 100% fibonacci projection and 38.2% fibonacci retracement are.
Areas of consideration:
- H4 time frame, 1st resistance of 1644.27
- H4 time frame, 1st support at 1464.11
BTCUSD:
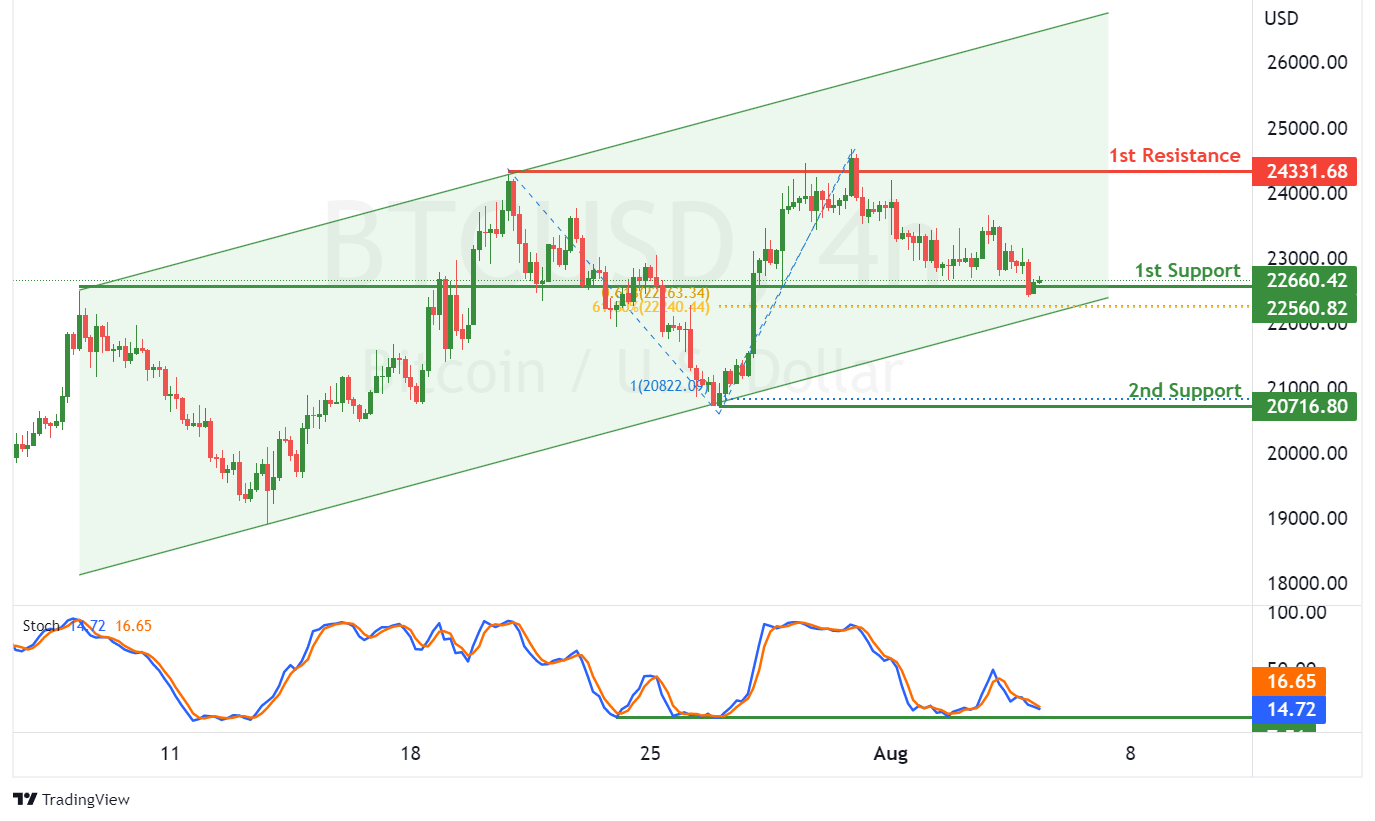
On the H4, with price moving within a bullish channel and expected to bounce from the stochastic support, we have a bullish bias that price will rise from our 1st support at 22560.82 where the pullback support, 61.8% fibonacci retracement and 61.8% fibonacci projection are to the 1st resistance at 24331.68 where the pullback resistance is. Alternatively, price could break 1st support structure and drop to 2nd support at 20716.80 where the swing low support and 100% fibonacci projection are.
Areas of consideration:
- H4 time frame, 1st resistance of 24331.68
- H4 time frame, 1st support at 22560.82
S&P 500:
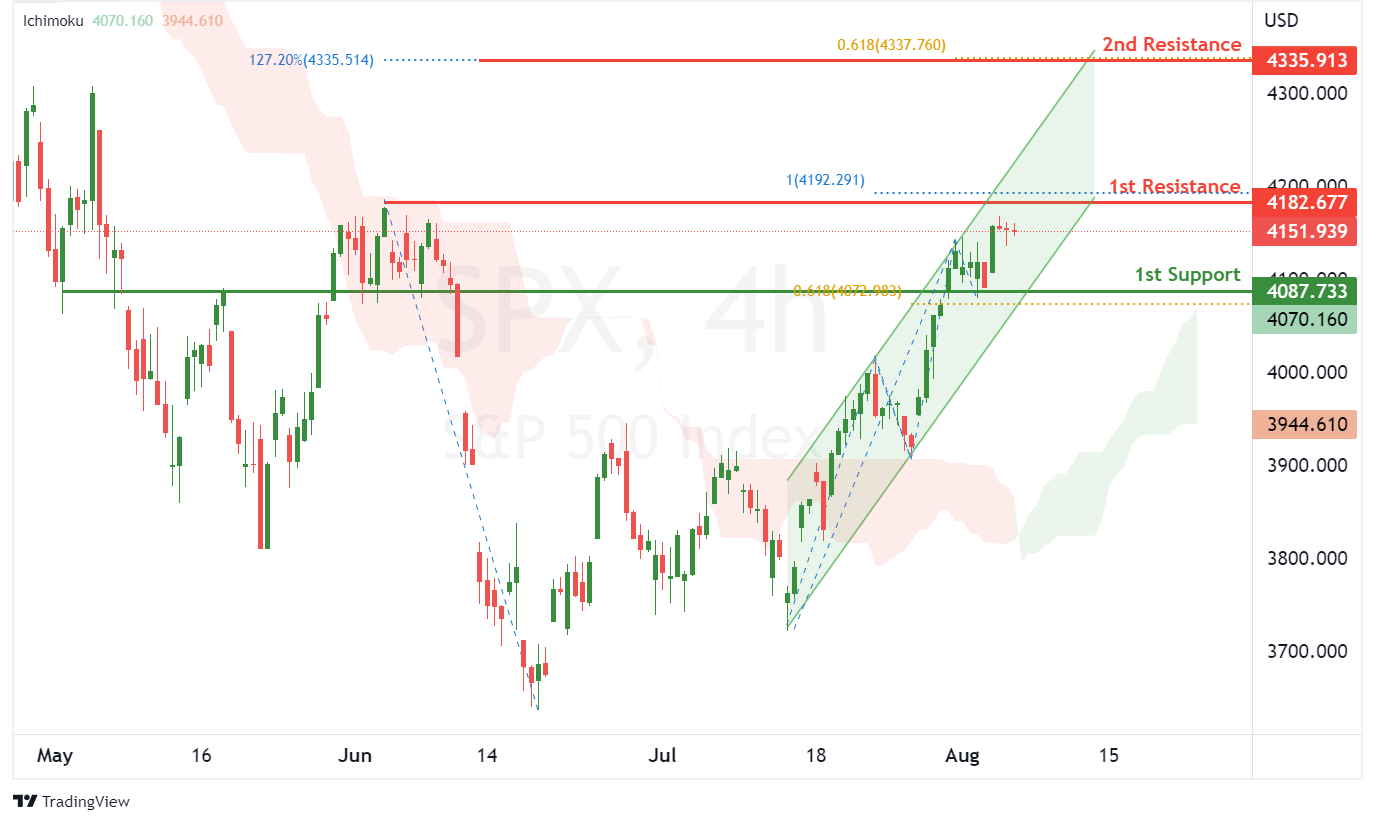
On the H4, with price moving above the ichimoku indicator and within an ascending channel, we have a bullish bias that price will rise to our 1st resistance at 4182.677 where the swing high resistance and 100% fibonacci projection are. Once there is upside confirmation that price has broken the 1st resistance structure, we would expect bullish momentum to carry price to 2nd resistance at 4335.913 where the 127.2% fibonacci extension and 61.8% fibonacci projection are. Alternatively, price could drop to 1st support at 4087.733 where the overlap support and 61.8% fibonacci projection are.
Areas of consideration:
- H4 time frame, 1st resistance of 4182.677
- H4 time frame, 1st support at 4087.733
USD/JPY Recovery Faces Hurdle, Oil Price Dives
Key Highlights
- USD/JPY started a recovery wave from the 130.40 zone.
- It is facing a major hurdle near 134.00 and 134.20 on the 4-hours chart.
- Crude oil price is gaining bearish momentum below the $92.50 support.
- The US nonfarm payrolls could increase 250K in July 2022, down from 372K.
USD/JPY Technical Analysis
The US Dollar declined heavily below the 135.00 support against the Japanese Yen. USD/JPY traded as low as 130.42 before there was an upside correction.
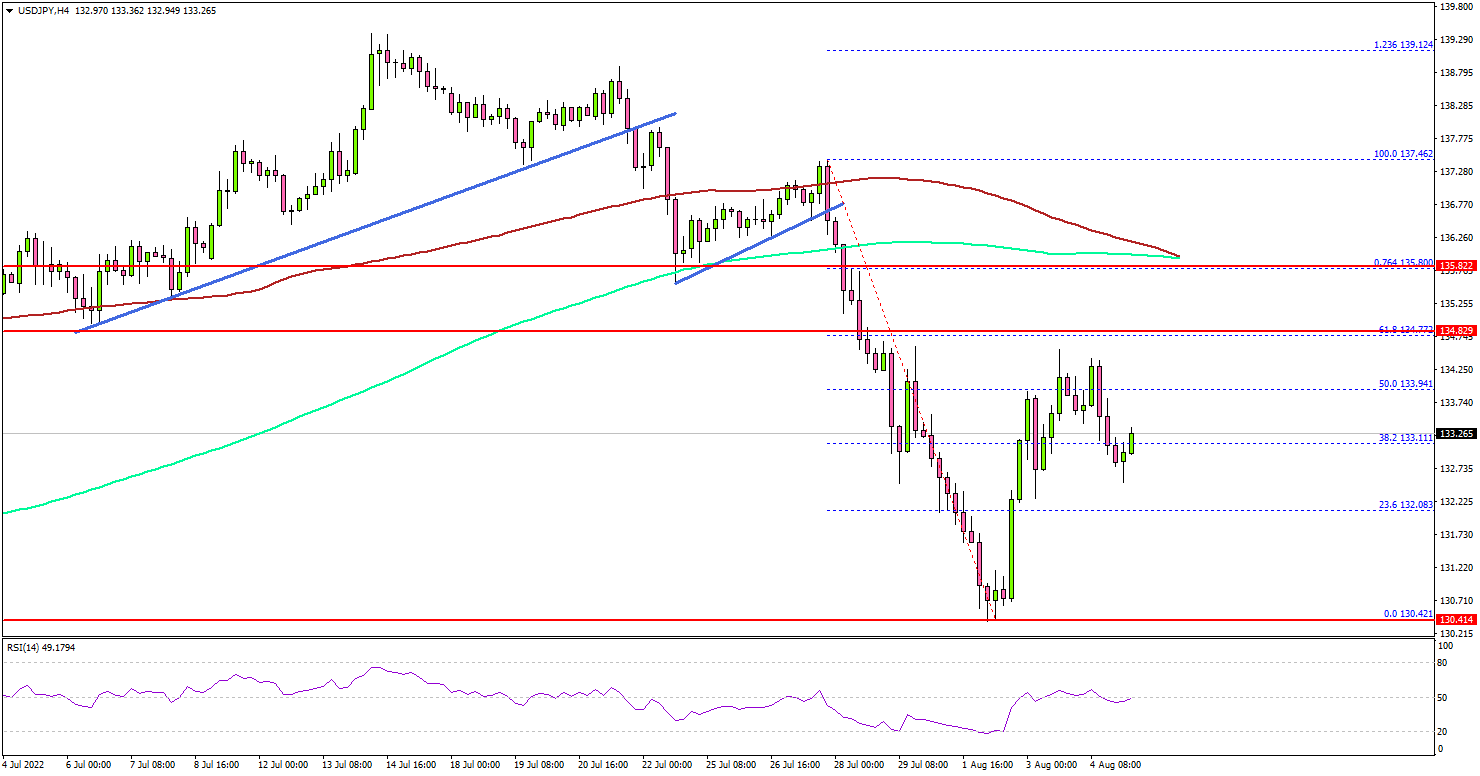
Looking at the 4-hours chart, the pair settled well below the 135.00 level, the 100 simple moving average (red, 4-hours), and the 200 simple moving average (green, 4-hours).
The pair started a recovery wave from the 130.42 low and climbed above the 132.50 resistance zone. The pair broke the 38.2% Fib retracement level of the downward move from the 137.46 swing high to 130.42 low.
USD/JPY is now struggling to clear the 50% Fib retracement level of the downward move from the 137.46 swing high to 130.42 low.
The next major resistance is near the 134.50 level, above which the pair could accelerate higher. In the stated case, the pair could rise towards the 136.00 resistance zone in the near term.
Conversely, USD/JPY pair might start a fresh decline below the 132.50 support zone. The first major support is near the 132.20 level. Any more losses might send the pair towards the 131.20 zone.
Looking at crude oil price, there was a sharp decline below the $95.00 and $92.50 support levels. The price even traded below the $90.00 level and it seems like the price might accelerate lower towards $85.00.
Economic Releases
- US nonfarm payrolls for July 2022 – Forecast 250K, versus 372K previous.
- US Unemployment Rate for July 2022 - Forecast 3.6%, versus 3.6% previous.
- Canada’s employment Change payrolls for July 2022 – Forecast 20K, versus -43.2K previous.
- Canada’s Unemployment Rate for July 2022 - Forecast 5%, versus 4.9% previous.
Will Canada’s July Jobs Report be Important for the Loonie?
Canadian employment likely returned to growth in July, Statistics Canada will show on Friday at 12:30 GMT, but the rebound may not be anything to celebrate. If that turns out to be the case, the figures could do little to alter investors’ rate hike expectations, leaving the loonie under the US dollar’s influence.
Soft employment growth expected
After a contraction of 43.2k in June, employment in Canada is expected to have increased by 20k in July. Although a return to growth is always welcomed, such an addition could still be among the smallest this year, and not enough to press the unemployment rate further lower. Instead, analysts see the unemployment rate ticking up to 5.0% from 4.9% previously but remaining close to record lows.
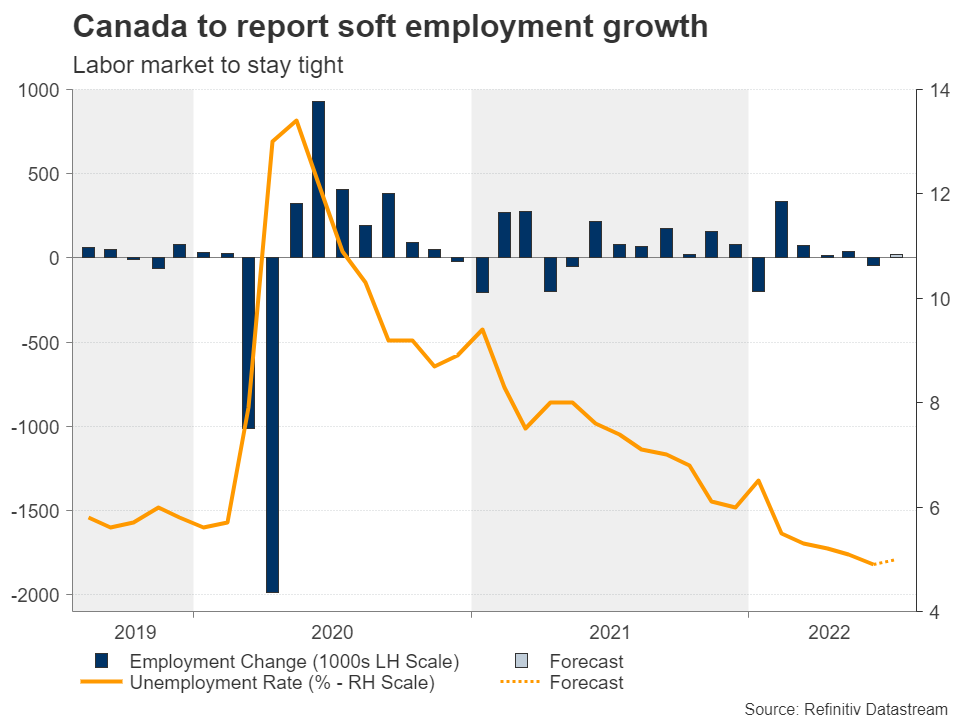
In a nutshell, the labor market is still quite tight and that might explain the marginal growth in job additions. The latest S&P Global manufacturing PMI survey has also witnessed the softest employment expansion in more than a year, citing restructuring proceedings, which led some companies to cut some workforce.
How could the BoC react?
The question that comes to mind now is how the data will affect the central bank’s rate outlook. Following a surprisingly extraordinary 100 basis point rate increase in July, investors are now debating whether September’s policy meeting will result in a reduced but still robust 75 bps or 50 bps rate hike.
If June’s employment downfall unexpectedly extends for another month, sending preliminary warnings that boiling inflation has started to weigh on hiring, even if wages are still rising at a slower pace than prices, more investors could place their rate expectations on the less hawkish scenario. In this case, the loonie could decelerate, bringing the 20-day simple moving average (SMA) at 1.2910 per US dollar under examination, while not far above, the 1.2950 resistance will be closely watched as well. A bigger miss in the data could see the greenback rallying towards the key resistance area of 1.3036 – 1.3083, especially if the US nonfarm payrolls data due on the same day and time appear relatively more impressive.
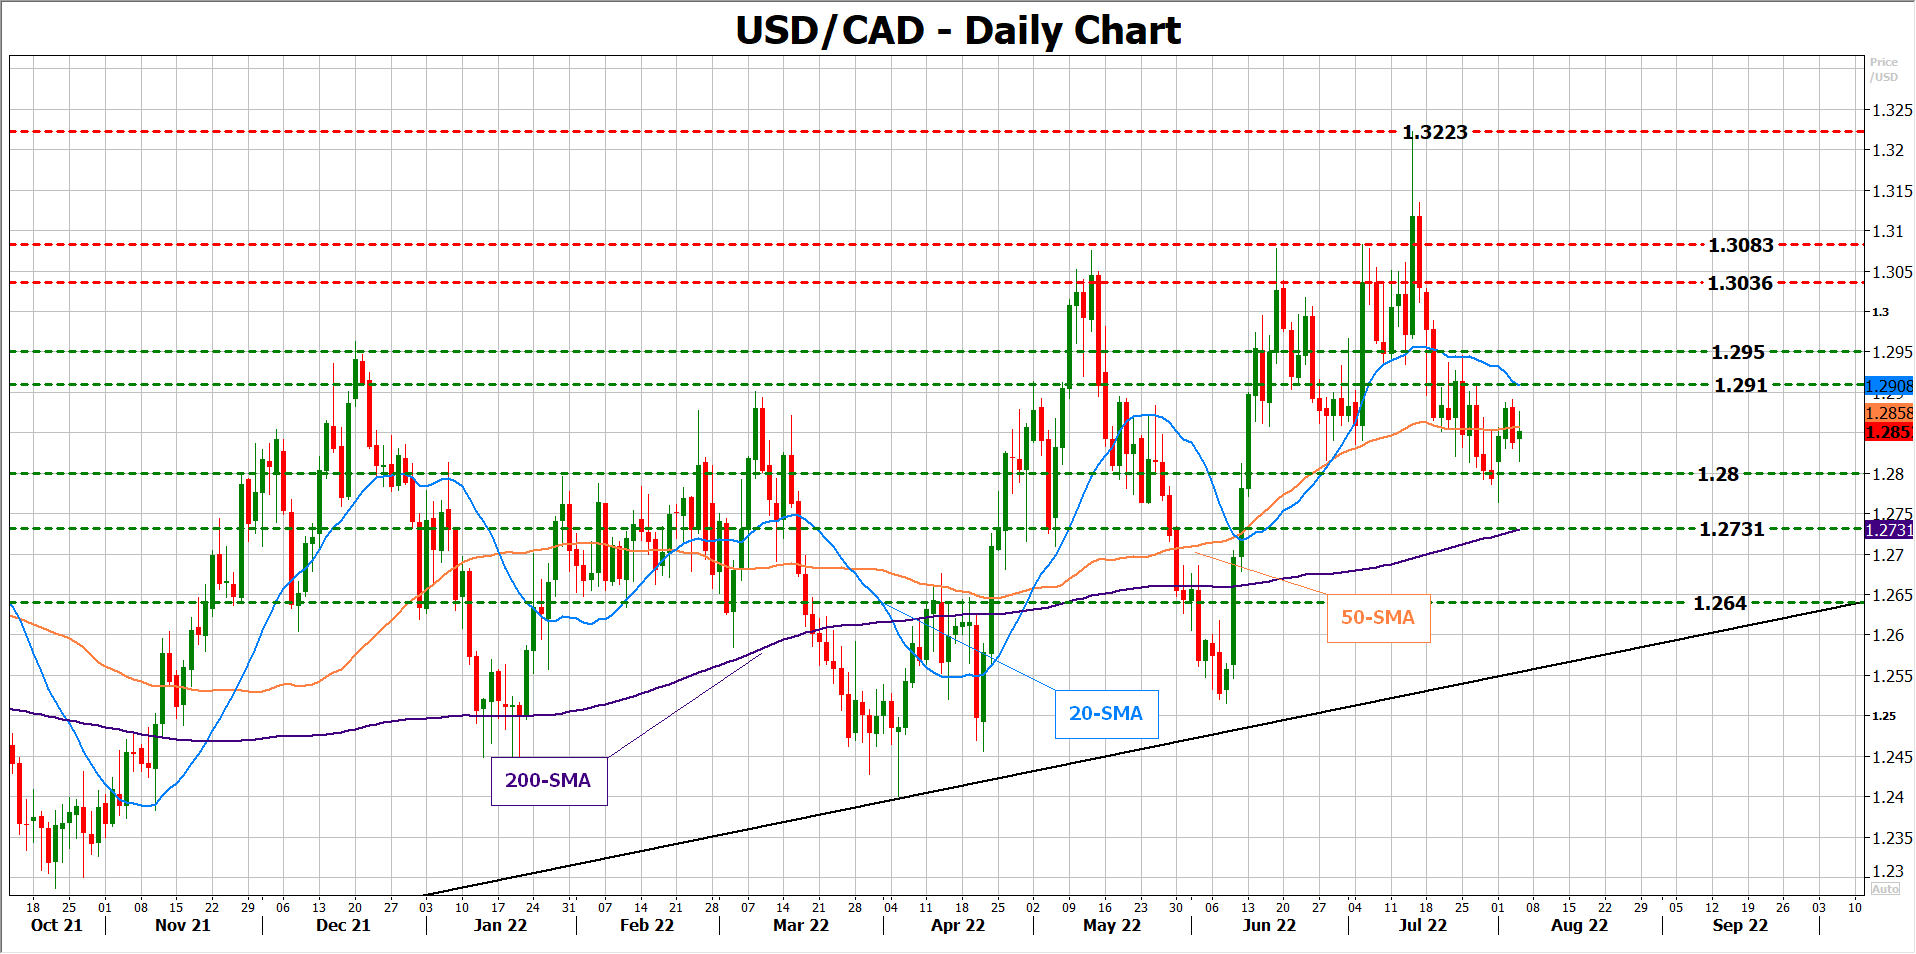
In the positive scenario, where the economy creates more jobs than analysts forecast, the central bank could feel more confident to front-load its tightening cycle as inflation seems to be transforming into a more persistent phenomenon.
Housing market eyed
Of course, monetary tightening seems to be already draining the heat of the booming housing market, with home prices tumbling the most in at least 17 years in June. Though, the housing price index is still among the highest in more than a decade, while household debt still represents more than 100% of households' income.
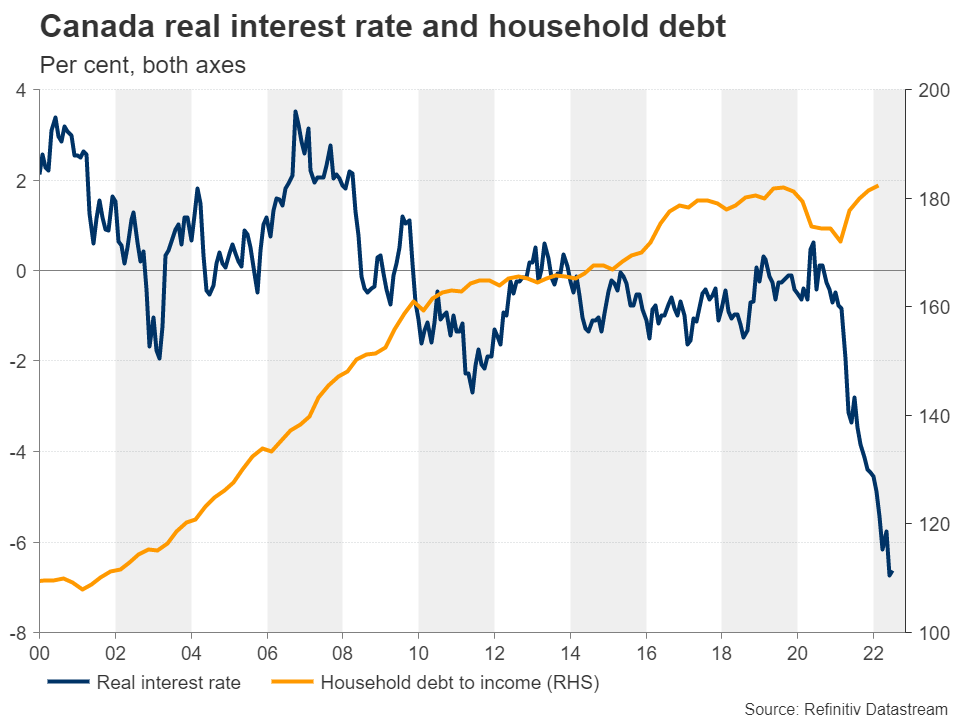
Therefore, although the falling housing market brings flashbacks from the 2007-2009 financial crisis, policymakers will probably prioritize their inflation mission if the labor market stands firm in the year ahead. Besides, given Canada’s commodity rich economy, rising energy prices could create more revenues for businesses. That said, traders may remain patient and wait for August’s employment report before they make up their minds about either a 50- or 75-bps rate hike in early September.
As regards the market reaction, the Canadian employment report will have to decisively beat market expectations and come in brighter than the US nonfarm payrolls to squeeze dollar/loonie below 1.2800. In this case, the door will open for the 200-day SMA at 1.2731, while even lower, the 1.2640 constraining zone could come under examination ahead of the long term descending trendline.
Elliott Wave View: 5 Waves Rally in Gold
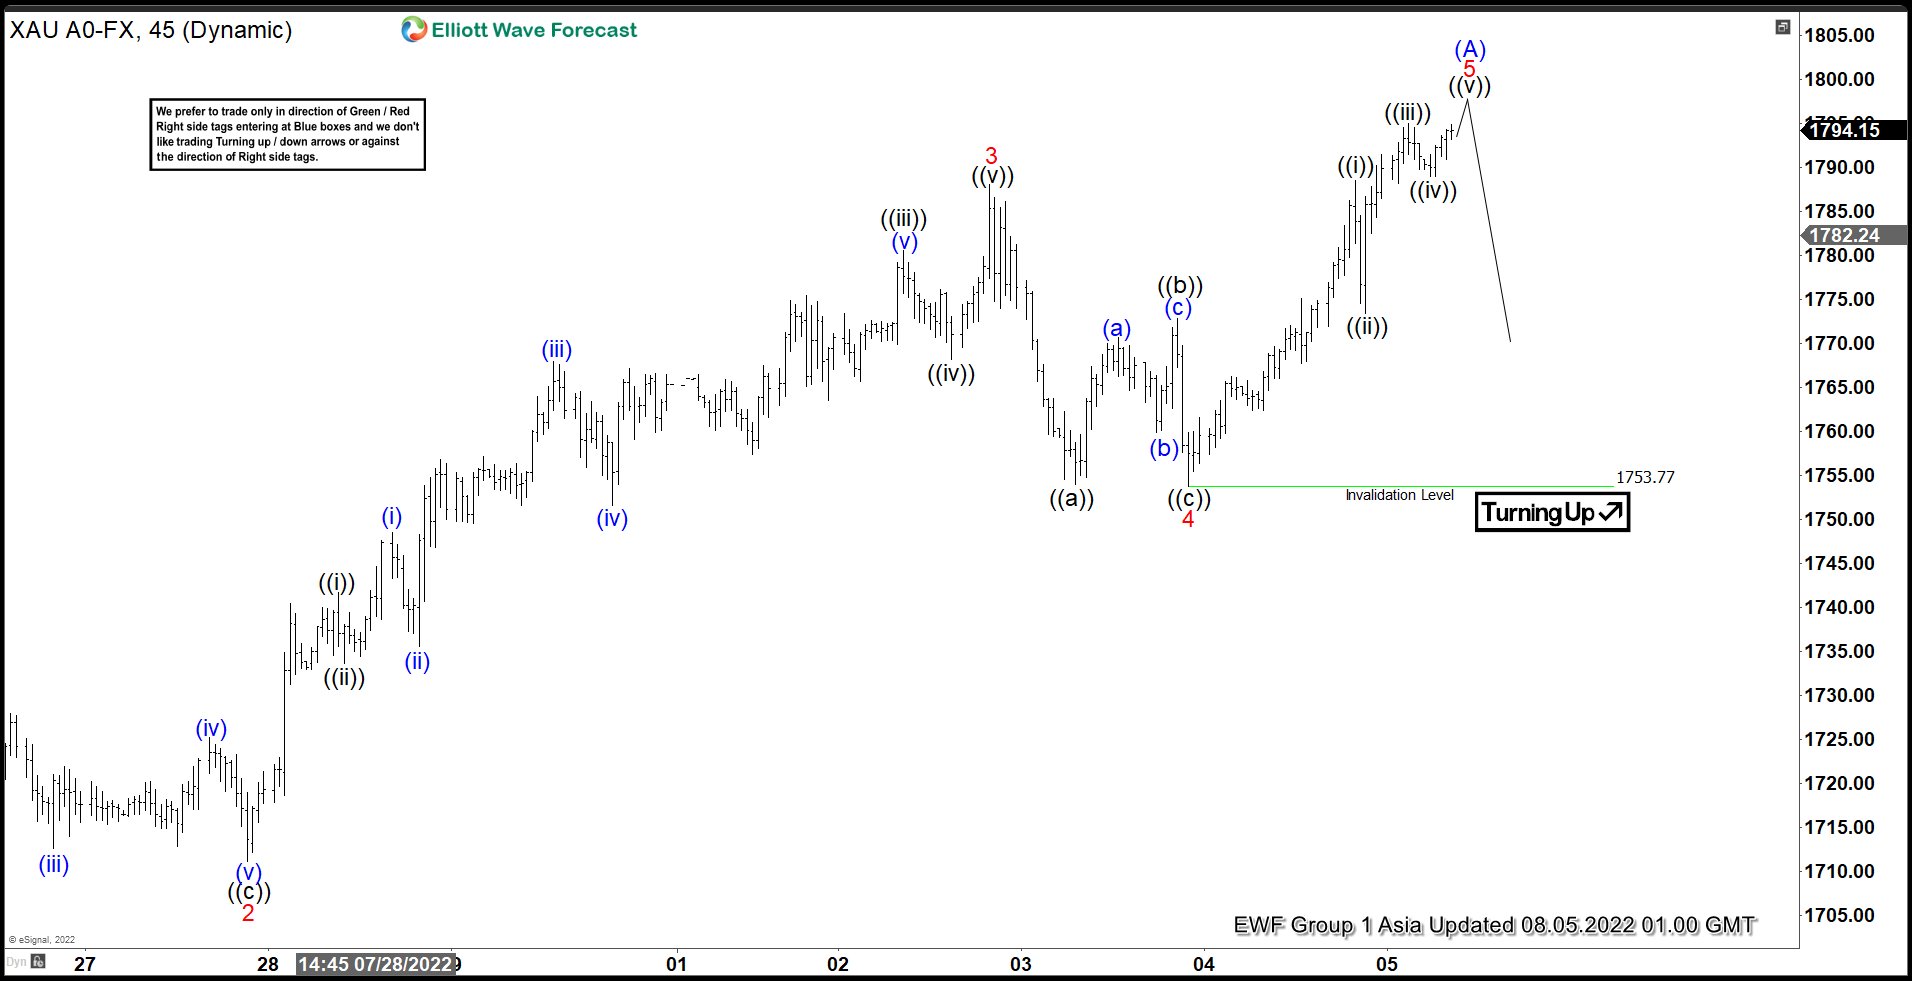
Short Term Elliott Wave View in Gold suggests rally from 7.21.2022 low is in progress as a 5 waves impulse Elliott Wave structure. Up from 7.21.2022 low, wave 1 ended at 1739.27 and pullback in wave 2 ended at 1711.10. The metal then extends higher in wave 3 towards 1788.03. Internal subdivision of wave 3 is in another impulse in lesser degree as the 45 minutes chart below shows. Up from wave 2, wave ((i)) ended at 1741.69 and pullback in wave ((ii)) ended at 1733.60.
The metal extends higher again in wave ((iii)) towards 1780.52. Dips in wave ((iv)) ended at 1768.10. Final leg higher wave ((v)) of 3 ended at 1788.03. Pullback in wave 4 ended at 1753.77 with internal subdivision as a zigzag. Down from wave 3, wave ((a)) ended at 1753.90. Rally in wave ((b)) ended at 1772.77, and wave ((c)) lower ended at 1753.77. This completed wave 4 in higher degree. Index has resumed higher in wave 5. Up from wave 4, wave ((i)) ended at 1788.47, and wave ((ii)) pullback ended at 1773.40. Wave ((iii)) ended at 1794.93, and pullback in wave ((iv)) ended at 1787.70.
Expect 1 more push higher in wave ((v)) to end the 5 waves rally from 7.21.2022 low and complete wave (A). Afterwards, it should pullback in wave (B) to correct that cycle in larger degree 3, 7, or 11 swing before the next leg higher. Near term, expect Gold to end wave (A) soon and see 3 waves pullback, but as far as the pullback stays above 7.21.2022 low at 1680.20, it should resume higher again.
XAUUSD 45 Minutes Elliott Wave Chart