Sample Category Title
AUD/USD Daily Report
Daily Pivots: (S1) 0.6940; (P) 0.6965; (R1) 0.6995; More...
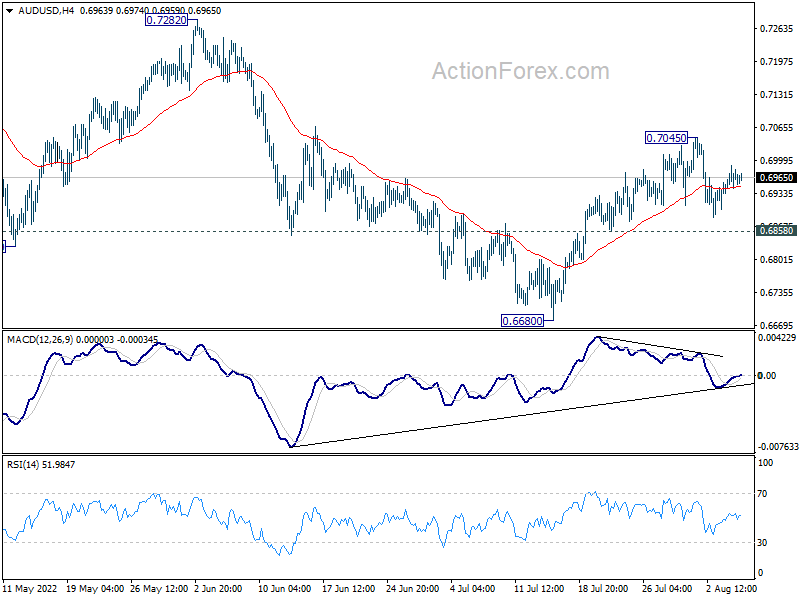
Intraday bias in AUD/USD remains neutral and outlook is unchanged. On the upside, break of 0.7045 will resume the rebound from 0.6680 to 0.7282 key resistance next. On the downside, however, break of 0.6858 minor support will argue that the rebound is over. Intraday bias will then be back on the downside for retesting 0.6680 low.
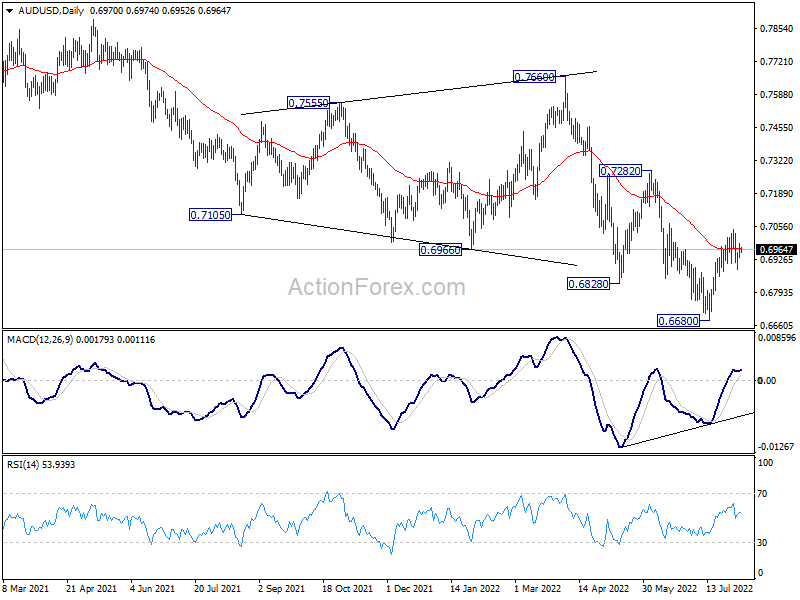
In the bigger picture, price actions from 0.8006 (2021 high) could still be a corrective pattern to rise from 0.5506 (2020 low). But current downside acceleration, as seen in weekly MACD), is raising the chance that it's a bearish impulsive move. In either case, outlook will remain bearish as long as 0.7282 resistance holds. Next target is 61.8% retracement of 0.5506 to 0.8006 at 0.6461.
USD/JPY Daily Outlook
Daily Pivots: (S1) 132.31; (P) 133.37; (R1) 133.97; More...
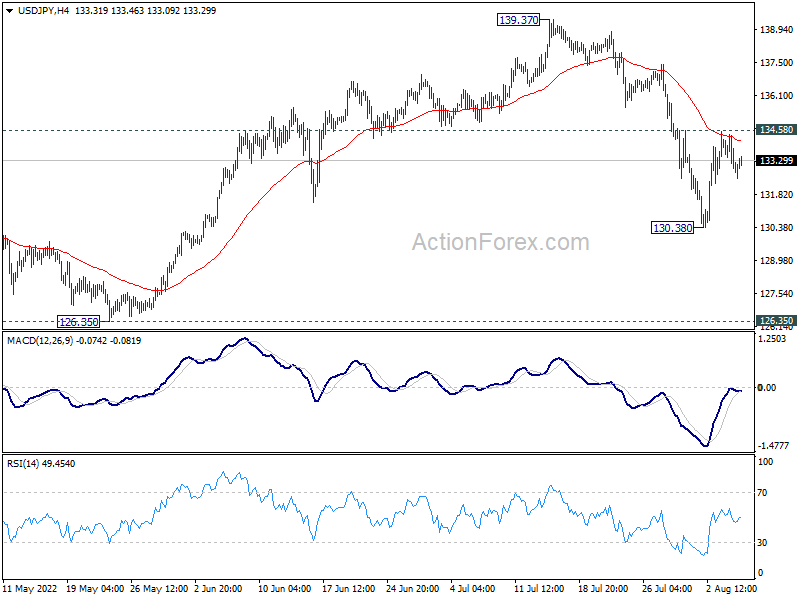
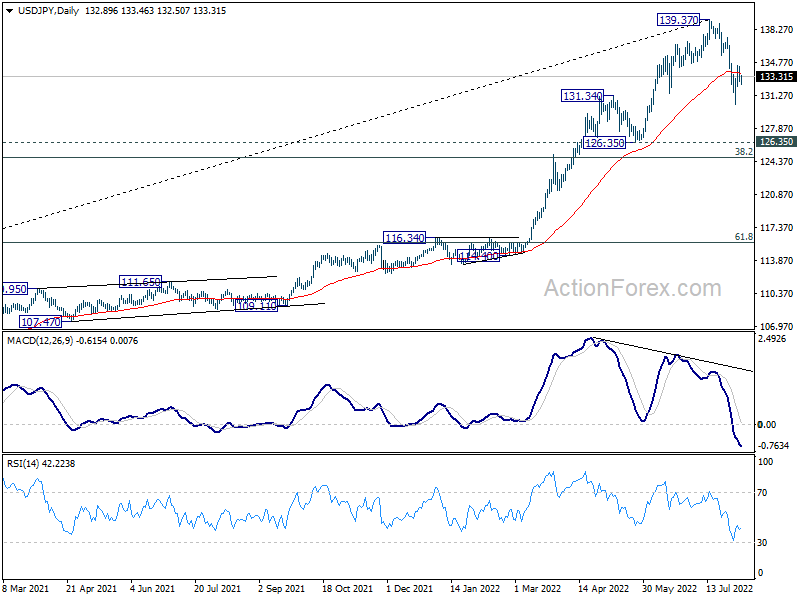
Intraday bias in USD/JPY stays neutral at this point and outlook is unchanged. Correction from 139.37 could still extend through 130.38. But downside should be contained above 126.35 support, at least on first attempt, to bring rebound. On the upside, firm break of 134.58 will turn bias to the upside for stronger rally to retest 139.37 high.
In the bigger picture, a medium term top should be in place at 139.37, on bearish divergence condition in daily MACD. Fall from there could be correcting whole up trend from 101.18 (2020 low). While deeper decline cannot be ruled out, outlook will stays bullish as long as 55 week EMA (now at 121.84) holds. Long term up trend is expected to resume through 139.37 at a later stage, after the correction finishes.
USD/CHF Daily Outlook
Daily Pivots: (S1) 0.9522; (P) 0.9572; (R1) 0.9601; More...
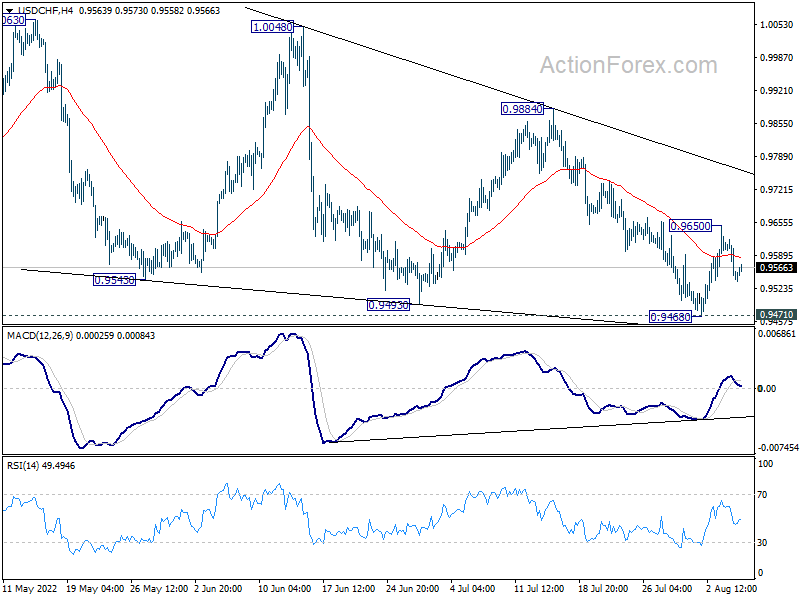
USD/CHF retreated after hitting 0.9650 and intraday bias is turned neutral. On the upside, break of 0.9650, and sustained trading above 55 day EMA (now at 0.9650) will raise the chance that corrective pattern from 1.0063 has completed. Further rally should then be seen to 0.9884 resistance next. However, decisive break of 0.9471 support will carry larger bearish implication.
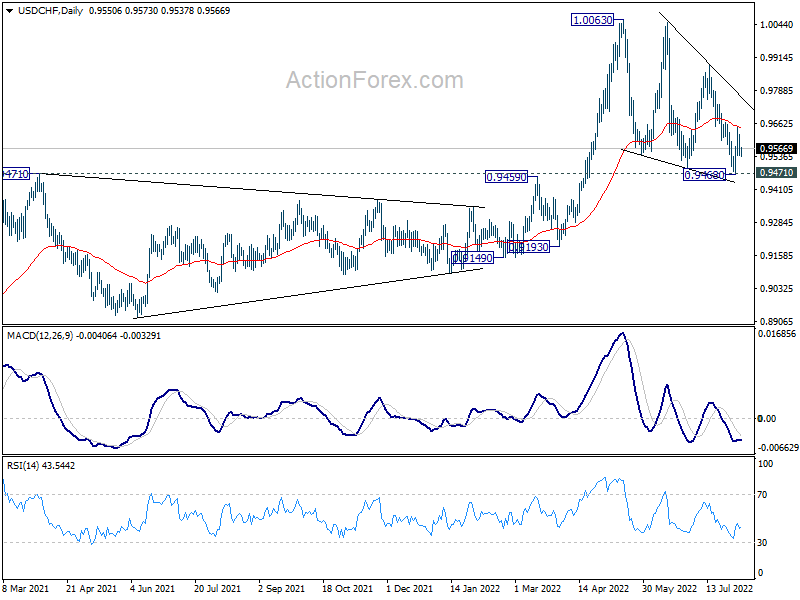
In the bigger picture, medium term up trend from 0.8756 (2021 low) is still in progress. On resumption, next target is 1.0342 (2016 high). Sustained break there will resume long term up trend from 0.7065 (2011 low). This will remain the favored case as long as 0.9471 resistance turned support holds. However, firm break of 0.9471 will raise the chance that such up trend is over. Sustained trading below 55 week EMA (now at 0.9424) could bring deeper medium term fall back to 0.9149 support and below.
GBP/USD Daily Outlook
Daily Pivots: (S1) 1.2080; (P) 1.2146; (R1) 1.2225; More...
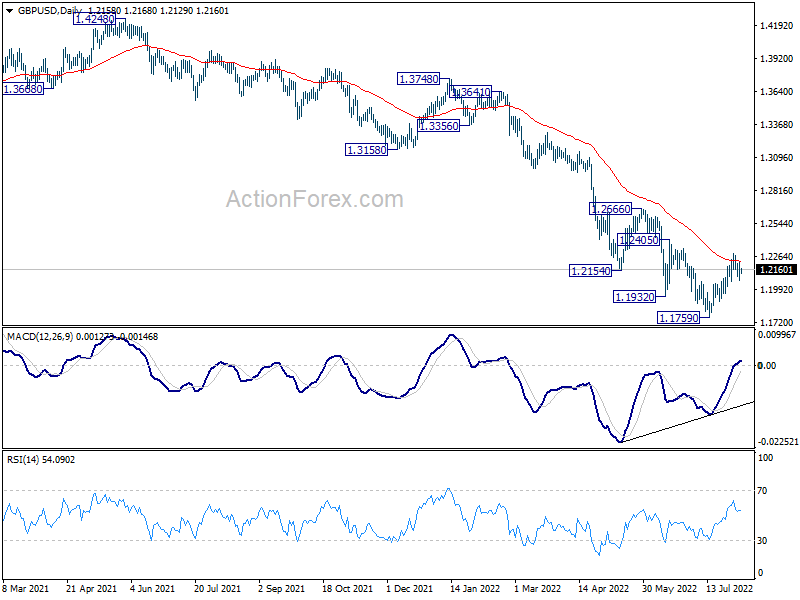
Intraday bias in GBP/USD remains neutral for the moment and further rise is in favor with 1.2062 minor support intact. Above 1.2292 will target 1.2405 resistance first. Firm break there will target 1.2666 key resistance next. On the downside, however, break of 1.2062 minor support will argue that the rebound from 1.1759 is over, and turn bias back to the downside for retesting 1.1759 low instead.
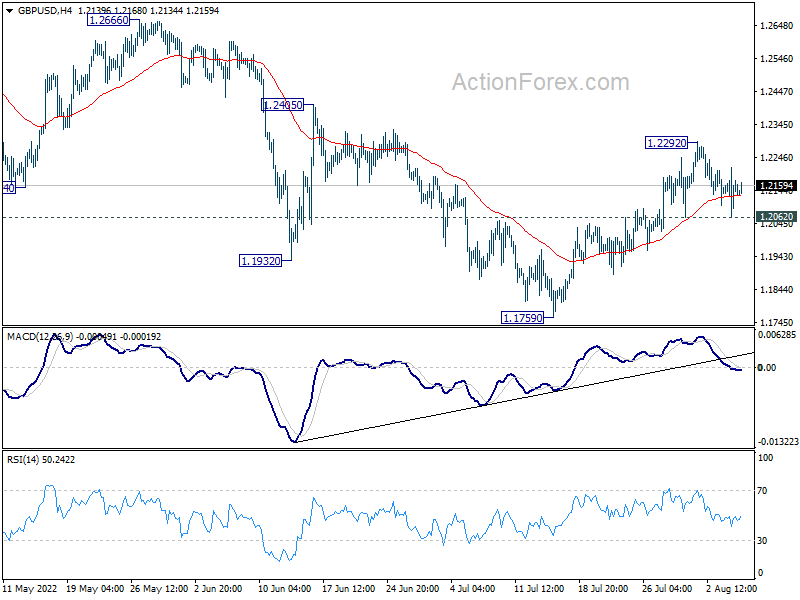
In the bigger picture, fall from 1.4248 (2018 high) could be a leg inside the pattern from 1.1409 (2020 low), or resuming the longer term down trend. Deeper decline is expected as long as 1.2666 resistance holds. Next target is 1.1409 low. However, firm break of 1.2666 will bring stronger rise back to 55 week EMA (now at 1.2957).
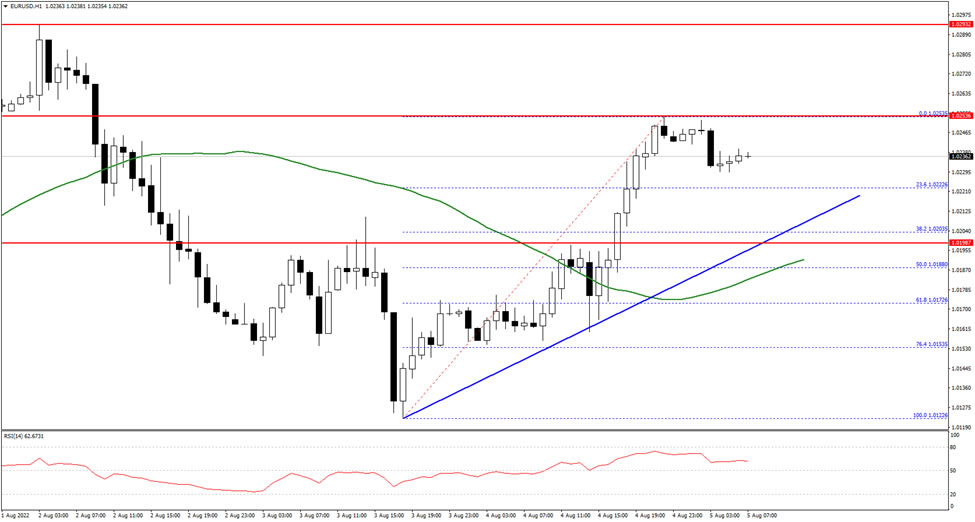
EUR/USD Pair in a Fresh Upward Move above $1.0165
The Euro started a fresh upward move above the 1.0165 zone against the US Dollar. The EUR/USD pair climbed above the 1.0220 resistance to move into a short-term bullish zone.
The pair climbed above the 1.0240 level and settled above the 50 hourly simple moving average. A high is formed near 1.0253 and the pair is now consolidating. An immediate resistance on the upside is near 1.0250 on FXOpen.
The first major resistance is near the 1.0265 level. A break above the 1.0250 and 1.0265 resistance levels could start a decent upward move. In the stated case, it could even surpass 1.0300.
If not, the pair might drop below 1.0220. The next key support is near 1.0200, below the pair could decline towards the 1.0165 level in the near term. Any more losses might send the pair towards the 1.0120 level.
Cliff Notes: Disparate Consequences of Global Fight Against Inflation
Key insights from the week that was.
50bp rate hikes were seen in Australia and the UK this week, with both central banks also signalling that additional tightening is likely to be required in the months ahead. However, the economic situation faced by these two nations differs greatly, as do the risks.
In explaining their decision to raise the cash rate by another 50bps at the August meeting, the RBA highlighted that inflation had been stronger than anticipated (the 2022 forecast for headline inflation revised up from 5.9%yr in May to 7.75%yr in August’s projections) and could prove more persistent (annual inflation is now seen at 4.0%yr in 2023, and to only be back at the top of the 2-3%yr target range by end-2024). As discussed by Chief Economist Bill Evans after Tuesday’s decision, the RBA continue to view the activity and labour market impact of tighter policy and the loss of real income as manageable. In short, growth in 2022 is now seen at 3.25% instead of 4.25% (inclusive of the 0.5% ‘miss’ for Q1 GDP which was released after the RBA’s May forecasts) and 1.75% in 2023 and 2024, just a touch lower than the prior 2.0%yr forecast. Moreover, the unemployment rate is only expected to rise to 4.0% through 2023 and 2024, effectively keeping the labour force fully employed over the period.
To our mind, the language and forecasts included in the August decision statement support our call for another 50bp hike in September and 25bp increases in October through February, taking the cash rate to a peak of 3.35% at February 2023. We expect growth and the labour market will prove stronger in 2022 than the RBA currently forecast, but anticipate inflation to be broadly in line with their expectation. Looking further ahead however, we see a marked deterioration in growth in 2023 (to 1.0%yr) and a much larger rise in the unemployment rate over 2023 and 2024 to around 5.0%. As a result, we believe 100bps of easing will be required through 2024 to bring GDP growth back to 2.0%yr and to stabilise the labour market. Note, a full view of the RBA’s baseline forecasts and assessment of risks is available in the just released August Statement on Monetary Policy. A detailed exploration of our own views on Australia and the world will also be released today in the August edition of Westpac’s Market Outlook on Westpac IQ.
Data released for Australia this week was mixed but consistent with our overall view of the economy. Retail sales volumes continued to show strength in Q2 despite large price gains, activity up 1.4% on Q1 which itself saw a 1.2% gain. The trade surplus also beat expectations in June, widening to $17.7bn as exports jumped 5.1% on gains for commodity prices and volumes as well as improved tourism activity. Against these positives, the correction in house prices was shown to have deepened and broadened across the country in July, capital city prices falling another 1.4%; and housing finance approvals weakened sharply in June, more than reversing the surprise gain of May. While dwelling approvals held up in June, it is likely just a matter of time before weakening demand for housing hits the construction pipeline.
Turning then to New Zealand. The Q2 labour market data showed unemployment and underutilisation at-or-near historic lows despite a second consecutive quarter of no employment growth. More significant for inflation and the stance of policy however was a material upside surprise for private sector wage growth, up 1.3% in the quarter and 3.4%yr – the latter the fastest pace since early 2009. The breadth of wage gains was also notable in Q2. On the back of these results, our New Zealand team has revised up its peak for the cash rate to 4.0% by the end of 2022.
For the US this week, the data has been mixed. The ISM services survey provided a positive surprise on activity in the sector, particularly relative to the S&P Global services PMI which reported a contractionary reading. Also taken as a positive for the outlook was another material step down in the price sub-index of both the manufacturing and services ISMs, these results implying a working though of global supply disruptions and dissipating inflation pressures.
Also acting against inflation in the US is the rebalancing of their labour market. At the moment, this is occurring at the margin through a moderate deceleration in employment growth. However, given the recent weakness in activity as well as the mounting impact of historic inflation on real household income and tight financial conditions, US labour market slack is likely to become significant over the coming 12 to 18 months. As it impacts activity and inflation, we expect the market to price in a cutting cycle which we believe will commence at the end of 2023 and continue through 2024.
Over in the UK, the Bank of England followed the lead of the FOMC and other major central banks by deciding to raise the bank rate by an outsized 50bps from 1.25% to 1.75%, their first move of such scale in this tightening cycle. Additionally, the Committee intends to begin quantitative tightening in September via GBP40bn of asset sales and by letting GBP40bn of maturing securities run off the portfolio over 12 months. Neither outcome surprised the market, and so the focus of participants was on the Committee’s updated projections. These paint a bleak picture for the UK’s economic outlook.
Inflation is now expected to peak at 13.1%yr in Q4 2022 (prev. 10.25%yr) and to persist at a more elevated level throughout 2023 (9.5%yr at Q3; prev. 5.9%yr) before declining towards the 2.0%yr target by Q3 2024. This higher profile for inflation and a weakening labour market has led to a materially lower outlook for activity growth as higher prices erode household real post-tax income by 8% over 2022 and 2023. Overall, the Committee now anticipate the UK to enter recession in Q4 2022, with output to decline in each quarter thereafter until the end of 2023, marking annual GDP growth at -1.5% in 2023 and -0.25% in 2024.
The Bank of England now find themselves in a tight bind between inflation and growth risks, but given the severity of the inflation challenge and concerns over inflation expectations, it is clear that they are willing to accept weakness in activity. We now expect the Bank of England to raise the bank rate by 50bp in September before slowing to a 25bp pace in November and December to reach a peak of 2.75% by year end. Given this aggressive contractionary stance, we believe 175bp of rate cuts will prove necessary from Q3 2023 to Q4 2024 to correct the growth trend as inflation returns to target. Risks remain to the upside for inflation and may require holding the peak bank rate of 2.75% through to end-2023 or into early-2024 at the expense of further weakness in activity.
Daily Technical Analysis
EUR/USD
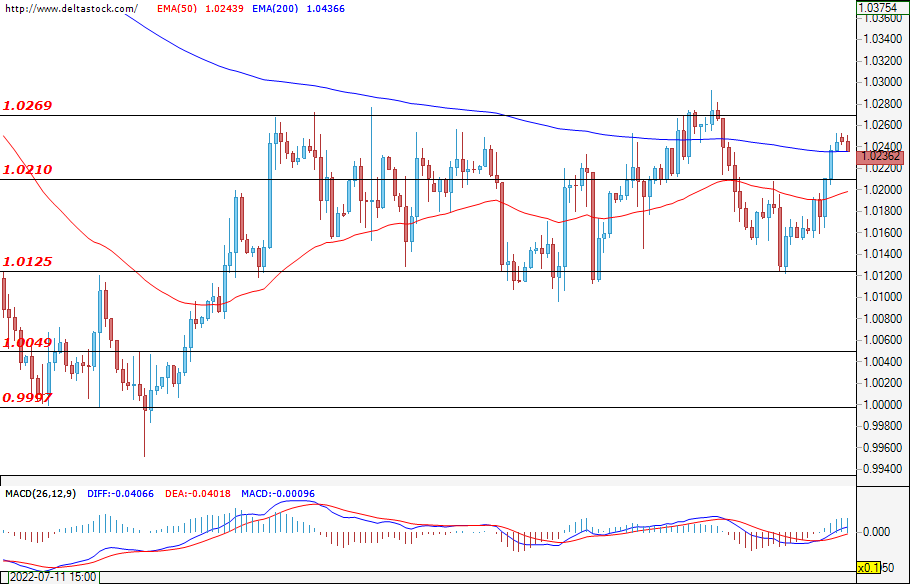
The bulls prevailed and managed to violate the resistance at 1.0210. During the early hours of today’s session, the pair is still trading the aforementioned level and the expectations are for a test of the important level at 1.0269. A successful breach here could lead to a continuation of the recovery and a move towards the levels at around 1.0400. If the bullish momentum fades, then the first target for the bears can be found at the zone of 1.0210, which is now acting as support. A breach of the lower zone at 1.0125 will mark the current move as a corrective one and could deepen the decline towards the support at 1.0049. Today at 12:30 GMT, traders will focus their attention on the data on the non-farm payrolls and the unemployment rate.
USD/JPY
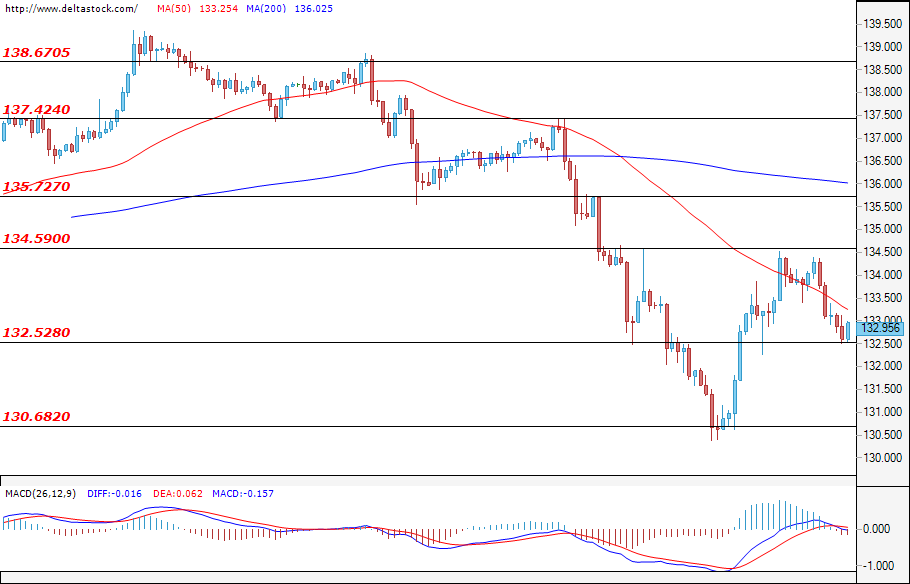
The attack on the support at 132.52 was not successful and the currency pair consolidated above the mentioned level. If the buyers prevail, then they could easily head the price for a test of the resistance zone at 134.59. A confirmed breach will most likely continue the recovery for the dollar against the yen and could pave the way for an attempt for a violation of the target at 135.72. If the bears re-enter the market, then the most likely scenario would be for a new successful test of the zone at 132.52, which could lead to a decline towards the low at 130.68.
GBP/USD
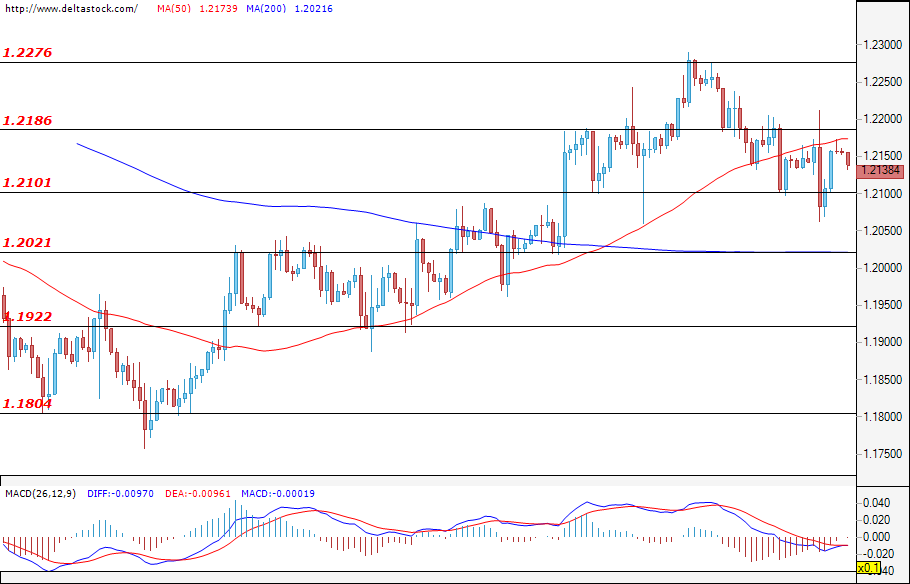
Neither the bears, nor the bulls managed to gain enough momentum and the Cable remains locked in the zone between 1.2101 and 1.2186. A successful attack for the buyers on the resistance at 1.2186, followed by a violation of the upper level at 1.2276, could strengthen the positive expectations for the future path of the GBP/USD and could lead to a rally towards the levels from June 2022 at around 1.2600. If the bears seize control and breach the lower border at 1.2101 istead, then they could test the next target at 1.2021, where a successful breach could easily deepen the sell-off and lead to a move towards the important support at 1.1922.
EUGERMANY40
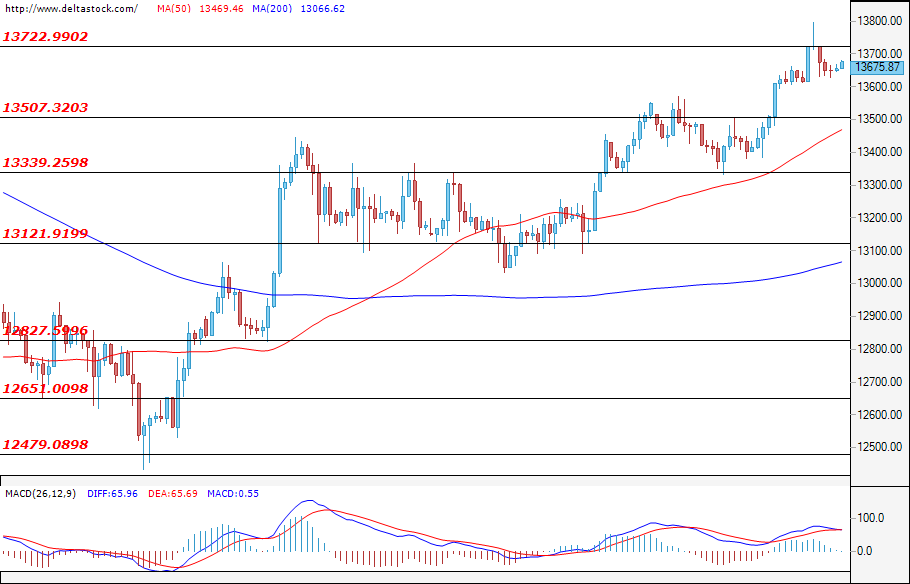
The positive sentiment remains unchanged, and after yesterday’s test of the resistance at 13722, the German index consolidated under the mentioned zone. The expectations are for a new bullish attack, and if successful, the positive expectations for the future path of the EUGERMANY40 will be strengthened and the index is likely to continue its rally towards the levels at around 14000. If the bears prevail, then their first target would be the support at 13507. A violation of the lower zone at 13339 could deepen the correction and could lead to a test of the major support at 13121.
US30
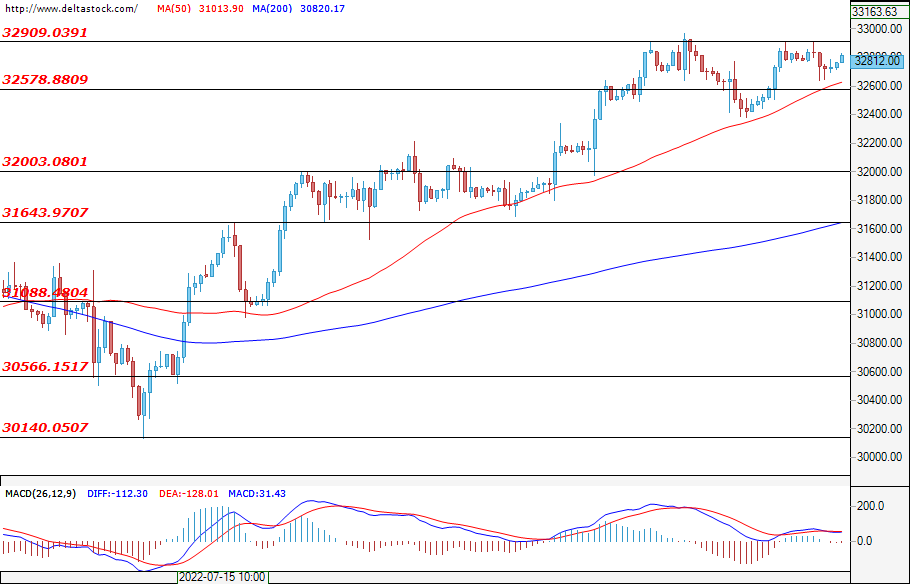
The U.S. index continues to trade below the week’s highs, and during the early hours of today, the price consolidated above the support at 32578. Better- than-expected U.S. data for the non-farm payrolls and the unemployment rate (today; 12:30 GMT) could help the bulls prevail. A successful breach of 32909 could easily lead to a rally and result in future gains for the US30. If the bears enter the market, then a violation of the support zone at 32578 could deepen the sell-off. A successful attack on the lower target at 32003, followed by a violation of the zone at 31643, could easily lead to a change in the current sentiment of the market participants.
NAS 100 Tests Major Resistance
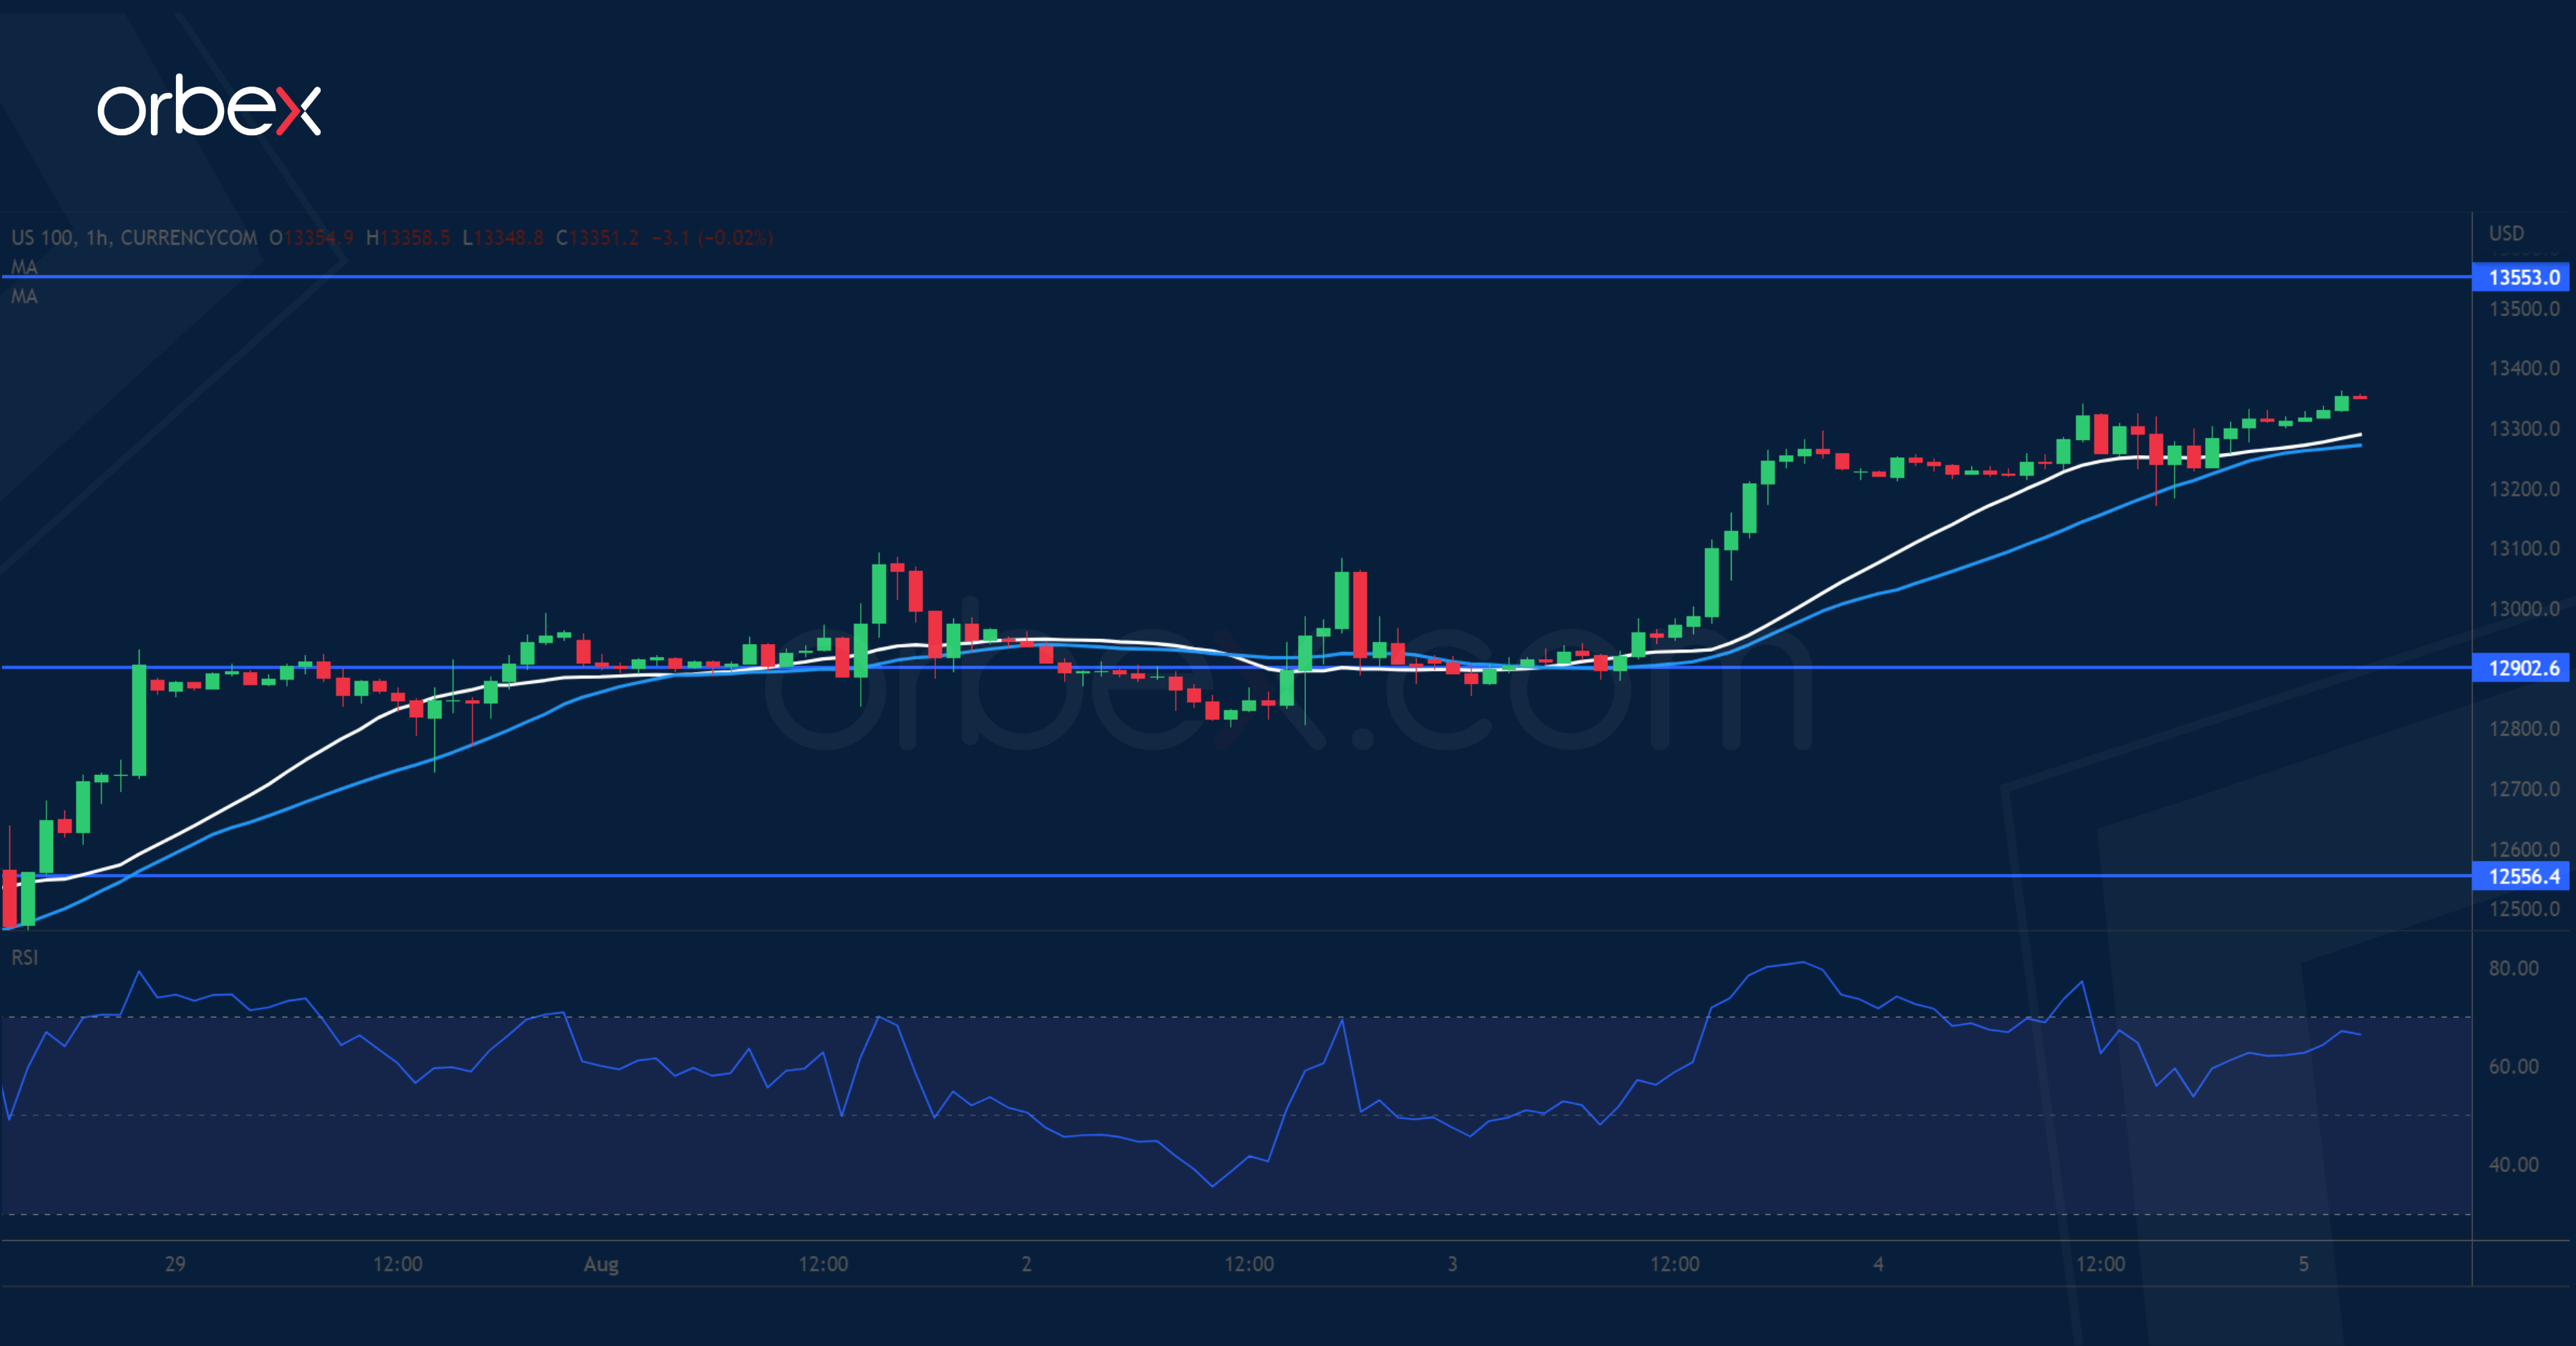
The Nasdaq 100 rallies supported by growing risk appetite. A rally above 12900 has put the index back on track after short-term selling interests cut their losses. Last May’s high at 13550 is a key resistance ahead. Its breach could turn bearish sentiment around in the medium-term and lay the foundation for a sustained recovery. The RSI’s overbought condition may temporarily limit the upside range. The former supply zone (12900) has become a fresh support where the bulls may look to accumulate in case of a pullback.
USD/CHF Attempts to Rebound
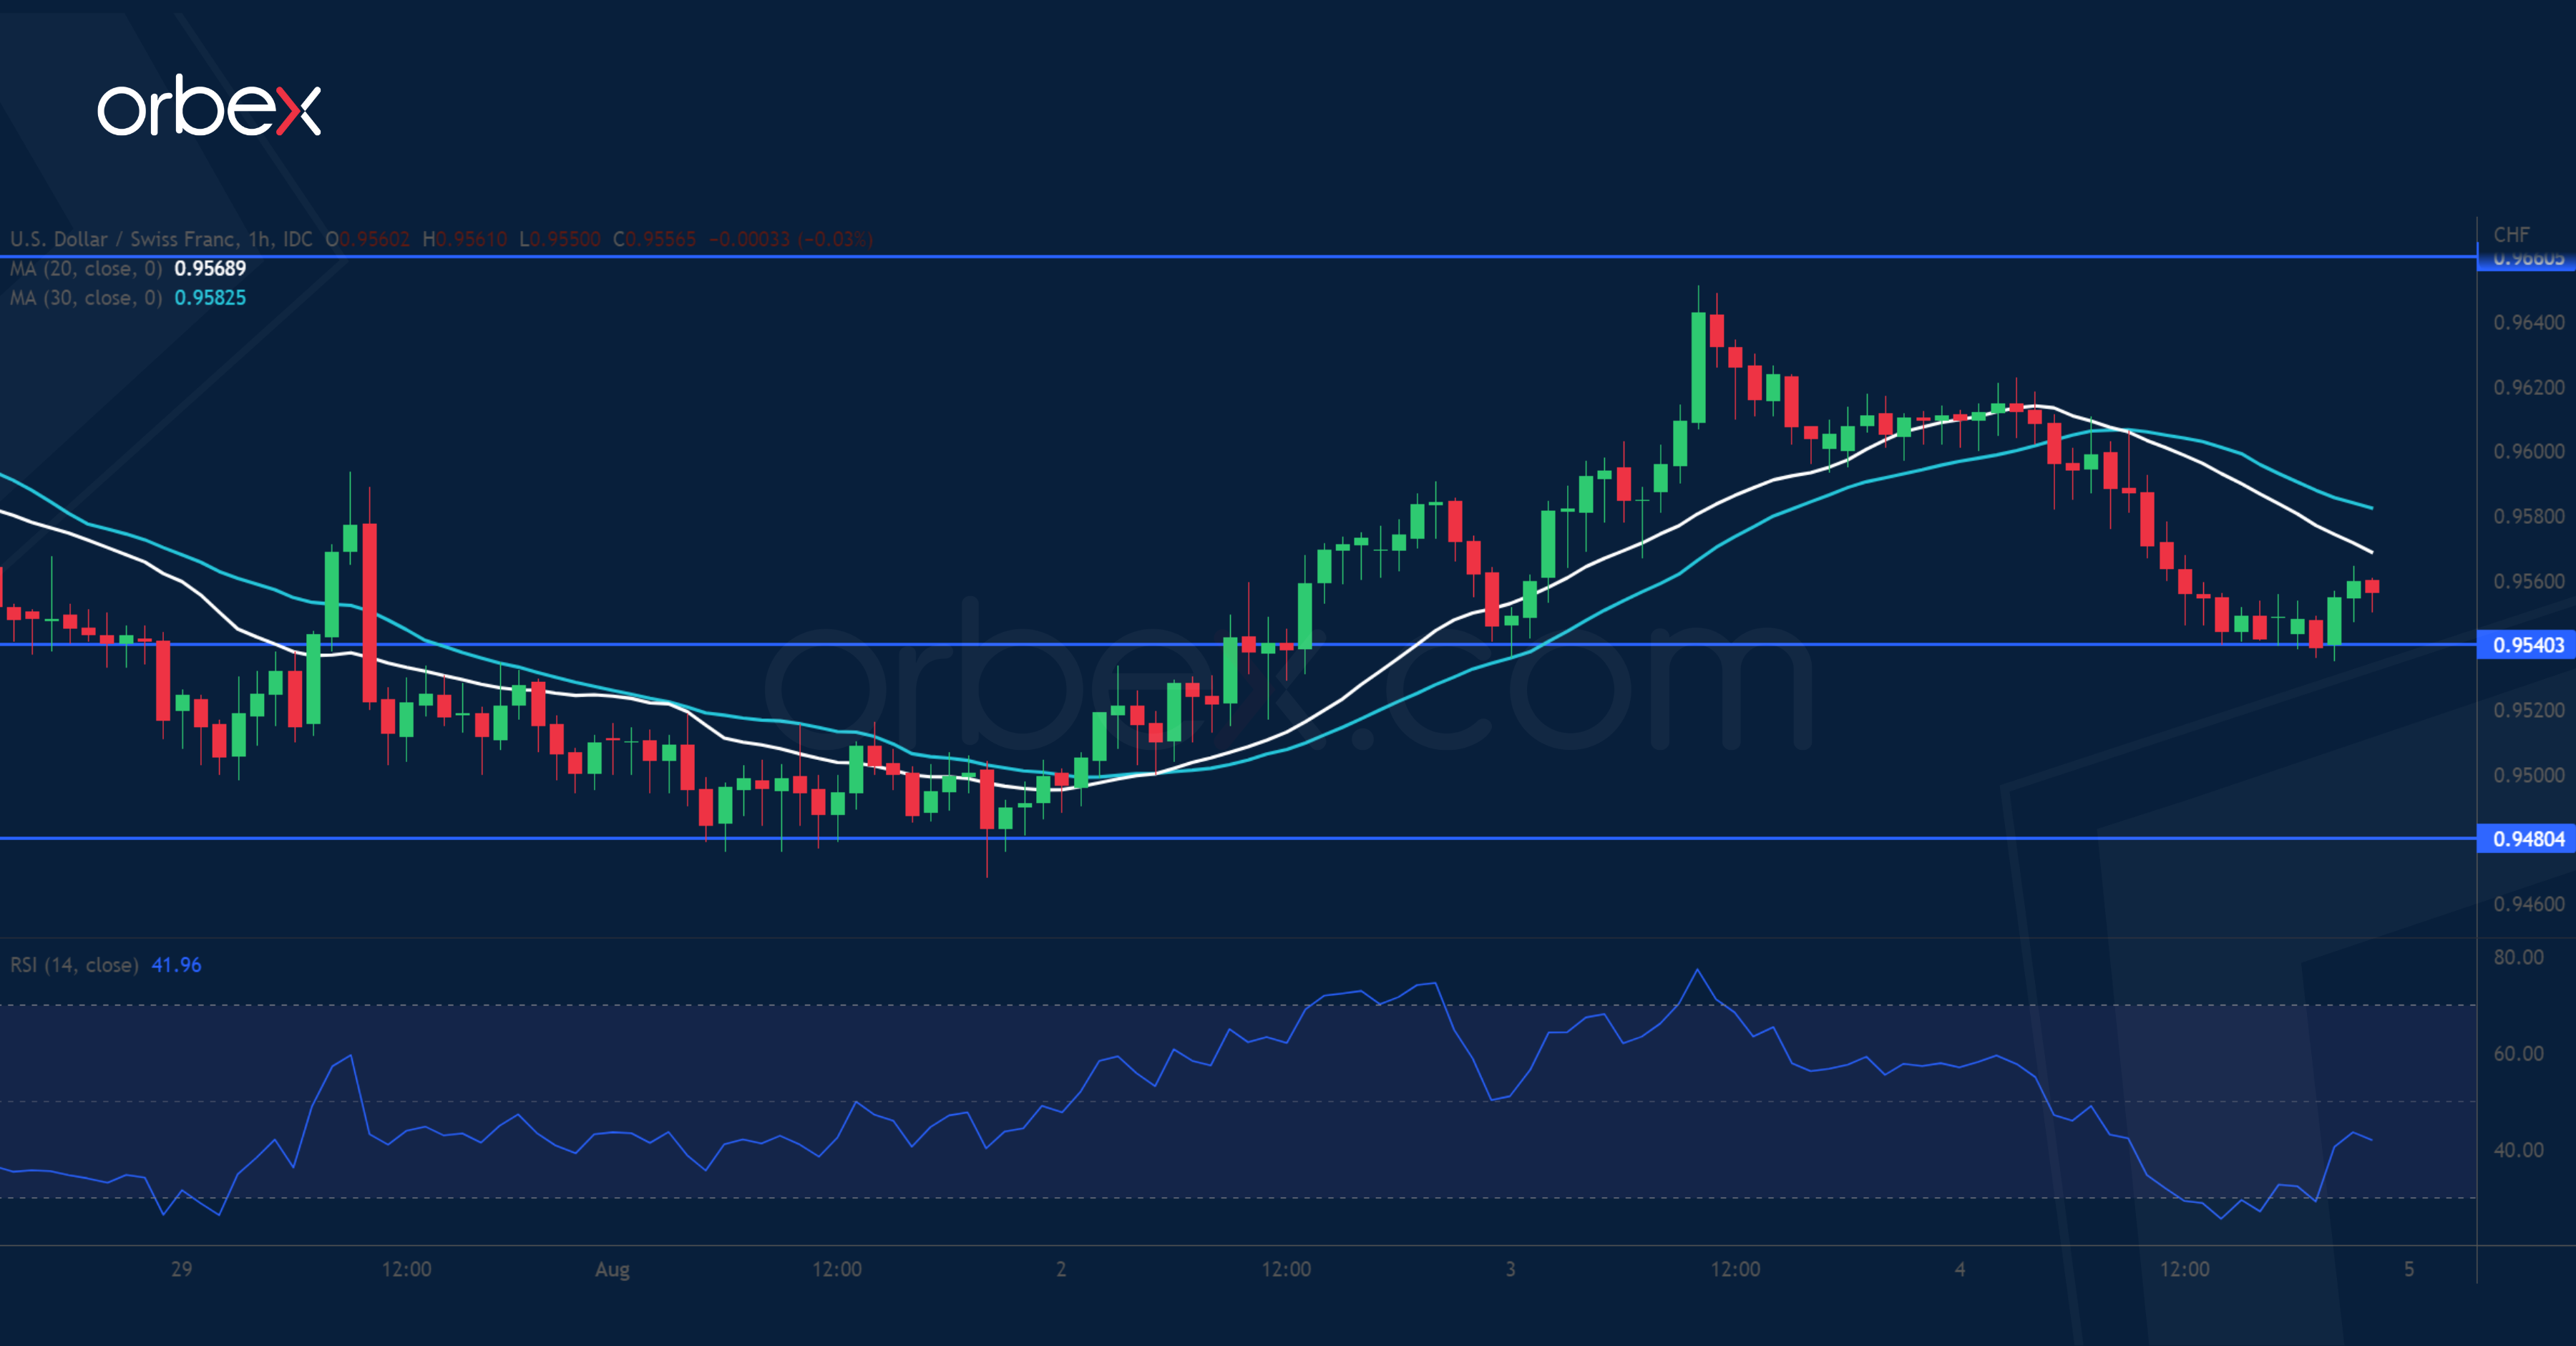
The US dollar softens as traders take profit ahead of July’s job data. On the daily chart, the pair is seeking support in a pennant consolidation and it would be too soon to call a bearish reversal. The recent rally above 0.9590 prompted some sellers to cover their positions, leaving the door open for a potential rebound. 0.9660 is the closest hurdle and its break could raise offers to 0.9790. 0.9540 is a fresh support and a breakout would bring the buck back to 0.9480 where it could be vulnerable to another sell-off.
GBP/USD Consolidates
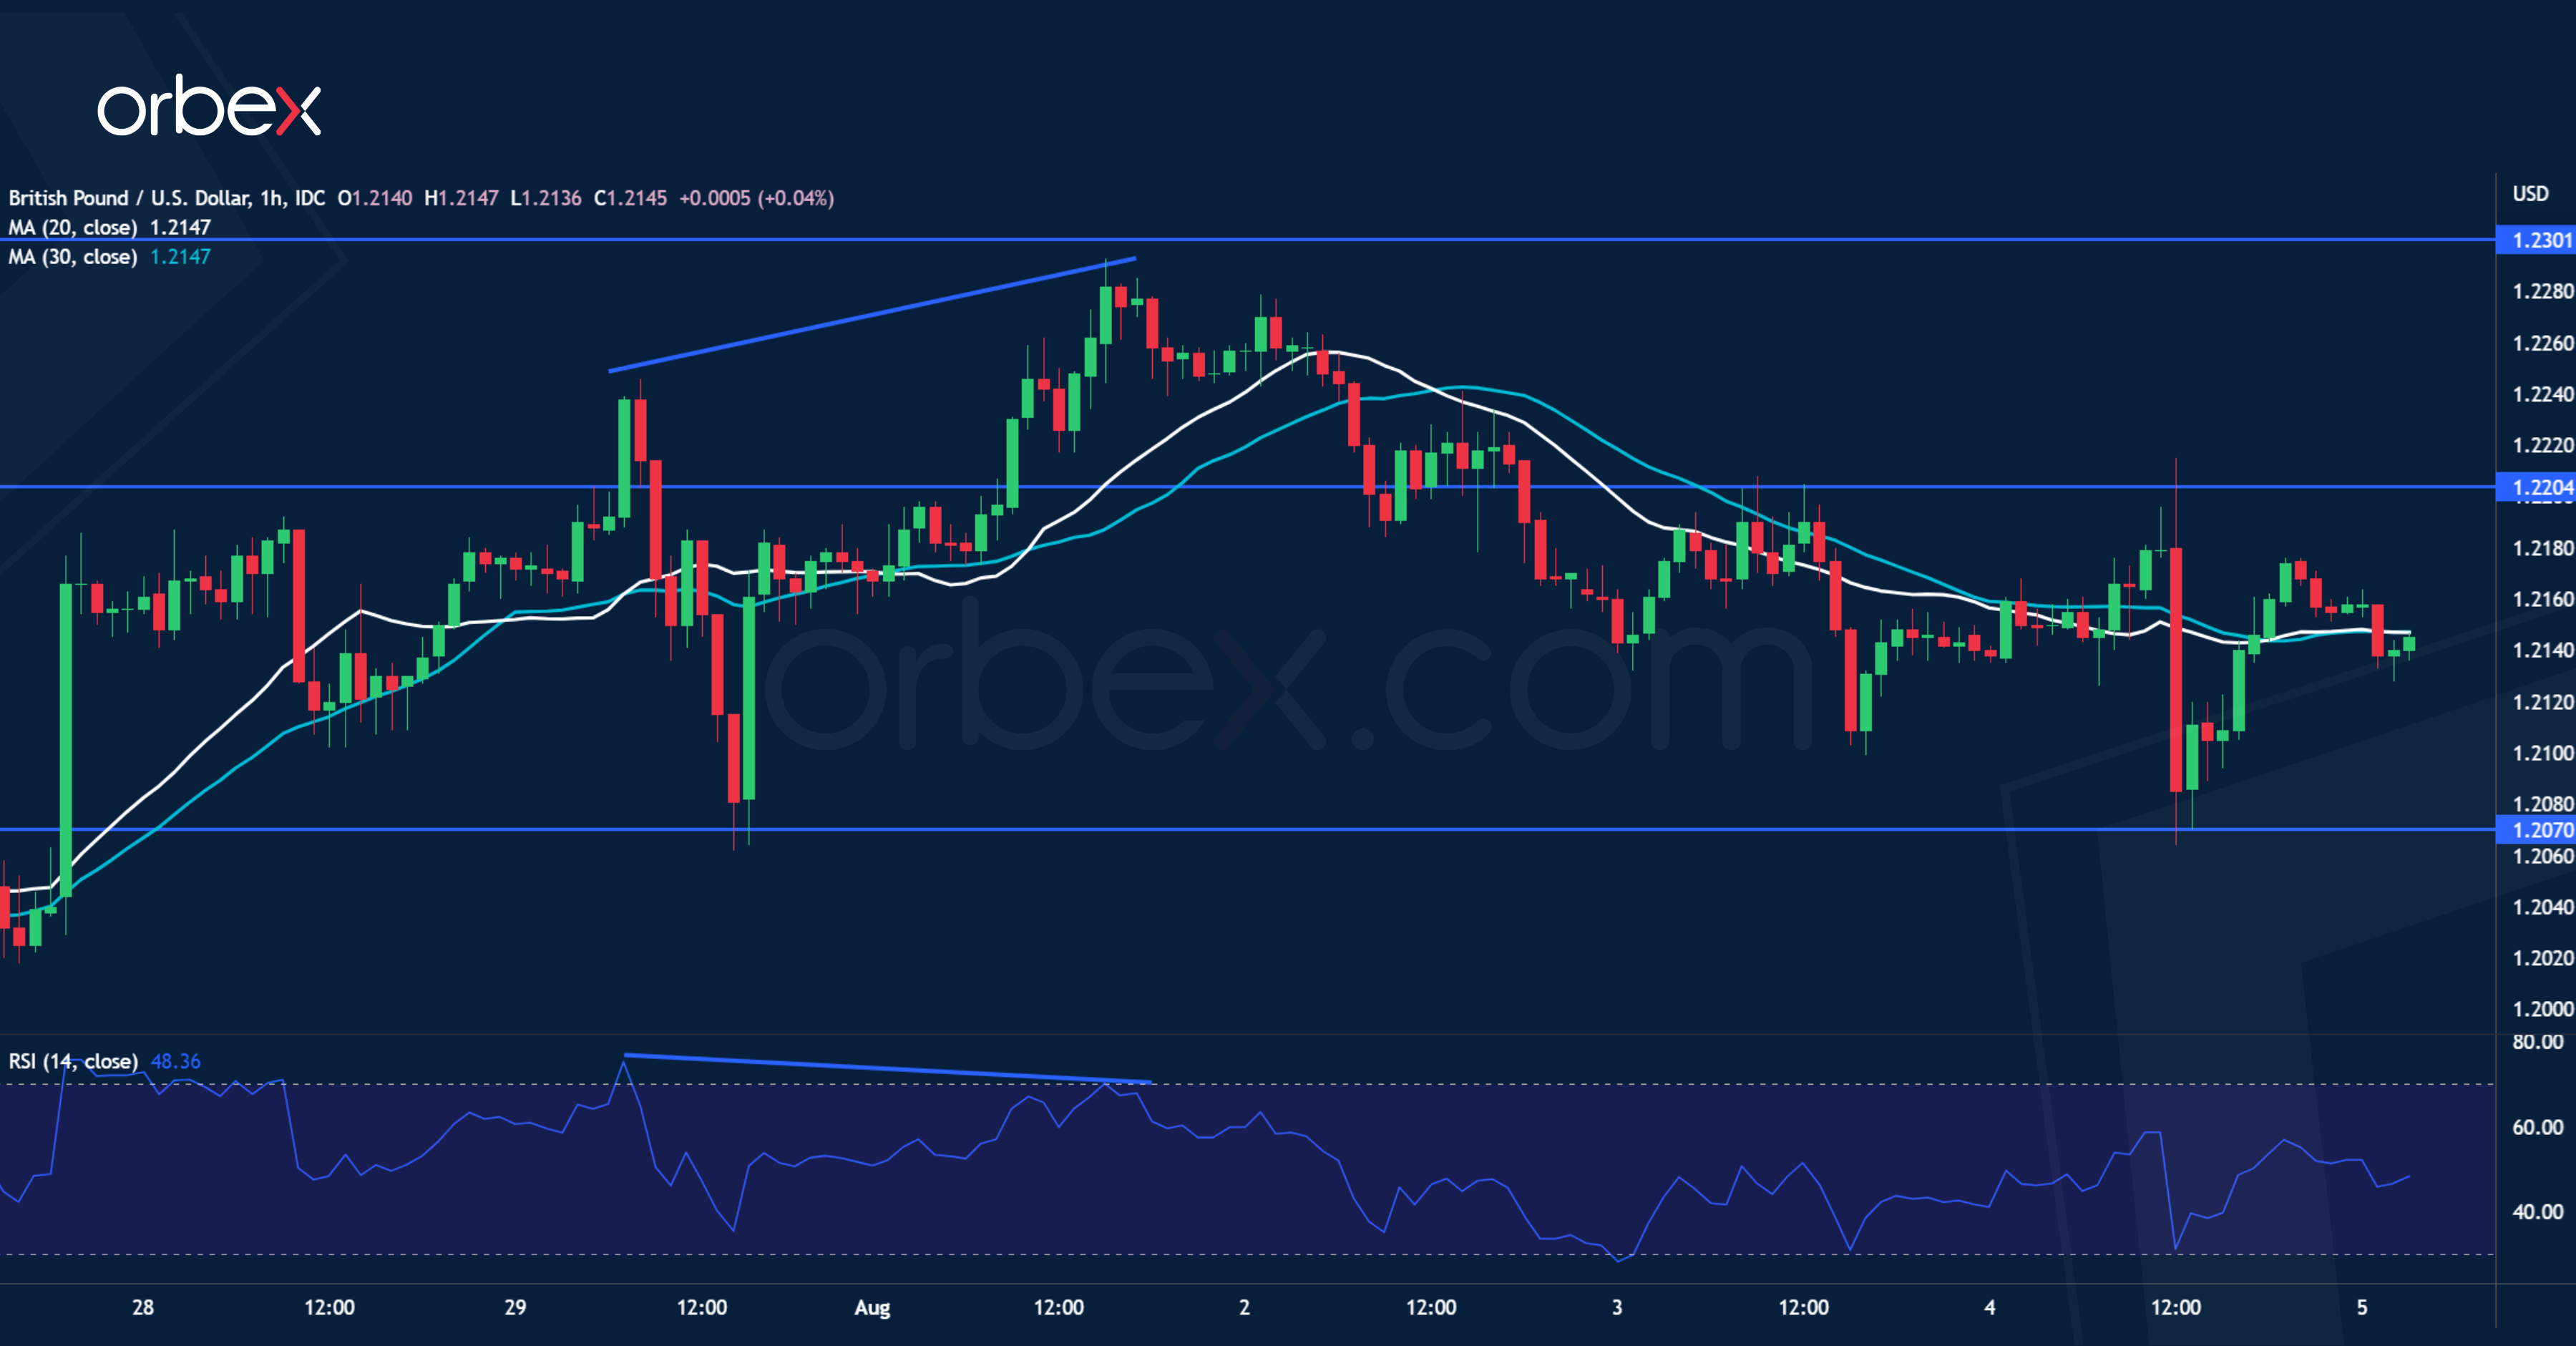
The pound treads water as the BoE warns of a recession after raising rates by 50 bps. The rebound came to a halt at 1.2300, a major resistance from the daily chart. A bearish RSI divergence already showed a slowdown in the rally. A follow-up break under 1.2150 has further weighed on short-term optimism. 1.2070 is buyers’ stronghold and its breakout could trigger a liquidation towards 1.1900. 1.2200 is the closest resistance and the bulls will need to clear 1.2300 before they could hope for the rally to resume.