Sample Category Title
USD/CHF Daily Outlook
Daily Pivots: (S1) 0.9619; (P) 0.9640; (R1) 0.9667; More...
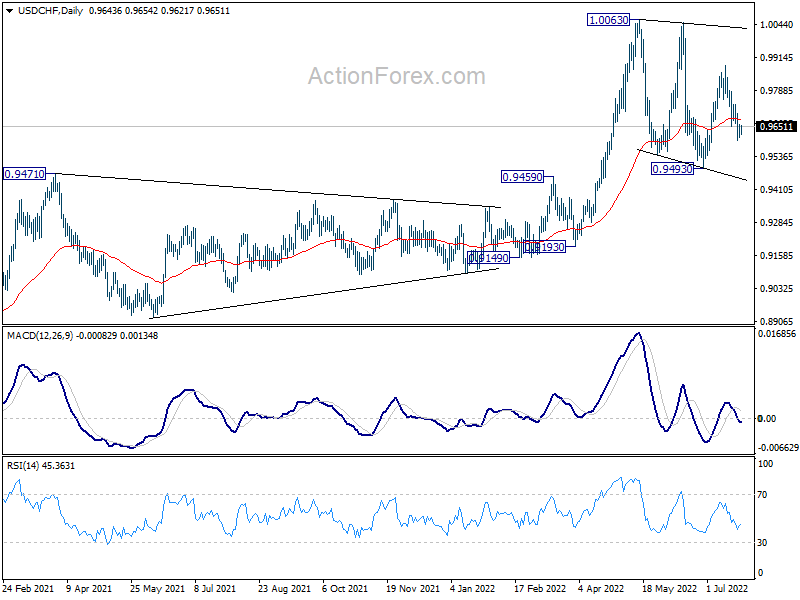
USD/CHF is losing some downside momentum. But further decline is in favor with 0.9738 minor resistance intact. Fall from 0.9884 is seen as a falling leg of the consolidation from 1.0063. Deeper decline would be seen to 0.9493 support. On the upside, though, above 0.9738 minor resistance will turn bias back to the upside for 0.9884 resistance.
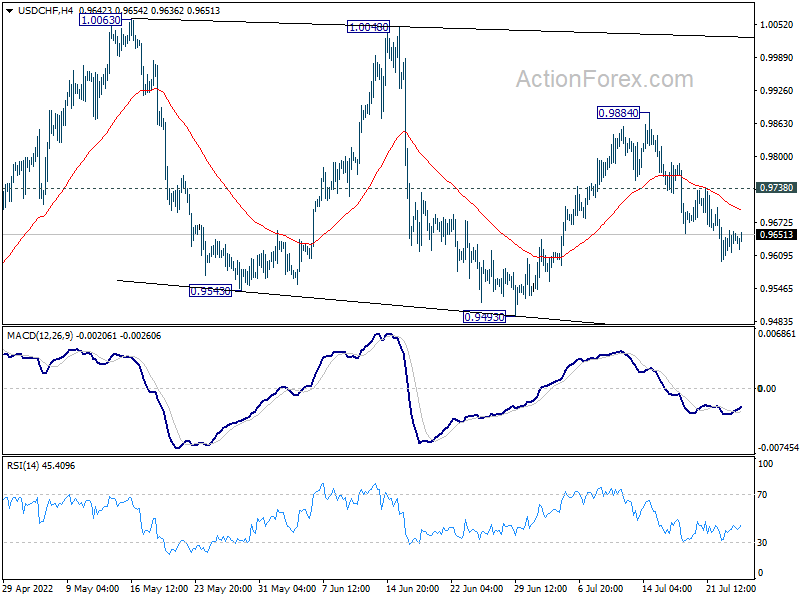
In the bigger picture, medium term up trend from 0.8756 (2021 low) is still in progress. On resumption, next target is 1.0342 (2016 high). Sustained break there will resume long term up trend from 0.7065 (2011 low). This will remain the favored case as long as 0.9471 resistance turned support holds.
USD/JPY Daily Outlook
Daily Pivots: (S1) 136.10; (P) 136.45; (R1) 137.00; More...
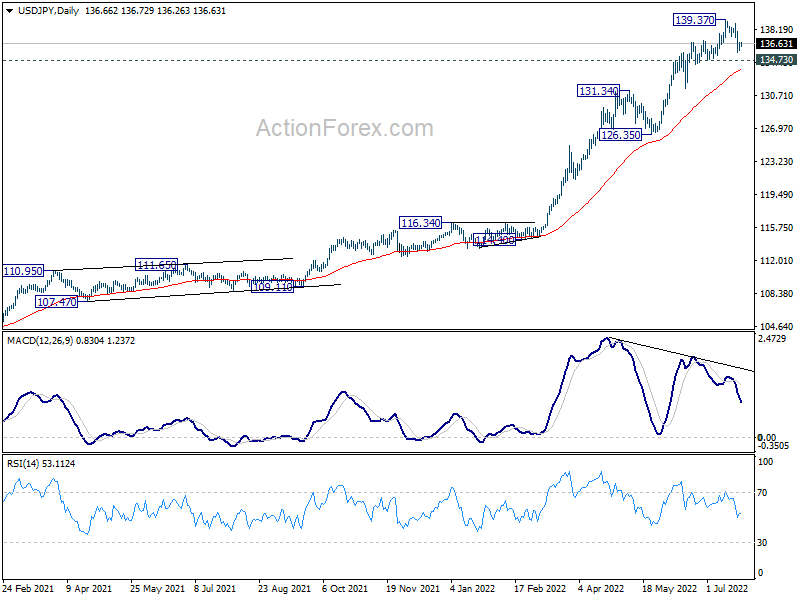
Outlook in USD/JPY remains unchanged and intraday bias stays neutral. On the downside, firm break of 134.73 will confirm short term topping, on bearish divergence condition in 4 hour and daily MACD. Deeper fall would be seen through 55 day EMA to 126.35/131.34 support zone. On the upside, break of 139.37 will resume larger up trend.
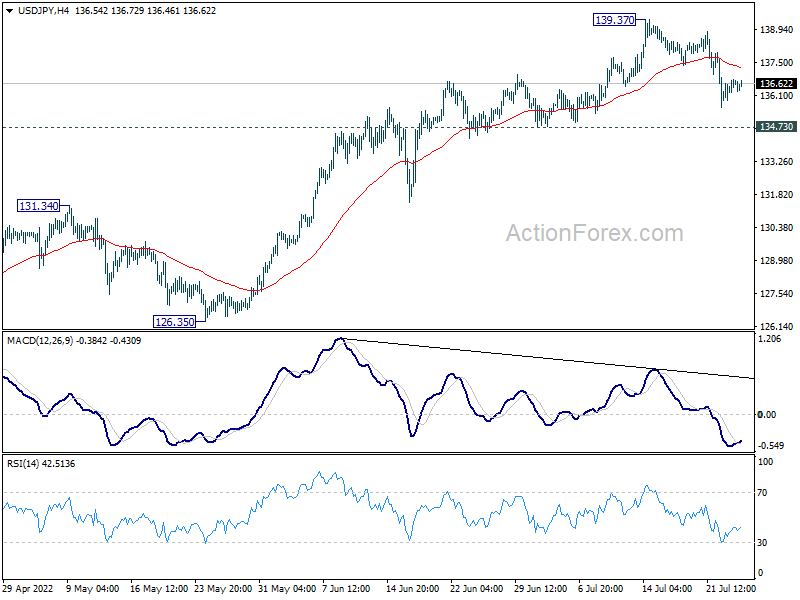
In the bigger picture, current rally is seen as part of the long term up trend from 75.56 (2011 low). Next target is 100% projection of 75.56 (2011 low) to 125.85 (2015 high) from 98.97 at 149.26, which is close to 147.68 (1998 high). This will remain the favored case as long as 126.35 support holds.
USD/CAD Daily Outlook
Daily Pivots: (S1) 1.2806; (P) 1.2876; (R1) 1.2918; More...
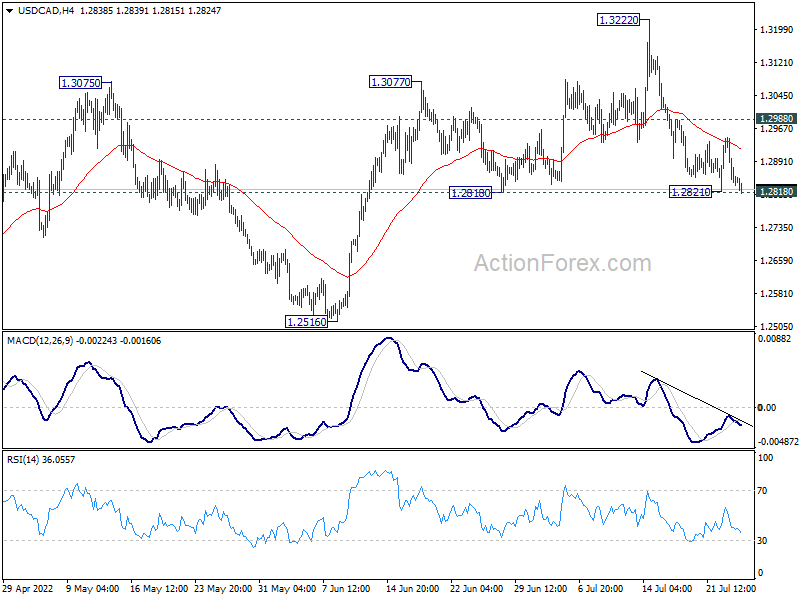
Intraday bias in USD/CAD remains neutral with focus on 1.2818/21 support zone. On the downside, break of 1.2818 support will bring deeper fall back to 1.2516 key support. On the upside, above 1.2988 minor resistance will reinforce near term bullishness, and turn bias back to the upside for retesting 1.3222 instead.
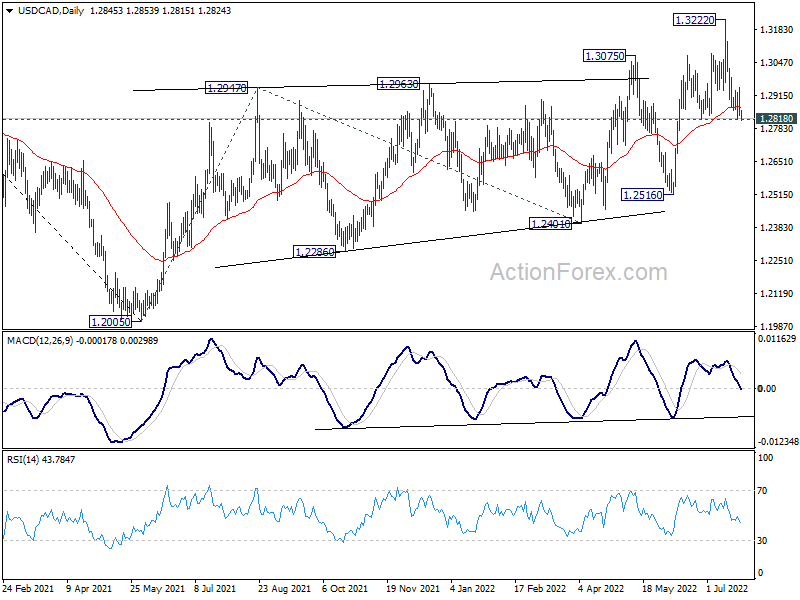
In the bigger picture, down trend from 1.4667 (2020 high) should have completed at 1.2005, after defending 1.2061 long term cluster support. Rise from there should target 61.8% retracement of 1.4667 to 1.2005 (2021 low) at 1.3650. This will remain the favored case now as long as 1.2516 support holds.
GBPUSD Turns Bullish in Short Term after Dramatic Slump
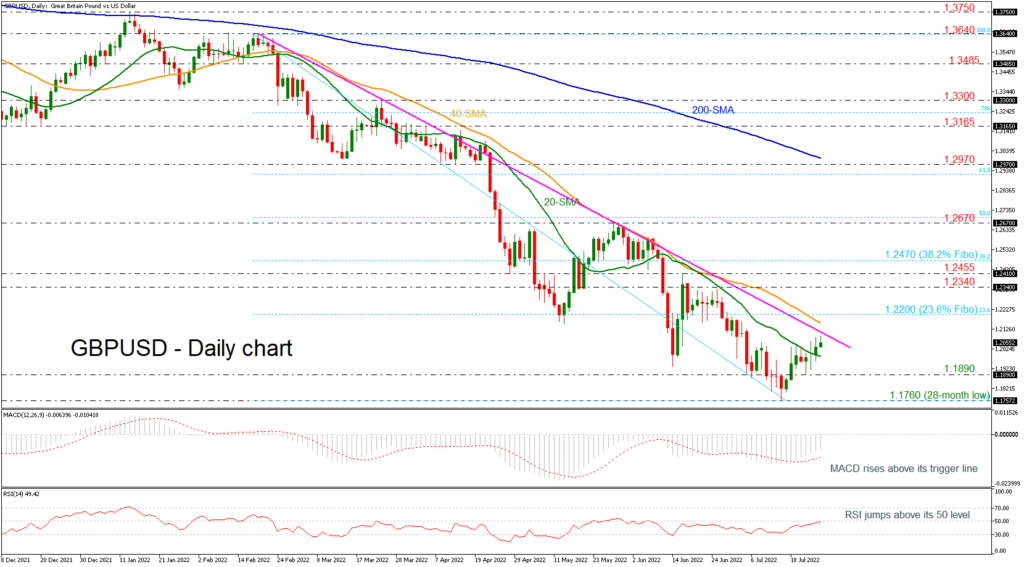
GBPUSD has reversed back up after finding strong support at the 28-month low of 1.1760. The pair is advancing above the 20-day simple moving average (SMA) and the next obstacle to surpass is the medium-term descending trend line.
The momentum indicators are pointing to a positive bias in the short term with the RSI just above 50 and the MACD is holding above its trigger line in the negative region.
A move to the upside could see immediate resistance at the 40-day SMA at 1.2150 but should the market increase positive momentum above this area, the 23.6% Fibonacci retracement level of the down leg from 1.3640 to 1.1760 at 1.2200 could be the next level in focus. A stronger area, though, could be found at the 1.2340-1.2455 since any violation of this point could increase chances for further gains probably towards the 38.2% Fibonacci of 1.2470.
In the wake of negative pressures, the market could meet immediate support at the 20-day SMA at 1.1990 before it heads lower to the 1.1890 support. A successful close below this level could see a retest of the previous low of 1.1760, while in case of steeper declines, the pair could breach this trough, diving to the 1.1410 barrier, registered in March 2020.
In the medium-term, the outlook remains negative since prices hold below the falling trend line; however, in the short-term timeframe, the market is positive.
Dollar Index: There is a High Probability that the Index Will Rise to the Previous Maximum
The structure of the DXY index hints at the development of a large triple zigzag w-x-y-x-z of the cycle degree.
Most likely, a cycle actionary wave z is currently under construction. The internal structure of the wave z suggests a triple zigzag Ⓦ-Ⓧ-Ⓨ-Ⓧ-Ⓩ. Perhaps the first four parts of the triple zigzag are fully completed, and the primary wave Ⓩ is still developing. It may take the form of a double zigzag (W)-(X)-(Y) of the intermediate degree.
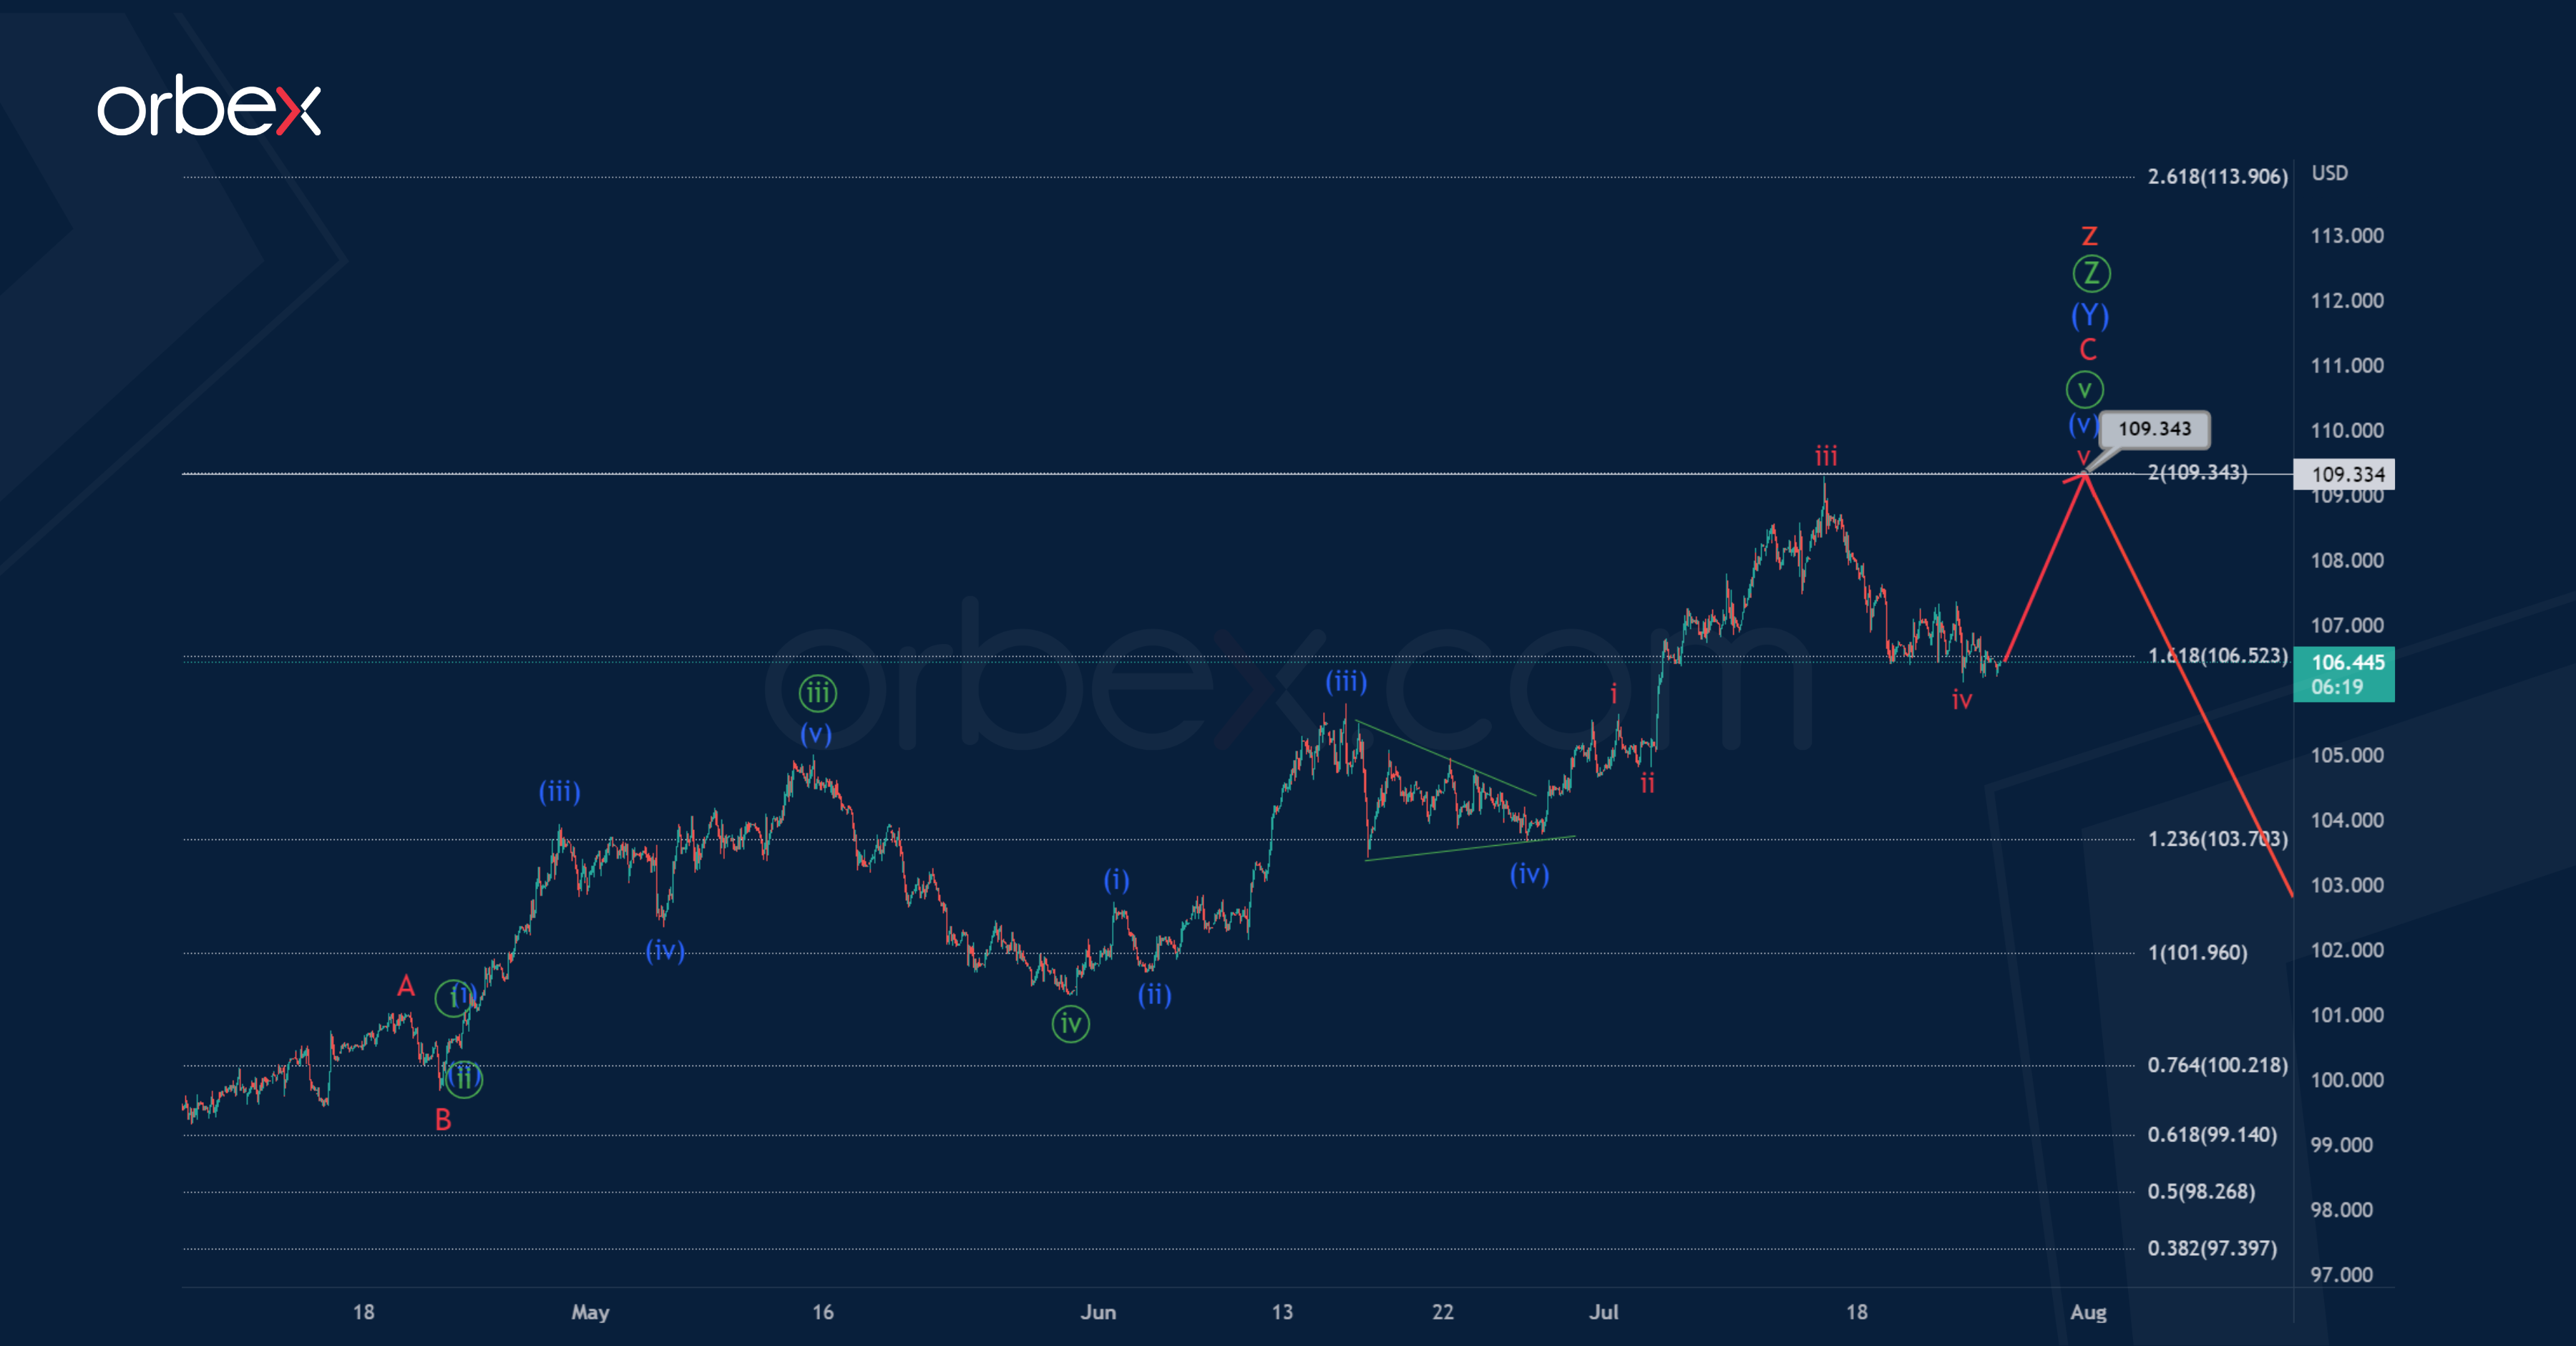
Bulls can push the price up again to the maximum of 109.34, marked by impulse iii. The goal is determined using the Fibonacci extension tool. At that level, wave z will be at 161.8% of the previous actionary wave y.
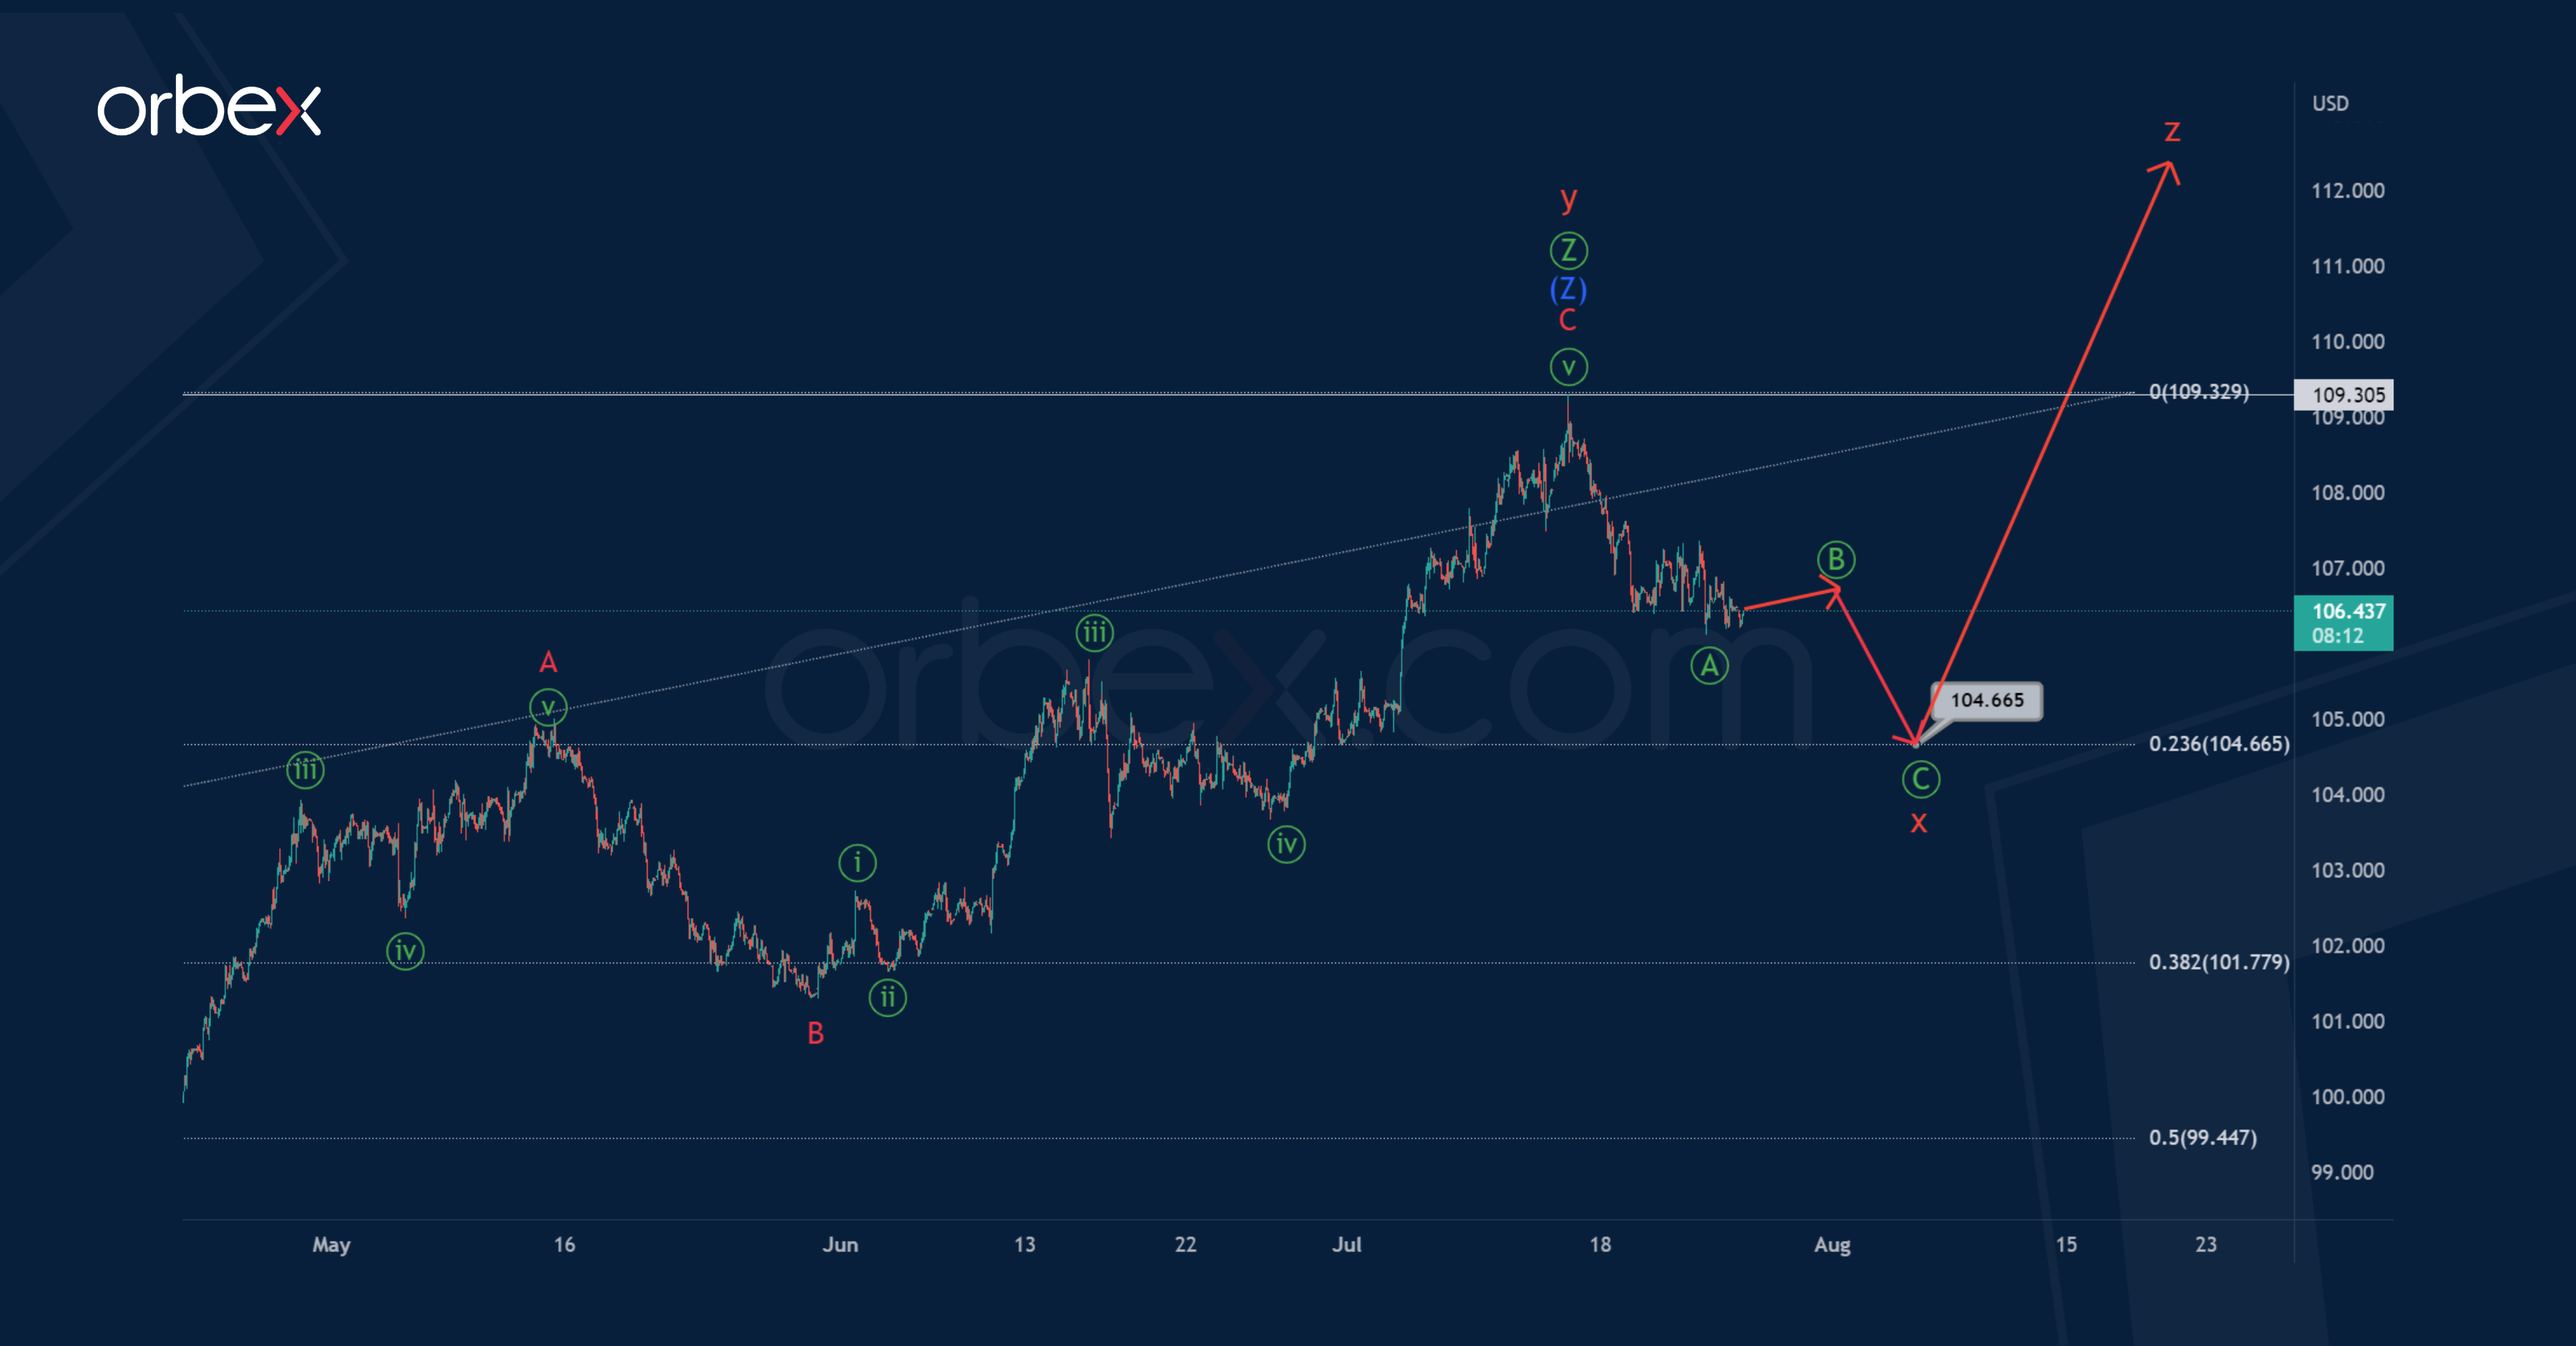
In an alternative scenario, the cycle actionary wave y was longer, and at the time of writing, it had come to its end. The wave y has the form of a primary triple zigzag.
Thus, if this option is confirmed, in the near future the market will move in a downward direction, building a cycle intervening wave x. The intervening wave x is similar to the primary zigzag Ⓐ-Ⓑ-Ⓒ.
It is possible that the price will fall to 104.66, as shown on the chart. At that level, wave x will be at 23.6% along the Fibonacci lines of wave y.
Bitcoin’s Normal Sluggishness
Bitcoin has lost 3.5% in 24 hours, having rolled back to $21,100 at the time of writing. Meanwhile, Ethereum has lost 6.1% in the same time frame, to $1430. Altcoins in the top 10 have fallen from 3.5% (XRP) to 6.8% (Solana).
Total crypto market capitalisation, according to CoinMarketCap, fell 3.7% to $971bn overnight.
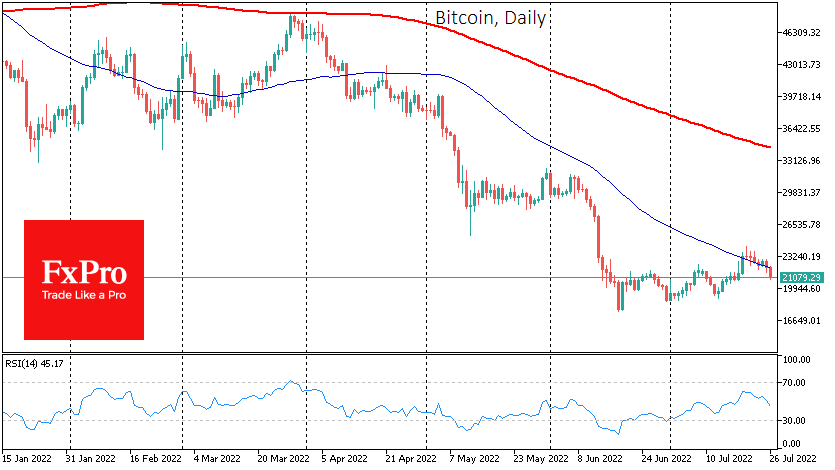
Bitcoin continued its corrective decline near its 50-day average on Monday but began to pull away from it on Tuesday morning. Without support from stock indices, the cryptocurrency market is buckling under its weight with no meaningful growth drivers.
This situation is fuelling expectations of a prolonged lull, which fits into historical patterns. The history of previous cryptocurrency cycles teaches us that buyers may be slow to buy even after a bottom is reached, as a sustained rally should be expected about a year after the previous peak. But even then, the last, brightest episode of FOMO-based growth will have to wait another year. The history of cryptocurrencies is still too short to count on any trends. However, a prolonged pause in hype names after a massive sell-off is also a familiar phenomenon in equities, though without specifying a period.
According to Glassnode, around 80% of bitcoins are already concentrated in the long-term holders’ hands, indicating the ‘bottom’ is near.
Retail investors have rushed to buy up cryptocurrency stocks. In 10 days, capital inflows into crypto stocks totalled nearly $1 billion, according to VandaTrack.
A class action lawsuit was filed in the US against Celsius Network, which filed for bankruptcy on 14 July. The crypto lending platform is accused of violating the Securities Act by selling unregistered securities.
The developers of Shiba Inu are preparing to issue a Visa-backed card to accelerate the burning of SHIB, thereby boosting the price.
Daily Technical Analysis
EUR/USD
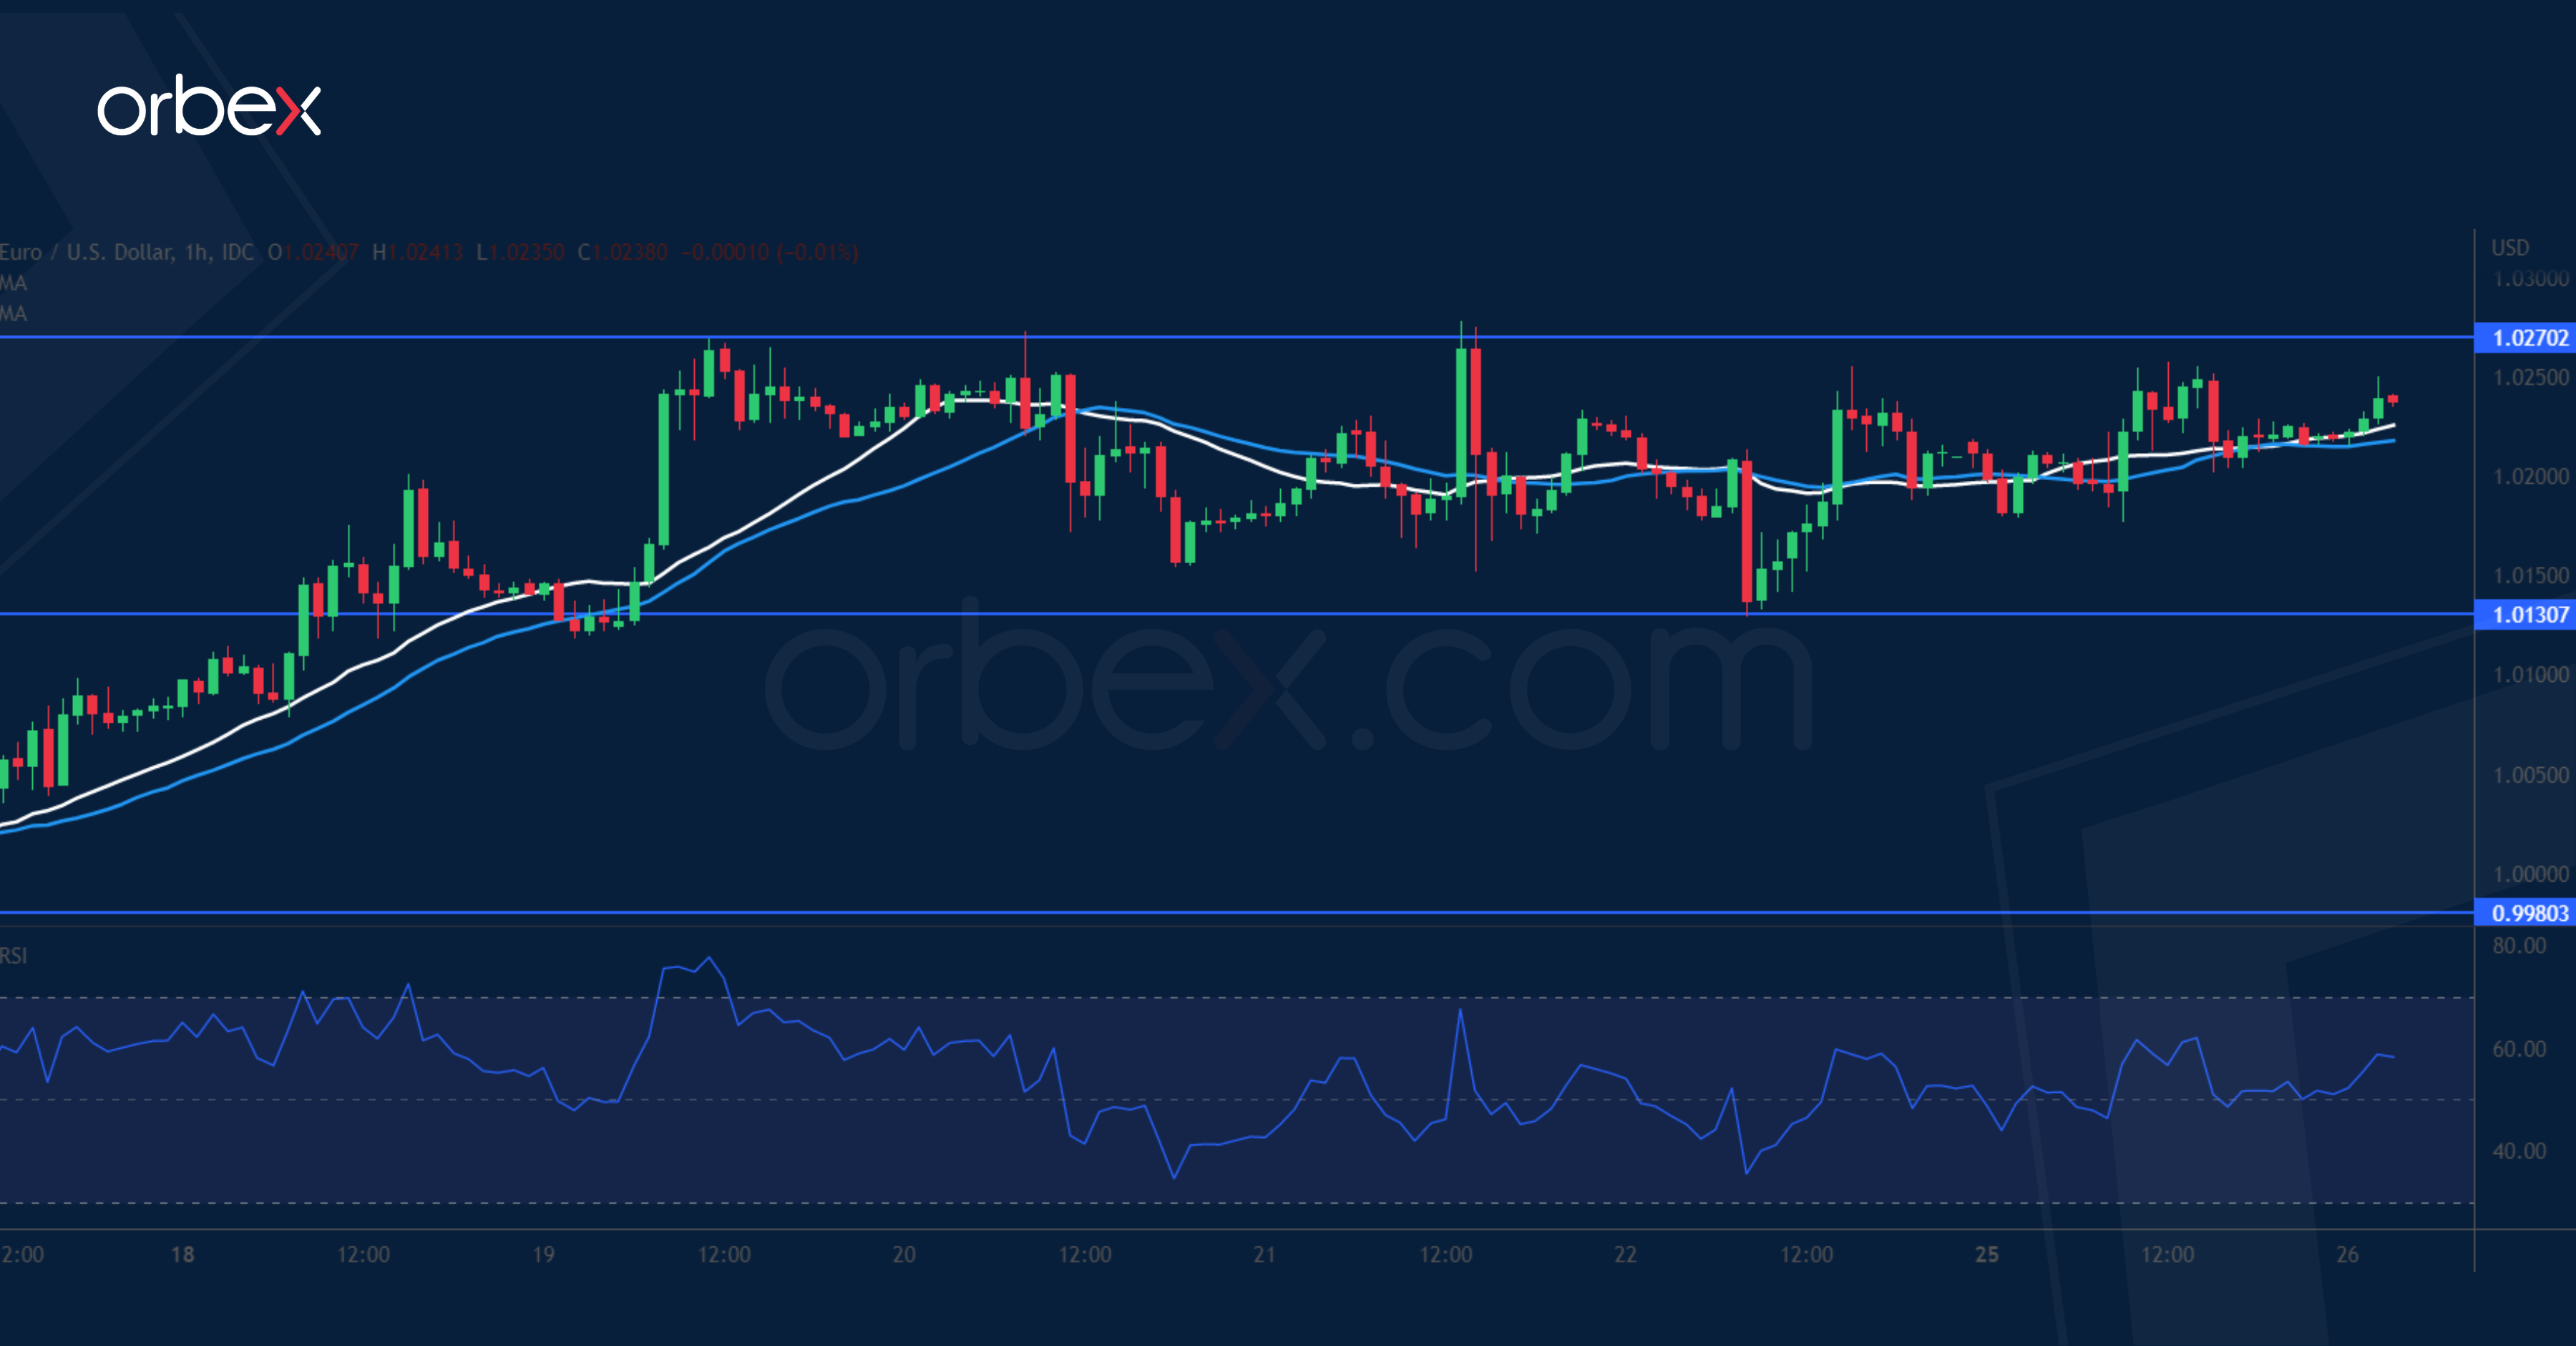
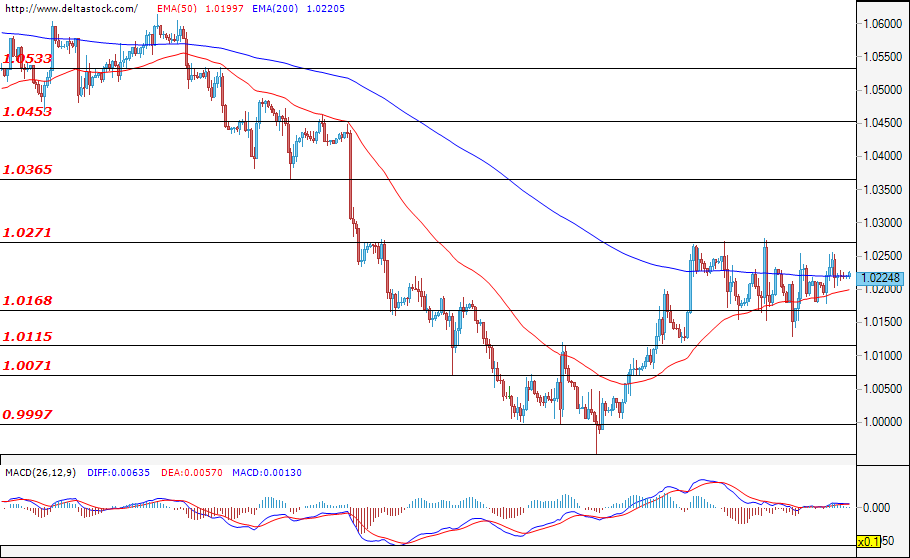
The pair still cannot break through the range 1.0170 – 1.0270 and the market is likely to remain in "standby" mode, as investors are cautious and expect the announcement of the Fed interest rate decision on Wednesday at 21:00 GMT. The level at 1.0270 seems to be a strong resistance for the bulls and the expectations are for the bears to try to take control over the market and attack the critical support at 1.0170, where a successful breach may be considered as a signal for a resumption of the downtrend. In this scenario, the sell-offs may deepen and the pair would most probably head towards the support at 1.0115. However, if the bulls prevail and manage to overcome the critical resistance at 1.0270, their next target would be the resistance at 1.0365.
USD/JPY
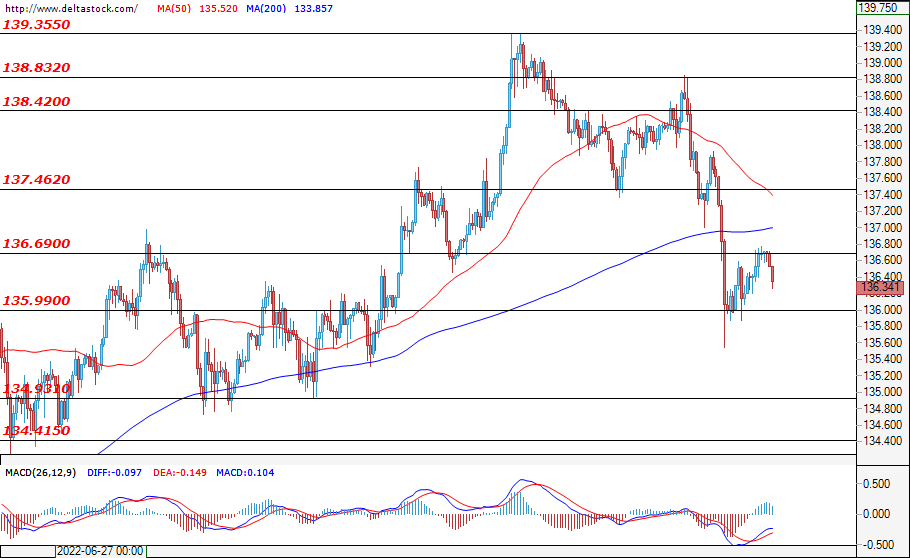
The pair bounced back from the resistance at 136.70 as the bulls could not gain enough momentum to violate this zone and to lead the pair towards the next resistance at 137.46. The forecasts for today’s trading session are for USD/JPY to continue its downward movement towards the support at 135.90 where a confirmed breach could easily deepen the decline and lead to a sell-off towards the support zone at 134.93.
GBP/USD
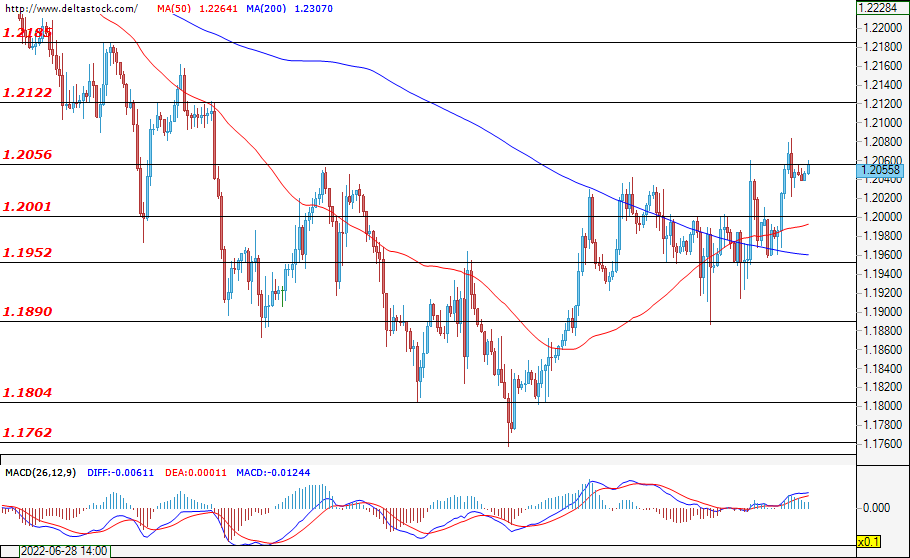
At the time of writing this analysis, the bulls are trying to break through the resistance at 1.2060 and a confirmed breach of this level would most probably lead the pair towards the next key resistance at 1.2120. In case the bears manage to keep the pair below the mentioned resistance, we may expect a downward movement and a test of the psychological level at 1.2000, where a successful breach would easily lead the pair towards the support at 1.1950.
EUGERMANY40
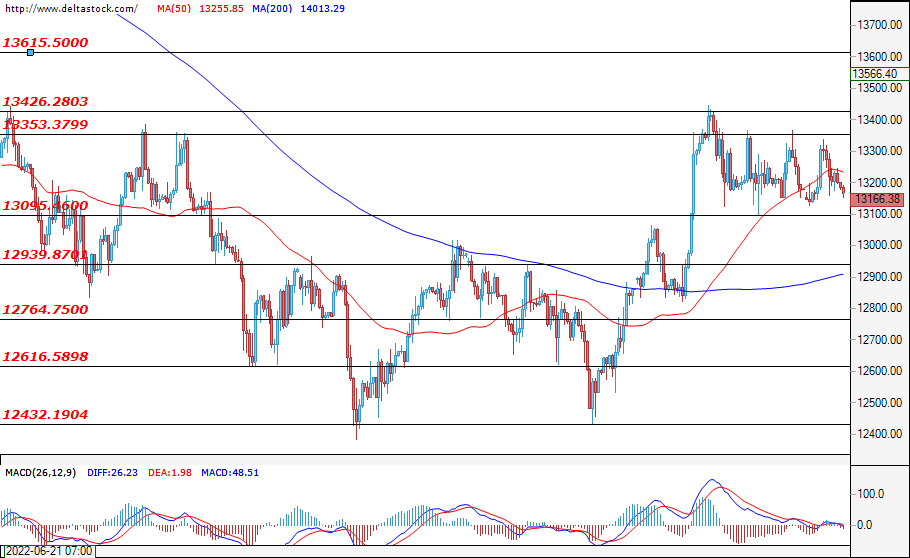
Neither the bears nor the bulls managed to gain enough momentum and lead the German index out of the zone between 13100 and 13350. The price is holding positions around the current level at 13166 and only a successful breach of one of the borders could signal the future direction of the index. A violation from the buyers could continue the recovery and could easily send the EUGERMANY40 towards a test of the zone at 13615. If the bears take control and breach the support at 13095, they could lead the price towards the next target at 12939, a violation of which could strengthen the negative expectations of the market participants.
US30
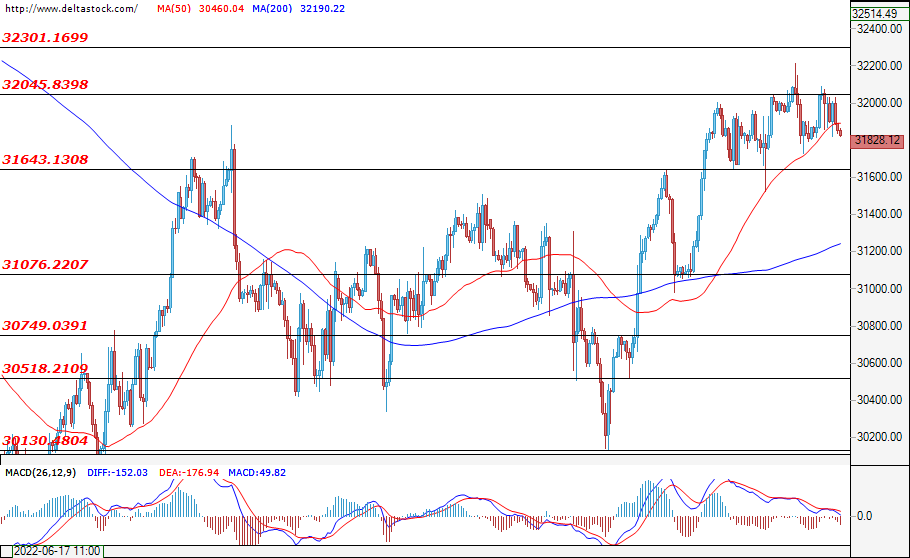
The U.S. blue-chip index is trading in the range with 31643 as support and 32045 as resistance. The bulls are experiencing serious difficulties around this area and the expectations are for the sellers to lead the price towards a test of the lower border of the range. A successful breach of this level would most probably result in sell-offs towards the level at 31076. On the other hand, if the bulls manage to overcome the resistance at 32045, their next target would be the area at around 32300.
DAX 40 Attempts to Rebound
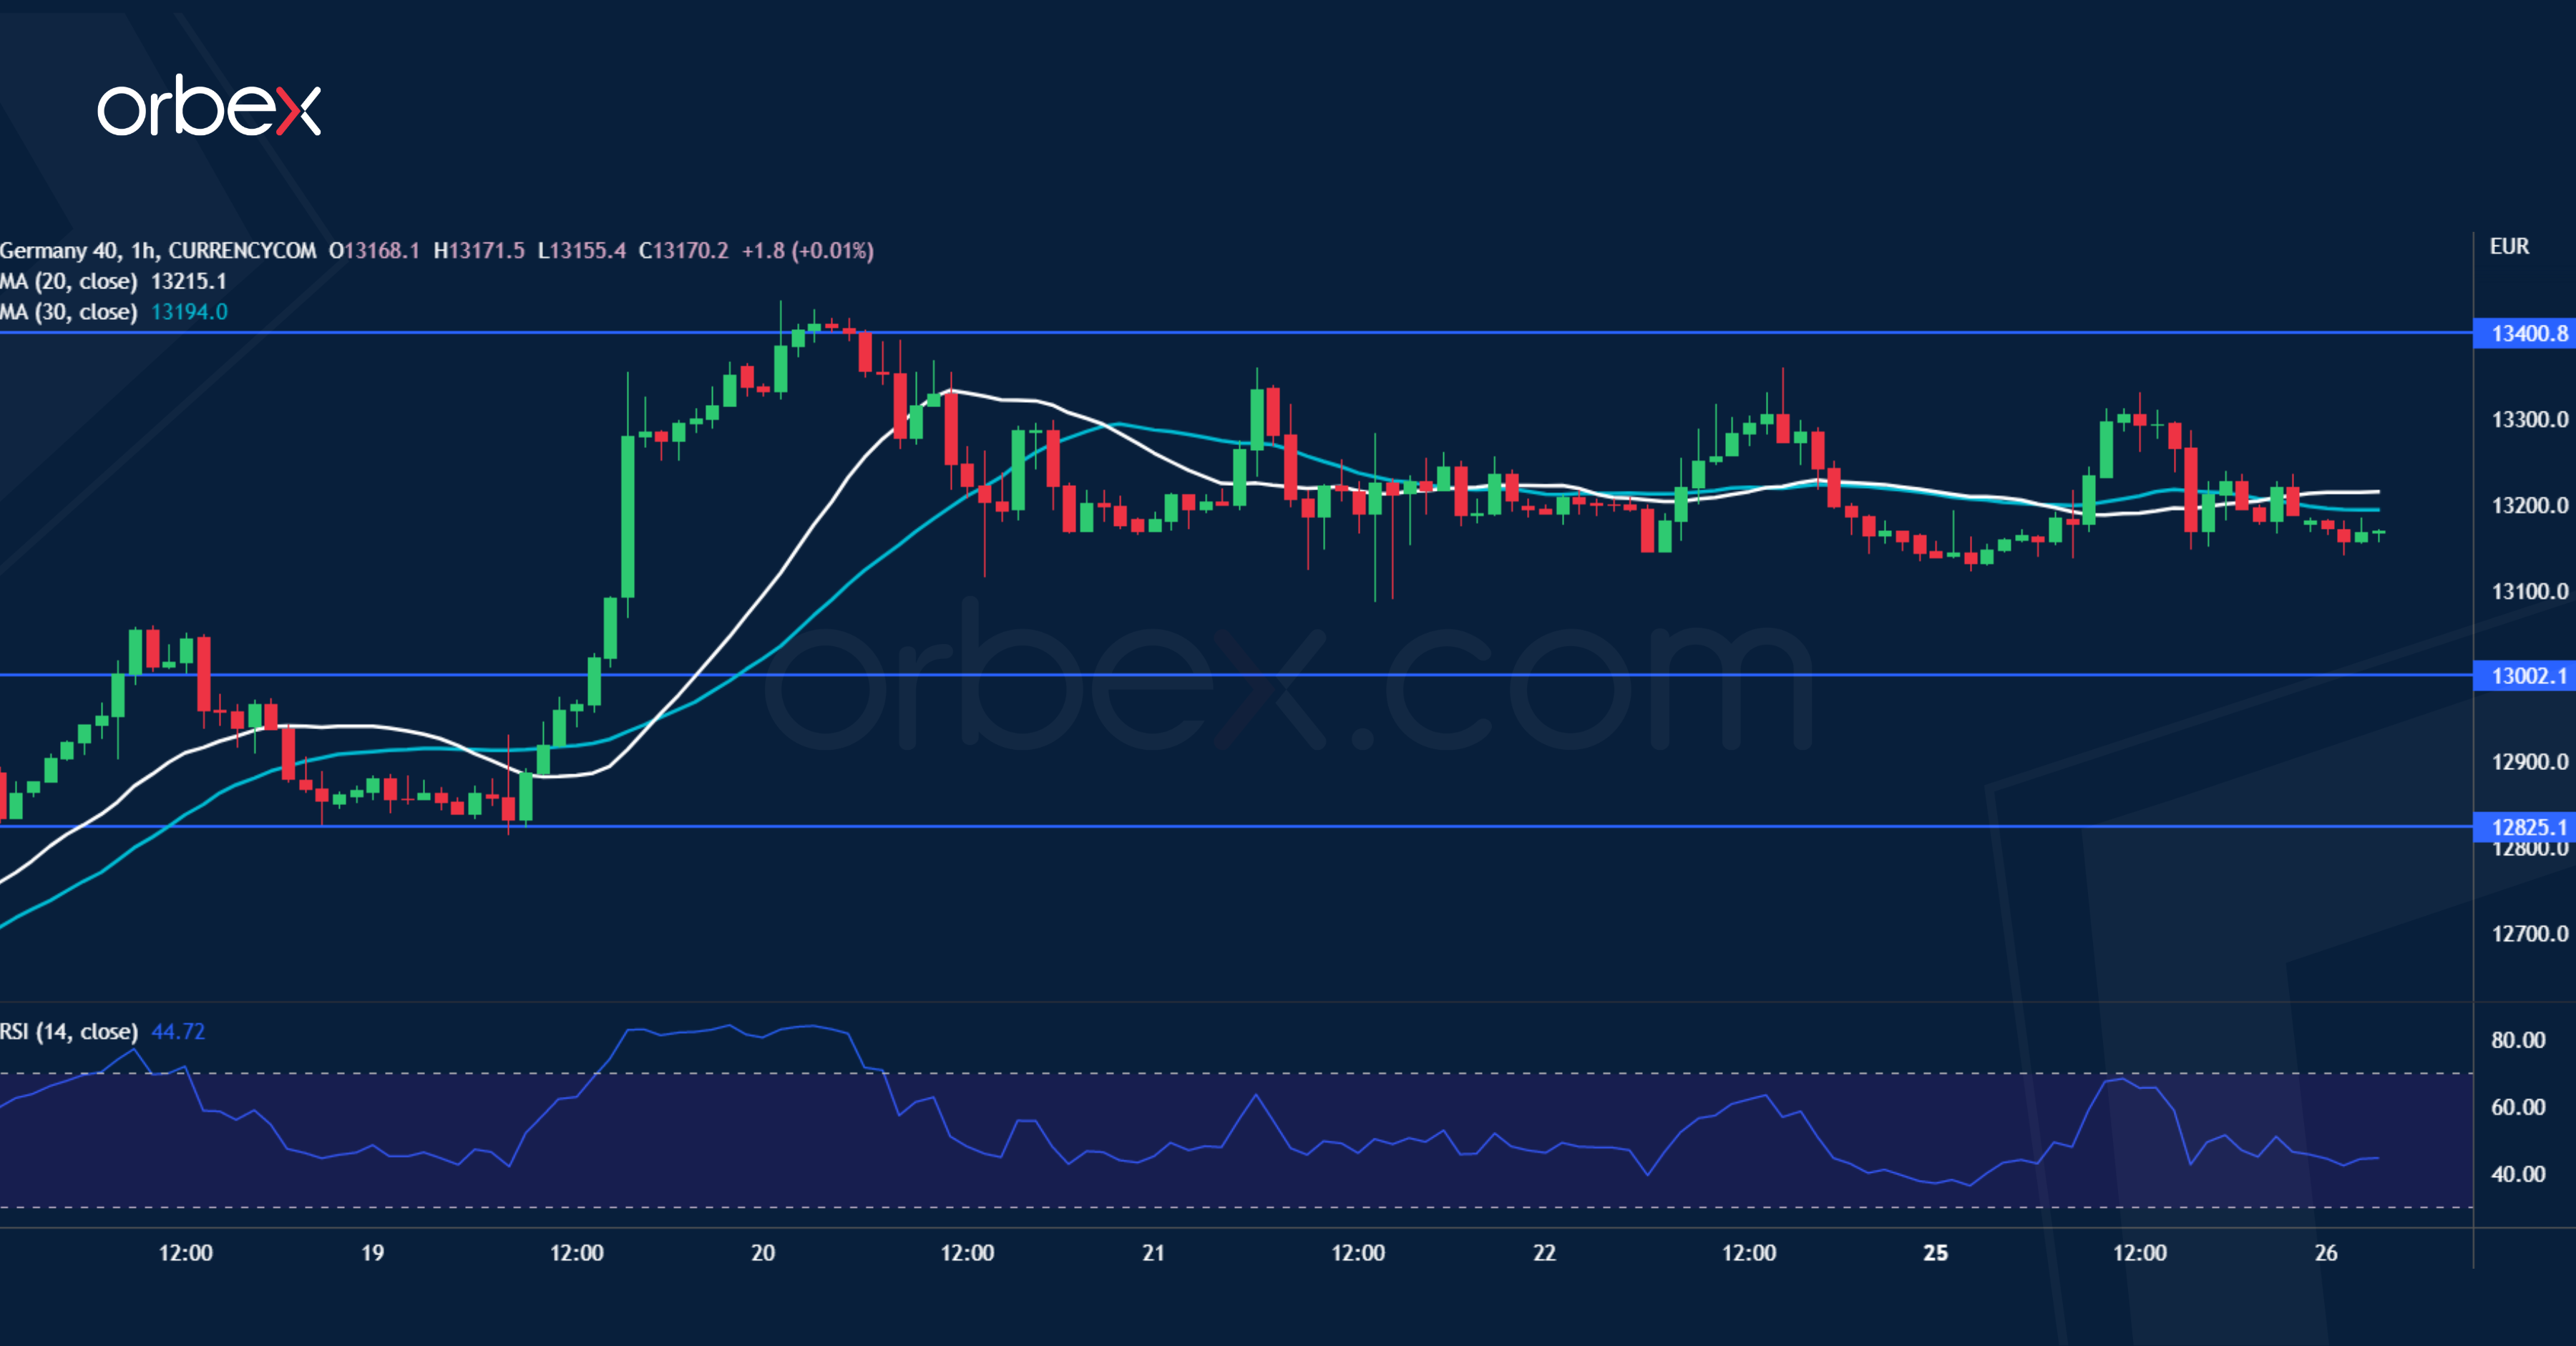
The Dax 40 treads water as business sentiment remains sensitive to energy uncertainty. Optimism grew after the price broke above the supply zone around 13400. The sideways action suggests commitment to keep the rebound intact. A close above 13400 may raise bids to 13650, a key resistance from the mid-June sell-off and the bears’ last stronghold. A bullish breakout could lead to a full-blown recovery as sellers capitulate. On the downside, 13000 is a fresh support and its breach would send the index back to 12820.
GBP/JPY Tests Resistance
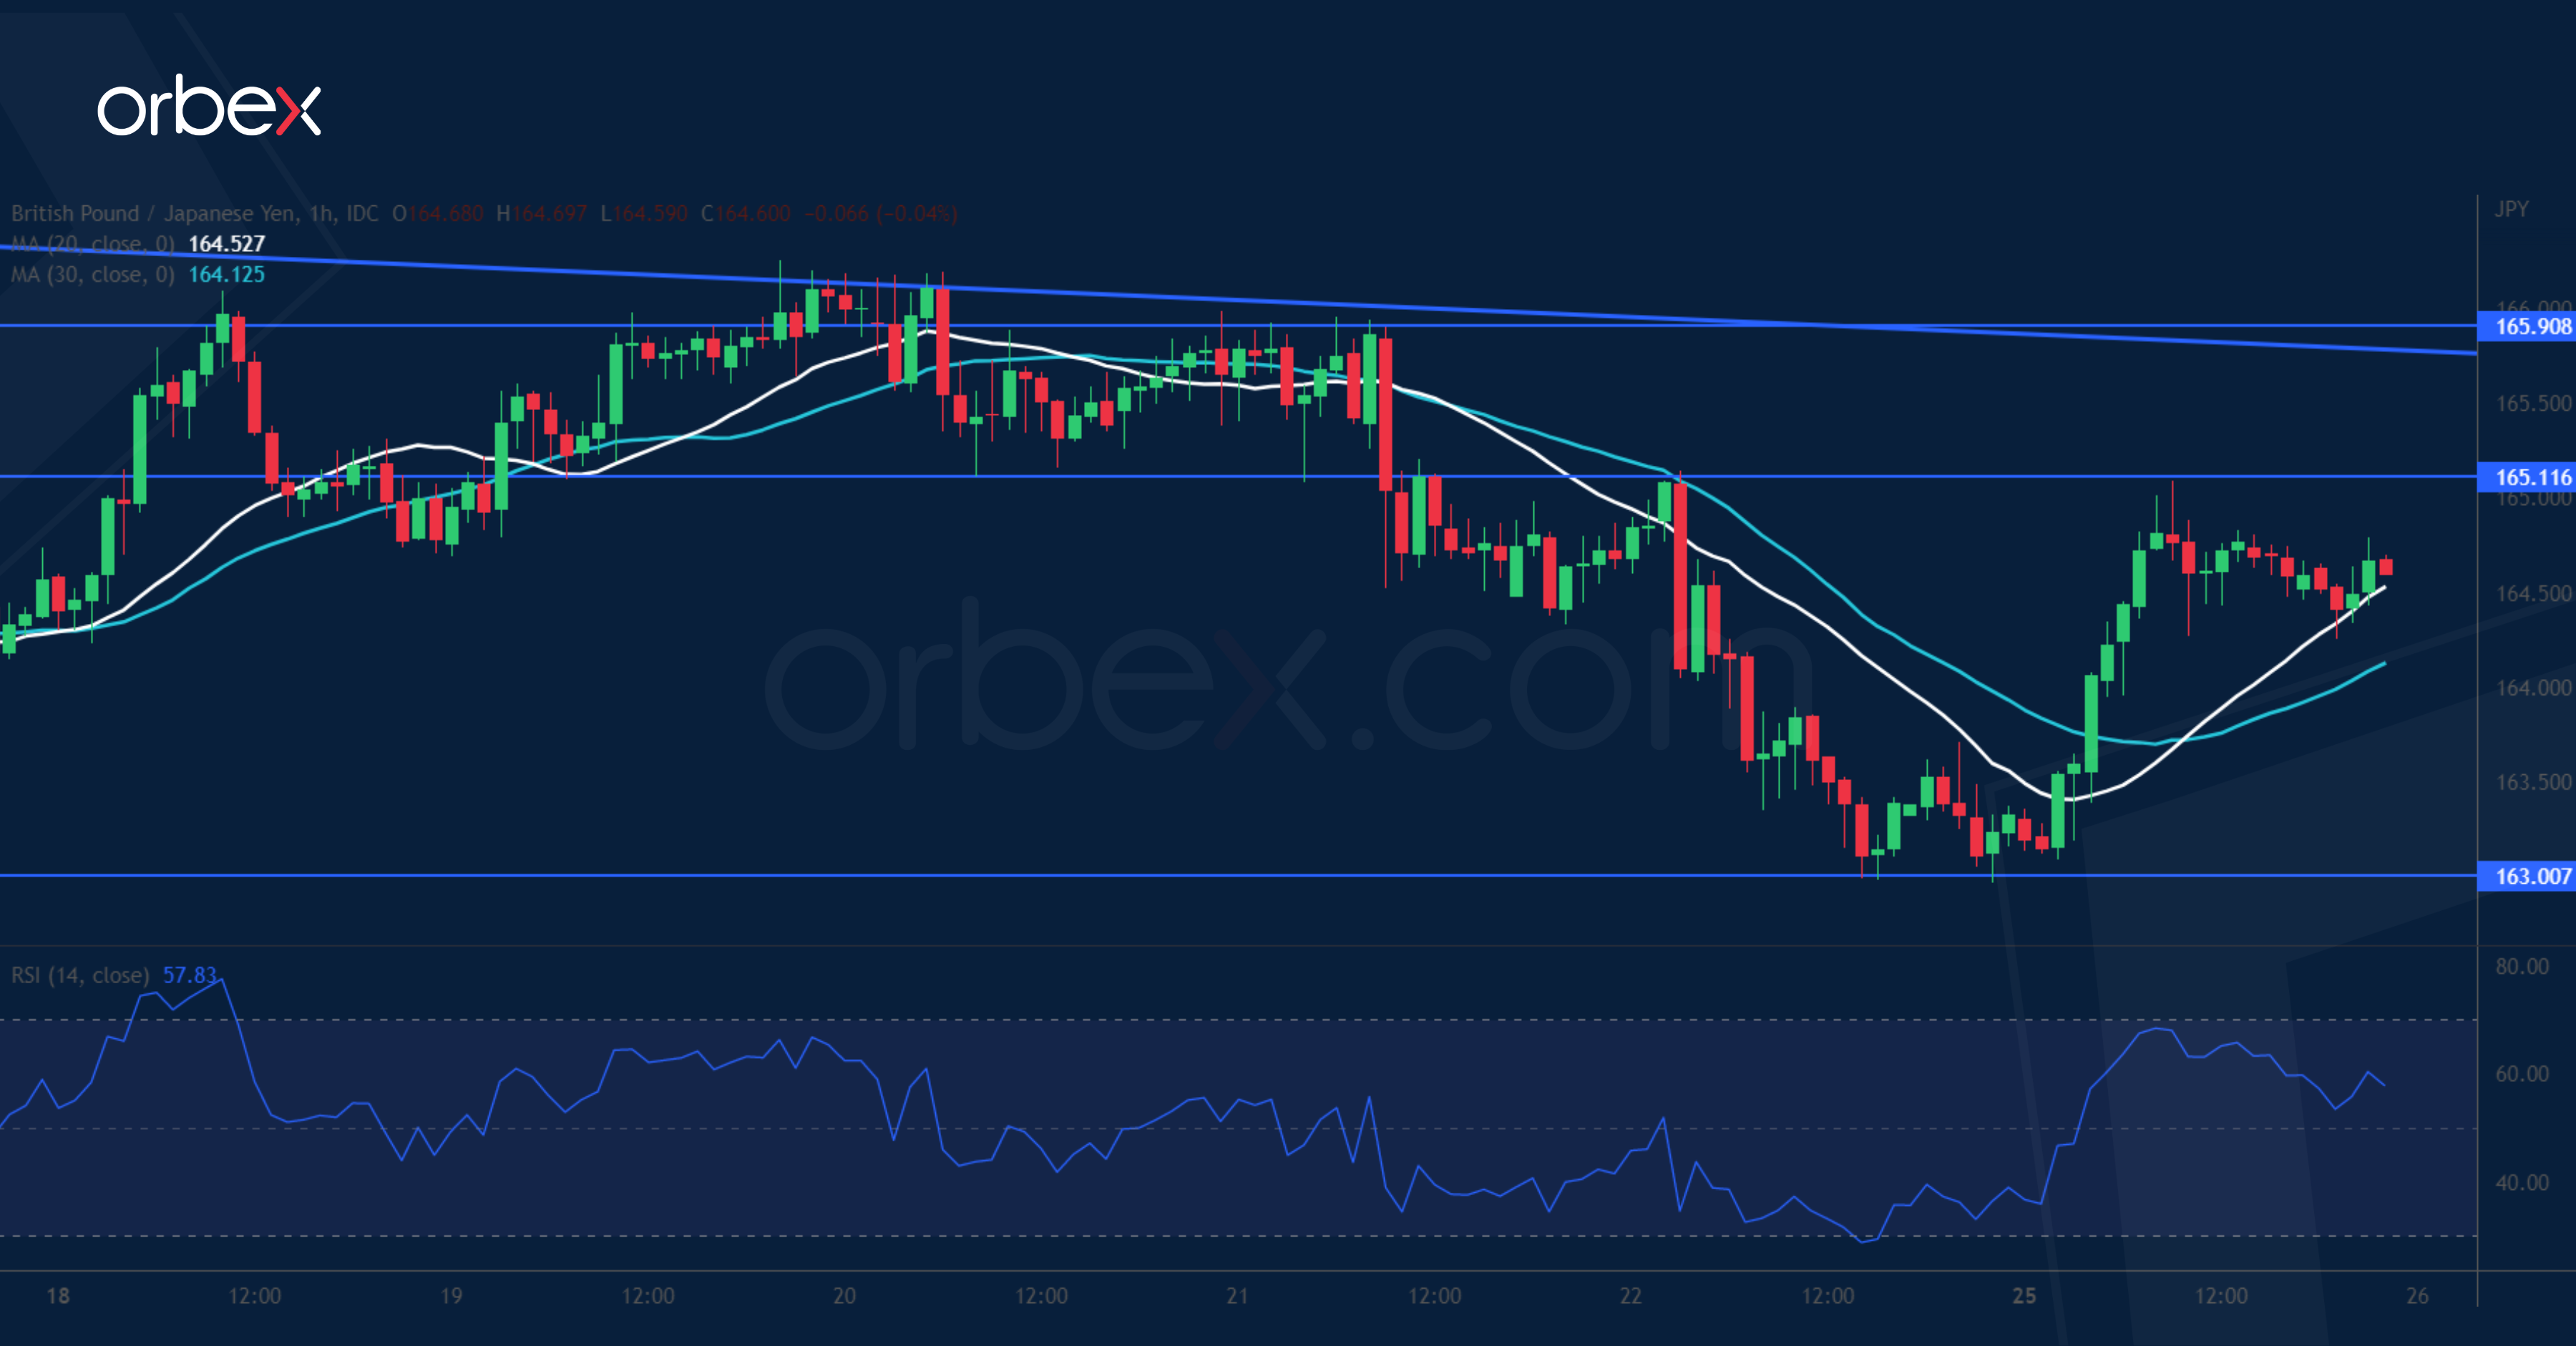
The Japanese yen softened after dovish BoJ meeting minutes. On the daily chart, the pair is swinging in a flag consolidation. The uptrend is still intact and the bulls may see the choppy price action as an opportunity to accumulate in anticipation of bullish continuation. 163.00 on the lower band of the flag pattern is the closest support. A break above 165.10 would bring the pound to the upper band (165.90) where a breakout could resume the rally. A bearish breakout though might cause a sell-off below 161.80.
EUR/USD Continues to Recover
The euro inches higher supported by the ECB’s shift to normalising its monetary policy. The psychological effect of parity had triggered a ‘buy-the-dips’ behaviour. A surge above 1.0200 prompted the short side to cover their positions and turned short-term sentiment around. The bulls further consolidated their gains above 1.0130, paving the way for a sustained rebound. A close above 1.0270 would attract momentum buying and send the single currency to the previous daily support-turned-resistance at (1.0440).