

Sample Category Title
EUR/JPY Mid-Day Outlook
Daily Pivots: (S1) 138.92; (P) 139.49; (R1) 140.27; More....
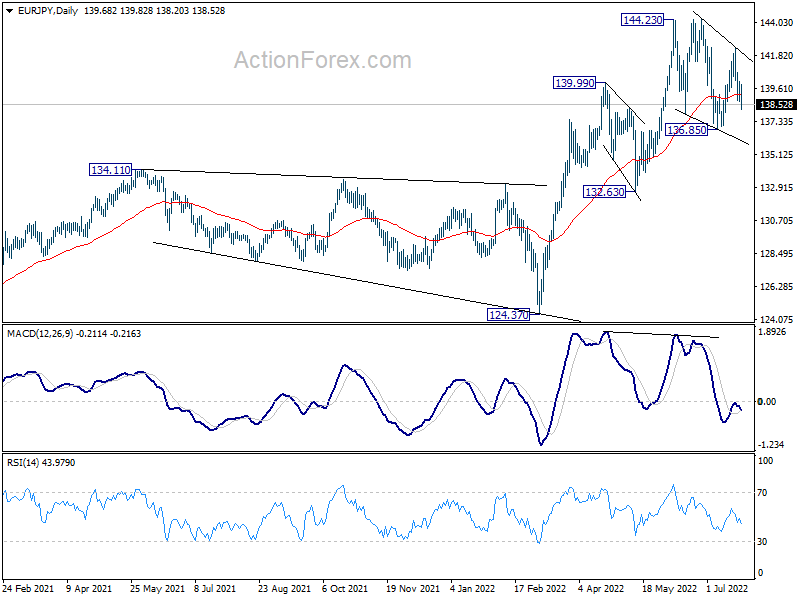
EUR/JPY's fall resumes after brief recovery and intraday bias stays on the downside. Fall from 142.31 is seen as a falling leg inside the corrective pattern from 144.23. Deeper decline would be seen to 136.85 support. On the upside, above 140.06 minor resistance will turn bias back to the upside for 142.31 resistance instead.
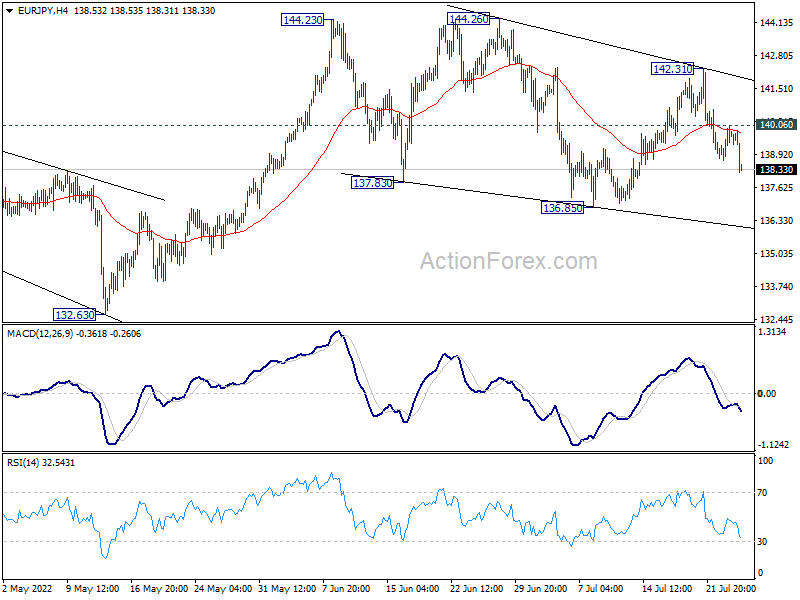
In the bigger picture, up trend from 114.42 (2020 low) is seen as the third leg of the pattern from 109.30 (2016 low). Further rally is in favor as long as 134.11 resistance turned support holds, even in case of deep pull back. Next target is 149.76 (2015 high). However, sustained break of 134.11 will be a sign of medium term bearish reversal and turn focus to 124.37 support for confirmation.
Euro Under Pressure Again on Gas Worries
Euro is under heavy selling pressure today on renewed worries over cut off of Russia gas supply. It's additionally pressured and Germany 10-year yield breaks below 1% handle again. For now, Sterling appears to be a distant second. On the other hand, Dollar and Yen are gaining most, followed by Swiss Franc. Commodity currencies are now taking a back seat, with Aussie, Kiwi and Loonie trading mixed.
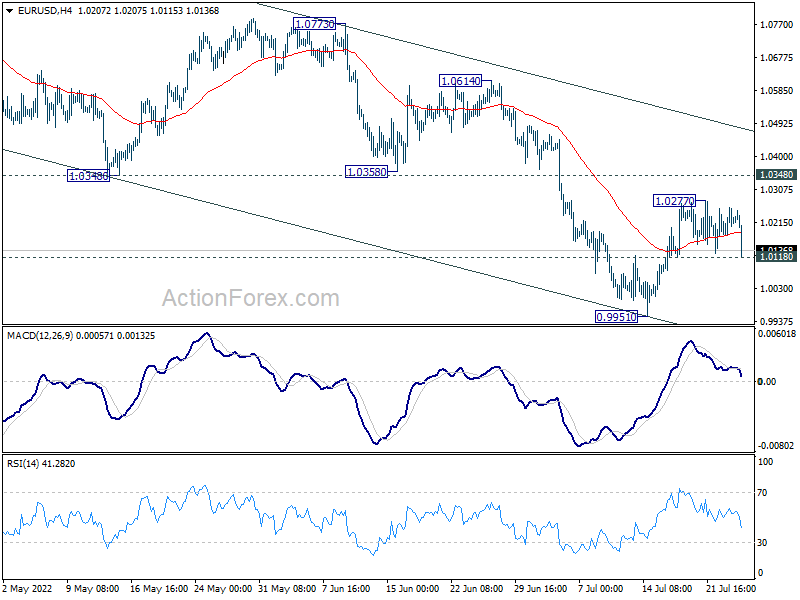
Technically, EUR/GBP's break of 0.8456 minor support now suggests that rebound form 0.8401 is finished, and fall from 0.8720 is resume to resume. A major focus in on whether EUR/USD will also break through 1.0118 minor support, and reach larger down trend through 0.9951 low. This time, if it happens, it might take a relatively much longer term for EUR/USD to regain parity.
In Europe, at the time of writing, FTSE is up 0.61%. DAX is down -0.54%. CAC is down -0.11%. Germany 10-yaer yield is down -0.0085 at 0.933. Earlier in Asia, Nikkei dropped -0.16%. Hong Kong HSI rose 1.67%. China Shanghai SSE rose 0.83%. Singapore Strait Times rose 0.37%. Japan 10-year JGB yield rose 0.0035 to 0.210.
EUR/CHF downside breakout on gas crunch worries
Euro is knocked down by renewed concerns over Russia gas supply cut to EU countries. That came after Russia said yesterday that it would cut gas flows through the Nord Stream 1 to Germany, to just 20% of normal capacity, down from current 40%.
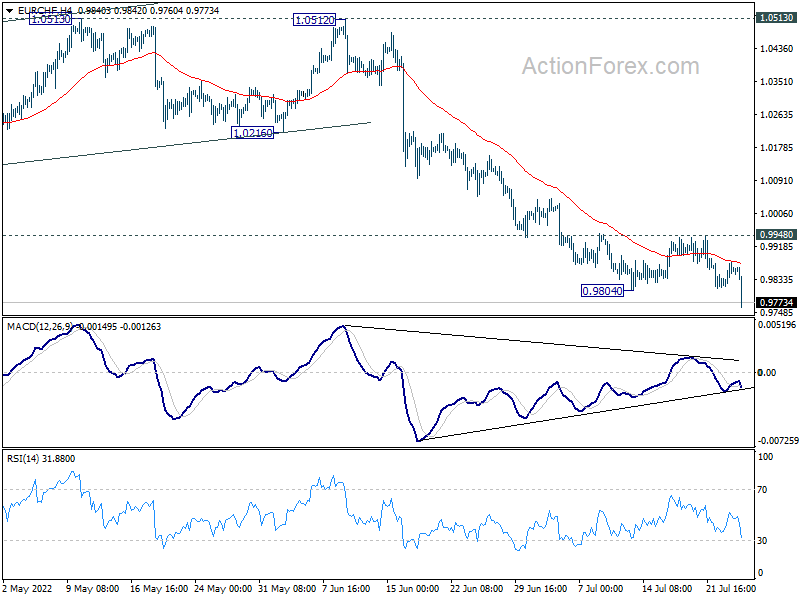
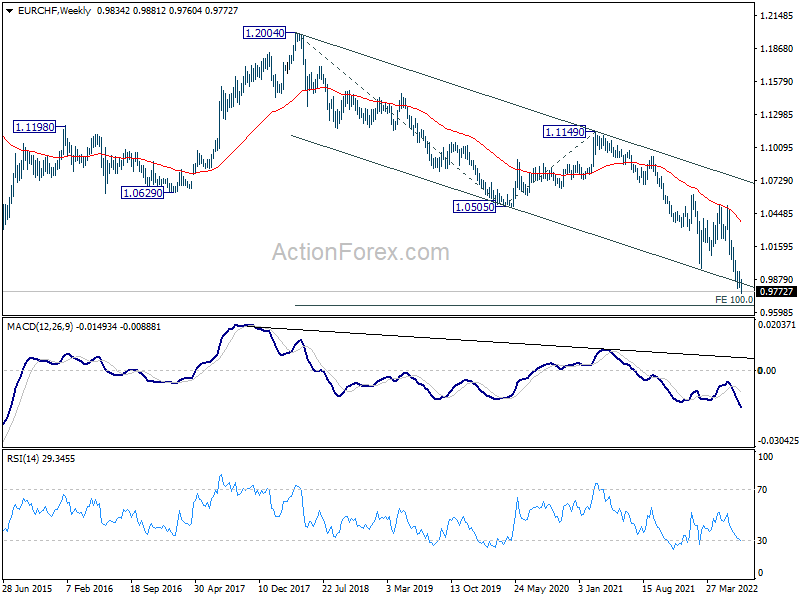
EUR/CHF finally resumes recent down trend through 0.9804 low. Outlook will now stay bearish as long as 0.9948 resistance holds. Next target is 100% projection of 1.2004 to 1.0505 to 1.1149 at 0.9650.
Japan government: Economy is picking up moderately
In the latest monthly report, Japan's Cabinet office upgraded its assessment slightly, and noted that "the Japanese economy is picking up moderately." That compared to showing signs of picking up in previous report.
But the report also warned of the downside risks from "fluctuations in the financial and capital markets amid global monetary tightening."
BoJ minutes: Board members spoke of importance of wage increases
In the minutes of June meeting, BoJ board said price rises have been broadening. But massive support is still needed for the economy while uncertainty surrounding the outlook was "extremely high".
"Many members spoke about the importance of wage increases from the perspective of achieving the BoJ's price target in a sustained and stable fashion."
"Japan must create a resilient economy at which consumption continues to rise even when companies raise prices," one board member said.
"The BOJ must maintain monetary easing until wage hikes become a trend, and help Japan achieve the bank's price target sustainably and stably," another member said.
EUR/JPY Mid-Day Outlook
Daily Pivots: (S1) 138.92; (P) 139.49; (R1) 140.27; More....
EUR/JPY's fall resumes after brief recovery and intraday bias stays on the downside. Fall from 142.31 is seen as a falling leg inside the corrective pattern from 144.23. Deeper decline would be seen to 136.85 support. On the upside, above 140.06 minor resistance will turn bias back to the upside for 142.31 resistance instead.
In the bigger picture, up trend from 114.42 (2020 low) is seen as the third leg of the pattern from 109.30 (2016 low). Further rally is in favor as long as 134.11 resistance turned support holds, even in case of deep pull back. Next target is 149.76 (2015 high). However, sustained break of 134.11 will be a sign of medium term bearish reversal and turn focus to 124.37 support for confirmation.
Economic Indicators Update
| GMT | Ccy | Events | Actual | Forecast | Previous | Revised |
|---|---|---|---|---|---|---|
| 23:50 | JPY | BoJ Minutes | ||||
| 23:50 | JPY | Corporate Service Price Index Y/Y Jun | 2.00% | 2.00% | 1.80% | 1.90% |
| 13:00 | USD | S&P/Case-Shiller Home Price Indices Y/Y May | 20.50% | 20.50% | 21.20% | |
| 13:00 | USD | Housing Price Index M/M May | 1.40% | 1.00% | 1.60% | |
| 14:00 | USD | Consumer Confidence Jul | 96.3 | 98.7 | ||
| 14:00 | USD | New Home Sales Jun | 670K | 696K |
EUR/CHF downside breakout on gas crunch worries
Euro is knocked down by renewed concerns over Russia gas supply cut to EU countries. That came after Russia said yesterday that it would cut gas flows through the Nord Stream 1 to Germany, to just 20% of normal capacity, down from current 40%.
EUR/CHF finally resumes recent down trend through 0.9804 low. Outlook will now stay bearish as long as 0.9948 resistance holds. Next target is 100% projection of 1.2004 to 1.0505 to 1.1149 at 0.9650.
Pound and FTSE100: Correction of Multi-Month Decline, But Not Yet a Bull Market
The British Pound is back above $1.2000, while FTSE100 is knocking on its 200-day moving average from below, testing the 1.5-month high area.
The combination of a rising Pound and FTSE deserves attention, as this is often a sign of a global recovery in demand for risky assets. However, we would not rush to such conclusions, as so far, the market bounce fits into a corrective pullback after a multi-month sell-off.
Market forces are not preventing a reversal, potentially accumulating liquidity ahead of the Fed meeting and publishing preliminary US GDP data for the second quarter.
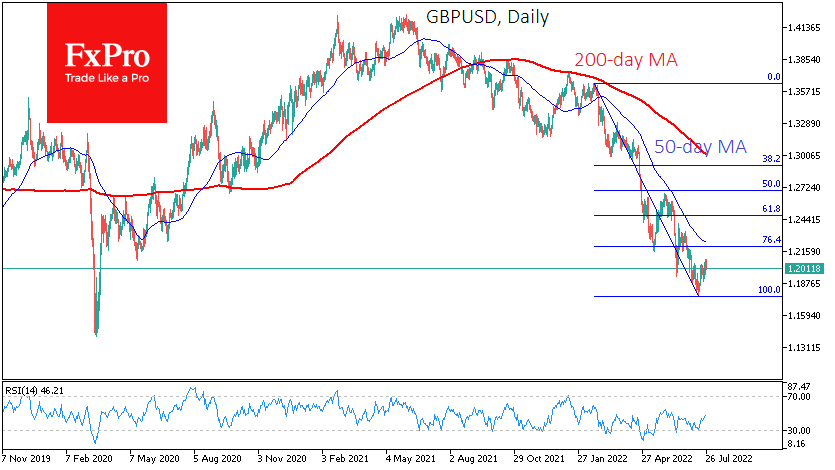
GBPUSD has lost over 13.5% in five months of decline and has gained back around 2.5% in the last ten days. Perhaps only if the Pound rises above 1.2200 (near the May lows), or better still, above 1.2250 (where the 50-day moving average passes), will it be possible to say that we are seeing the first signs of the Pound’s transition to long-term growth.
The FTSE100 is testing the 200-day moving average right now, near 7360. This is a psychologically significant line that does not go unnoticed by players. A sharp decline accompanied the fall below that line in March and June. Before that, from September till the end of February, the index managed to bounce back from that curve.
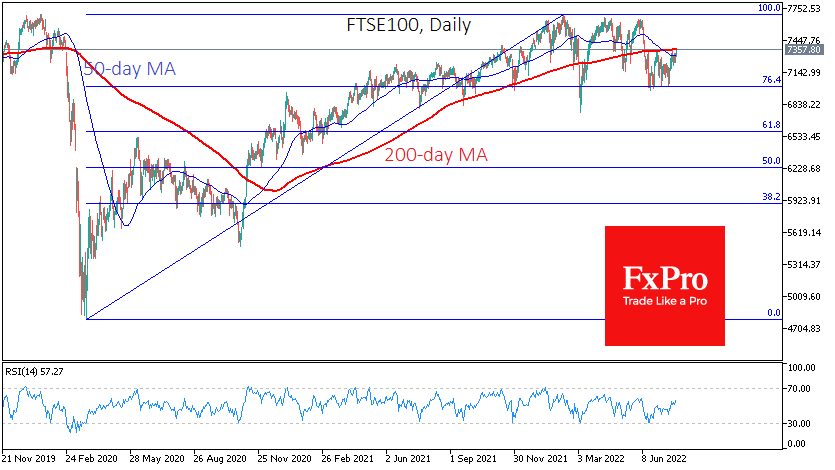
Examples to the contrary are easy to find. A consolidation above the 200 EMA would additionally fuel the appetite for buying. However, setting yourself up for a later rise would be premature. As in the period from September to March, the market participants might increase their selling on the approach of this curve, as they did at the end of last month.
The fundamentals are now on the bears’ side, from a looming economic slowdown and loss of momentum in the labour market to tightening monetary policy. We can only talk about a sustained reversal in risk appetite from fundamentals on signs that key central banks are easing monetary policy pressure. But it is too early to tell because tomorrow, the Fed is expected to raise its key rate by 75-100 points and signal another 100-point increase by the end of the year.
Australian CPI Expected to Rise
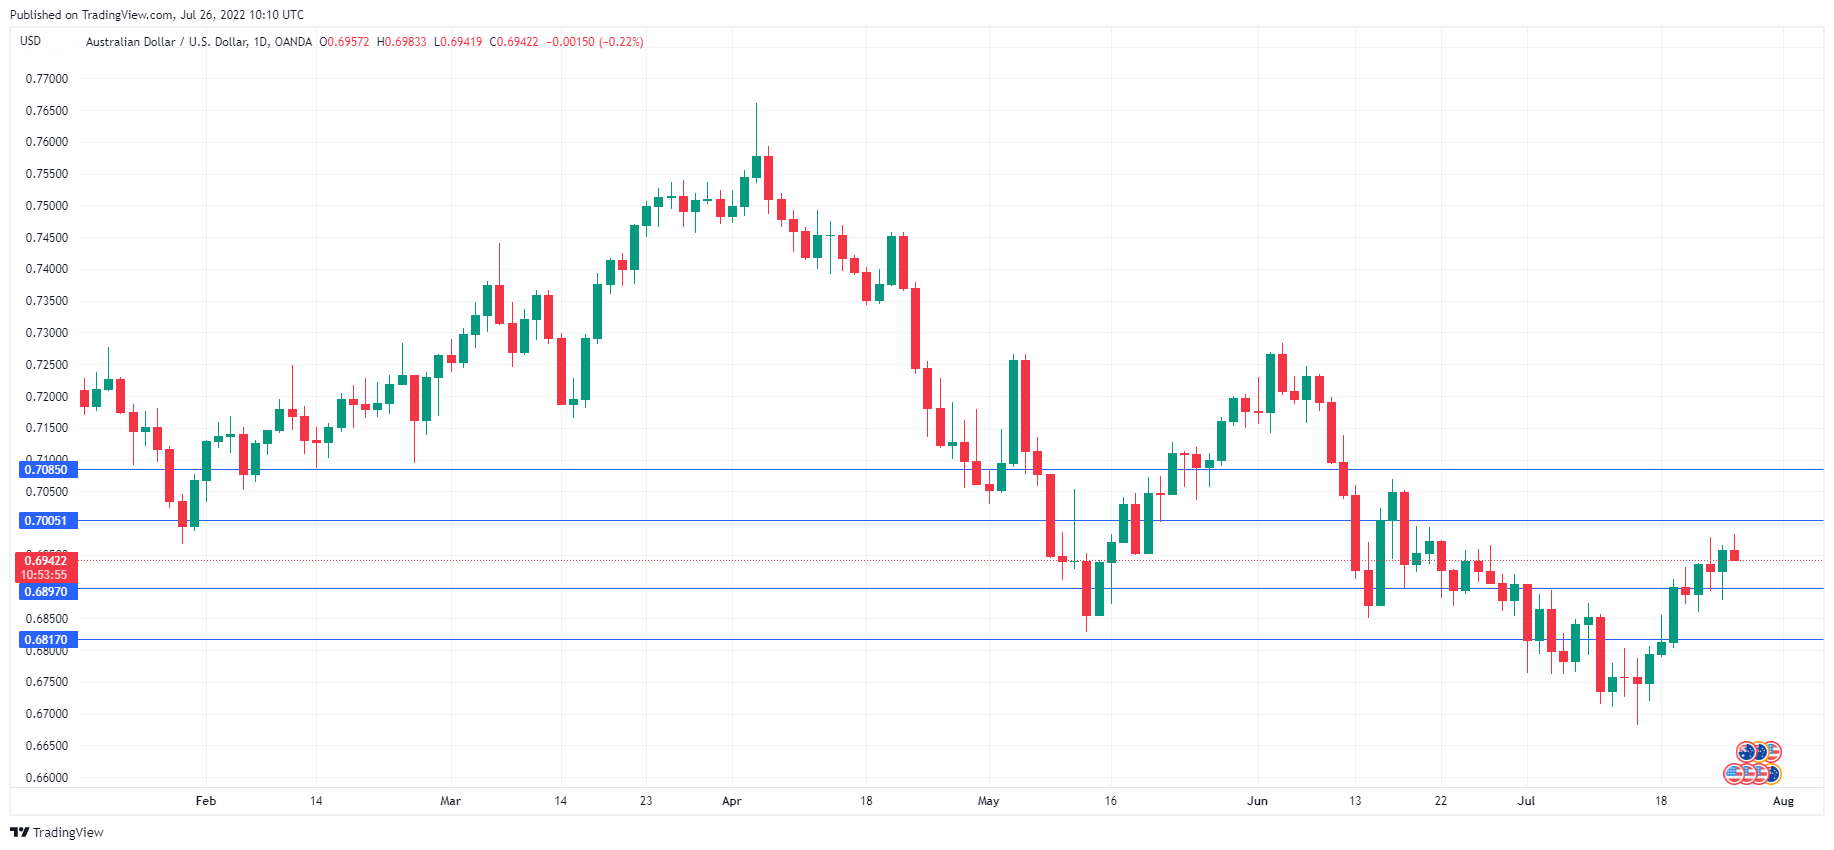
The Australian dollar has edged lower today. AUD/USD is trading at 0.6937, down 0.15% on the day.
Markets brace for higher CPI
Australia releases second-quarter CPI on Wednesday, with the markets expecting a sharp acceleration in inflation, which could wake up the sleepy Australian dollar. Headline inflation is expected to jump to 6.2% YoY, up from 5.1% in Q1. Trimmed Mean CPI, which is core inflation, is also expected to rise sharply, up to 4.7% from 3.7%.
If inflation rises steeply as expected, what would this mean for the RBA? The markets have priced in a 50bp increase at next week’s meeting, which would bring the cash rate to 1.85%. At the same time, a 75bp supersize hike cannot be discounted.
The key question of “how much, how fast” will the RBA increase rates depends on the strength of the economy and how hot inflation is running. The RBA has designated inflation as enemy number one, but wants to lower economic growth as a “soft landing” and avoid a recession if possible. A strong and resilient economy gives the RBA more leeway to tighten ‘higher and faster’ – perhaps even by 0.75% at the August meeting if today’s inflation report is higher than expected.
The RBA’s forward guidance is that more rate hikes are coming. The minutes of the July meeting stated that policymakers discussed the neutral rate (which is neither expansionary nor contractionary) and the 1.35% cash rate was “well below” that. Governor Lowe has often quoted 2.5% as around neutral, leaving little doubt that the RBA plans more hikes in the second half of the year.
After the Australian inflation report, attention will shift to the Federal Reserve, which holds its meeting on Wednesday. A massive 100bp hike is a possibility, but the greatest likelihood is a 75bp move. CME’s Fed Watch has pegged a 75bp increase at 75% and a 100bp hike at 25%. If, as expected, the Fed delivers a second-straight 75bp move, if will be interesting to see if the US dollar gains any ground or will the reaction be muted. A 100bp hike would surprise the markets and likely send the US dollar higher.
AUD/USD Technical
- There is resistance at 0.7005 and 0.7085
- 0.6897 is providing support, followed by 0.6817
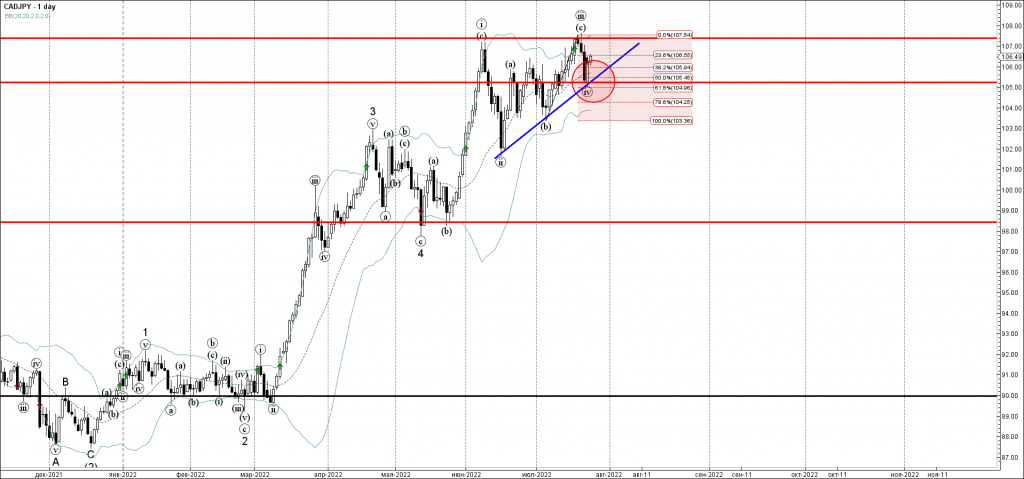
CADJPY Wave Analysis
- CADJPY reversed from support area
- Likely to rise to resistance level 107.40
CADJPY currency pair recently reversed up from the support area located between the key support level 105.00, support trendline from June, 20-day moving average and the 61.8% Fibonacci correction of the earlier upward impulse from the start of July.
The upward reversal from this support area started the active minor impulse wave (v) of waves 5 and (5).
Given the clear daily uptrend, CADJPY can be expected to rise further toward the next resistance level 107.40.
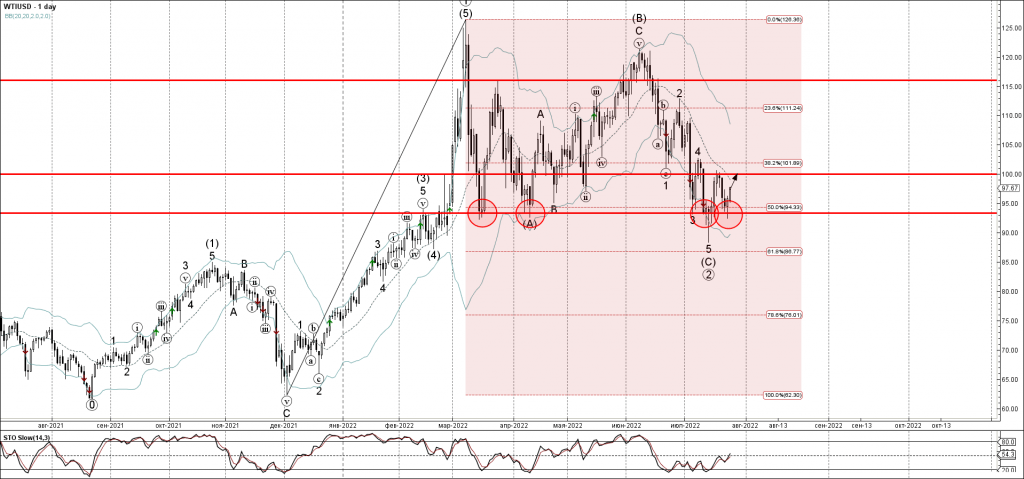
WTI Wave Analysis
- WTI reversed from support area
- Likely to rise to resistance level 100.00
WTI crude oil currency pair recently reversed up from the support area located between the key support level 93.40 (which has been reversing the pair from March) and the 50% Fibonacci retracement of the upward trend from December.
The upward reversal from this support area continues the active primary upward impulse wave from the middle of July.
WTI crude can be expected to rise further toward the next round resistance level 100.00 (which reversed the price earlier this month).
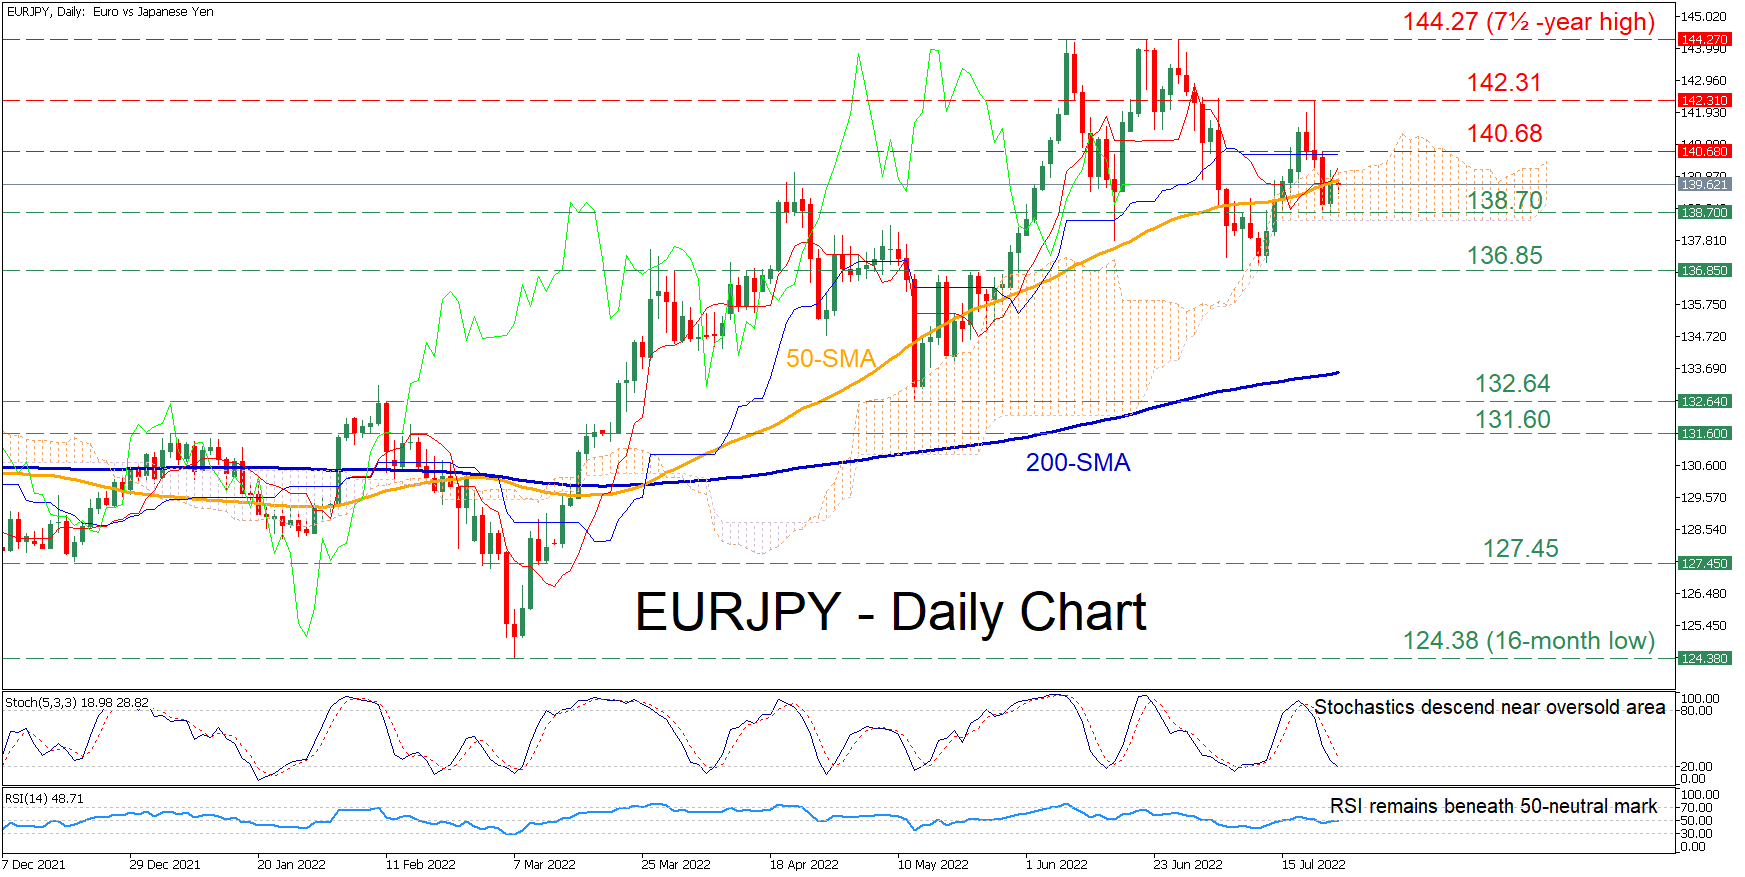
EURJPY Retreats Below 50-SMA But Retains Bullish Outlook
EURJPY has been experiencing a decline in the last few daily sessions after its latest advance paused at the 142.31 region. Although the pair managed to cease its drop, its upside remains capped by the congested region that includes its 50-day simple moving average (SMA) and the upper boundary of the Ichimoku cloud.
The momentum indicators suggest that negative momentum is strengthening. Specifically, the stochastic oscillator is sloping downwards near the 20-oversold area, while the RSI is hovering below its 50-neutral threshold.
Should selling pressure intensify further, the recent low of 138.70 could act as the first line of defence. Sliding beneath that floor, the price may descend towards the crucial 136.85 barrier before it challenges the May low of 132.64. Failing to halt there, the bears could then aim for the 131.60 hurdle.
To the upside, if buyers re-emerge and push the price above its 50-day SMA, immediate resistance could be encountered at the 140.68 region. Breaching this ceiling, the spotlight could then turn to the recent reversal point of 142.31. An upside violation of the latter might then set the stage for the 7½-year high of 144.27.
Overall, despite its recent weakness, EURJPY maintains its bullish technical picture. For that to alter, the price needs to decisively dive below the 136.85 floor.
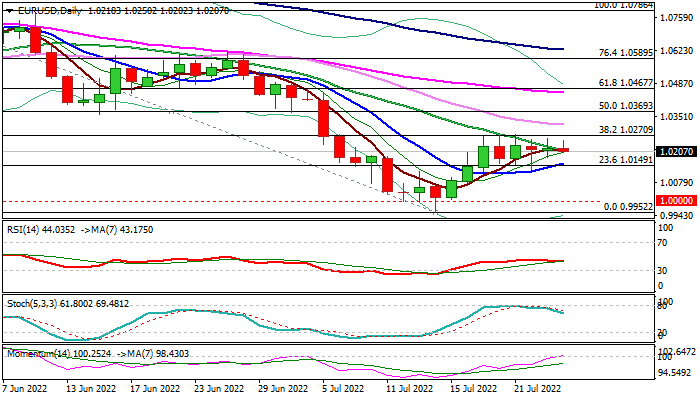
EUR/USD: Euro in Quiet Mode and Awaiting Signals from Fed
Near-term range is narrowing the Euro turned into directionless mode ahead of this week’s key event – FOMC policy meeting, which is eyed for fresh signals.
Near-term action is extending into third consecutive daily Doji that signals indecision, with mixed daily studies, supporting the notion.
Positive signals from converging 10/20 DMA’s (rising 10DMA is likely to form a bull cross with falling 20DMA) and 14-d momentum breaking into positive territory, were so far countered with a bull-trap above 1.0270 Fibo barrier (38.2% of 1.0786/0.9952) and south-heading stochastic.
Expect initial signal on sustained break of either 10DMA (1.0159) or lift through 1.0270/83 pivots (Fibo 38.2% / daily Kijun-sen).
The Fed is expected to make another 0.75% rate hike on Wednesday that should be a dollar-positive, however, fears that aggressive policy tightening is going to negatively impact economic growth and push the economy towards recession, weighs on the US currency.
In addition, US consumer confidence, later today (July 97.2 f/c vs June 98.7) would provide initial signal about the current condition of the US economy, while US Q2 GDP, due on Thursday (Q2 0.4% f/c vs -1.6% in Q1) will give further details about the situation in the world’s largest economy
Res: 1.0270; 1.0283; 1.0316; 1.0349.
Sup: 1.0179; 1.0157; 1.0129; 1.0078.
By How Much Will Fed Hike Tomorrow?
Since the last Fed meeting, there have been some pretty wide variations on expectations. Initially, it was thought that the Fed's latest 75bps hike was a one-off. Then inflation data came out, and that changed the calculus, with a bunch of exports expecting as much as 100bps hike. But comments from Fed officials sort of downplayed that possibility.
There is another wrinkle here in that the Fed has an extra information advantage the market doesn't have. US Q2 GDP data is expected to be vital to understanding the economy's dynamics, but traders won't get that release until the day after the rate decision. But the Fed is likely to have at least a preview of those numbers when making its decision. For that reason, it's harder for the market to come to some kind of consensus on what to expect, which means we could have extra volatility.
Where the projections are
According to the Chicago Mercantile Exchange's tracking tool, almost exactly three quarters of economists expect the Fed to raise rates by 75bps. The remaining dissenters are all betting on a 100bps hike.
The interesting thing here is that even 75bps would put the interest rate above where it was in 2018, when the Fed then had to cut rates as the economy was starting to sputter. Following the last meeting, several members came out to talk down significantly tighter monetary policy. Bostic (who's regarded as pretty center or even a mild inclination towards hawkishness) even came out to say that 100bps would leave the markets more concerned.
Balancing the data
The main concern the Fed has for not pulling out all the stops in fighting inflation is that tighter policy could lead to a recession. Which is why the Q2 GDP figures are so important this time around. The US already has one quarter of negative growth, so a second quarter would mean that by the most common metric, the US would already be in a recession. Seemingly in anticipation of this, the White House issued a press release clarifying the official, technical process of declaring a recession, which is a little more complicated.
The issue for monetary policy, and therefore what happens to the dollar, is what to do. If the US is already in a recession, then the Fed might no longer have to worry about causing one. That might mean doubling down on the policy to get inflation under control so that consumers recover their confidence and the recovery can get under way.
Other alternatives
Or does it mean that the Fed will take a step back in fighting inflation, in order to mitigate the effects of the economic downturn. Or to hold off on tighter policy until the situation improves.
And, of course, there is the very real possibility that Q2 GDP is actually positive, even if by a little. A recession with low unemployment, fast job creation and growing corporate profits would be somewhat unusual. But, then, the level of inflation at the moment is also unusual.
Regardless, the markets are struggling to price in the possible outcome from the meeting, so we should be ready for a strong reaction in the markets following the rate decision.