Sample Category Title
USD/CAD Daily Outlook
Daily Pivots: (S1) 1.2835; (P) 1.2868; (R1) 1.2919; More...
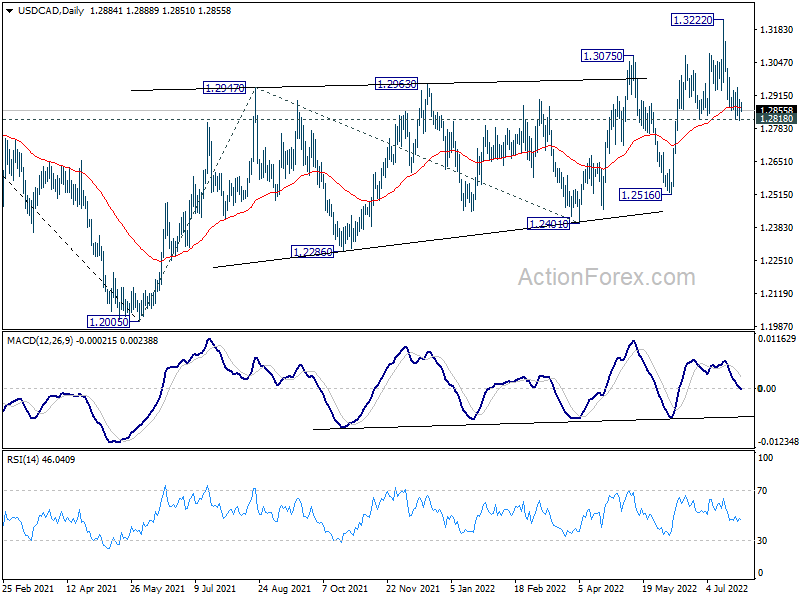
Intraday bias in USD/CAD remains neutral at this point. On the downside, firm break of 1.2818 support will bring deeper fall back to 1.2516 key support. This will also raise the chance of near term bearish reversal. On the upside, above 1.2988 minor resistance will reinforce near term bullishness, and turn bias back to the upside for retesting 1.3222 instead.
In the bigger picture, down trend from 1.4667 (2020 high) should have completed at 1.2005, after defending 1.2061 long term cluster support. Rise from there should target 61.8% retracement of 1.4667 to 1.2005 (2021 low) at 1.3650. This will remain the favored case now as long as 1.2516 support holds.
EUR/USD Resilient, But Vulnerable ahead of FOMC
Dollar is trading with a soft tone today, as focus turns to FOMC rate decision. Another 75bps hike is widely expected and Chair Jerome Powell is not expected to deliver any dramatic comments. Traders would likely come back after the event risk is cleared. In the currency markets, Euro is staying under much pressure on gas crisis but Sterling and Swiss Franc are not bothering too much. Commodity currencies are losing some upside momentum, but remain the relatively stronger ones.
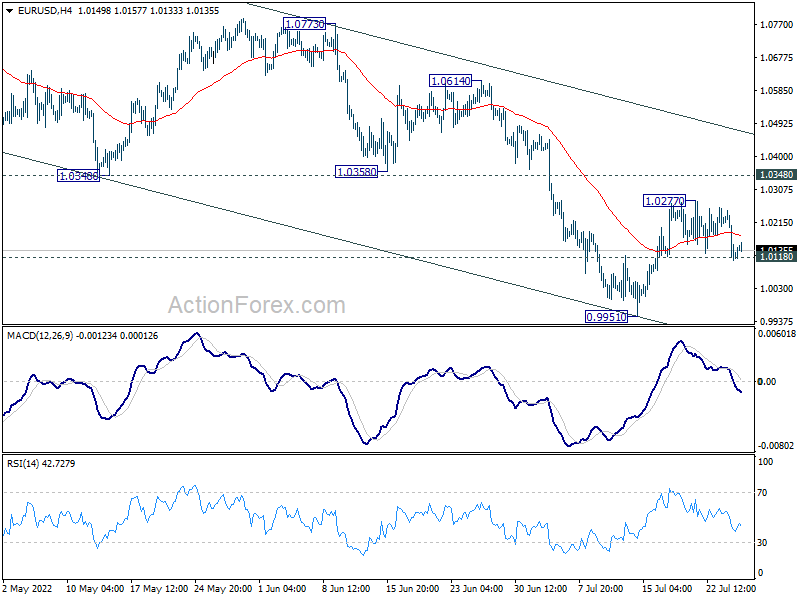
Technically, 1.0118 minor support in EUR/USD is the main focus today. It's so far resiliently holding on to the level despite broad based Euro selloff. But firm break there will argue that rebound from 0.9951 has completed. More importantly, larger down trend would likely be ready to resume through 0.9951 low. This time, if happens, EUR/USD should trade below parity for a longer while before bottoming and reclaiming the psychological level.
In Asia, Nikkei rose 0.22%. Hong Kong HSI is down -1.04%. China Shanghai SSE is up 0.13%. Singapore Strait Times is up 0.02%. Japan 10-year JGB yield is down -0.0058 at 0.204. Overnight, DOW dropped -0.71%. S&P 500 dropped -1.15%. NASDAQ dropped -1.87%. 10-year yield dropped -0.033 to 2.787.
Australia CPI surged to record 6.1% yoy, but below expectations
Australia CPI rose 1.8% qoq in Q2, blow expectation of 1.9% qoq. For the 12-month period, CPI accelerated from 5.1% yoy to 6.1% yoy, below expectation of 6.3% yoy. RBA trimmed mean CPI came in at 1.5% qoq, 4.9% yoy, versus expectation of 1.5% qoq, 4.7% yoy.
The quarterly increase was the second highest since the introduction of the Goods and Services Tax (GST), following on from a 2.1% increase in Q1. The annual rise was the highest since the introduction of GST.
"Annual trimmed mean inflation was the highest since the series commenced in 2003 and annual goods inflation was the highest since 1987, as the impacts of supply disruptions, rising shipping costs and other global and domestic inflationary factors flowed through the economy," said Head of Prices Statistics at the ABS, Michelle Marquardt.
Germany Gfk consumer sentiment hit another rock bottom at -30.6
Germany Gfk consumer sentiment for August dropped from -27.7 to -30.6, below expectation of -28.2. That's another record low since the start of the series in 1991. In July, economic expectations dropped from -11.7 to -18.2. Income expectations dropped from -33.5 to -45.7. Propensity to buy dropped from -13.7 to -14.5.
"In addition to concerns about disrupted supply chains, the war in Ukraine and soaring energy and food prices, there are now worries about sufficient gas supplies for businesses and households next winter. This is currently causing consumer sentiment to hit rock bottom," explains Rolf Bürkl, GfK consumer expert. "Especially as a tight supply of natural gas is likely to add to the pressure on energy prices and thus inflation."
Fed to hike another 75bps again, some previews
Fed is widely expected to raise interest rates by 0.75% today, for the second time in a row, to bring the federal funds rate target rate to 2.25-2.50%. More tightening is expected afterwards, as most FOMC members believed that interest rates have enter into "restrictive" region to curb inflation, which is already at multi-decade high.
The questions are on the pace of tightening beyond the neutral range, its impact on economic activity, and risks of recession as a result. Fed Chair Jerome Powell will be grilled for these questions. But a concrete answer is unlikely for now. The next rate-setting meeting on September 21 is nearly two months away. Two sets of prices, jobs and activity data will be published during the time, and before the new economic projections. The situation is so uncertain for Powell to tell the markets anything meaningful.
Here are some previews on Fed:
- FOMC Preview – Assessing the Balance of Risk for Traders
- Fed to Likely Hike by 75 bps But May Still Weigh 100-bps Option
- FOMC Meeting Preview: Traders Looking for 75bps, Powell's Presser Key
- All Eyes on Bond Yields ahead of FOMC
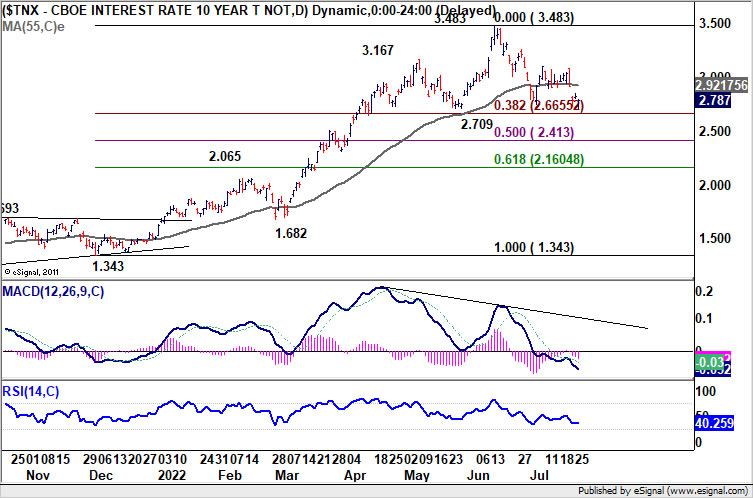
As for market reaction, a major focus is on 10-year yield. It's so far still sitting comfortably above a key support zone of 2.709 and 38.2% retracement of 1.343 to 3.483 at 2.665. There is prospect of a rebound to flatten the yield curve of 2-year (3.053%) to 10-year (2.787%). But a firm break below 2.709 could signal a flush into bonds, which could send 10-year yield towards 50% at 2.413, and below. That will threaten the curve of 3-month (2.507) to 10-year yield, which will be a big warning.
Elsewhere
Swiss ZEW expectations and Eurozone M3 money supply will be released in European session. US will release goods trade balance, whole sales inventories, durable goods orders and pending home sales.
USD/CAD Daily Outlook
Daily Pivots: (S1) 1.2835; (P) 1.2868; (R1) 1.2919; More...
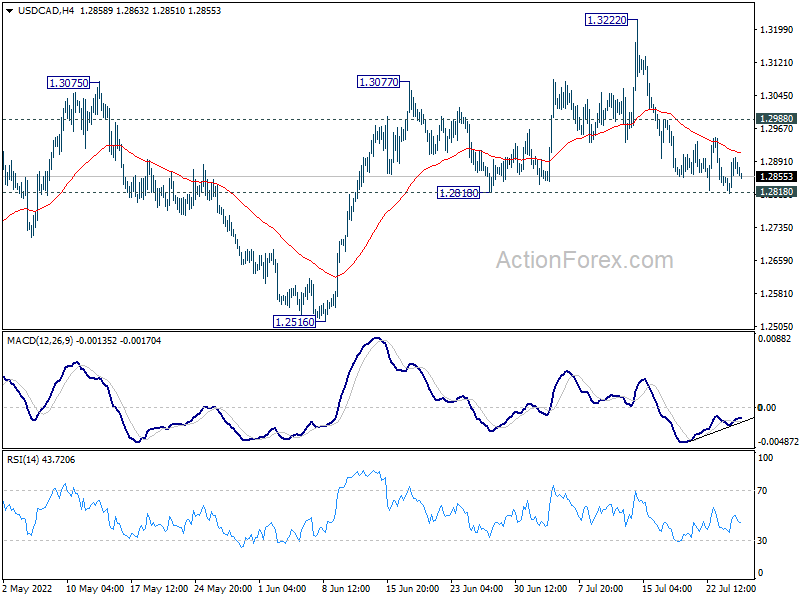
Intraday bias in USD/CAD remains neutral at this point. On the downside, firm break of 1.2818 support will bring deeper fall back to 1.2516 key support. This will also raise the chance of near term bearish reversal. On the upside, above 1.2988 minor resistance will reinforce near term bullishness, and turn bias back to the upside for retesting 1.3222 instead.
In the bigger picture, down trend from 1.4667 (2020 high) should have completed at 1.2005, after defending 1.2061 long term cluster support. Rise from there should target 61.8% retracement of 1.4667 to 1.2005 (2021 low) at 1.3650. This will remain the favored case now as long as 1.2516 support holds.
Economic Indicators Update
| GMT | Ccy | Events | Actual | Forecast | Previous | Revised |
|---|---|---|---|---|---|---|
| 01:30 | AUD | CPI Q/Q Q2 | 1.80% | 1.90% | 2.10% | |
| 01:30 | AUD | CPI Y/Y Q2 | 6.10% | 6.30% | 5.10% | |
| 01:30 | AUD | RBA Trimmed Mean CPI Q/Q Q2 | 1.50% | 1.50% | 1.40% | |
| 01:30 | AUD | RBA Trimmed Mean CPI Y/Y Q2 | 4.90% | 4.70% | 3.70% | |
| 06:00 | EUR | Germany Gfk Consumer Confidence Aug | -30.6 | -28.2 | -27.4 | |
| 08:00 | CHF | CHF ZEW Expectations Jul | -72.7 | |||
| 08:00 | EUR | Eurozone M3 Money Supply Y/Y Jun | 5.50% | 5.60% | ||
| 12:30 | USD | Goods Trade Balance (USD) Jun P | -103.2B | -104.3B | ||
| 12:30 | USD | Wholesale Inventories Jun P | 2.00% | 1.80% | ||
| 12:30 | USD | Durable Goods Orders Jun | -0.50% | 0.80% | ||
| 12:30 | USD | Durable Goods Orders ex Transportation Jun | 0.40% | 0.70% | ||
| 14:00 | USD | Pending Home Sales M/M Jun | 0.50% | 0.70% | ||
| 14:30 | USD | Crude Oil Inventories | -1.5M | -0.4M | ||
| 18:00 | USD | Fed Interest Rate Decision | 2.50% | 1.75% | ||
| 18:30 | USD | FOMC Press Conference |
Germany Gfk consumer sentiment hit another rock bottom at -30.6
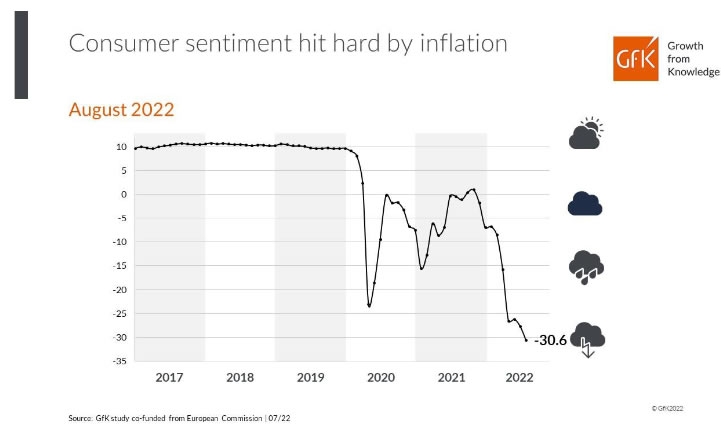
Germany Gfk consumer sentiment for August dropped from -27.7 to -30.6, below expectation of -28.2. That's another record low since the start of the series in 1991. In July, economic expectations dropped from -11.7 to -18.2. Income expectations dropped from -33.5 to -45.7. Propensity to buy dropped from -13.7 to -14.5.
"In addition to concerns about disrupted supply chains, the war in Ukraine and soaring energy and food prices, there are now worries about sufficient gas supplies for businesses and households next winter. This is currently causing consumer sentiment to hit rock bottom," explains Rolf Bürkl, GfK consumer expert. "Especially as a tight supply of natural gas is likely to add to the pressure on energy prices and thus inflation."
Fed to hike another 75bps again, some previews
Fed is widely expected to raise interest rates by 0.75% today, for the second time in a row, to bring the federal funds rate target rate to 2.25-2.50%. More tightening is expected afterwards, as most FOMC members believed that interest rates have enter into "restrictive" region to curb inflation, which is already at multi-decade high.
The questions are on the pace of tightening beyond the neutral range, its impact on economic activity, and risks of recession as a result. Fed Chair Jerome Powell will be grilled for these questions. But a concrete answer is unlikely for now. The next rate-setting meeting on September 21 is nearly two months away. Two sets of prices, jobs and activity data will be published during the time, and before the new economic projections. The situation is so uncertain for Powell to tell the markets anything meaningful.
Here are some previews on Fed:
- FOMC Preview – Assessing the Balance of Risk for Traders
- Fed to Likely Hike by 75 bps But May Still Weigh 100-bps Option
- FOMC Meeting Preview: Traders Looking for 75bps, Powell's Presser Key
- All Eyes on Bond Yields ahead of FOMC
As for market reaction, a major focus is on 10-year yield. It's so far still sitting comfortably above a key support zone of 2.709 and 38.2% retracement of 1.343 to 3.483 at 2.665. There is prospect of a rebound to flatten the yield curve of 2-year (3.053%) to 10-year (2.787%). But a firm break below 2.709 could signal a flush into bonds, which could send 10-year yield towards 50% at 2.413, and below. That will threaten the curve of 3-month (2.507) to 10-year yield, which will be a big warning.
Australia CPI surged to record 6.1% yoy, but below expectations
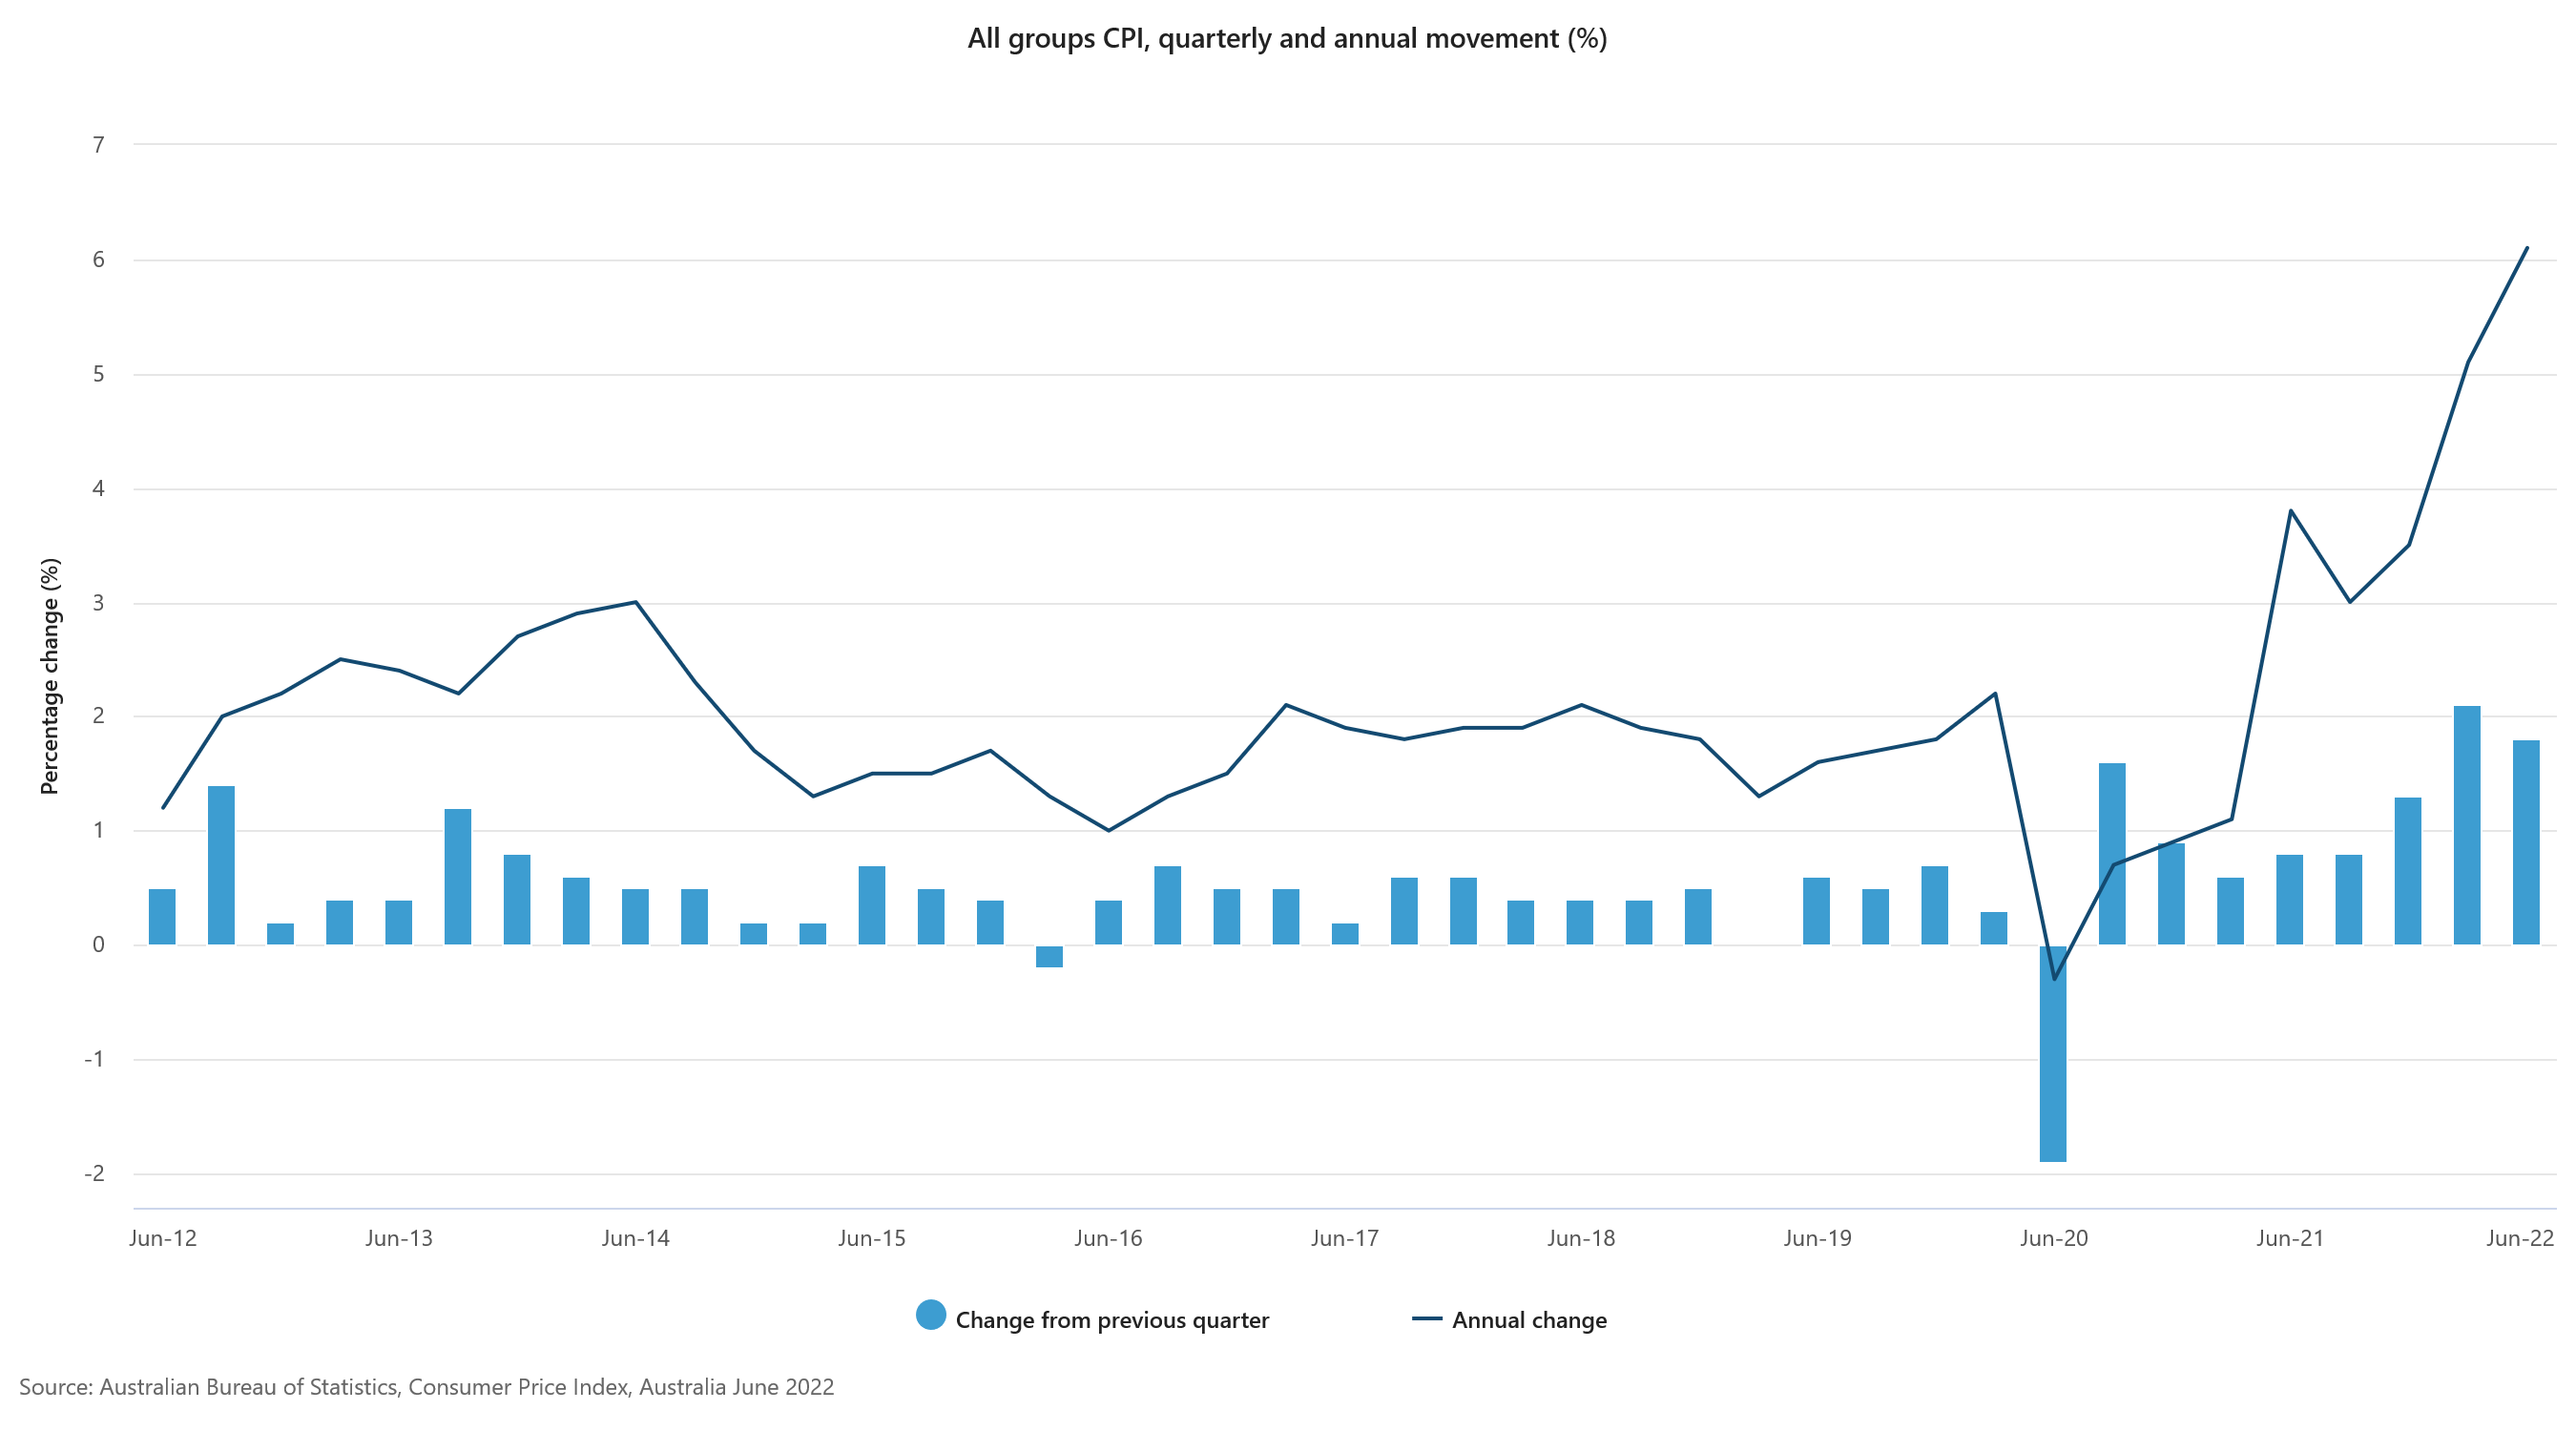
Australia CPI rose 1.8% qoq in Q2, blow expectation of 1.9% qoq. For the 12-month period, CPI accelerated from 5.1% yoy to 6.1% yoy, below expectation of 6.3% yoy. RBA trimmed mean CPI came in at 1.5% qoq, 4.9% yoy, versus expectation of 1.5% qoq, 4.7% yoy.
The quarterly increase was the second highest since the introduction of the Goods and Services Tax (GST), following on from a 2.1% increase in Q1. The annual rise was the highest since the introduction of GST.
"Annual trimmed mean inflation was the highest since the series commenced in 2003 and annual goods inflation was the highest since 1987, as the impacts of supply disruptions, rising shipping costs and other global and domestic inflationary factors flowed through the economy," said Head of Prices Statistics at the ABS, Michelle Marquardt.
Australian Inflation Lifts as Broadly Expected
June 2022 CPI 1.8%qtr vs 1.7% forecast; Trimmed Mean 1.5% vs 1.4% forecast. The CPI came in broadly as expected even with food, clothing & footwear, household furniture, equipment & services surprising to the high side.
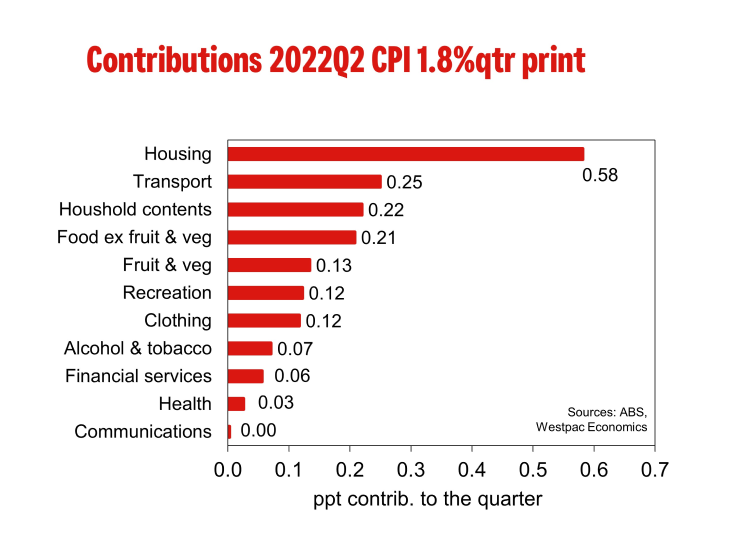
The CPI gained 1.8% in the June quarter splitting the difference between the market median of 1.9% and Westpac’s forecast of 1.7%. At two decimal places it was 1.78% so a firm 1.8%%. This increase was the second highest since the introduction of the GST and follows on from a 2.1% increase in the March quarter.
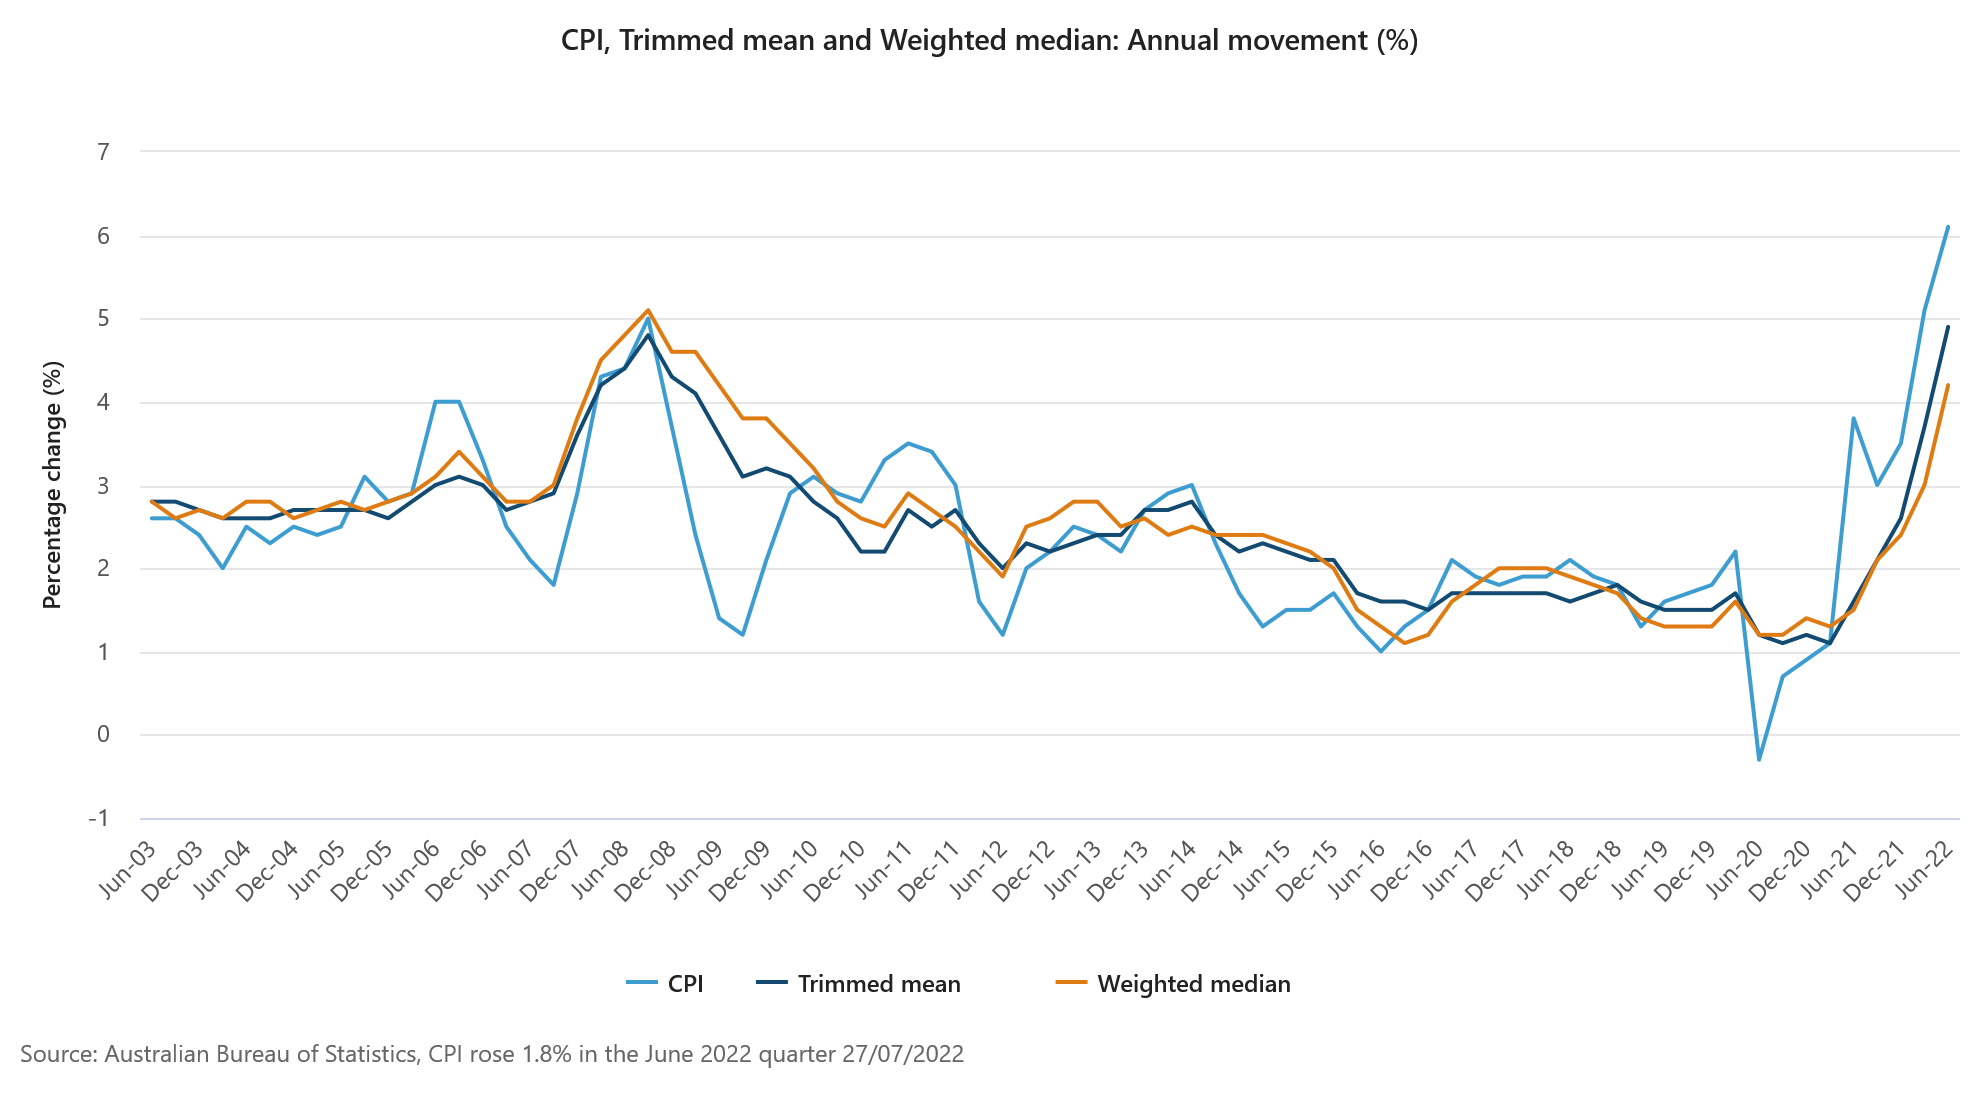
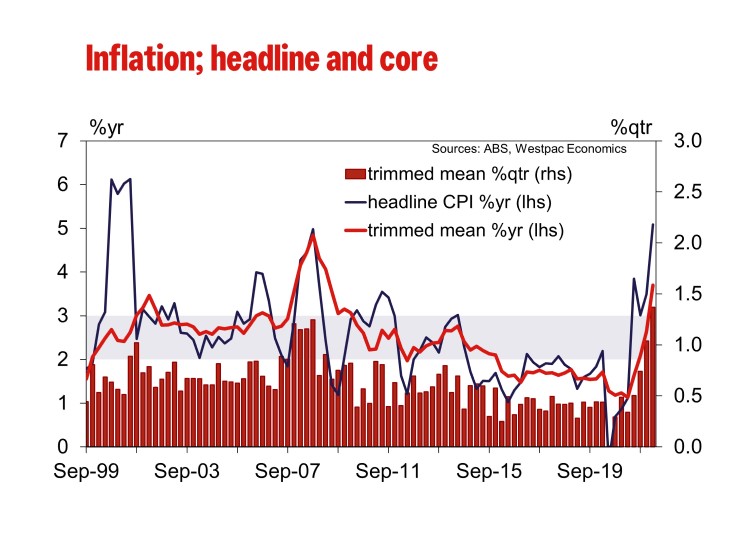
The annual pace lifted from 5.1% to 6.1% the fastest pace since the introduction of the GST (6.1%yr June 2001) and significantly faster than the mining boom peak in September 2008 of 5.0%yr.
The impact of HomeBuilder grants was there but it is less significant than in recent history. The more important story now for new dwelling inflation is the shortages of building supplies and labour, heightened freight costs and strong demand – these factors are also significant for the broader inflationary pulse we are now observing.
In June, automotive fuel reached a record level for the fourth consecutive quarter. Fuel prices rose strongly over May and June, following a fall in April, due to the 22c temporary cut in the fuel excise.
This broad spread inflationary pulse was captured by 1.5% gain in the trimmed mean, the market was forecasting 1.5%, Westpac was expecting 1.4%. It is also worth noting that the March quarter trimmed mean was revised from 1.4% to 1.5%. The annual pace of the trimmed mean lifted from 3.7%yr in March to 4.9%yr in June, the fastest pace since September 1991 (using the RBA’s historical estimates).
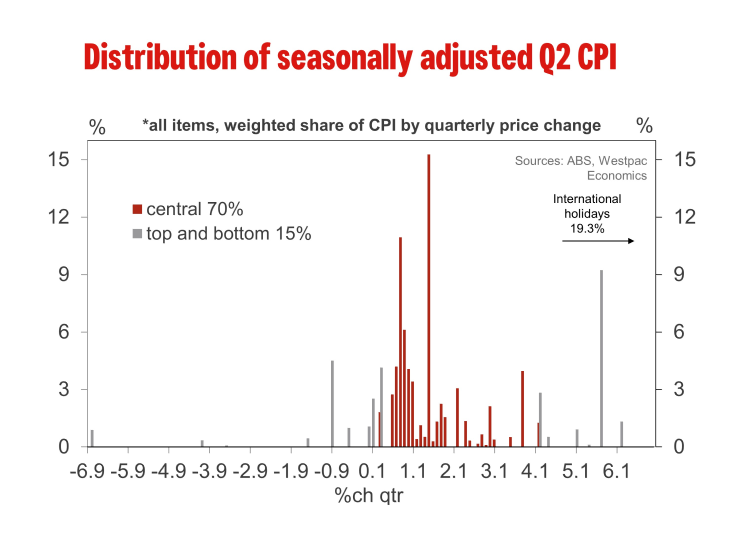
At two decimal places the trimmed mean rose 1.46% so a solid 1.5%; for completeness the weighted median gained 1.4% for 4.1%yr.
The ABS reports that annual goods inflation was the highest since 1987, as the impacts of supply disruptions, rising shipping costs and other global and domestic inflationary factors flowed through the economy.
The widespread nature of this inflationary pulse was further emphasised by the rise in the share of components of the CPI running faster than a 2.5%yr pace. The share lifted from 66% to 72.4% well up from 29% reported just back in September 2021; 72.4% is the largest share of the CPI components running faster than 2.5%yr since June 2001 75.3% (you have to go back to early 1991 to find a larger share).
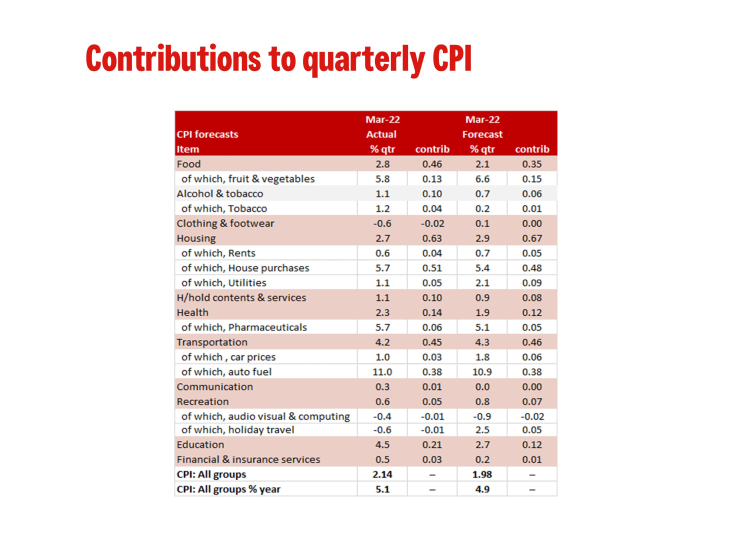
Turning to the details the most significant price rises were for new dwelling purchase by owner-occupiers (5.6% vs 5.5% WBC), automotive fuel (4.2% vs 4.0% WBC). What did surprise us a little was the strength of the gains for food (2.0% vs 1.5% WBC), clothing & footwear (3.5% vs 1.2% WBC) and household furnishings, equipment & services (2.5% vs 1.5% WBC).
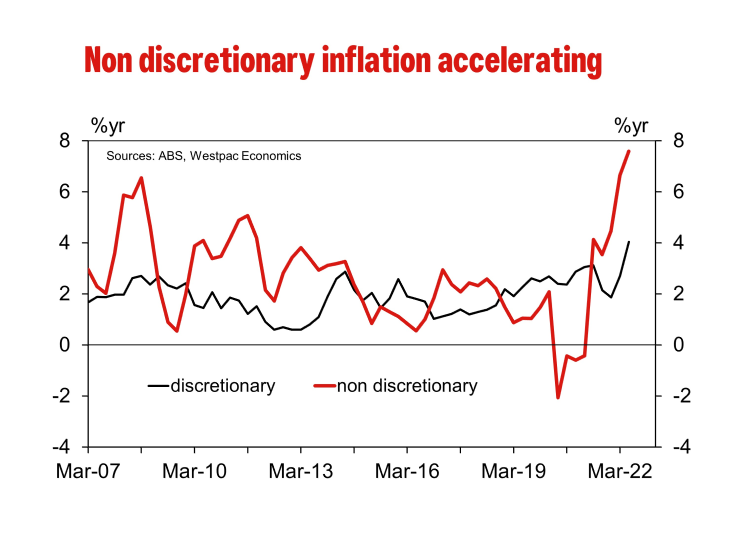
In their report the ABS noted that the price of goods (2.6%) continued to rise more strongly than that of services (0.6%) in the June quarter. As noted above it was in food and the furnishings, household equipment & services. Main contributors to the rise in food prices included vegetables (7.3% vs 4.8% WBC), meals out and takeaway foods (1.4% vs 0.2% WBC), and fruit (3.7% vs 6.3% WBC). Supply chain disruptions due to flooding events, labour shortages, and rising freight costs contributed to higher prices. Furniture prices rose (7.0% 3.1% WBC) due to increased transport and material costs as well as stock shortages.
Services recorded a smaller rise compared with goods. Financial services (1.2% vs 0.4% WBC) and holiday travel and accommodation (2.3% vs 2.0% WBC) rose. Child care (-7.3% vs 1.0% WBC) fell as the full effect of additional child care subsidies for families with two or more children under the age of 6, which commenced on 7th March, flowed through into this quarter. Before and after school care vouchers offered by the NSW Government also contributed to the fall in child care costs. Urban transport fares (-4.4% vs 0.6% WBC) fell due to free travel periods introduced by the NSW and Tasmanian State Governments within the quarter.
We are processing this data and will review the implications for our CPI forecasts.
Technical Outlook and Review
DXY:
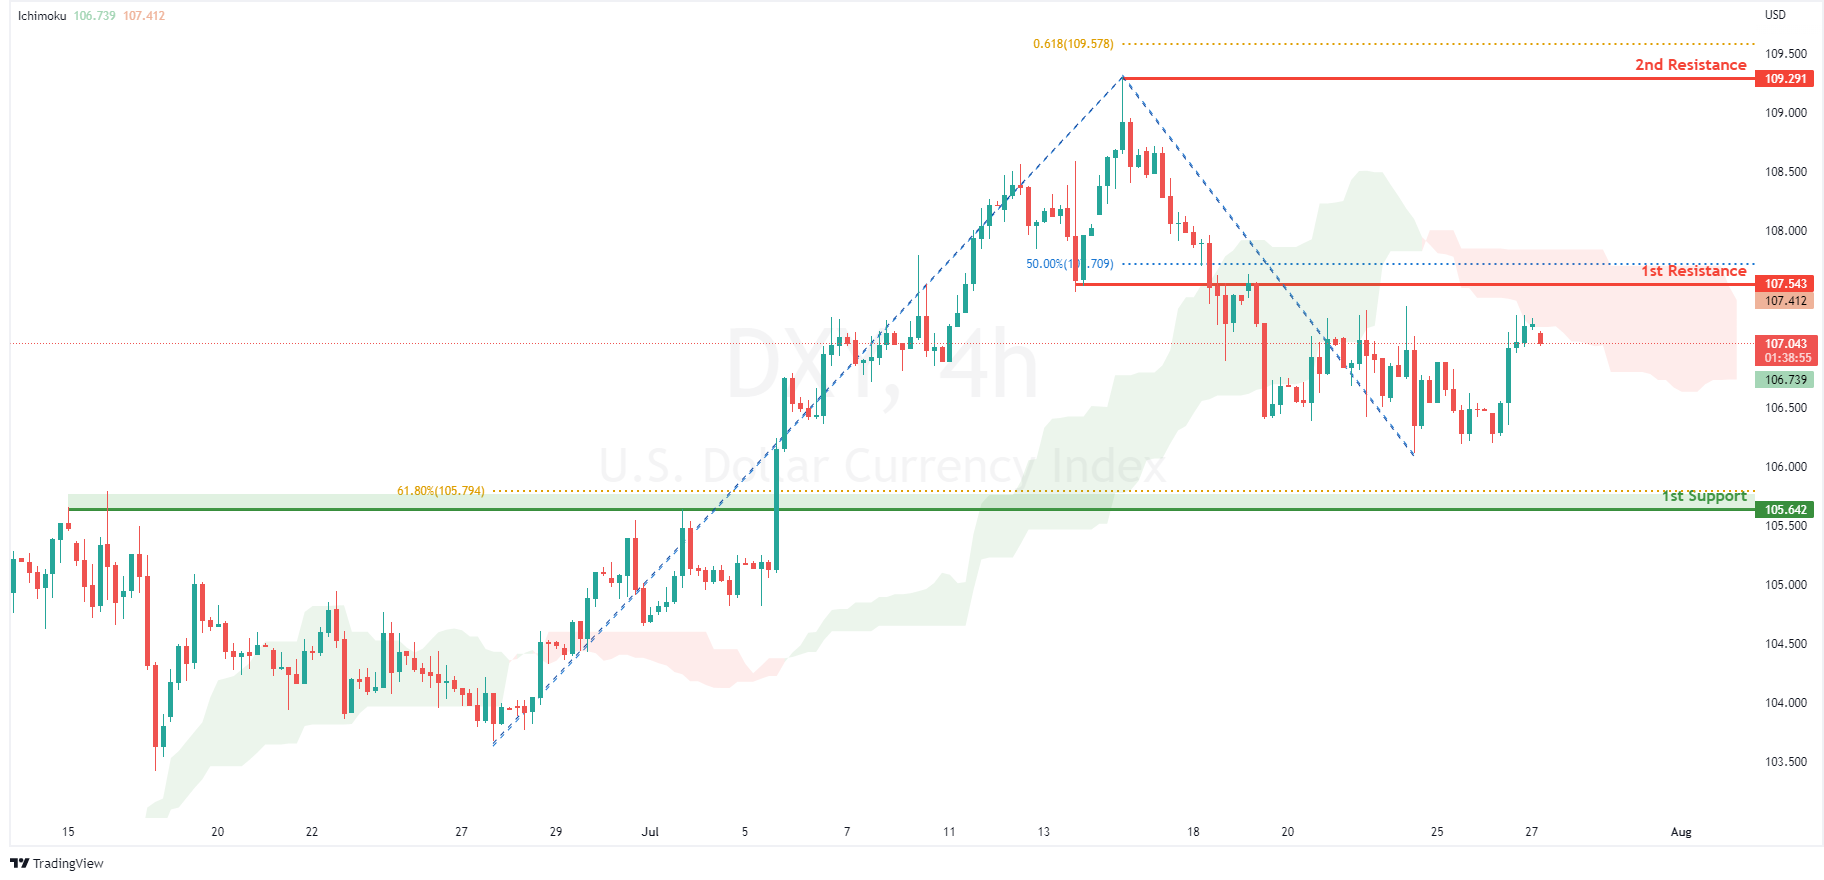
On the H4, with prices reversing off the ichimoku indicator, we have a bearish bias that prices will drop to the 1st support at 105.642 in line with overlap support and 61.8% fibonacci retracement from the 1st resistance at 107.543 where the pullback resistance and 50% fibonacci retracement are. Alternatively, price could break 1st resistance and rise to 2nd resistance at 109.291 where the swing high resistance and 61.8% fibonacci projection are.
Areas of consideration:
- H4 time frame, 1st resistance at 107.543
- H4 time frame, 1st support at 105.642
XAU/USD (GOLD):
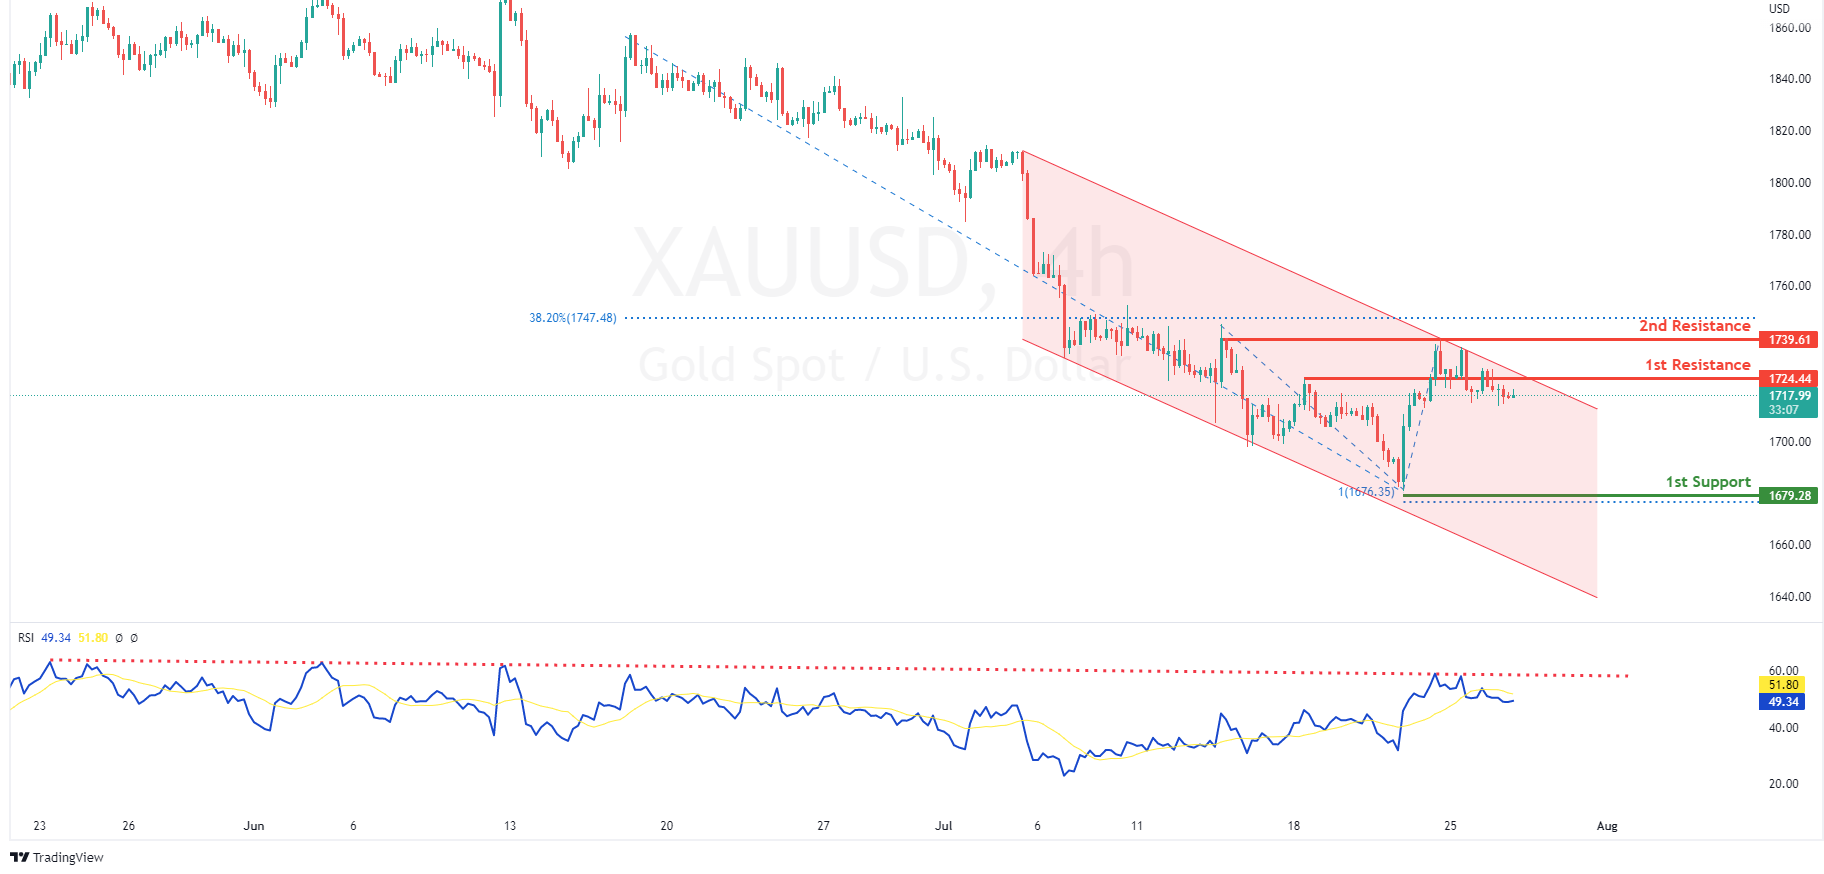
On the H4, with price moving within a descending channel and RSI moving along a descending trendline, we have a bearish bias that price will drop from 1st resistance at 1724.44 where the pullback resistance is to 1st support at 1679.28 in line with 100% fibonacci projection and swing low support on the daily timeframe. Alternatively, price could break 1st resistance and rise to 2nd resistance at 1739.61 where the 38.2% fibonacci retracement and swing high resistance are.
Areas of consideration:
- H4 time frame, 1st Resistance at 1724.44
- H4 time frame, 1st Support at 1679.28
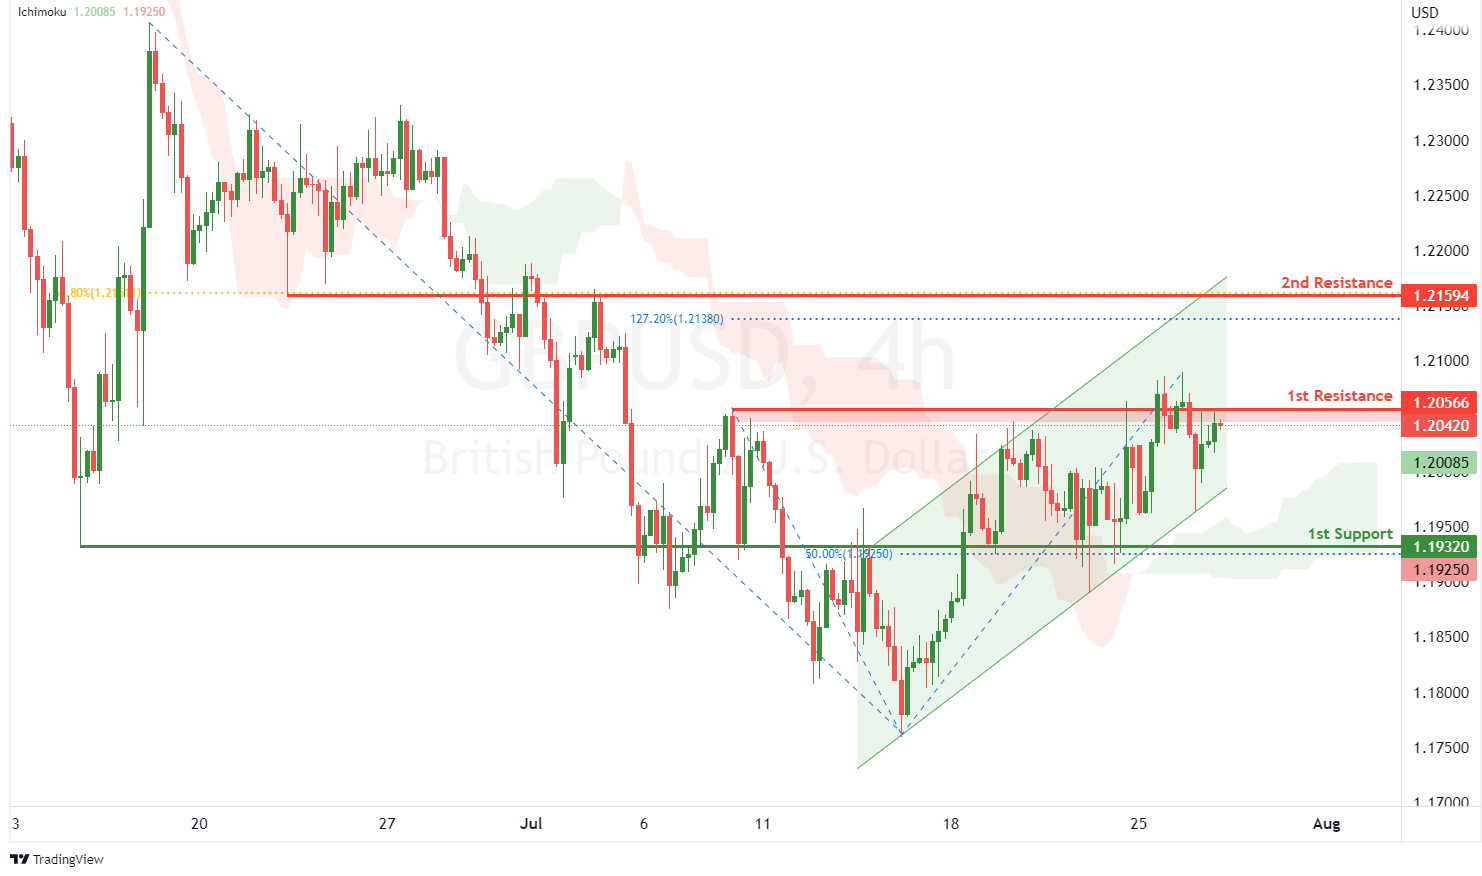
GBP/USD:
On the H4, with prices moving within an ascending channel and above the ichimoku indicator, we have a bullish bias that price will rise to the 1st resistance at 1.20566 where the pullback resistance is. Once there is upside confirmation of price breaking 1st resistance, we would expect bullish momentum to carry price to 2nd resistance at 1.21594 where the pullback resistance, 127.2% fibonacci extension and 61.8% fibonacci retracement are. Alternatively, price could drop to 1st support at 1.19320 where the pullback support and 50% fibonacci retracement are.
Areas of consideration:
- H4 1st resistance at 1.20566
- H4 1st support at 1.19320
USD/CHF:
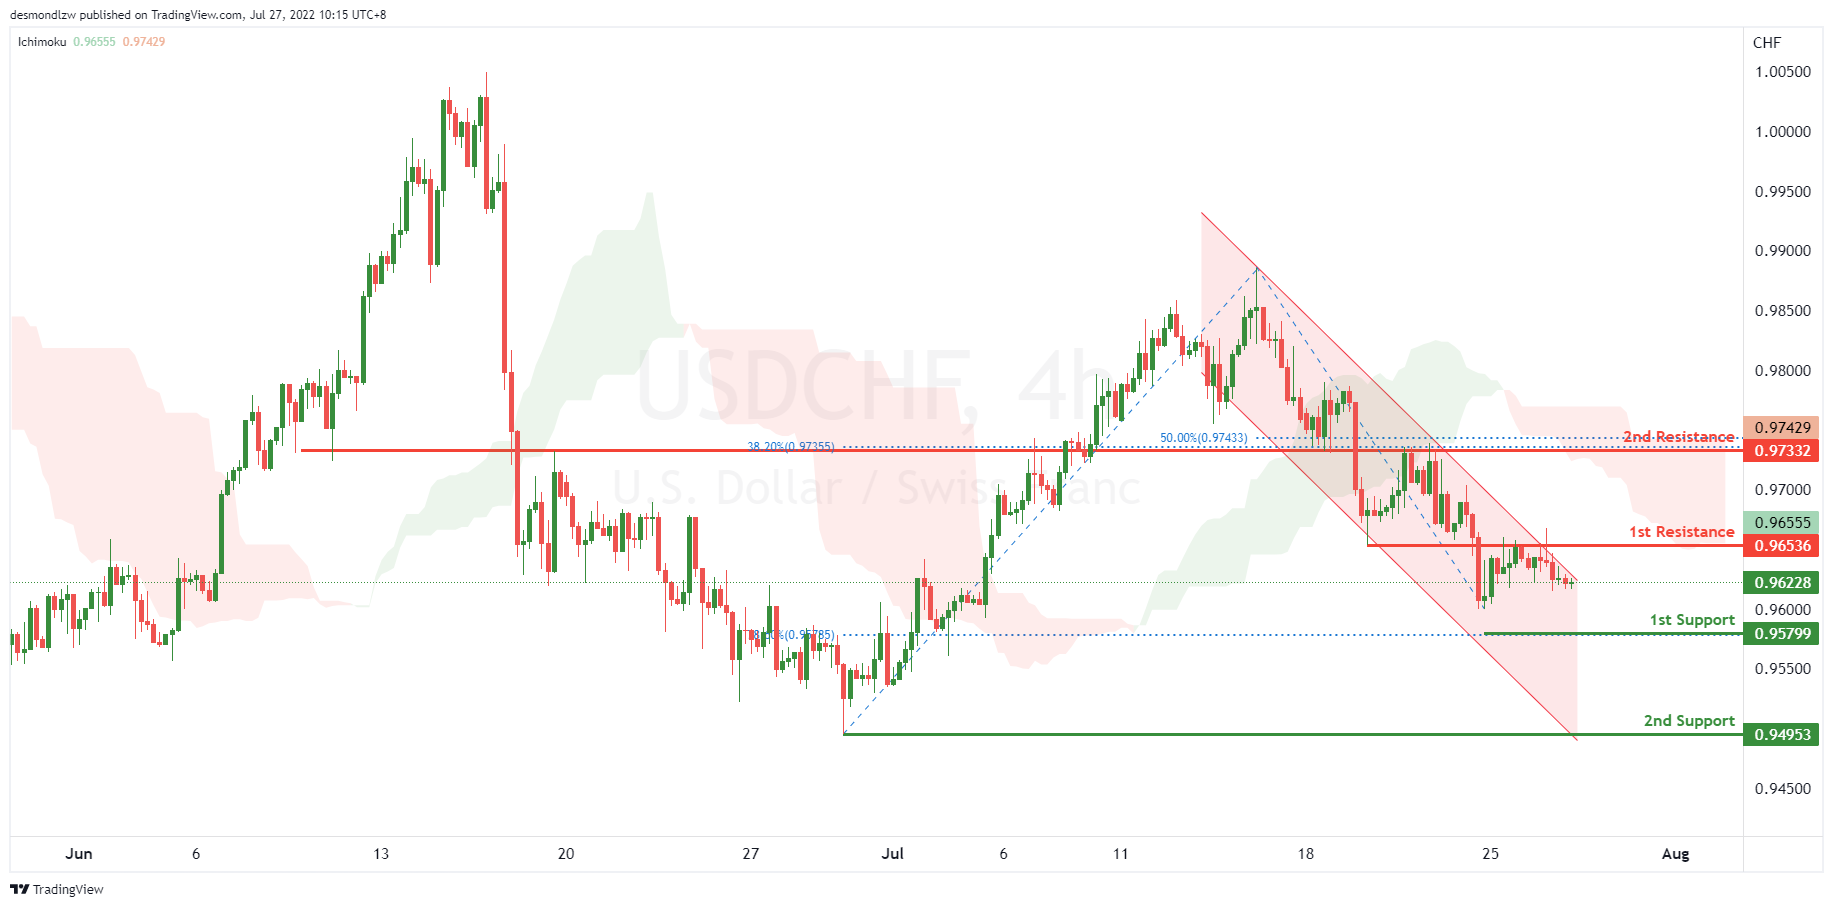
On the H4, with price moving along the descending channel, we have a bearish bias that price might drop from our 1st resistance at 0.96536, which is in line with overlap resistance to the 1st support at 0.95799, which is in line with 78.6% fibonacci retracement, if the price keep going down, it may drop to our 2nd support at 0.94953, which is in line with the swing low. Alternatively, price may break 1st resistance and head for 2nd resistance at 0.97332 where the 50% fibonacci retracement is.
Areas of consideration
- 1st resistance level at 0.96536
- 1st support level at 0.95799
EUR/USD :
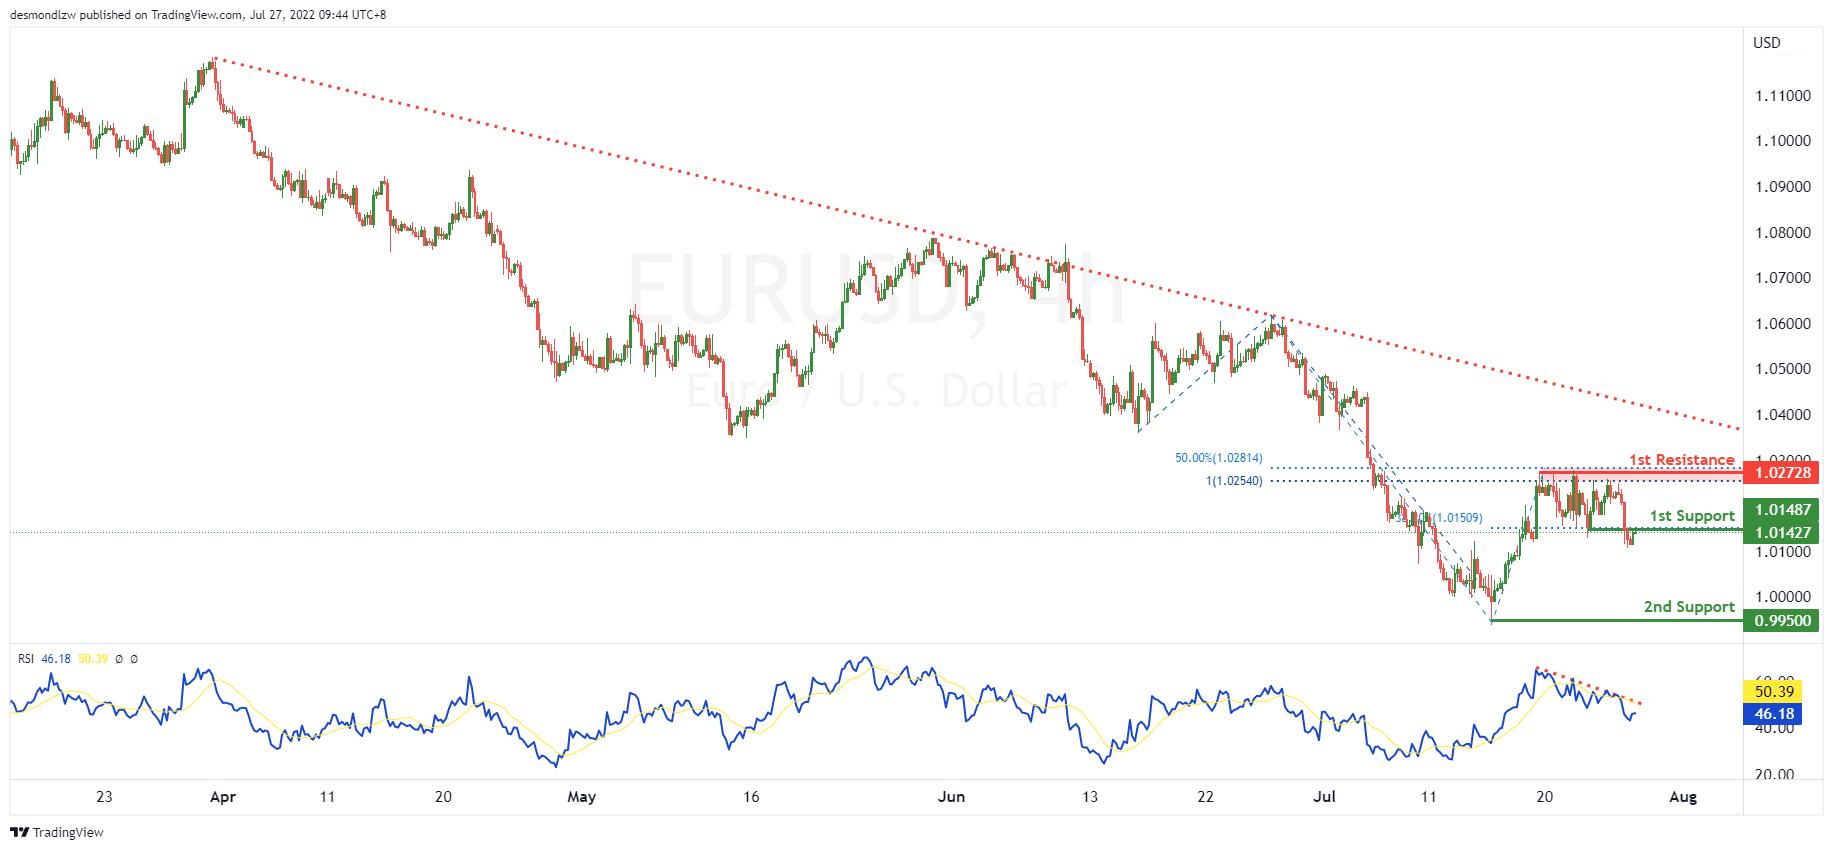
On the H4, with price moving in a descending trendline and RSI showing a descending trendline, we have a bearish bias that price will drop from the 1st support at 1.01487 in line with the 38.2% fibonacci retracement at the pullback support to the 2nd support at 0.99500 at the swing low. Alternatively, price may break through the 1st support and rise to the 1st resistance at 1.02728 at the swing highs in line with the 50% fibonacci retracement and 100% fibonacci projection.
Areas of consideration :
- H4 1st resistance at 1.02728
- H4 1st support at 1.01487
USD/JPY:
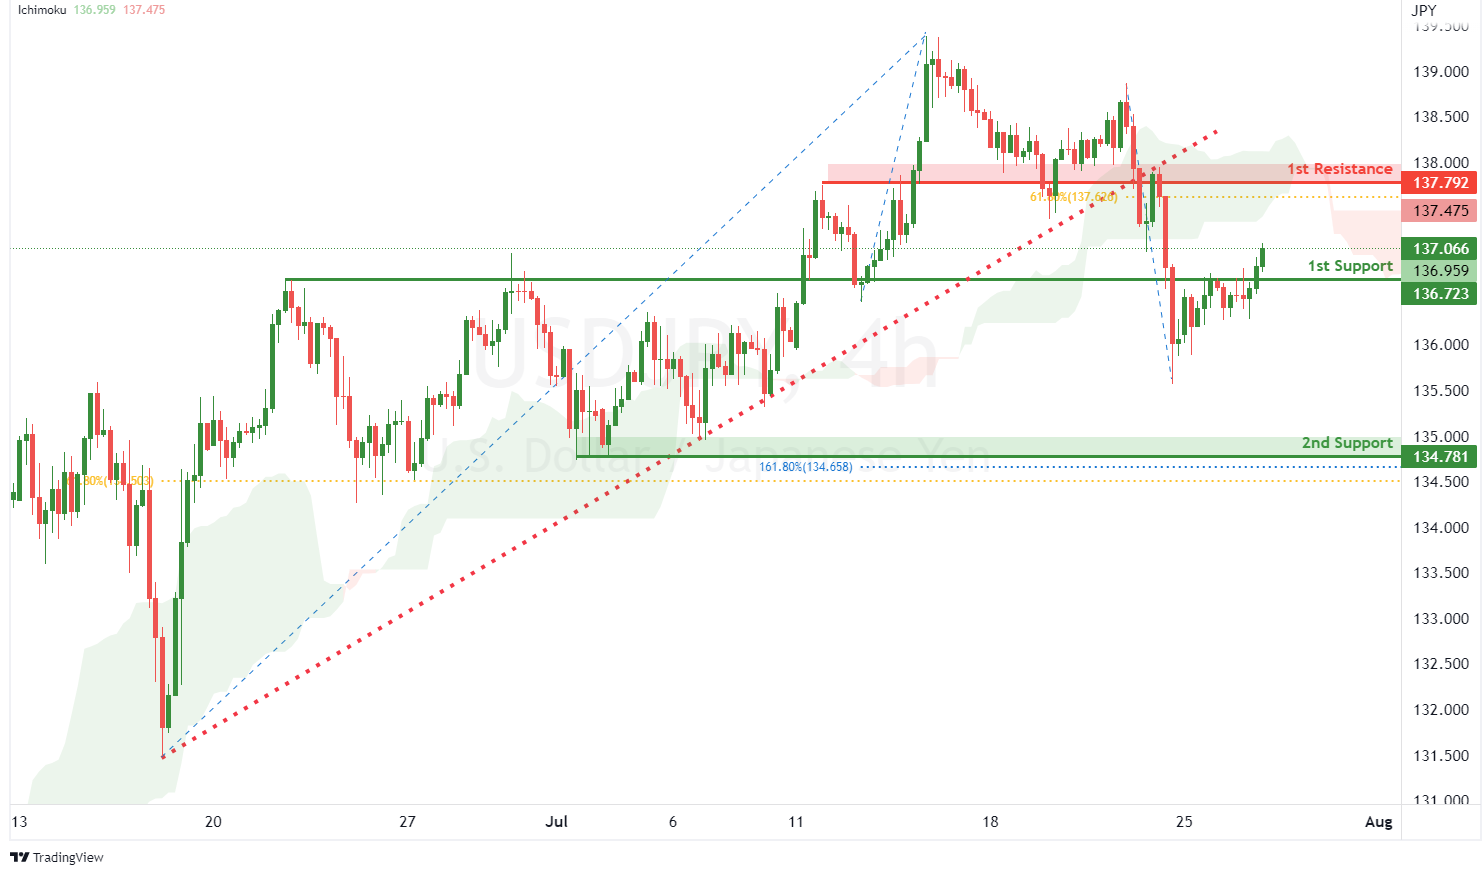
On the H4, with price broken out of the ascending trendline and moving below the ichimoku indicator, we have a bearish bias that price will drop to our 1st support at 136.723 where the overlap support is. Once there is downside confirmation of price breaking 1st support, we would expect bearish momentum to carry price to the 2nd support at 134.781 where the swing low support, 161.8% fibonacci extension and 61.8% fibonacci retracement are. Alternatively, price could head for 1st resistance at 137.792 where the pullback resistance and 61.8% fibonacci retracement are.
Areas of consideration:
- H4 time frame, 1st resistance at 136.661
- H4 time frame, 1st support at 134.781
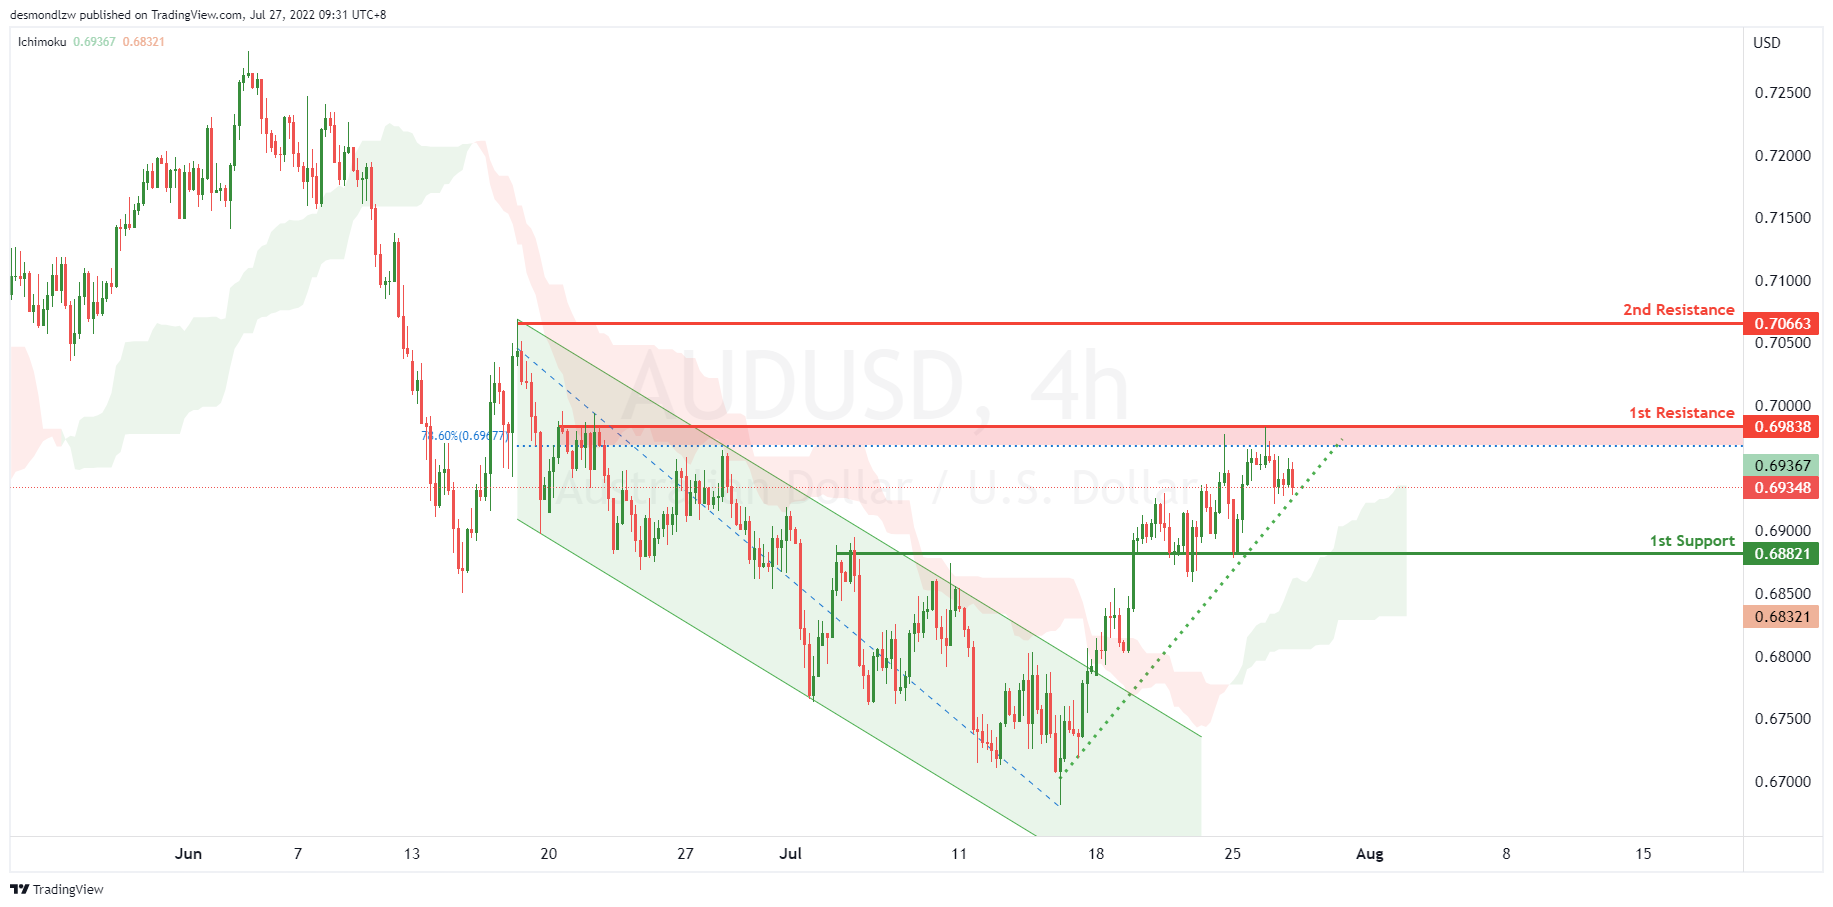
AUD/USD:
On the H4, with price moving above the ichimoku cloud and breaking out of the descending trend channel and moving in an ascending support, we have a bullish bias that price will rise from the 1st resistance at 0.69838 at the overlap resistance in line with the 78.6% fibonacci retracement to the 2nd resistance at 0.70663 at the swing high. Alternatively, price may reverse off 1st resistance and drop to the 1st support at 0.68021 at the overlap support.
Areas of consideration
- H4 1st resistance at 0.69838
- H4 1st support at 0.68021
NZD/USD:
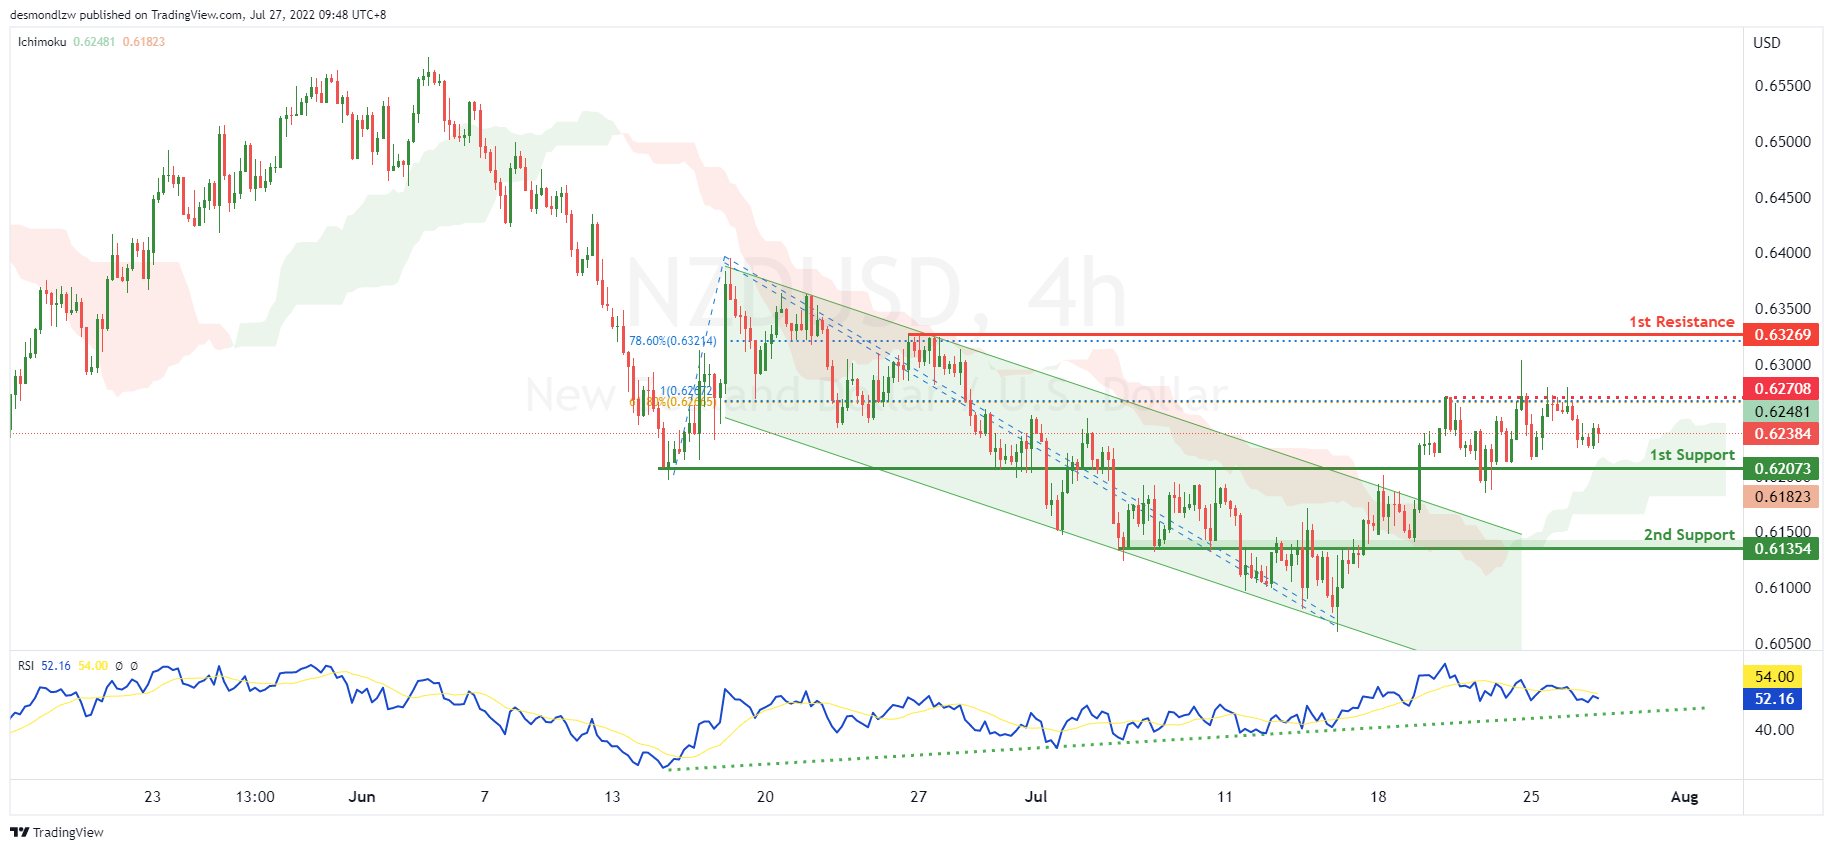
On the H4, with price breaking the descending trend channel, RSI showing an ascending trendline and moving above the ichimoku cloud, we have a bullish bias that price will rise from the 1st support at 0.62073 at the overlap support. If price breaks the intermediary resistance at 0.62708 at the swing high in line with the 61.8% fibonacci retracement and 100% fibonacci projection, we will have upside confirmation that price will rise to the 1st resistance at 0.63269 at the swing high in line with the 78.6% fibonacci retracement. Alternatively, price may break the support structure at the 1st support and drop to the 2nd support at 0.61354 at the pullback support.
Areas of consideration:
- H4 time frame, 1st support at 0.62073
- H4 time frame, 1st resistance at 0.63269
USD/CAD:
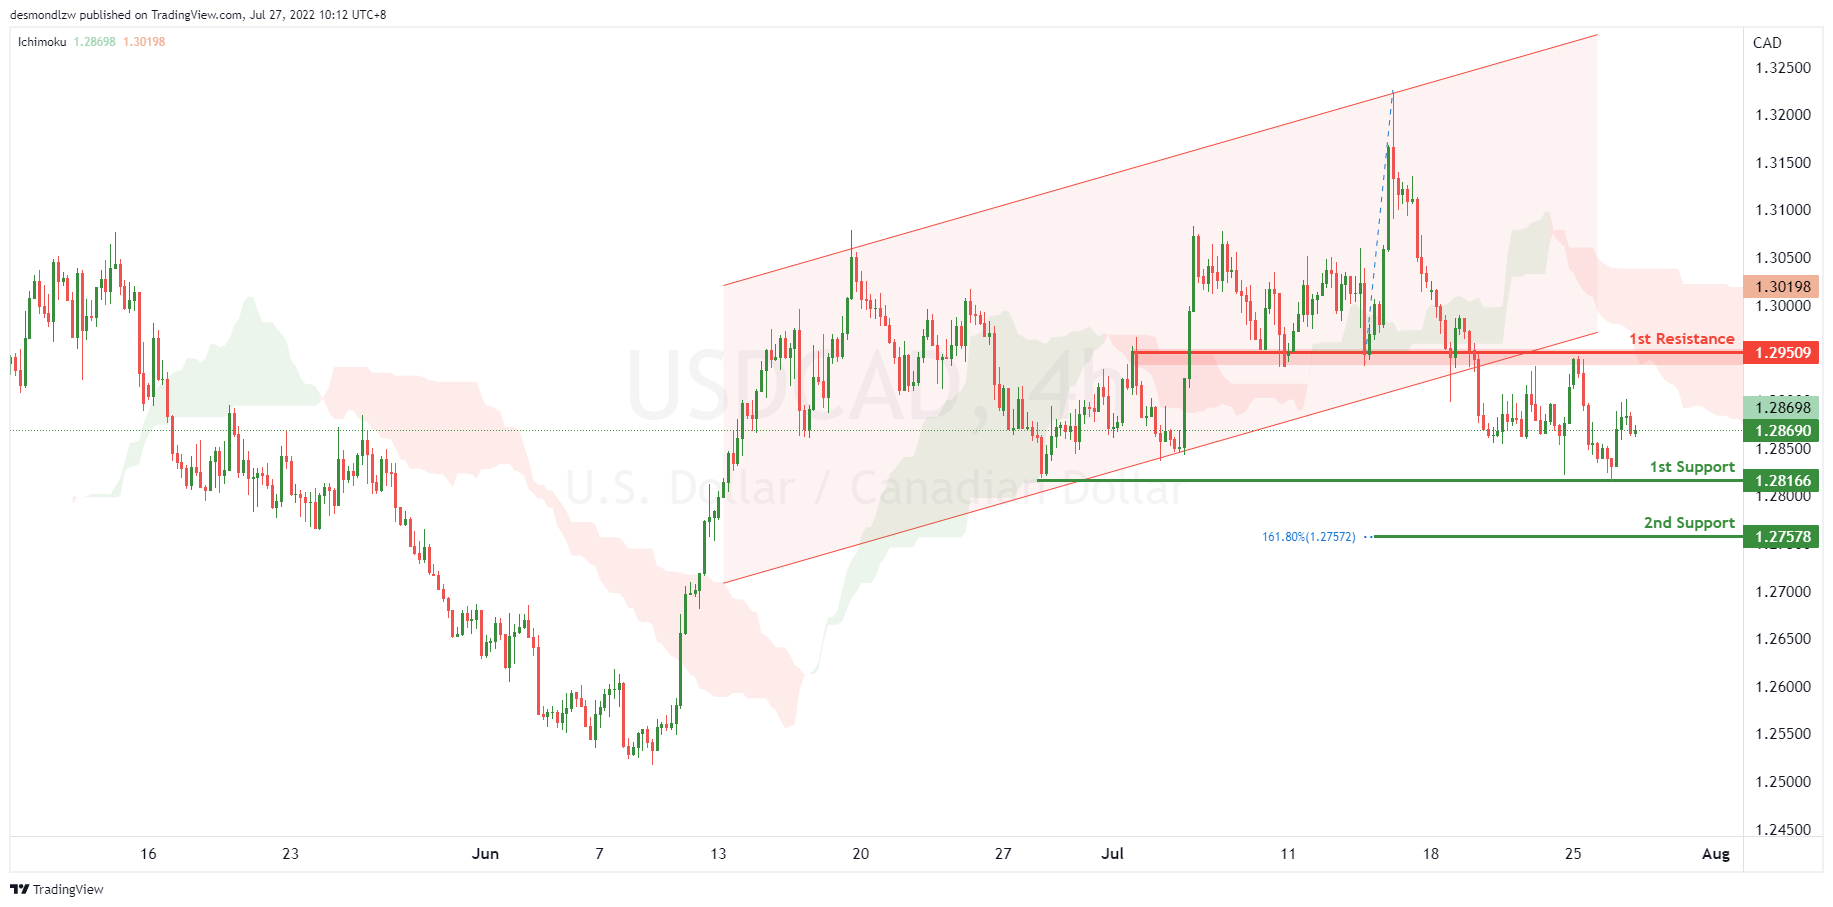
On the H4, with the price breaking the ascending channel, we have a bearish bias that the price may drop from our 1st support at 1.28166, which is in line with swing lows to our 2nd support at 1.27578, which is in line with the 161.8% fibonacci extension. Alternatively, the price may rise to the 1st resistance at 1.29509, which is in line with the overlap resistance.
Areas of consideration:
- H4 time frame, 1st support at 1.28166
- H4 time frame, 2nd support at 1.27578
OIL:
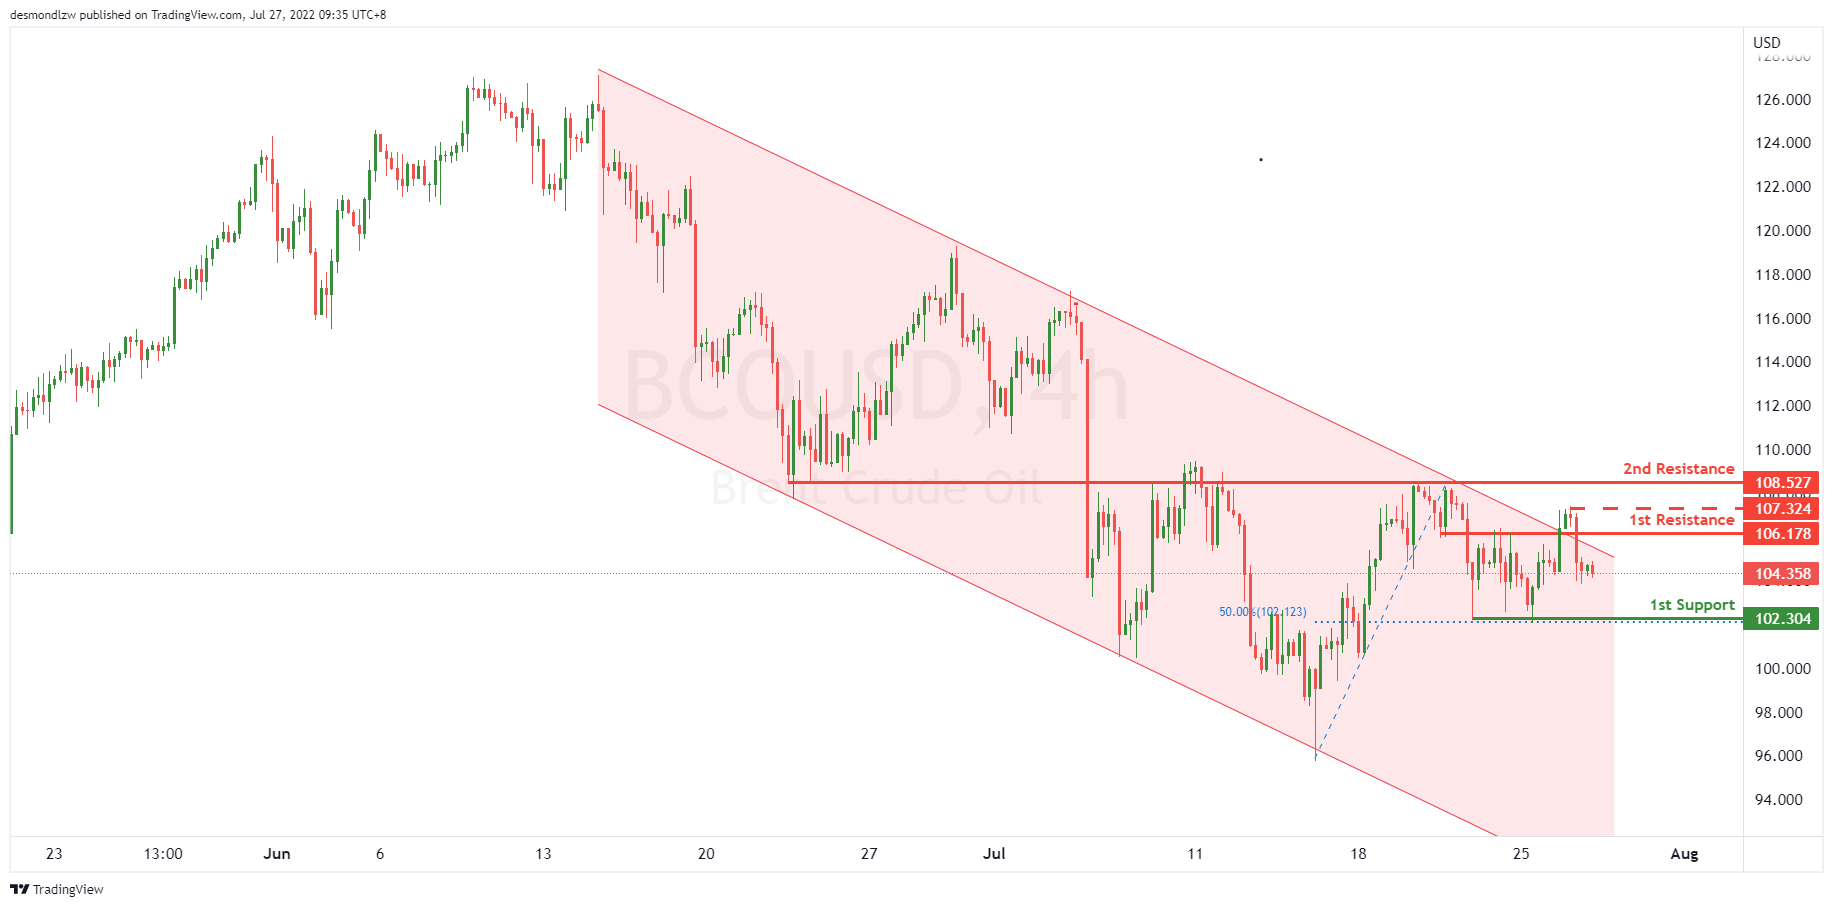
On the H4, with price moving along the bearish channel, we have a bearish bias that price might drop from our 1st resistance at 106.178, which is in line with the close swing high price to our 1st support at 102.304, which is in line with 50% fibonacci retracement. Alternatively, as the price is almost at the upper bound of the channel, the price may rise to 2nd resistance at 108.527, which is in line with overlap resistance. Take note the breakout point of 107.324 could be our intermediate resistance, which dropped after breaking the descending channel.
Areas of consideration:
- H4 time frame, 1st resistance of 106.178
- H4 time frame, 1st support of 102.304
Dow Jones Industrial Average:
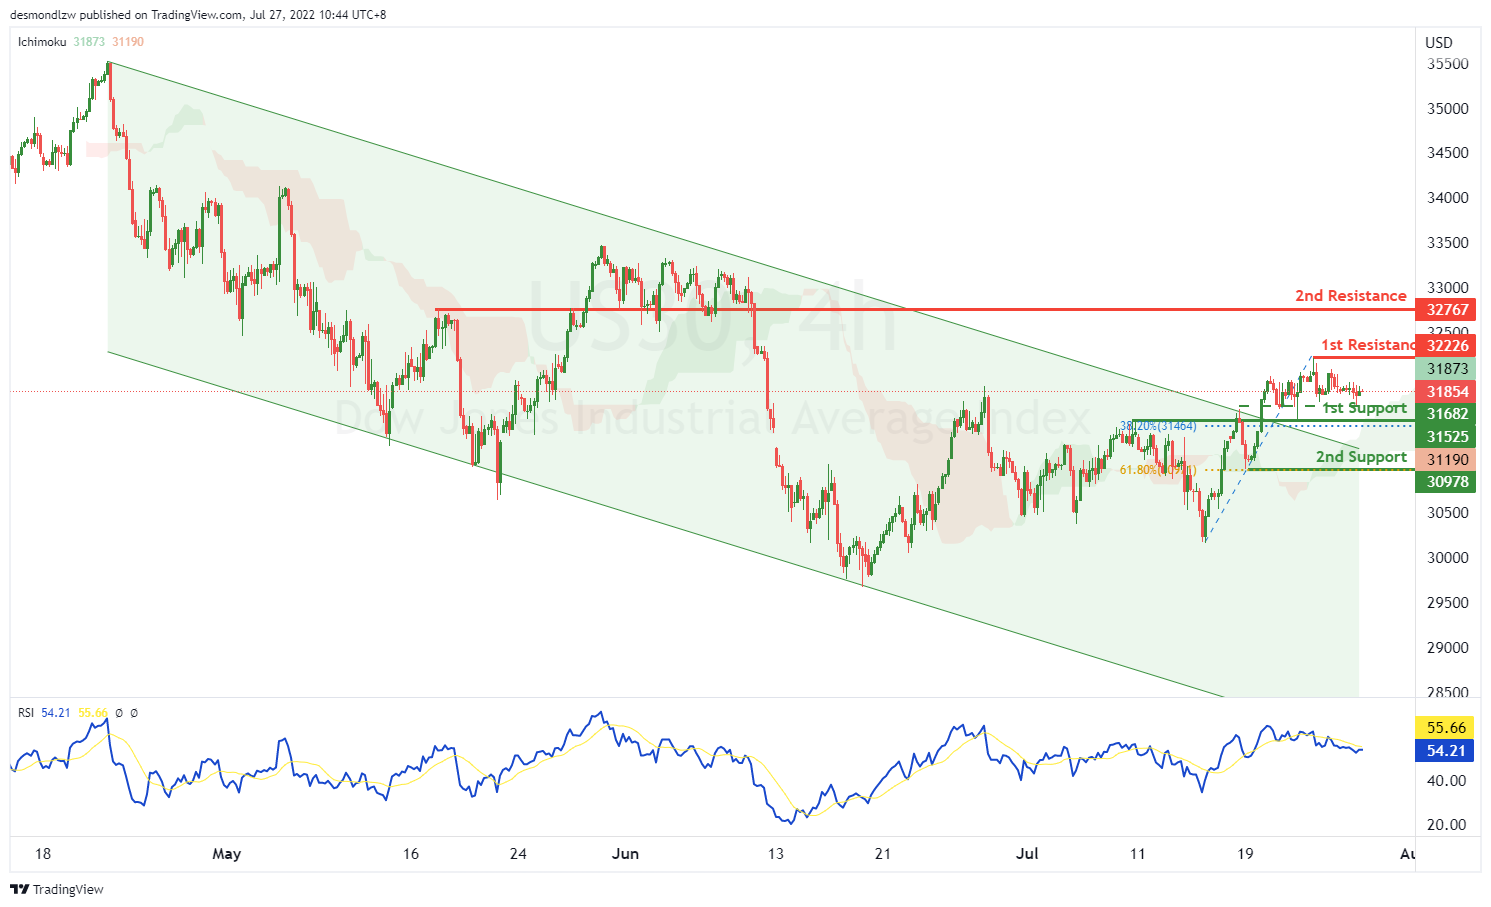
On the H4, with price moving with a bearish channel and having a bullish break, we have a bullish bias that price might rise from our 1st resistance at 32227, which is in line with the swing highs to our 2nd resistance at 32767, which is in line with overlap resistance. Alternatively, price may reverse off the 1st resistance and drop to the 1st support at 31525, which is in line with the overlap support and 38.2% fibonacci retracement, if the price keeps going down, it may drop to our 2nd support at 30978, which is in line with 61.8% fibonacci retracement. Take note the price is testing the support of 31682.
Areas of consideration:
- H4 time frame, 1st resistance of 32227
- H4 time frame, 2nd resistance at 32767
USD/JPY: Cautious Ahead of the Fed
- USD/JPY's ascendance showing potential signs of cooling
- Insufficient evidence yet of any dramatic retracement or reversal
- 135 and 131.50 are key levels to watch
Warning Signs Flashing
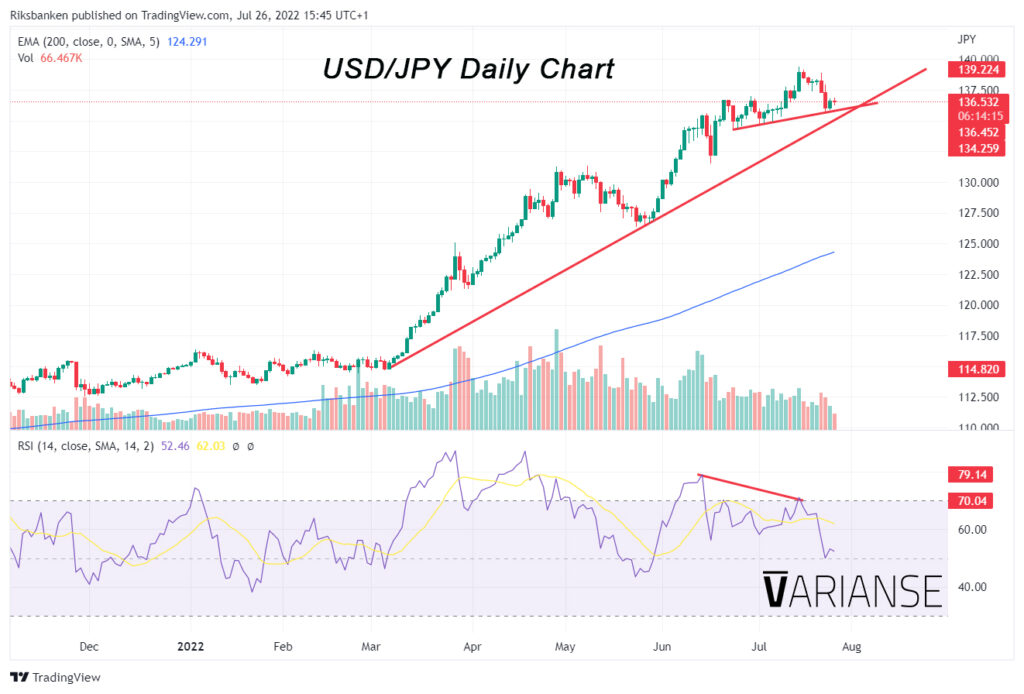
USD/JPY has been one of the latest entries into my higher frequency watchlists after price failed to make a substantive new higher low on the 22 July. As a result, I’m more vigilant for possible signs of reversal and see some pretty big risks buying ahead of Wednesday’s Fed decision. I’m too worried that either the 21 June 22 high of 136.710 or 29 June 22 high of 137.005, mark the first shoulder in a yet to be formed head and shoulders pattern or set the path toward a double top or triple tip formation. RSI divergence between the 14 June swing high of 135.495 and the subsequent 14 July swing high of 139.394 also adds to my new found caution.
Waiting for a Catalyst
Still, ample evidence to suggest that USD/JPY has reached its peak is lacking. Granted, down by c. 19% against the US dollar year to date, the Japanese yen has been the worst performing currency, but that alone doesn’t mean it is ripe for a reversal. Most of the fundamental conditions that have led the pair higher haven’t shifted; aggressive Fed tightening vs. ultra loose monetary policy from the BoJ persists, as do high energy prices and fears of global recession. In my opinion, the fundamental catalysts needed to reverse the yen’s fortunes, although brooding, have yet to appear.
Key Levels to Be Broken
Likewise, price is still well above its 200-day exponential moving average. This makes me cautious of being too bearish USD/JPY, even if the gap between the current price and the moving average look extreme. Were price to break below 135 underpinned by decent volumes I might become more convinced that USD/JPY’s fortunes have taken a shift for the worse. Even more substantive, would be a sustained break below the 131.50 level. At the moment, we are still a long way off from that level.
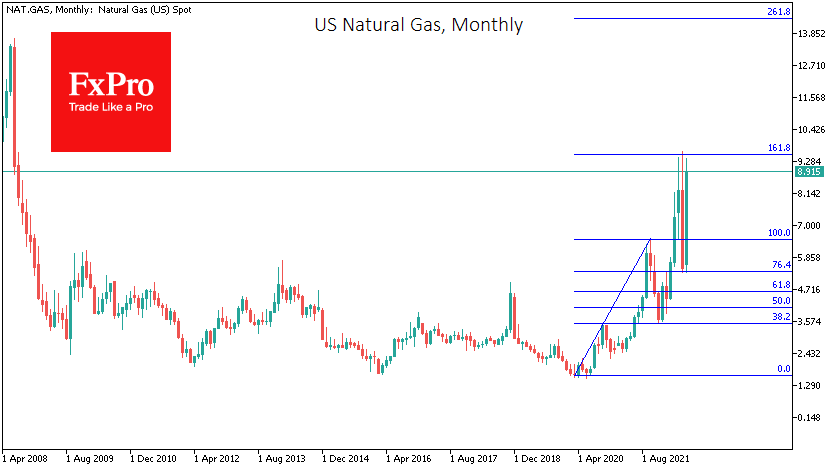
US NatGas Price Strives to Rewrite 2008 Highs Above $13.5
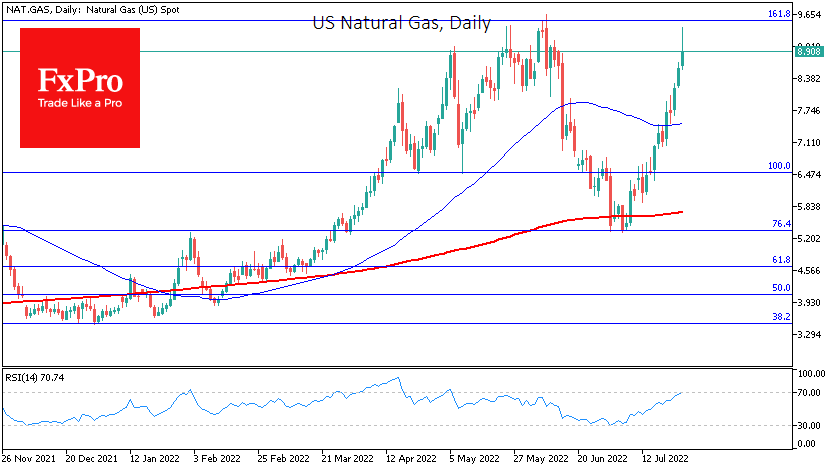
The gas story is in no hurry to leave the news headlines, and prices for the energy sector are behaving accordingly. In Tuesday’s trading in Europe, prices returned to the psychologically crucial round level of $2,000 per 1,000 cubic metres – around the December peak and the highest since mid-March.
Gas on the trading floor in the Netherlands closed above the current level of 2033 for only three days in early March. But then, due to logistical difficulties, gas prices in the US moved in a counter-phase.
Now that the USA is heralded as the world’s leading LNG exporter, gas prices in Europe and the USA are moving in the same direction. As a result, Natural Gas prices have risen by more than 7% in New York, exceeding $9.1 per 1,000 Btu, close to the highs of early June.
While the geopolitical situation has changed little in the meantime, and oil and gasoline prices have retreated significantly from the highs of early June, the nearest gas futures price has risen by more than 70% in the past 20 days.
Despite a fivefold increase from the lows of two years ago and proximity to the year’s extremes, US gas has ample upside potential. The price was above $13.5 in mid-2008, and the supply situation is much worse now that relatively wealthy Europe needs gas. In contrast, at that time, developing countries were pulling prices up against the recession-stricken US and UK.
Short-term price dynamics are determined more by uncertainty about supplies from Russia and the ability to replace them with other countries than by a persistent link to the economic growth rate.
The situation leads us to the view that we will see more sharp market movements soon, related both to technical factors (short squeeze) and sentiment as well as to attempts by consumer country politicians to disrupt the one-way move in this market.
July appears to be the start of the sharpest wave of strengthening in gas prices, with the potential target being the $14 area – above the 2008 highs – where the price could end up in the next two months.