

Sample Category Title
Renminbi ($USDCNH) Started A Correction Phase As Expected
In the last years, the renminbi made a pause in his attempt to get stronger against USD dollar. On February 2014, renminbi found support at 6.0153 and from there it made a perfect zig – zag correction structure to equal legs at 7.1964 in June 2020. After that, the USDCNH continue with the downtrend.
Renminbi December 2021 Weekly Chart
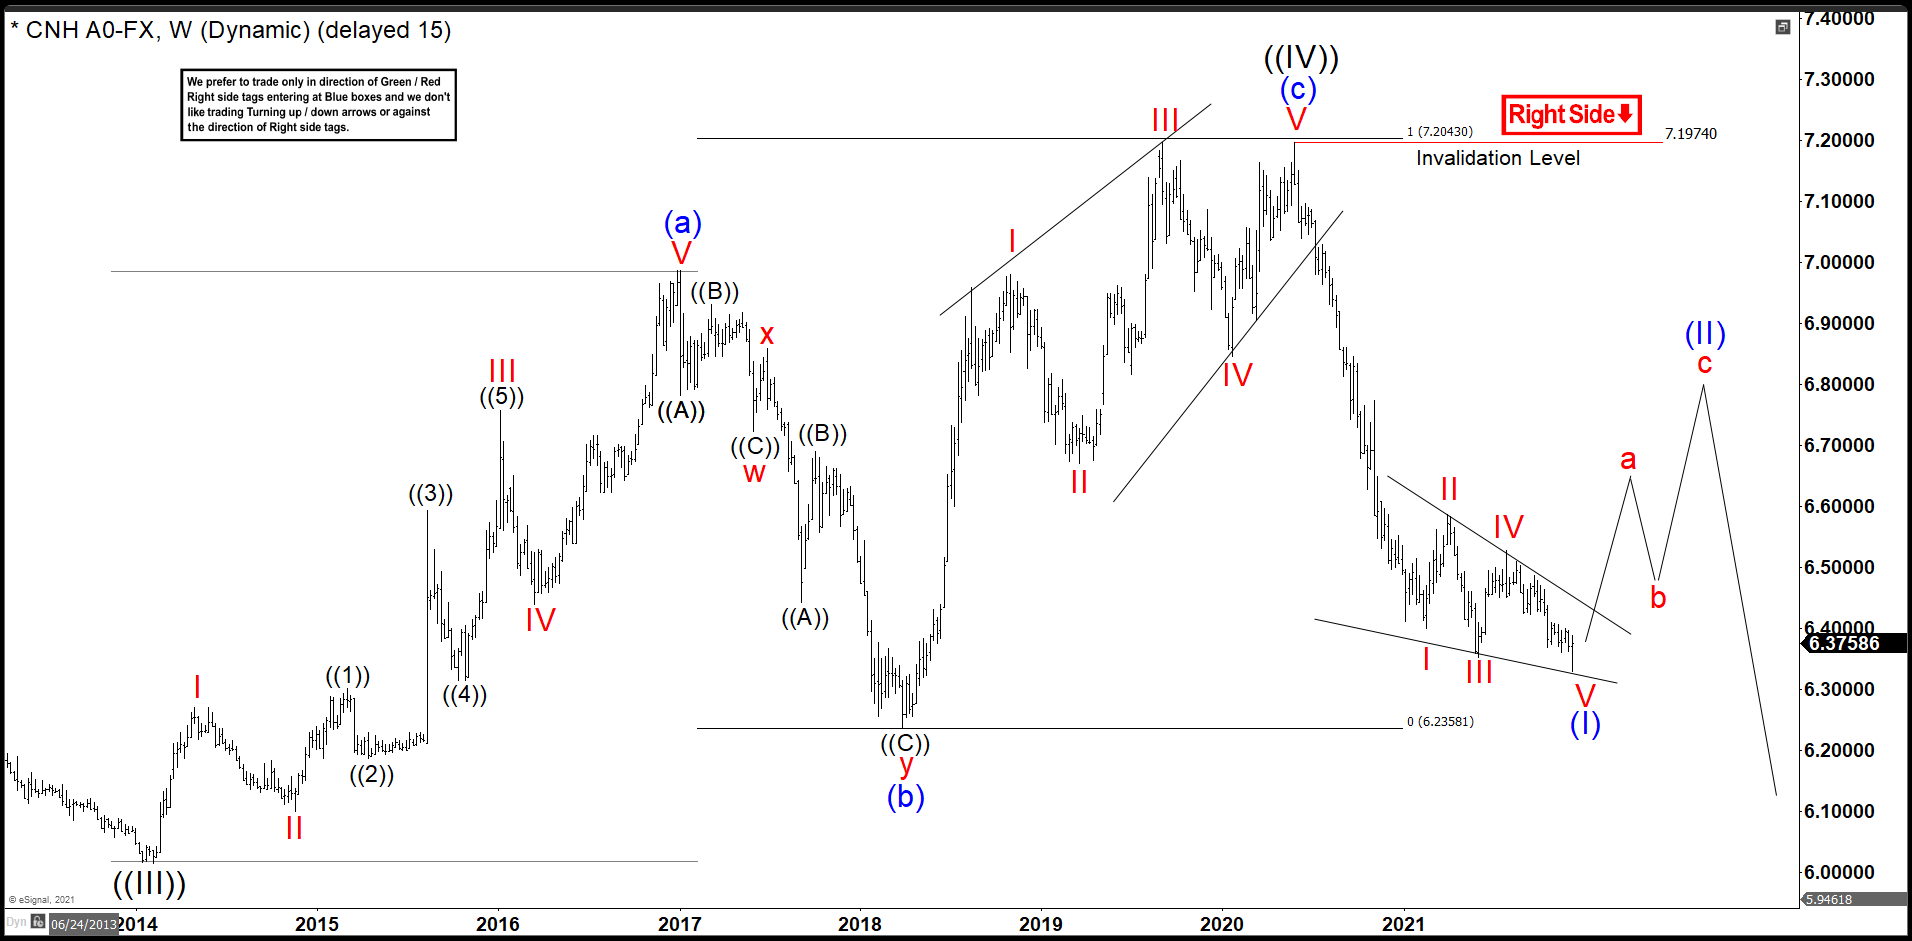
The wave (a) began at 6.0153 and moved high in a 5 waves structure almost hit 7.00 dollars ending at 6.9854. After this 5 waves impulse, we have a huge drop to 6.2359 developing a double correction structure to end wave (b). The volatility did not leave things like that an enormous rally took place in the beginning of wave (c). This movement developed again 5 waves higher, but in this occasion as an ending diagonal structure. Wave (c) finished at 7.1974 reaching the equal leg extension, using Fibonacci tool, taking wave (a) from wave (b) to get wave (c) at 100% Fibonacci extension.
This zig zag structure took place as wave ((IV)), it is telling us that the renminbi should appreciate against the USD in long term. In June 2020, the pair dropped again possibly doing a leading diagonal, that was the pattern we drew in the chart. If that structure played out we should see a bounce before continue with downtrend. (If you want to learn more about Elliott Wave Theory, please follow these links: Elliott Wave Education and Elliott Wave Theory).
Renminbi July 2022 Weekly Chart
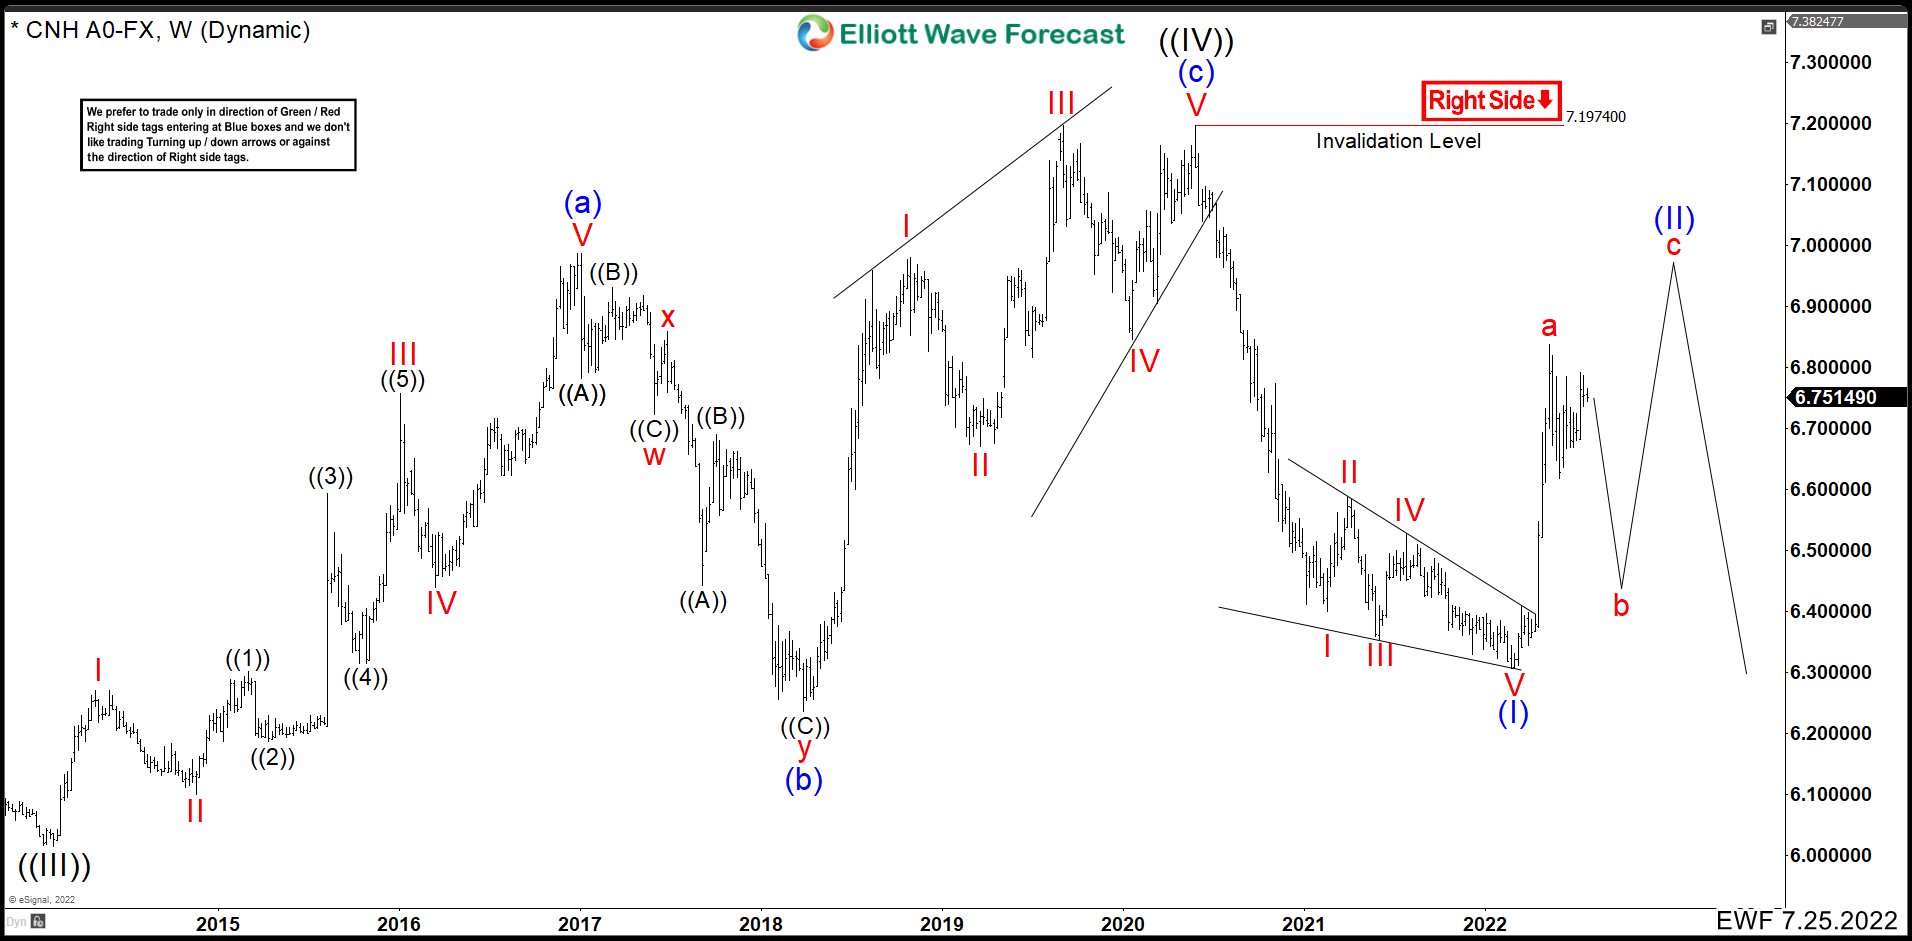
Renminbi July 2022 Weekly ChartAfter six months, we could see that the leading diagonal played out bouncing hard from 6.3052 where we called wave (I) ended. This move higher looks like an impulse and we labeled as wave a ended at 6.8387. We need at least 3 swings to complete a corrective pattern as wave (II); therefore, we are calling a drop to complete a wave b and then higher again above 6.8387 to end wave c fo (II) and turning lower again.
Only a break lower of 6.3052 level will confirm that wave (II) is completed and the bearish trend will continue. For long term traders the USDCNH, certainly, must break 6.0153 in sometime.
Bitcoin Settles at $21K ahead of FOMC
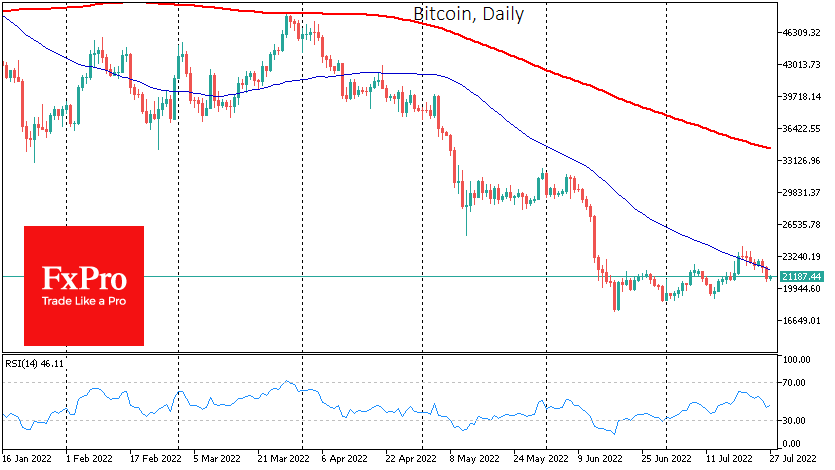
Bitcoin is clinging to the $21,000, having changed little in the past 24 hours, while Ethereum is adding 1.7% overnight to $1450. Prices of the top altcoins range from -0.6% (Cardano) to +4.2% (BNB).
The total capitalisation of the crypto market, according to CoinMarketCap, rose 0.85% to $978bn overnight.
Bitcoin came under increased pressure on Tuesday, but the sell-off stalled during the New York trading session as it was supported by buying on declines below $21K.
Markets await the US Federal Reserve’s rate decision to be announced on Wednesday and are set to see the Fed’s another 75 points hike, but futures are pricing a 20% chance of a 100-points hike. Some speculators are rushing to bet that we will see a relaxation rally when the most pessimistic expectations do not come true.
According to CoinShares, capital inflows into crypto funds last week amounted to $30M, of which $19M for BTC. At the same time, investments in funds, which allow opening shorts on bitcoin, dropped sharply (to $0.6M). The previous week’s total capital inflows sharply revised from $12M to $343M.
The number of ransomware attacks fell by 23% amid the decline in the crypto market, SonicWall noted.
The US Commodity Futures Trading Commission (CFTC) will create a new Office of Technology Innovation to regulate the cryptocurrency industry.
According to Bloomberg, the US Securities and Exchange Commission is conducting a full-scale investigation into token listings on Coinbase that could be treated as securities.
USDJPY Moves with Weak Momentum Around 20-day SMA
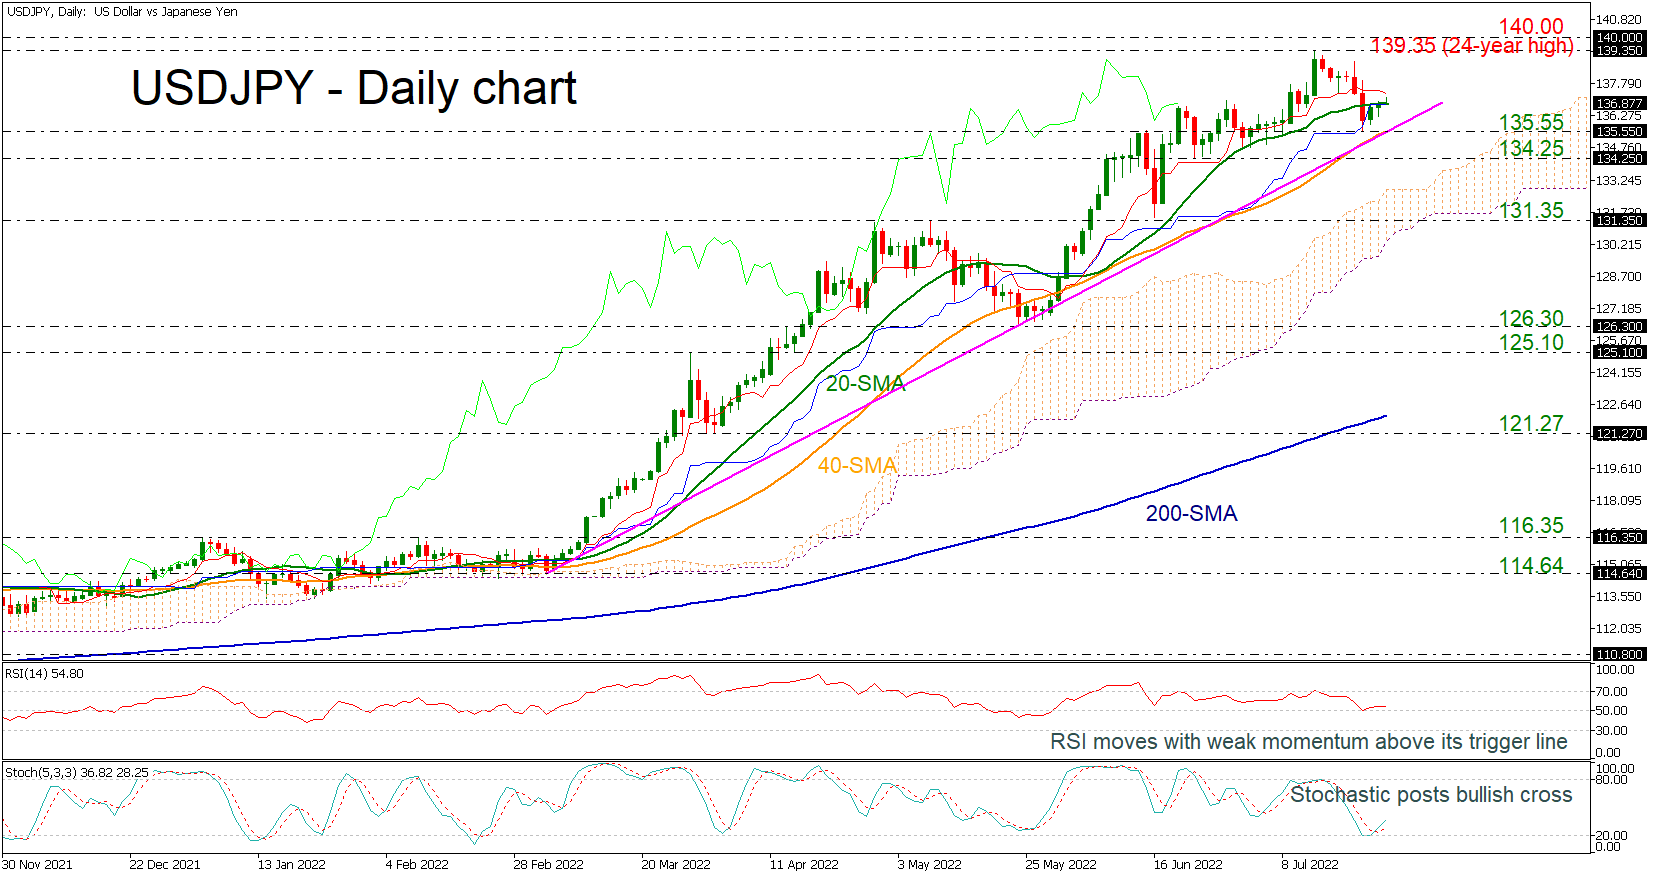
USDJPY found support at the 135.55 barrier, which holds near the medium-term ascending trend line but is still moving with weak momentum around the 20-day simple moving average (SMA).
Trend signals remain daunting as the price continues to trade near the Ichimoku lines, which proved to be a tough resistance area to overcome over the last couple of months. As regards the market momentum, some optimism seems to be building over an upside move as the RSI has paused its downtrend around the 50 level and the Stochastics have created a bullish crossover within its %K and %D lines.
In the event the bulls hold control, the 24-year high of 139.35 will come first into view. A violation at this point may see another challenging battle around the 140.00 psychological level. If buyers claim that zone this time, the 146.83 resistance, taken from the peak in June 1998, could immediately add some downside pressure.
Should the bears take the upper hand, driving the price below the uptrend line and the 135.55-134.25 support zone, the spotlight will shift to the 131.35 barrier, where any step lower will put the pair in a bearish mode in the medium-term picture. The long-term outlook will also face a deterioration if the decline extends below 125.10-126.30.
In brief, although USDJPY continues to face weak trend signals, the odds for an upturn seem to be growing, with the confirmation expected to come above the 24-year high.
Daily Technical Analysis
EUR/USD
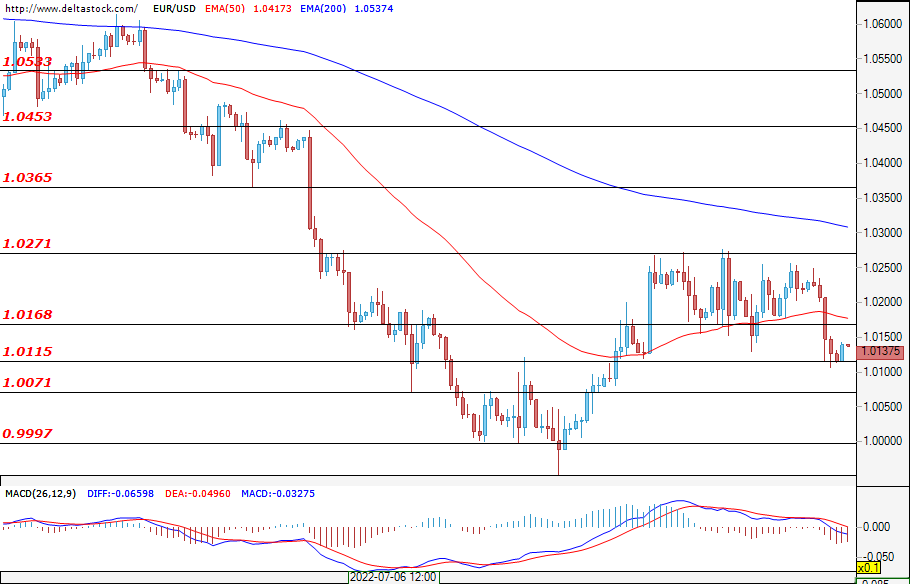
Today's trading session started calmly for the single European currency. Neither the bears, nor the bulls manage to take advantage. At the time of writing the analysis, the first major support would be at 1.0115. If the bulls manage to gain a preponderance, they will have to deal with the resistance at 1.0168, with the main obstacle being the level at 1.0271. There is a lot of macroeconomic news today that could cause a strong move in the currency pair, but investors' eyes will most likely be on the Federal Interest Rate decision news at 18:00 GMT and Powell’s press conference shortly after that, at 18:30 GMT. Given the present levels of inflation, a 1 percent increase should not be ruled out, despite current expectations for a 75 bps hike. Whatever the outcome, volatility will continue to be high and strong moves either direction can be expected.
USD/JPY
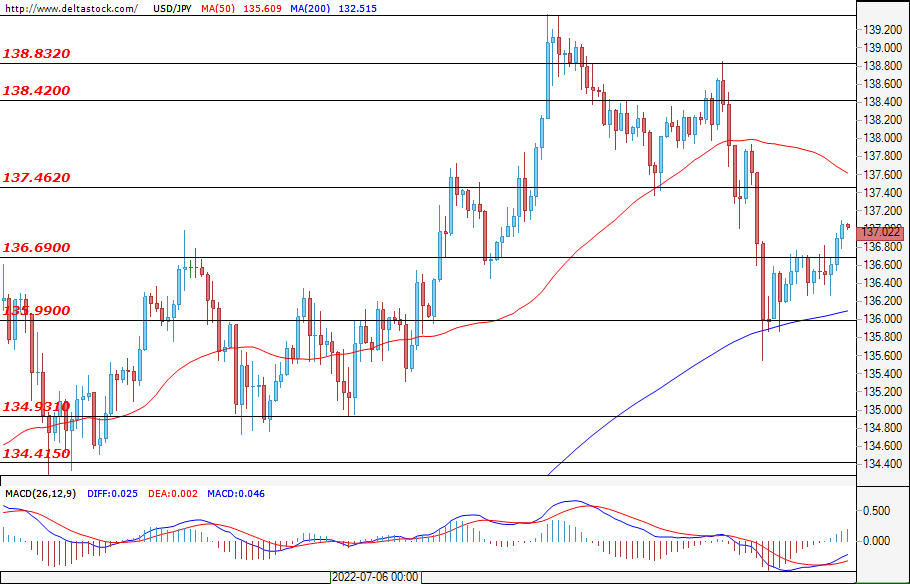
With the Ninja, the trading session began ambitiously for the bulls and, at the time of writing the analysis, they are headed for the first key resistance at 138.42. If the bears manage to reverse the first market moves of the day, they would most likely reach support at 136.69. A breach of the aforementioned level would increase the odds for a deeper sell-off towards the psychological support at 136.00.
GBP/USD
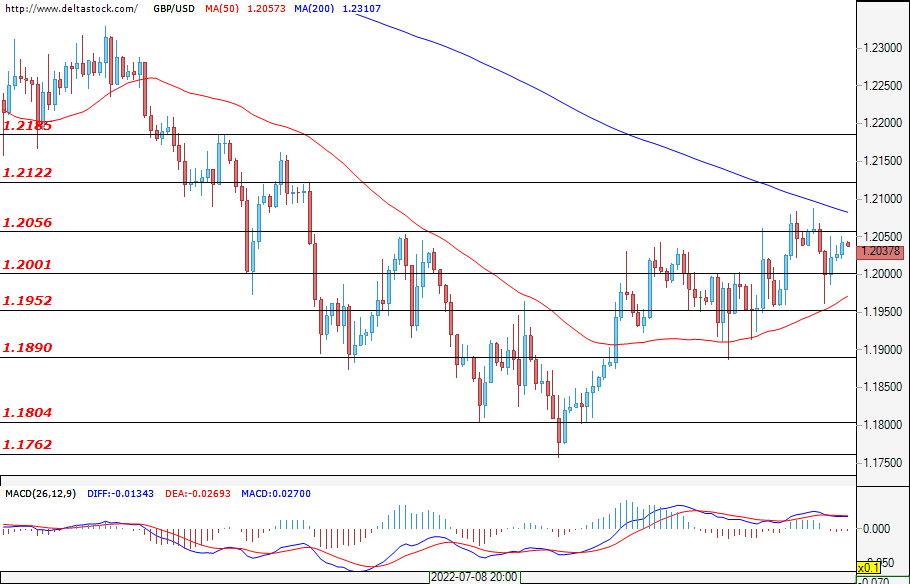
Over the last ten days, we are witnessing a consolidation in the range for the Sterling - 1.190 - 1.205. If the bulls succeed in breaking the range, the next resistance in front of them would be at 1.212. If, on the other hand, the bears manage to make a breakthrough, the next key support for them would be at 1.1952.
EUGERMANY40
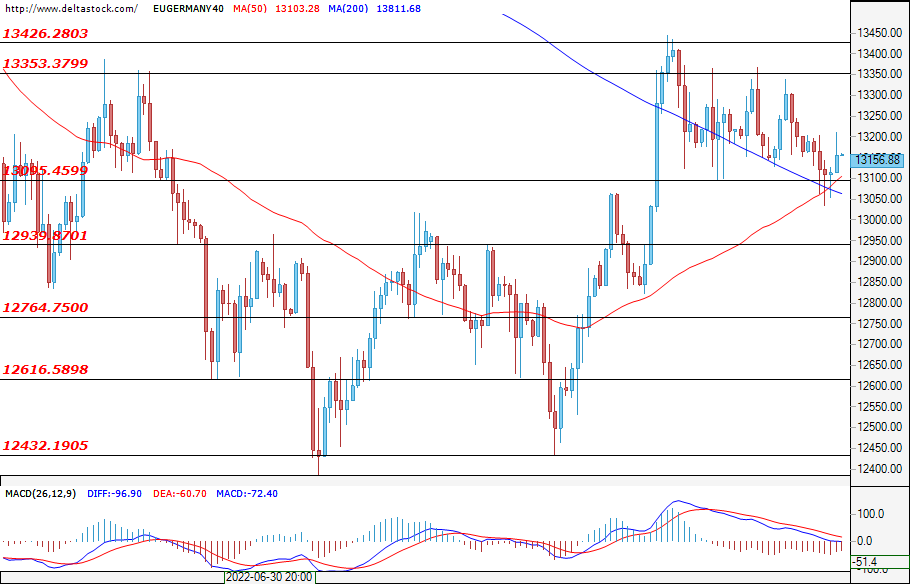
At the beginning of the trading session for the German index, we witnessed a "high start" for the bulls. EUGERMANY40 started the trading session around 40 points higher. However, their momentum slowed after that. If the bears manage to reverse the market sentiment, they will most likely have to deal with the support at 13095 first and then the support at 12940. If we do not see big moves in the index during today's trading session, the consolidation will continue between 13095-13350, which we have been observing in recent days. Today, the correlation with the U.S. indices is likely to persist and volatility will increase once the Fed releases its interest rate decision at 18:00 GMT.
US30
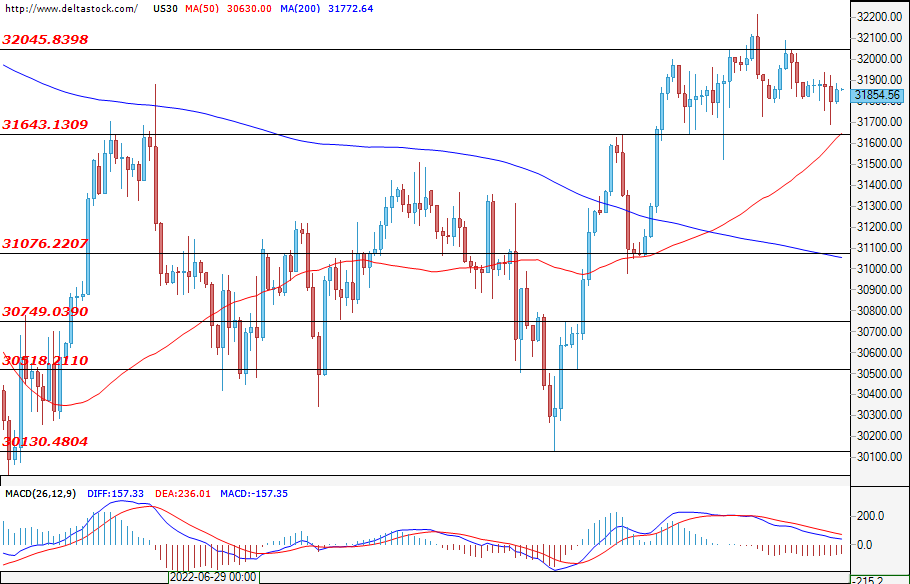
The trading session for the U.S. blue chips began without sharp movements. However, it appears unlikely that this will be the case throughout today's trading session. Strong moves are likely to be triggered by macroeconomic news: Durable Goods Orders (12:30 GMT) and Crude Oil Stocks (14:00 GMT), with the strongest effect probably being the Fed Interest Rate Decision (18:00 GMT). If this news turns out to be positive for the bears, they will face the support at 31640. On the other hand, if the bulls manage to take advantage of the news, they will meet the resistance at 32045.
Markets Poised to React to Fresh Fed Guidance
A 75-basis point hike by the Fed today is already well-telegraphed; anything else would be a surprise.
Looking beyond today’s FOMC decision, markets are currently expecting another 100bps of hikes before 2022 draws to a close, with the Fed Funds rate reaching a year-end peak of 3.4%.
If Chair Powell signals today that policymakers are sticking with their “pedal to the metal” approach in quelling multi-decade high inflation, readying even more jumbo-sized hikes in the pipeline, that might send the US dollar into another rampage across the FX universe, while shoving spot gold into the sub-$1700 domain. That would also potentially result in more carnage for risk assets.
Ramped-up fears that the Fed’s ongoing rate-hike cycle may ultimately spell the next US recession could drag the S&P 500 back into bear market territory, on the notion that corporate earnings will wilt in the next economic winter.
XAG/USD: Shortly We May See a Rise in the Reactionary Wave (X)
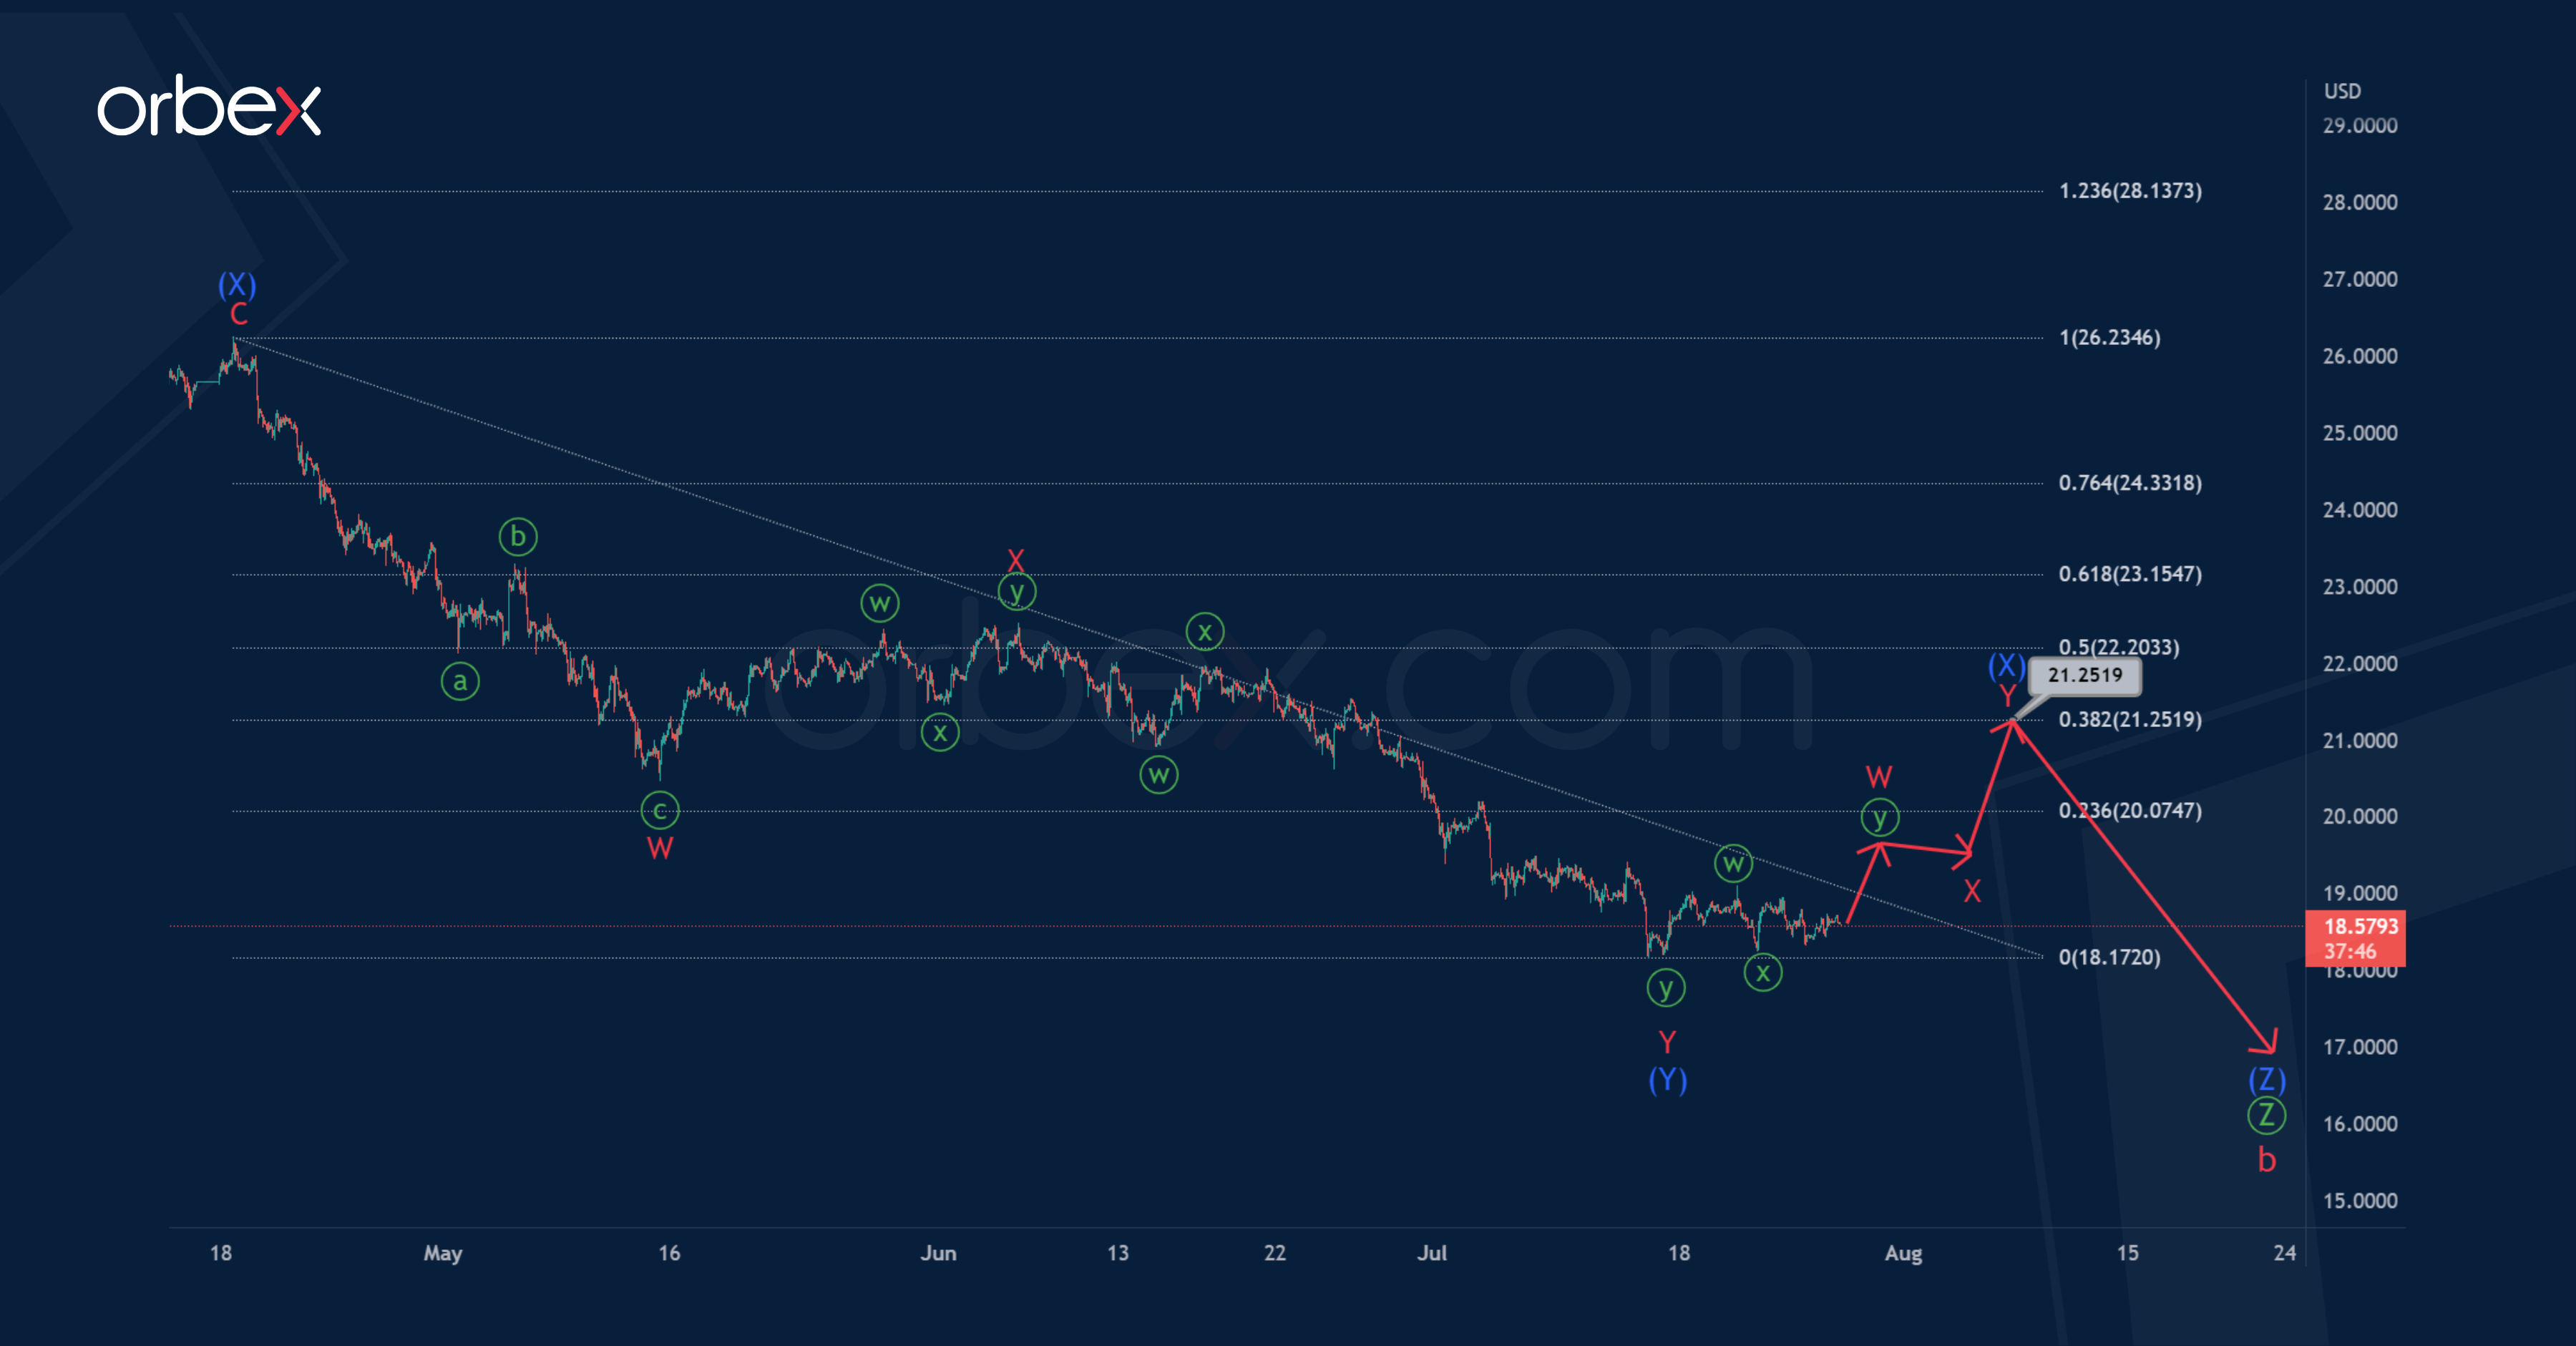
The XAGUSD pair, as in previous trading weeks, seems to be forming a correction wave b of the cycle degree, which is part of a large zigzag.
Apparently, correction b is a primary triple zigzag Ⓦ-Ⓧ-Ⓨ-Ⓧ-Ⓩ. The first four parts of it have already been fully completed, now we see the construction of the last wave Ⓩ.
Most likely, the wave Ⓩ will be an intermediate triple zigzag (W)-(X)-(Y)-(X)-(Z). It seems that the formation of the actionary intermediate wave (Y) has come to an end, it has taken the form of a double zigzag W-X-Y. Thus, growth could begin in the intermediate intervening wave (X).
It can be assumed that the wave (X) will end in the form of a minor double zigzag near 21.259. At that level, it will be at 38.2% along the Fibonacci lines of sub-wave (Y).
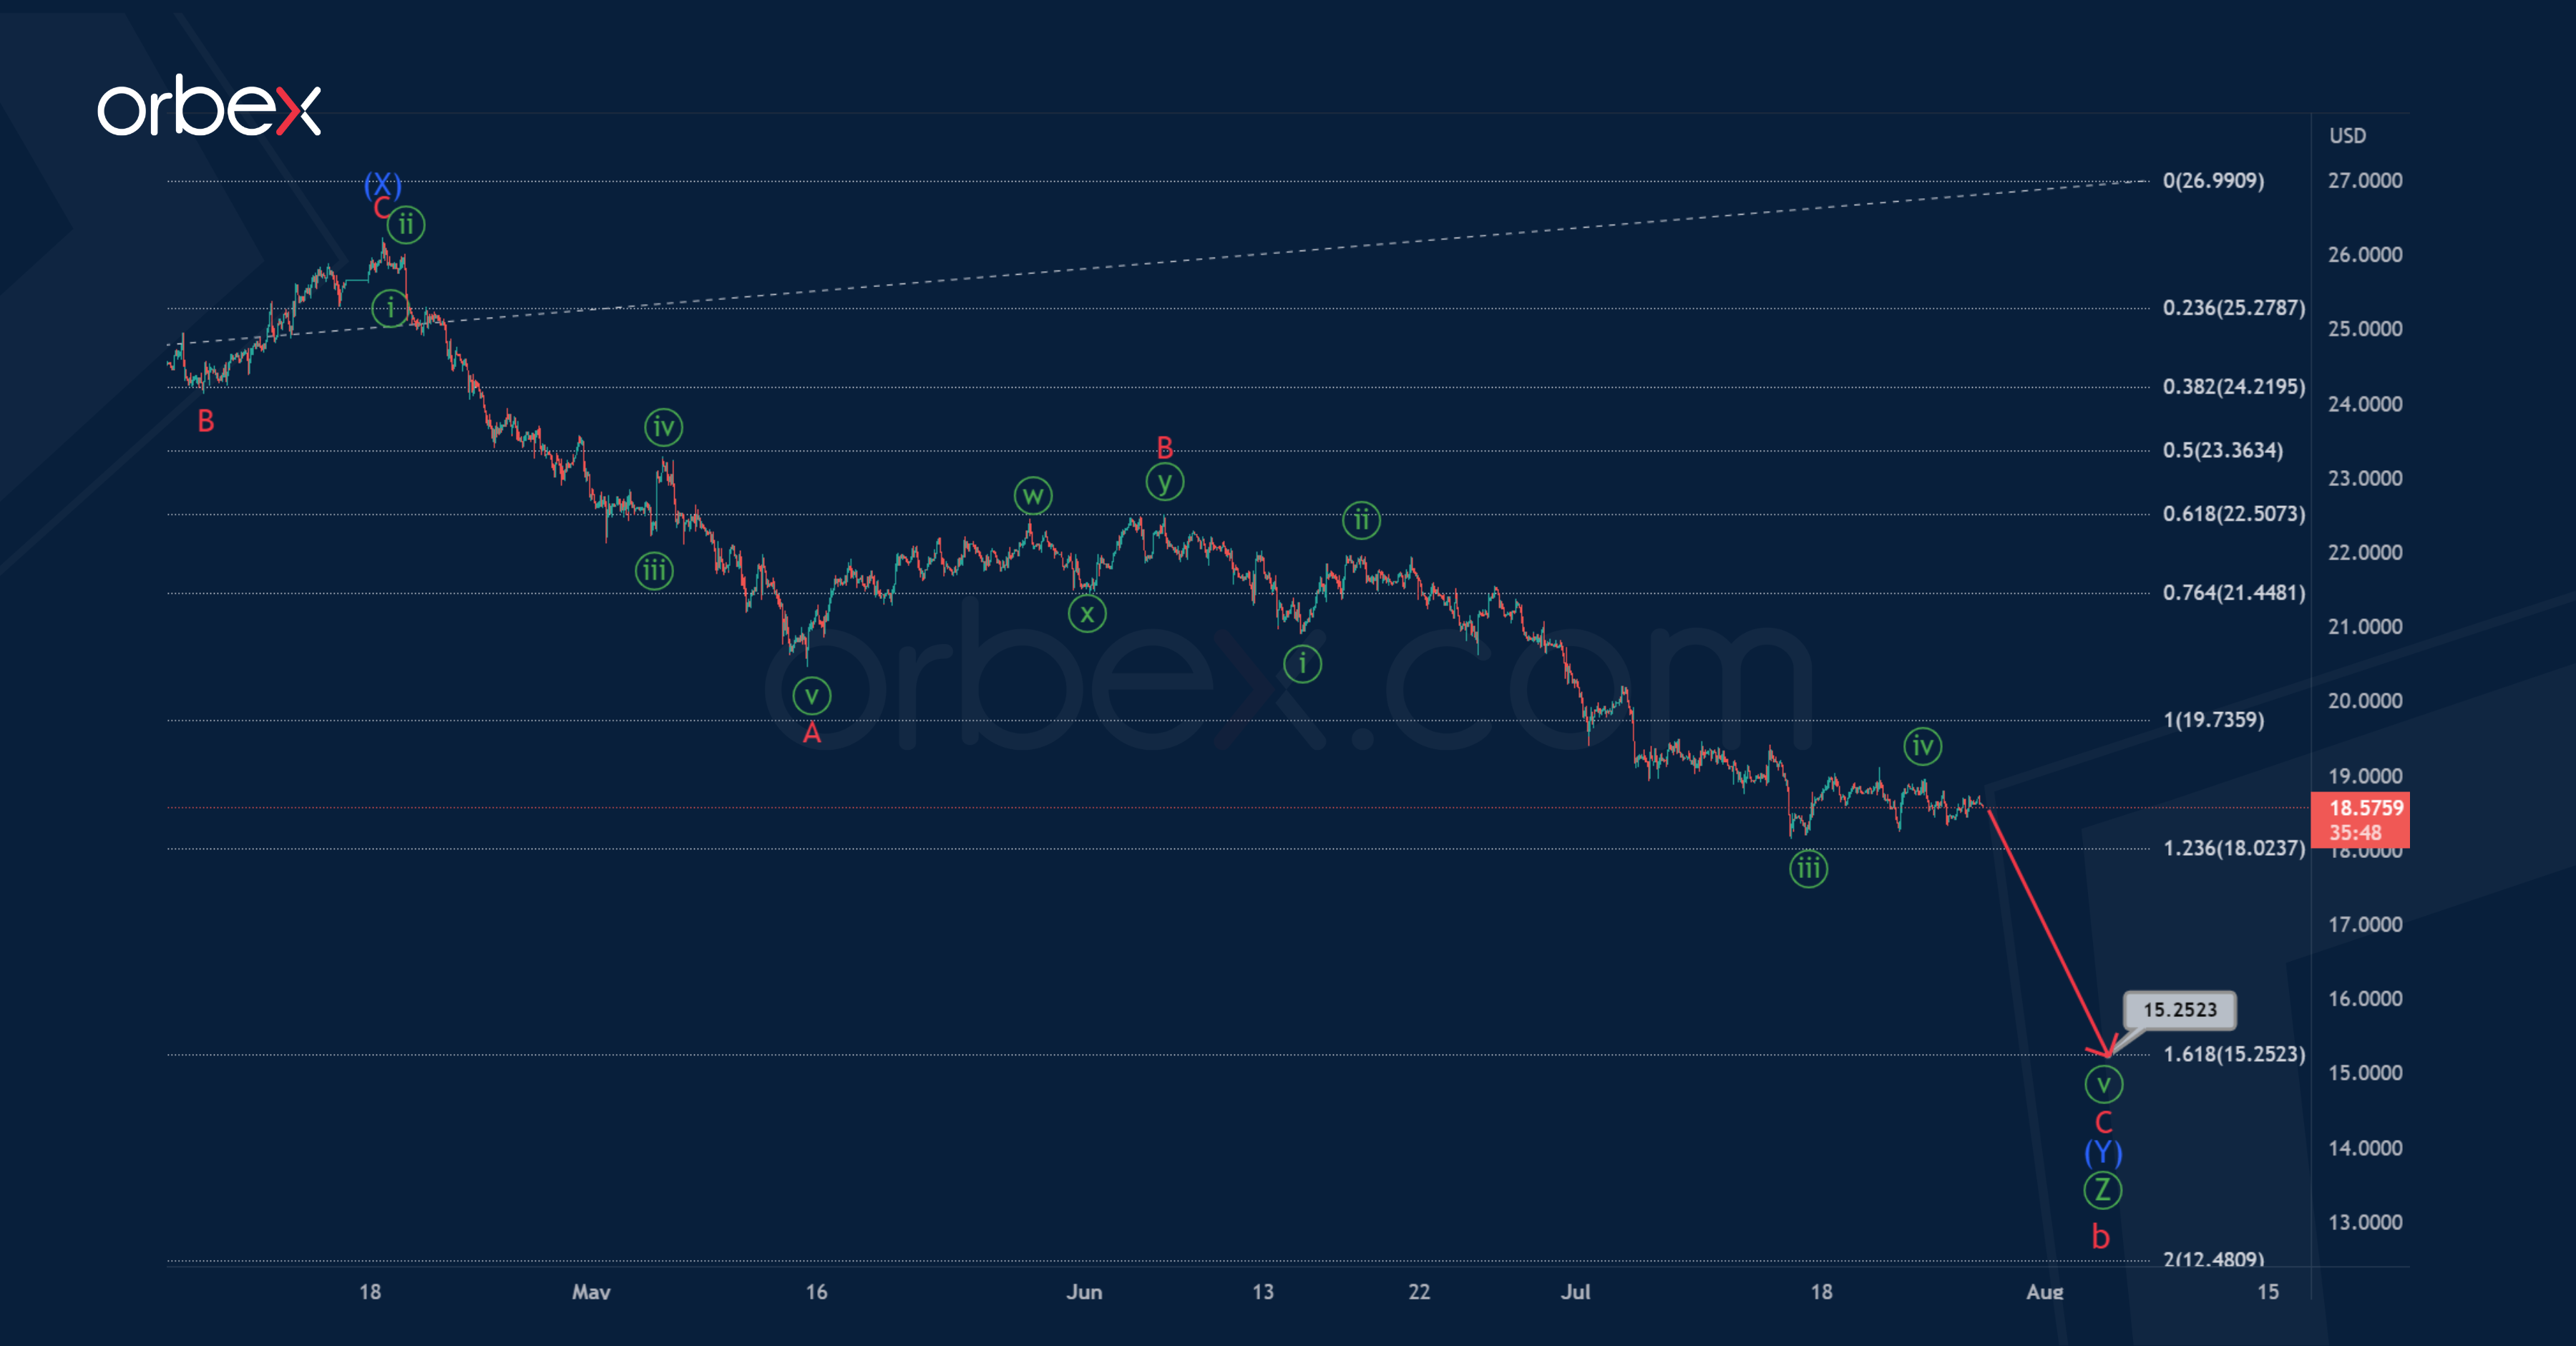
Alternatively, it is assumed that the bearish primary wave Ⓩ may end in the form of a double zigzag (W)-(X)-(Y).
Most likely, the market is now in the final part of the actionary wave (Y), or rather in its final minor sub-wave C.
Perhaps wave C will end in the form of an impulse consisting of minute sub-waves.
To end this impulse, a final sub-wave is needed. The end of this impulse is possible near 15.252. At that level, primary wave Ⓩ will be at 161.8% of actionary wave Ⓨ.
XAU/USD Drifts Lower
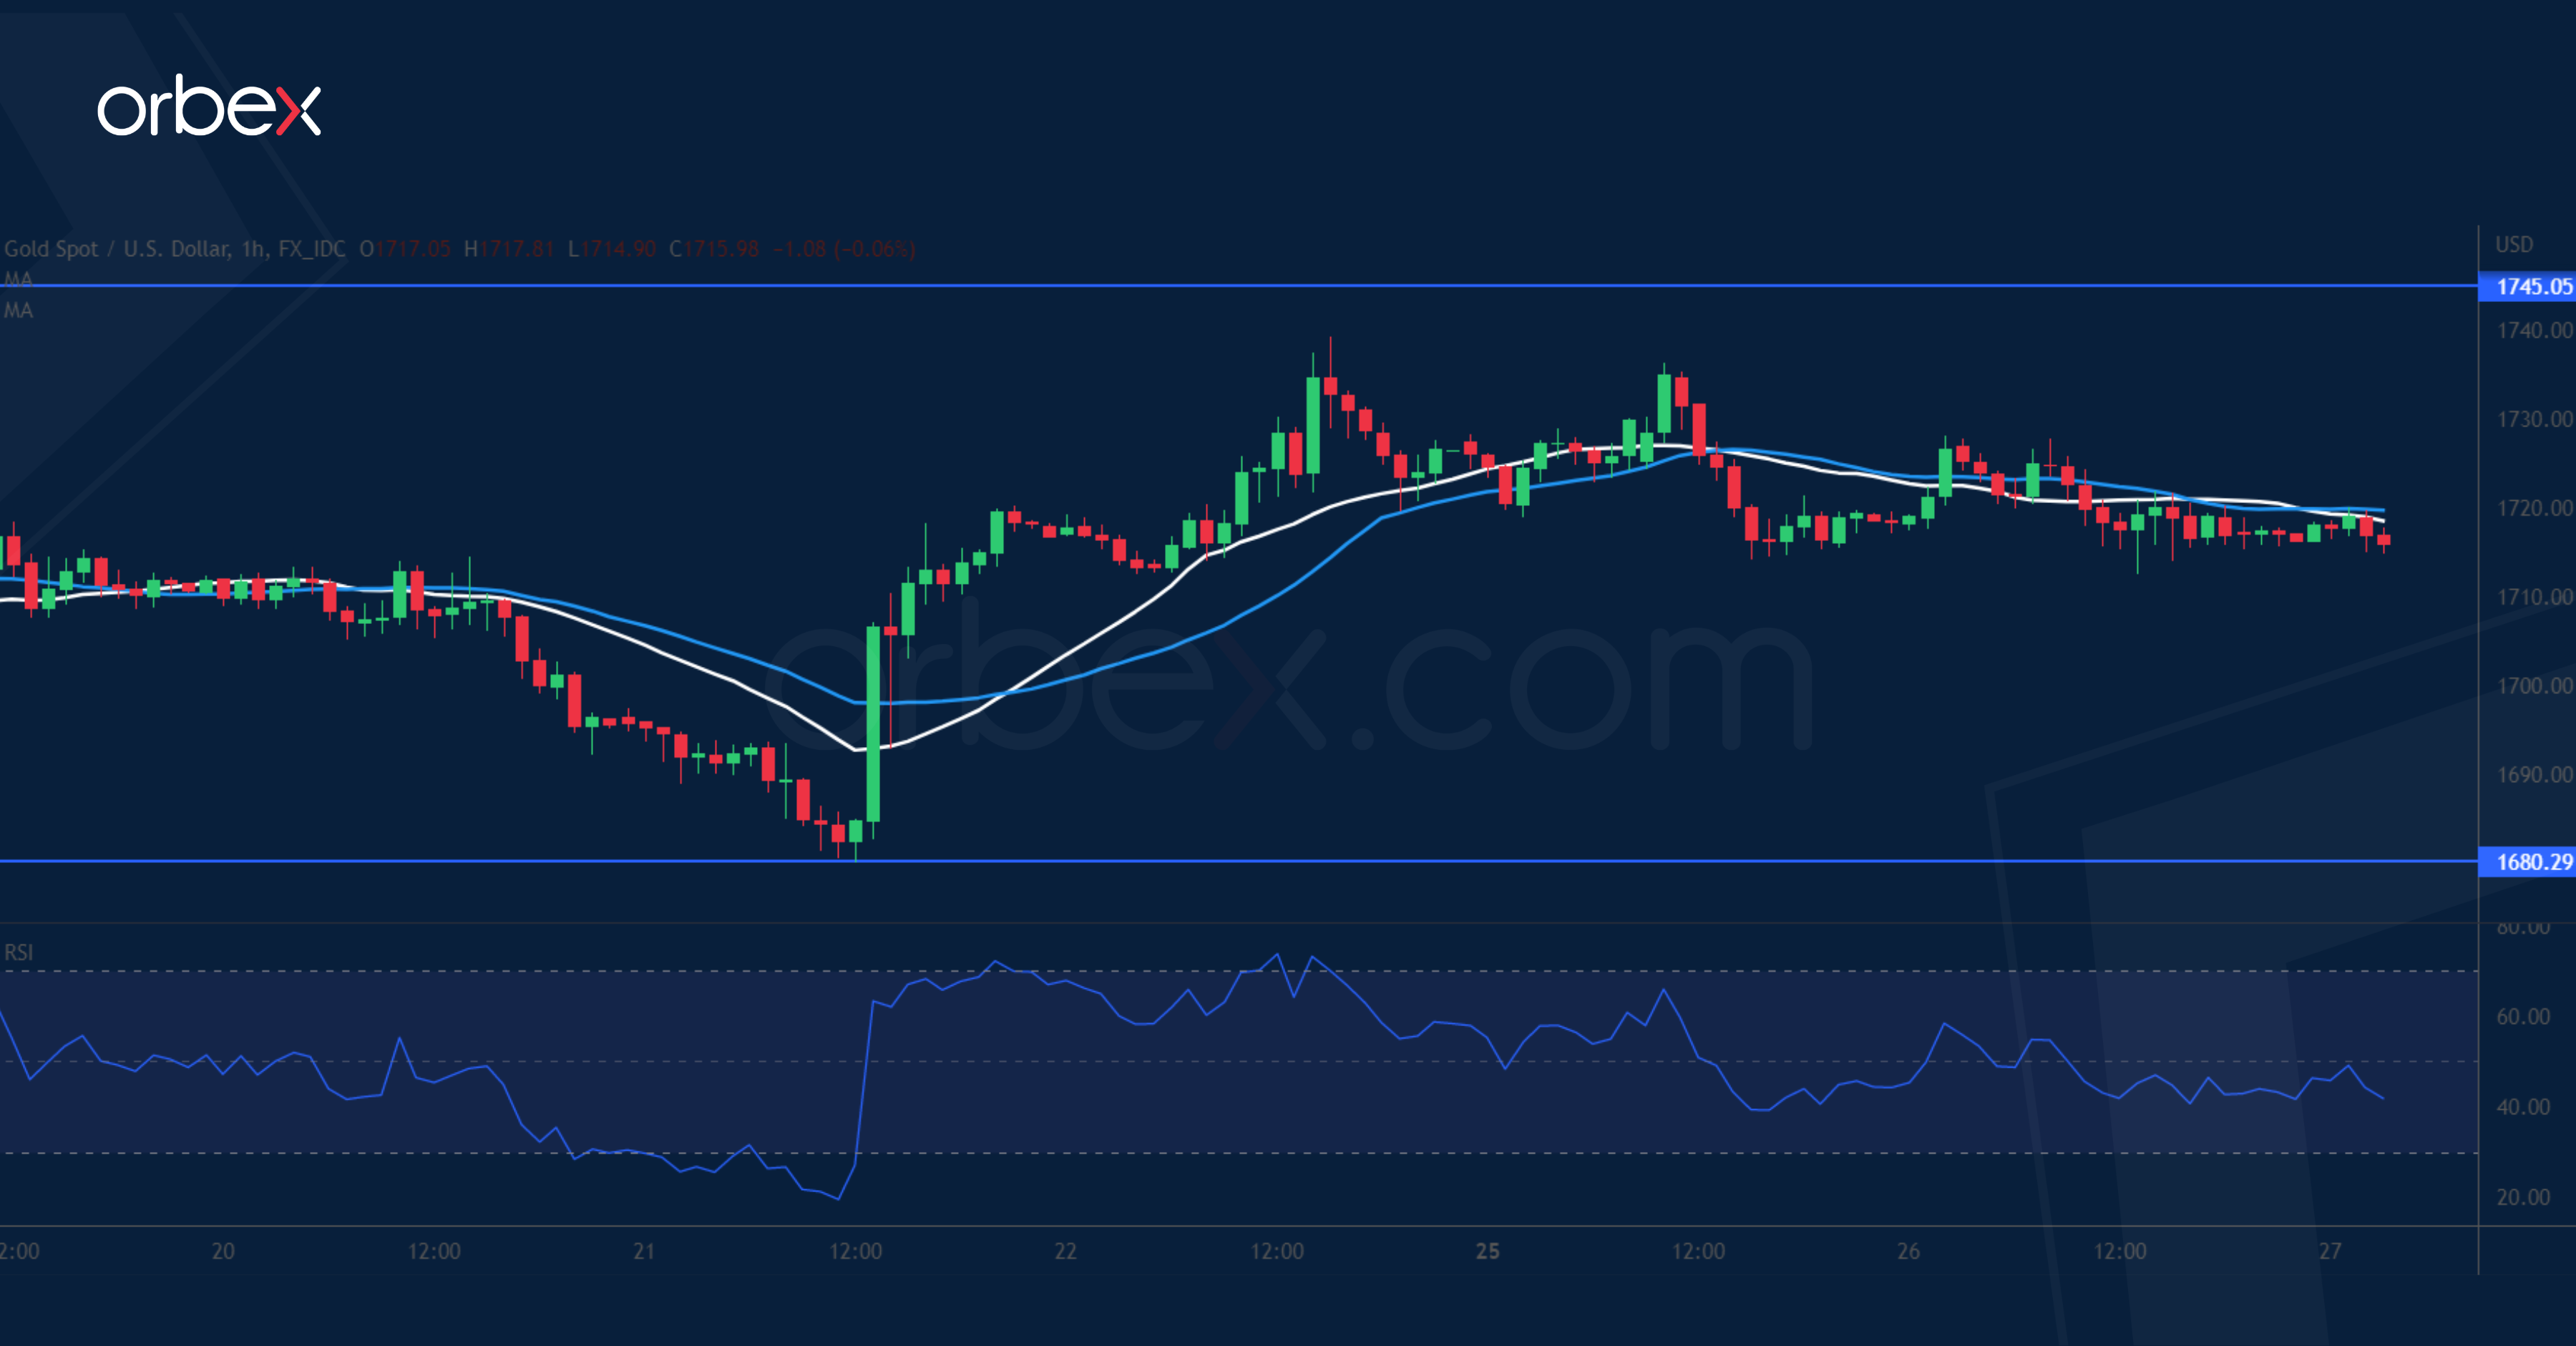
Gold stalls as the US dollar climbs back across the board. The bulls are striving to keep the price afloat as bullion hits last year’s lows at 1680. After the RSI hit oversold, the latest surge seems to come from profit- taking as the bears get out of a directional trade. The precious metal met its first resistance at 1745 which lies on the 20-day moving average. The bulls will need to push past this key hurdle before a recovery could gain a foothold. Otherwise, gold could be vulnerable to a new round of sell-off below 1600.
GBP/USD Tests Support
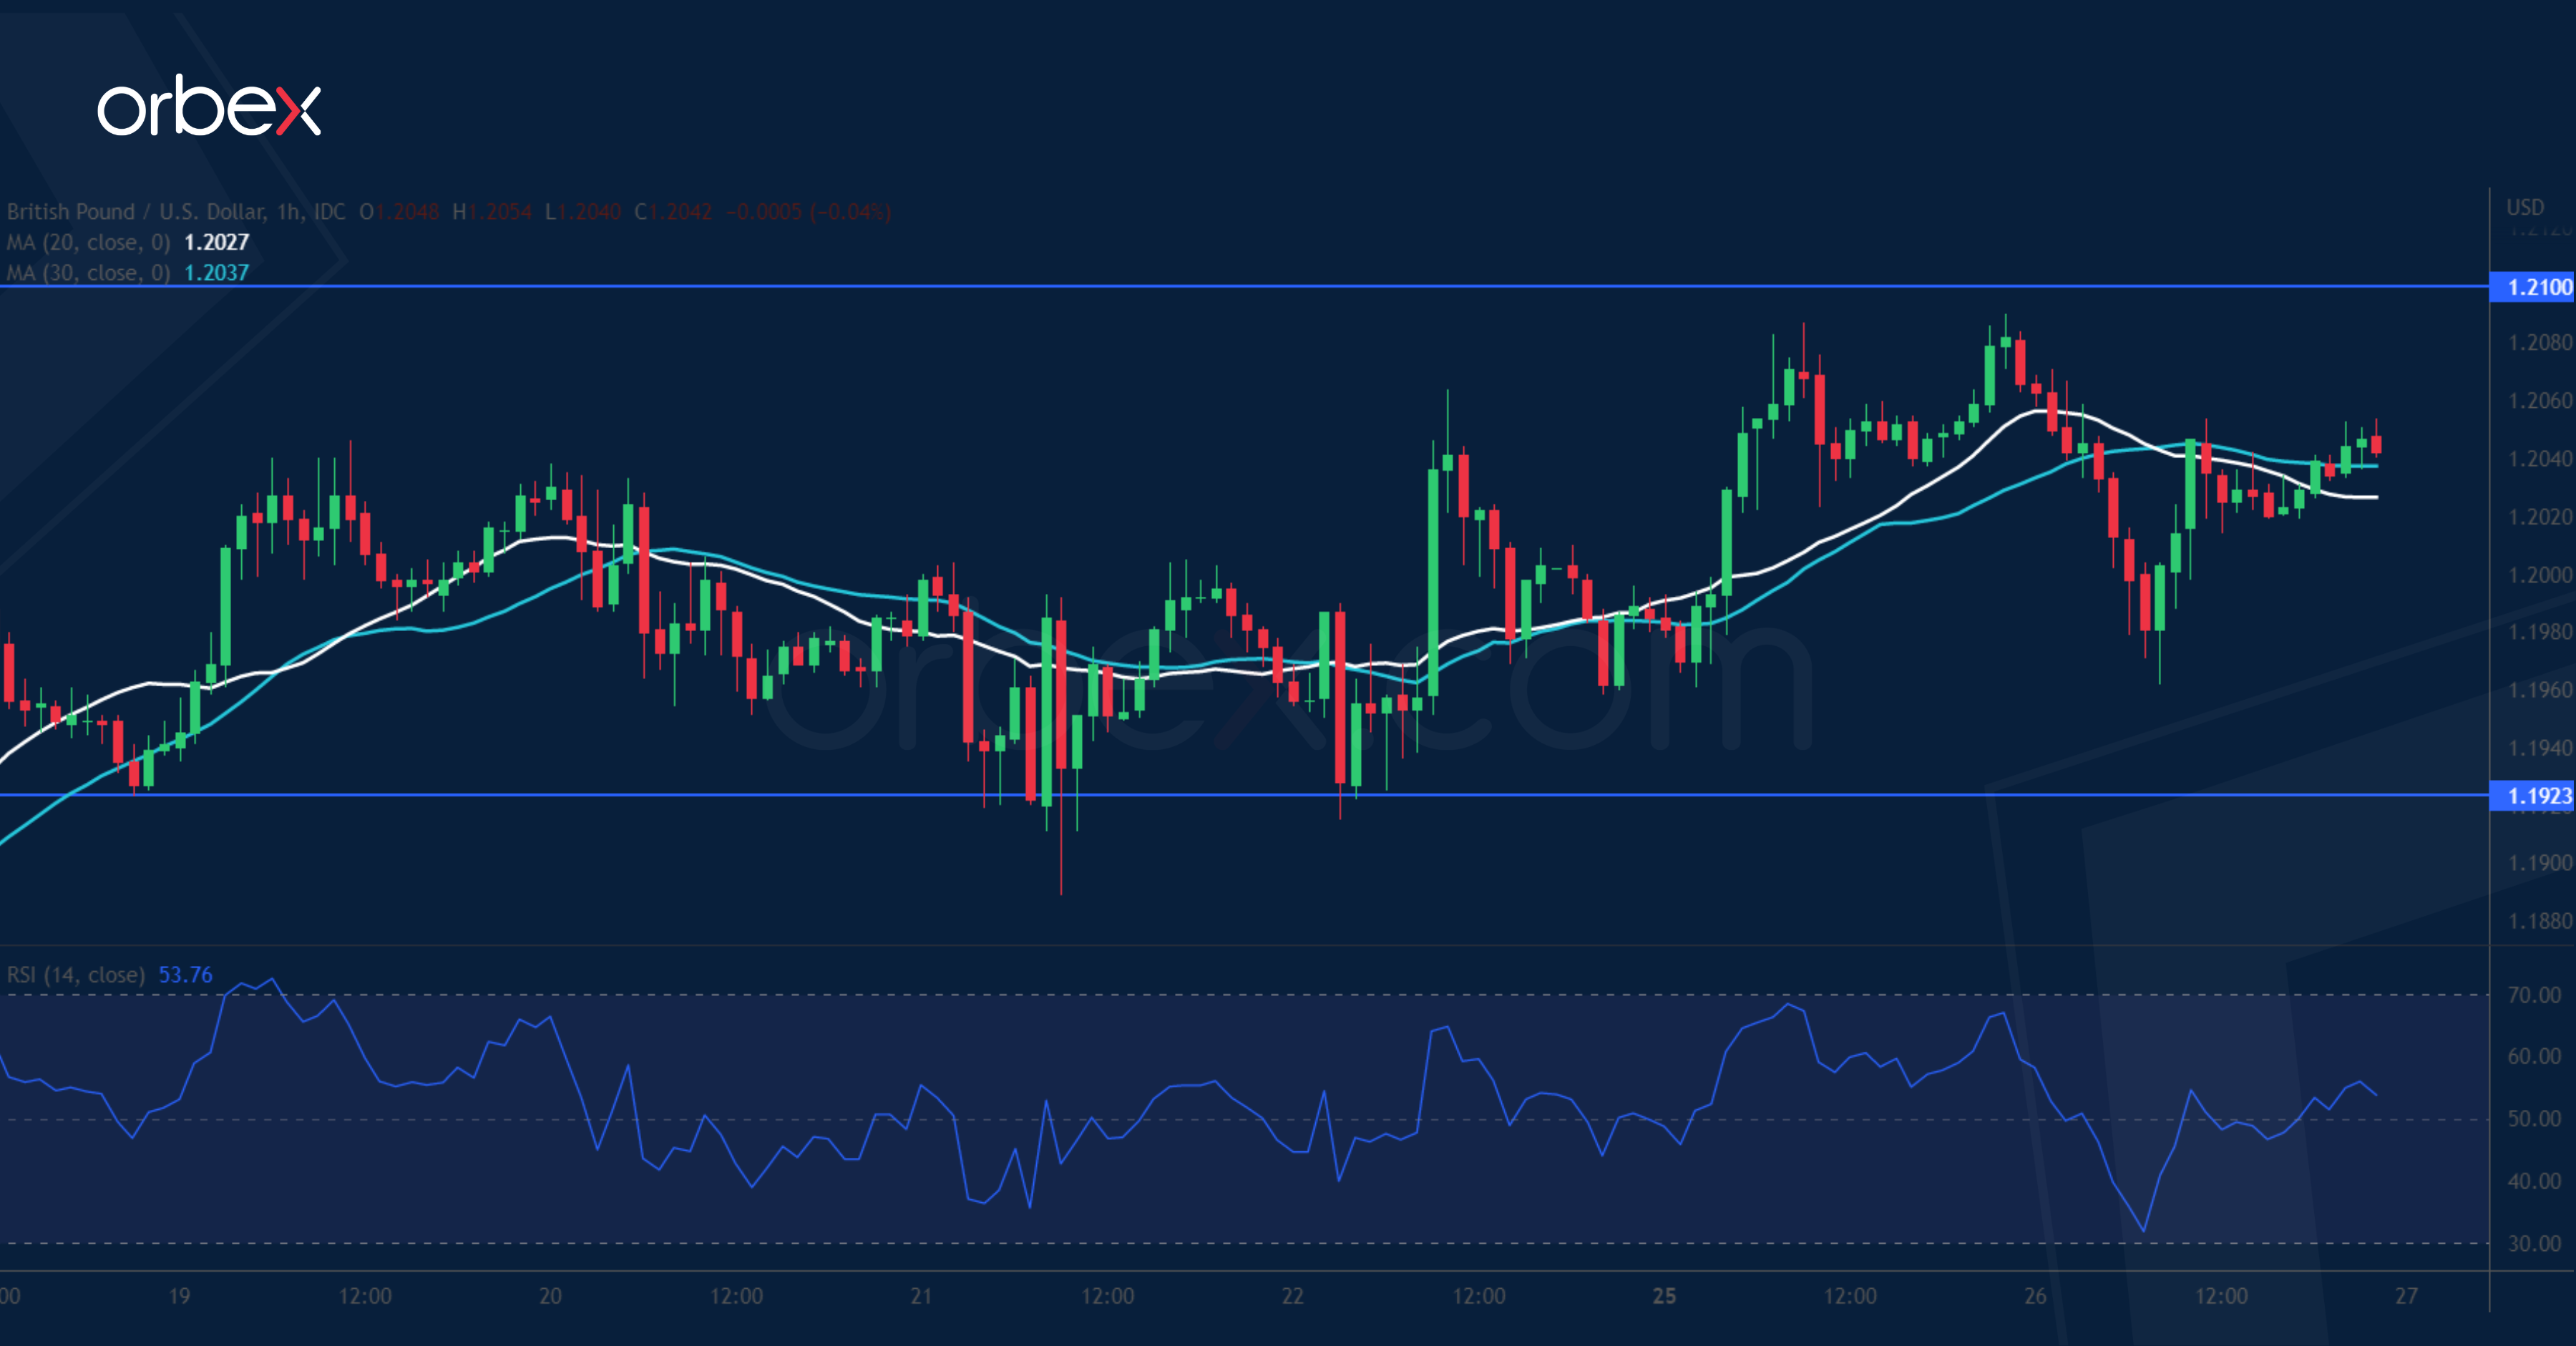
Sterling struggles as the market bets on a cautious 25 bp rate hike by the BoE at its next meeting. Sentiment remains downbeat and the bears may see rebounds as opportunities to sell. The latest one came to a halt in the supply area (1.2100) which coincides with the 30-day moving average. A bullish breakout could trigger momentum buying and send the pair to the daily resistance at 1.2300. A pullback may bring the price to 1.1920, the first level to gauge buyers’ resolve. A deeper correction would make the pound revisit 1.1770.
AUD/USD Seeks Support
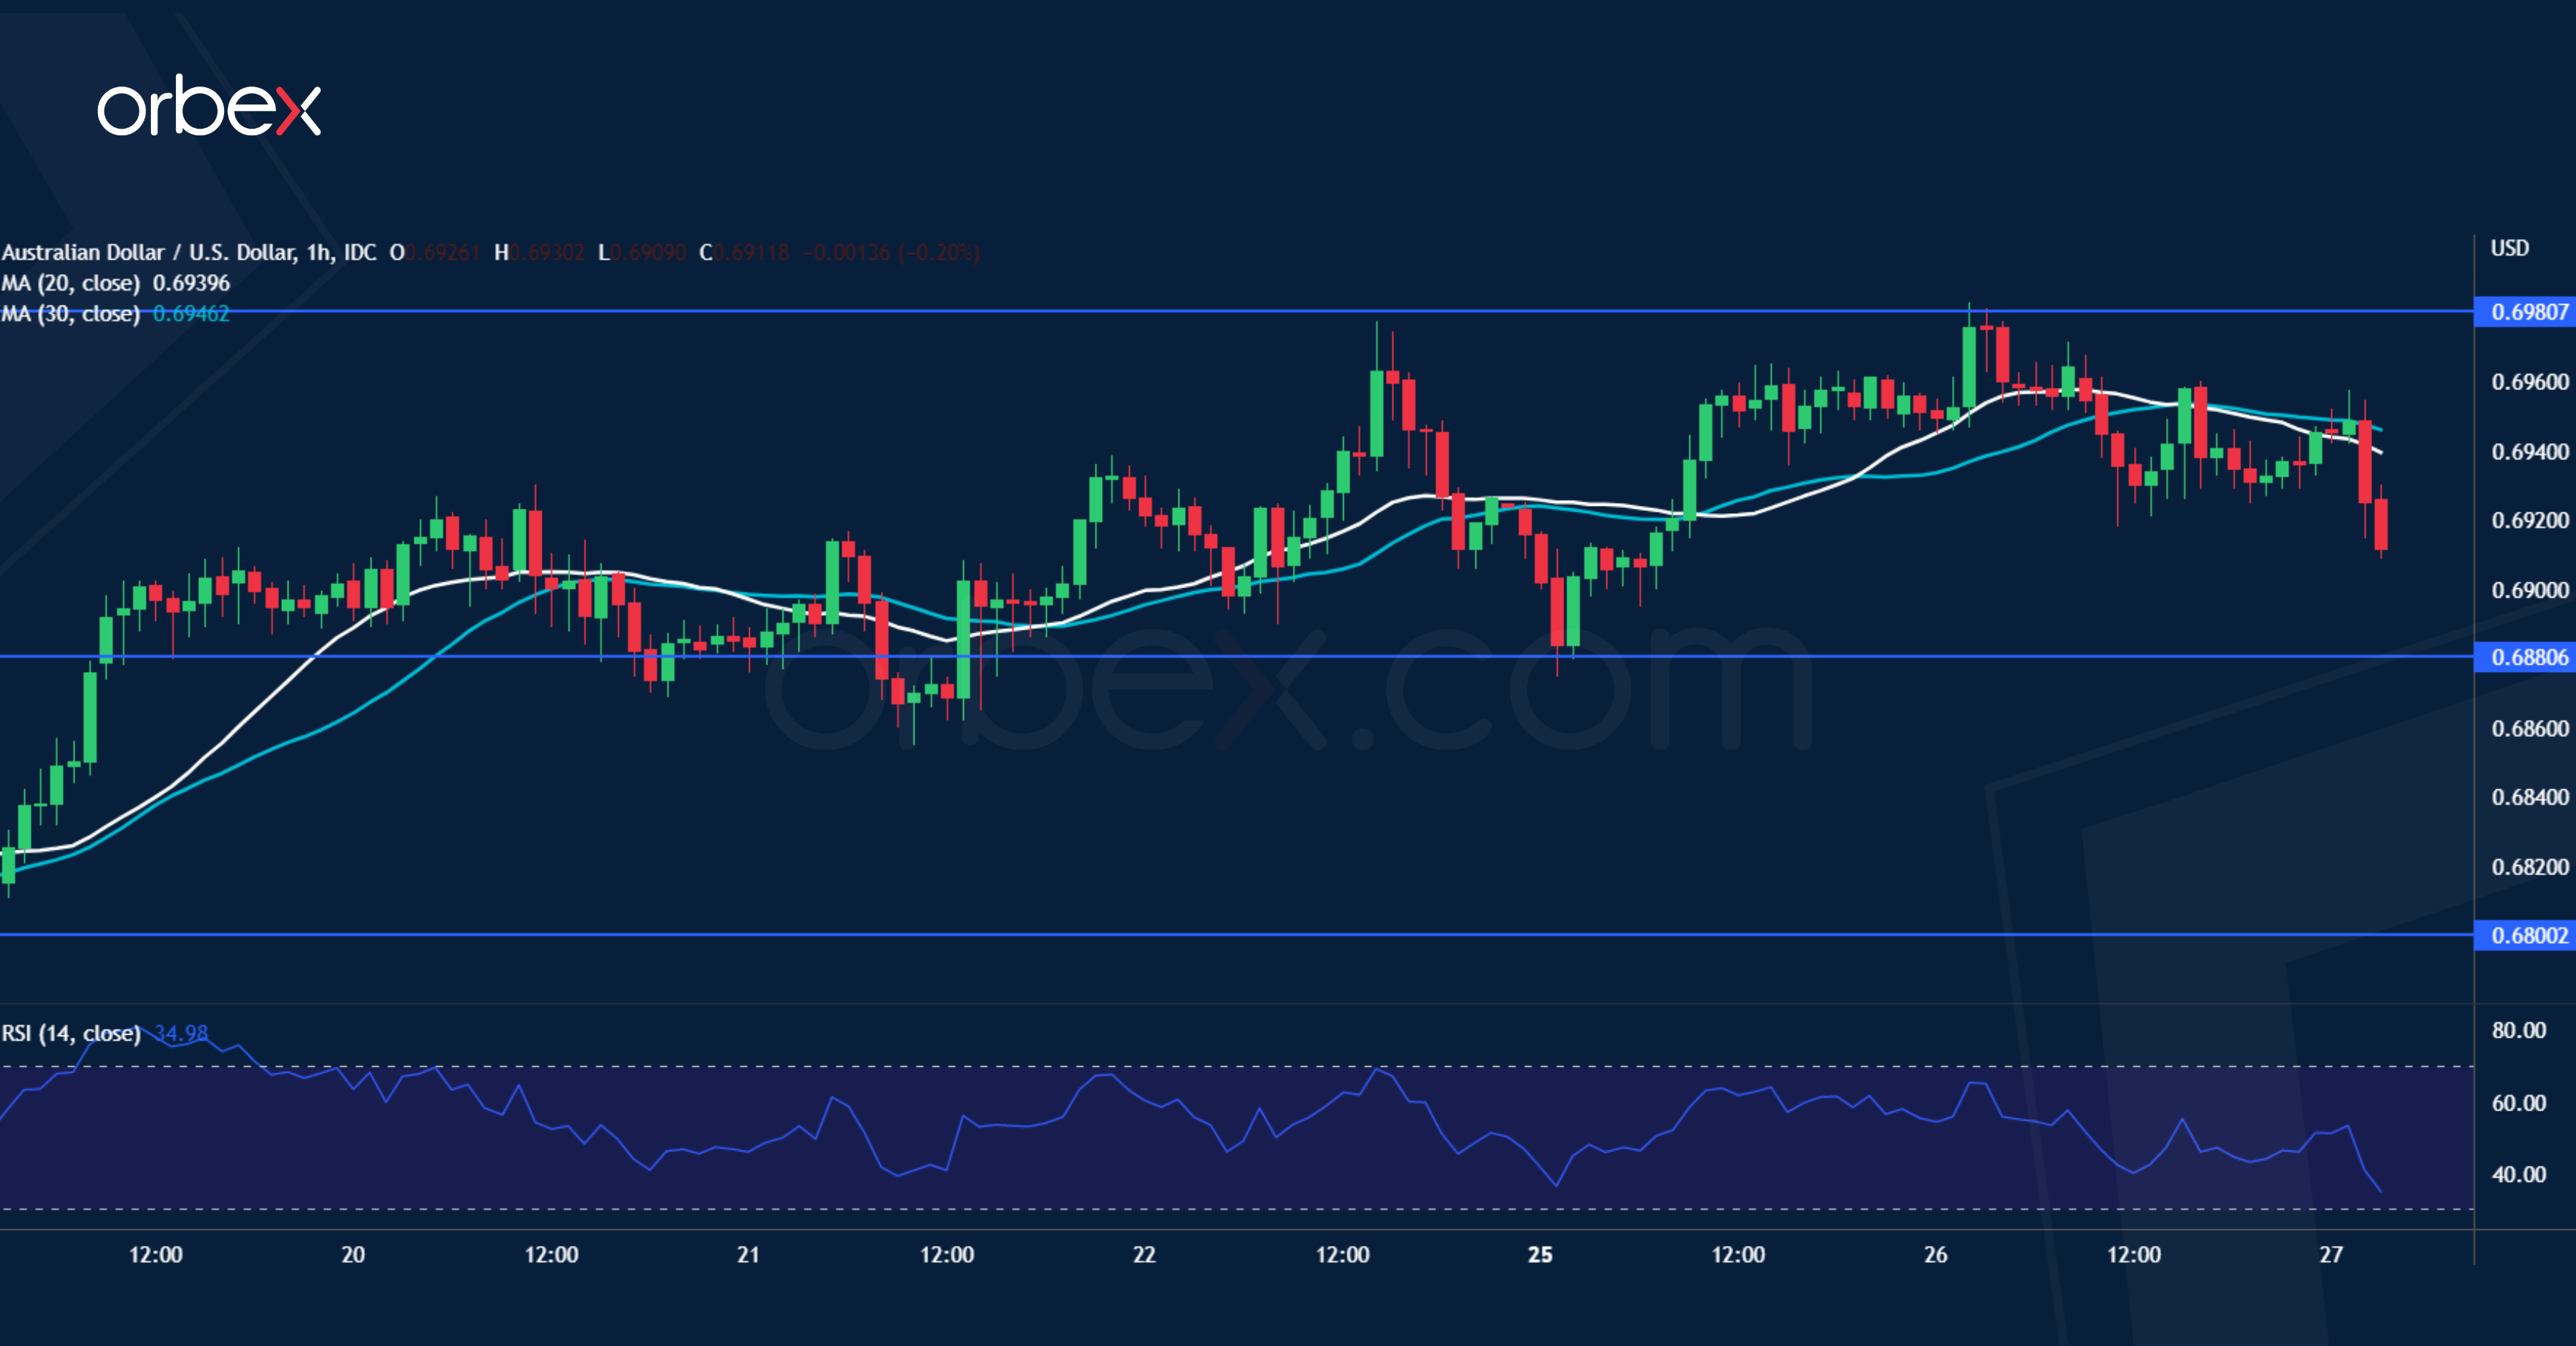
The Australian dollar weakened after the CPI fell short of expectations in Q2. A rally above the supply zone around 0.6960 forced more sellers to cover their bets and took the heat off the aussie. 0.6980 is the immediate resistance and a bullish breakout could extend the rally above the daily resistance at 0.7060. But first, the pair needs to consolidate its recent gains to build up momentum. 0.6880 is a fresh support. Further down, 0.6800 at the base of the breakout is a key level to keep the current rebound intact.
Investors Increasingly Consider a (Sharp) Recession, Especially in Europe, as Unavoidable
Markets
The news on Russia scaling back gas supplies through Nord Stream 1 to just 20% remained the dominating trading theme yesterday. Investors increasingly consider a (sharp) recession, especially in Europe, as unavoidable. The dark mood was compounded by yet again downwardly revised IMF growth forecasts (cfr. infra). Stocks in Europe and on WS shed 0.8% and 0.7-1.9% respectively. German yields fell 6.4 bps in the 2y to >9 bps further down the curve. The 10y lost the 1% level. US yields initially joined the downtrend before bottoming in early US dealings. The curve eventually bear flattened with changes between 1 and 3.9 bps even though eco data wasn’t very rosy. House prices rose less than expected. Combined with disappointing new home sales it underscored the cooling market. Consumer confidence (Conference Board) in July eased more than expected as well, to 95.7, down from 98.7. It’s the weakest reading since February last year. Moves on FX markets were classic risk-off. The yen, Swiss franc and dollar secured the top three. EUR/CHF hit an all-time closing low of 0.974. EUR/USD lost more than a percent to 1.012 and EUR/JPY forfeited more than a full big figure to 138.51. But even sterling won against the weak euro, even sterling. EUR/GBP slid to 0.8412. Meanwhile, the pound follows debates between UK PM candidates Truss and Sunak with the former suggesting to lower the taxes Sunak has raised in order to plug the gaping hole in public finances.
Markets in Asia trade mixed even as some US bellwether companies (Microsoft, Alphabet) produced bumper earnings. Nervousness going into the Fed meeting tonight is palpable. We, and markets, expect the US central bank to hike by 75 bps to bring the policy rate to 2.25/2.50%, i.e. the neutral level. But more importantly will be Powell’s message about the pace going forward. A slew of poor economic data (confidence indicators, housing) argues for slowing down. However, a still strong (but notoriously lagging) labour market and way too high inflation suggest otherwise. There is a large amount of data to be published going into the next meeting, including GDP numbers tomorrow and two more inflation prints. Powell may therefore refrain from guiding markets explicitly and stress the importance of being data-dependent. Keeping all options open and going meeting-by-meeting is probably the best one can do to not to rock the boat on markets. In any case we don’t think the Fed chair will already hint at the end of the cycle let alone rate cuts the way markets foresee for the end of this year and mid next year respectively. As such we believe US interest rates to be well supported, especially at the front end of the curve. This should also keep the dollar in favour of investors, especially against the likes of the euro which has a worse set of problems to deal with.
News Headlines
Inflation in the second quarter in Australia jumped 1.8% Q/Q to be 6.1% higher compared to the same period last year. The Q2 yearly rise was the fastest pace since 2001 and compared to 2.1% Q/Q and 5.1% Y/Y in Q1. The Reserve Bank of Australia aims to keep inflation within a 2-3% range. The Q2 rise in headline inflation was slightly slower than market expectations. Underlying inflation (trimmed mean) accelerated further by 1.5% Q/Q to 4.9% Y/Y (from 3.7%). Even as inflation is well above the RBA target and might rise even further later this year, markets are positioned of a 50 bps rate hike at the August 2 RBA meeting rather than a super-sized 75 bps step. The 2-y Australian government bond yield this morning dropped 11 bps to 2.60%. The Aussie dollar slipped from the 0.6960 area to the 0.6920 area immediately after the release, but the setback eased soon as the US dollar is losing some momentum overall.
The IMF further the cut the global growth forecast as increasingly gloomy developments are materializing. Several shocks have hit a world economy that was already weakened by the pandemic. High inflation worldwide is resulting in tighter financial conditions. China faced a worse-than-anticipated slowdown due to COVID- 19 outbreaks and lockdowns and further negative spillovers from the war in Ukraine are weighing on global activity. The IMF reduced 2022 growth in the baseline scenario to 3.2%, 0.4%pt lower compared to April. Global inflation has been revised up to reach 6.6% in advanced economies and 9.5% in emerging market and developing economies. The IMF only expects global output growth of 2.9% on 2023 as monetary policy is expected to slow activity. Risk to the outlook are overwhelming tilted to the downside.