

Sample Category Title
Technical Outlook and Review
DXY:
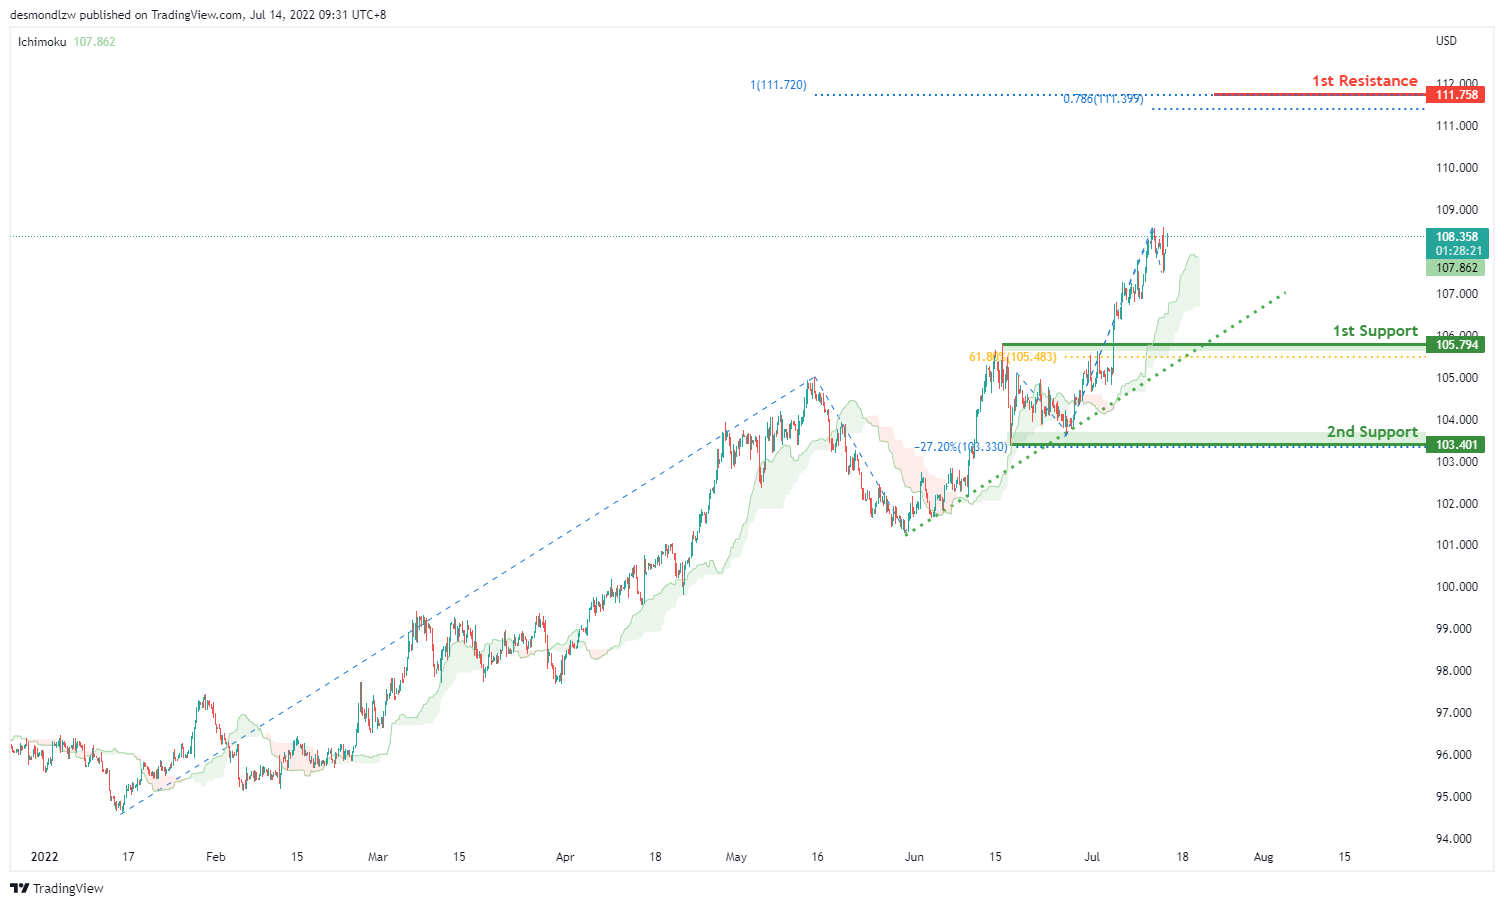
On the H4, with prices moving above the ichimoku indicator and along the ascending trendline, we have a bullish bias that prices will drop and rise from 1st support at 105.794 where the pullback support and 61.8% fibonacci retracement are to 1st resistance at 111.758 in line with 100% fibonacci projection and 78.6% fibonacci projection. Alternatively, price may break 1st support structure and drop to 2nd support at 103.401 where the horizontal swing low support and -27.2% fibonacci expansion are.
Areas of consideration:
- H4 time frame, 1st resistance at 111.758
- H4 time frame, 1st support at 105.794
XAU/USD (GOLD):
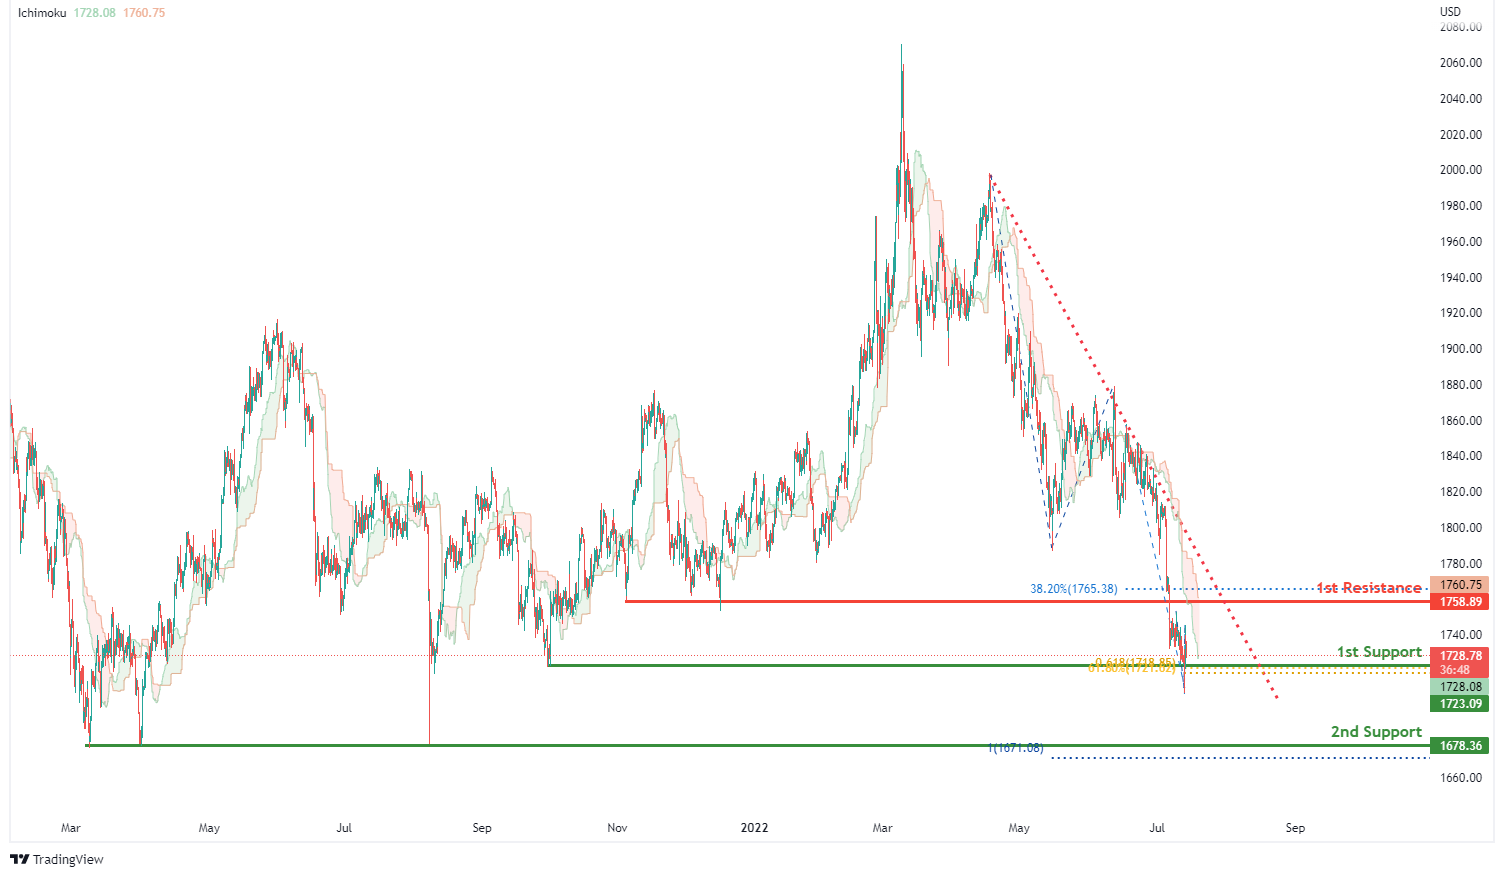
On the H4, with prices moving below the ichimoku indicator and along a descending trendline, we have a bearish bias that prices will drop to our 1st support at 1723.09 where the horizontal pullback support, 61.8% fibonacci retracement and 61.8% fibonacci projection are. Once we have downside confirmation of price breaking 1st support structure, we would expect bearish momentum to carry price to 2nd support at 1678.36 in line with swing low support and 100% fibonacci projection. Alternatively, price could rise to our 1st resistance at 1758.89 in line with overlap resistance and 38.2% fibonacci retracement.
Areas of consideration:
- H4 time frame, 1st Resistance at 1758.89
- H4 time frame, 1st Support at 1723.09
GBP/USD:
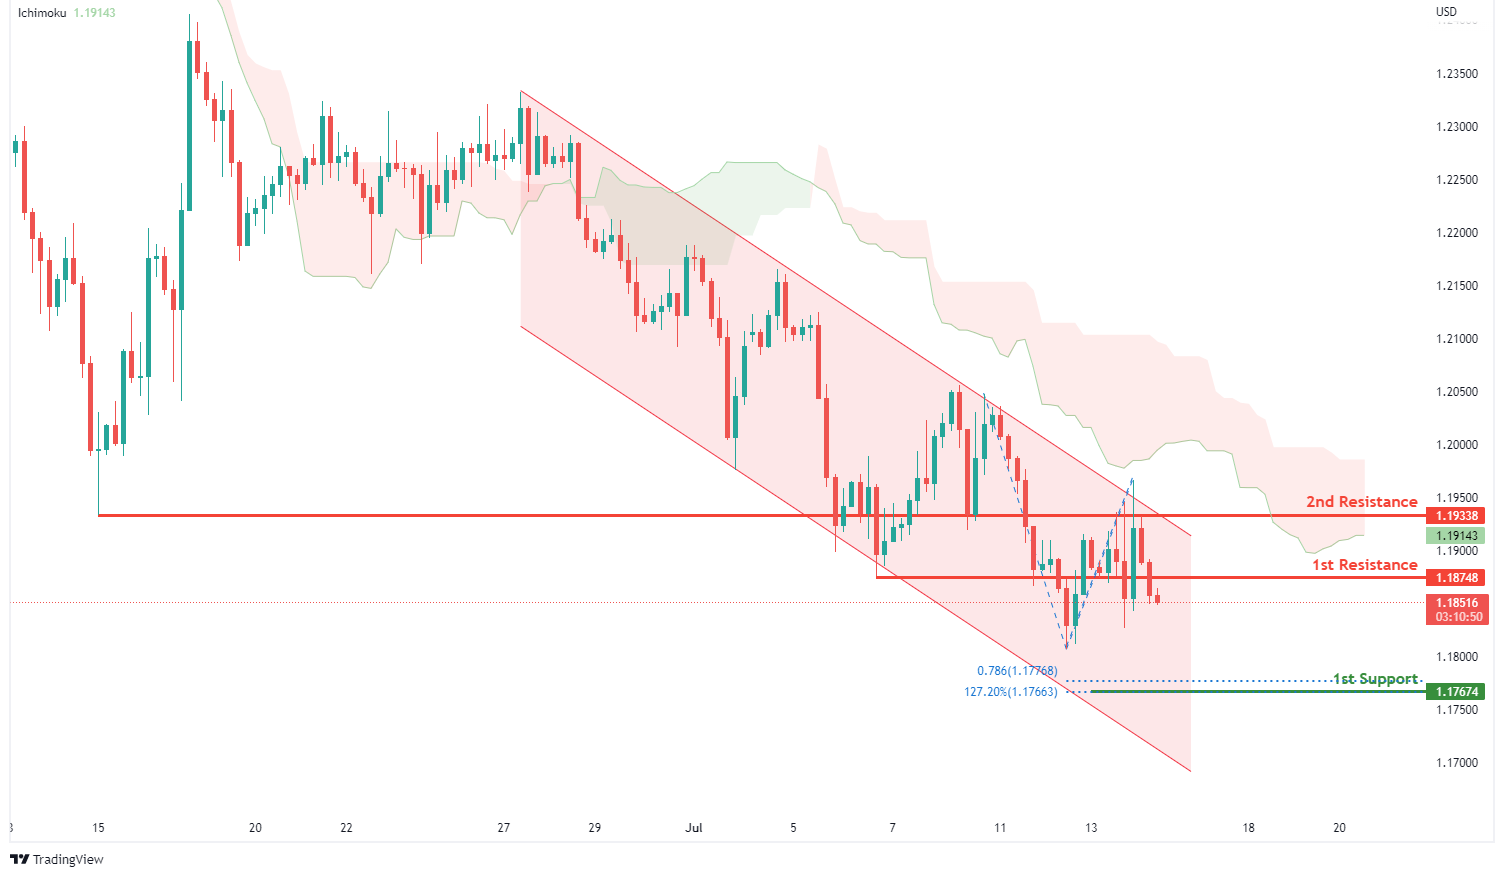
On the H4, with prices moving below the ichimoku indicator and within the descending channel, we have a bearish bias that prices will rise and drop from our 1st resistance at 1.18748 where the pullback resistance is to our 1st support at 1.17674 where the 78.6% fibonacci projection and 127.2% fibonacci extension are. Alternatively, price could break 1st resistance structure and rise to 2nd resistance at 1.19338 in line with the overlap resistance.
Areas of consideration:
- H4 1st resistance at 1.18748
- H4 1st support at 1.17674
USD/CHF:
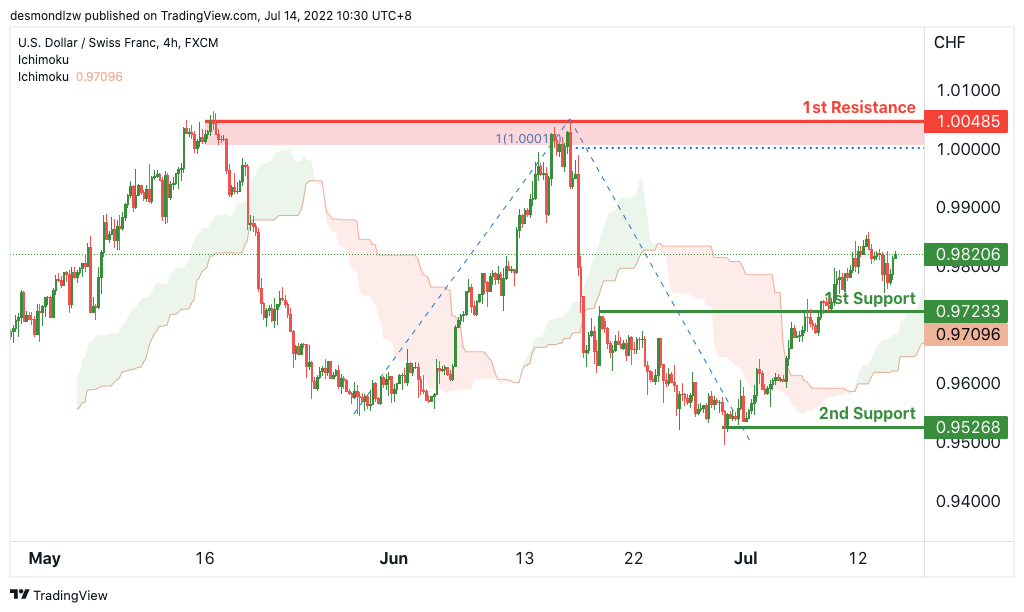
On the H4, with price moving above the ichimoku cloud, we have a bullish bias that price will rise from our 1st support at 0.97233 where the horizontal pullback support is to our 1st resistance at 1.00485 in line with the 100% Fibonacci projection is. Alternatively, price may not break 1st support and head for 2nd support at 0.95268 where the horizontal pullback support.
Areas of consideration
- 1st support level at 0.97233
- 1st resistance level at 1.00485
EUR/USD :
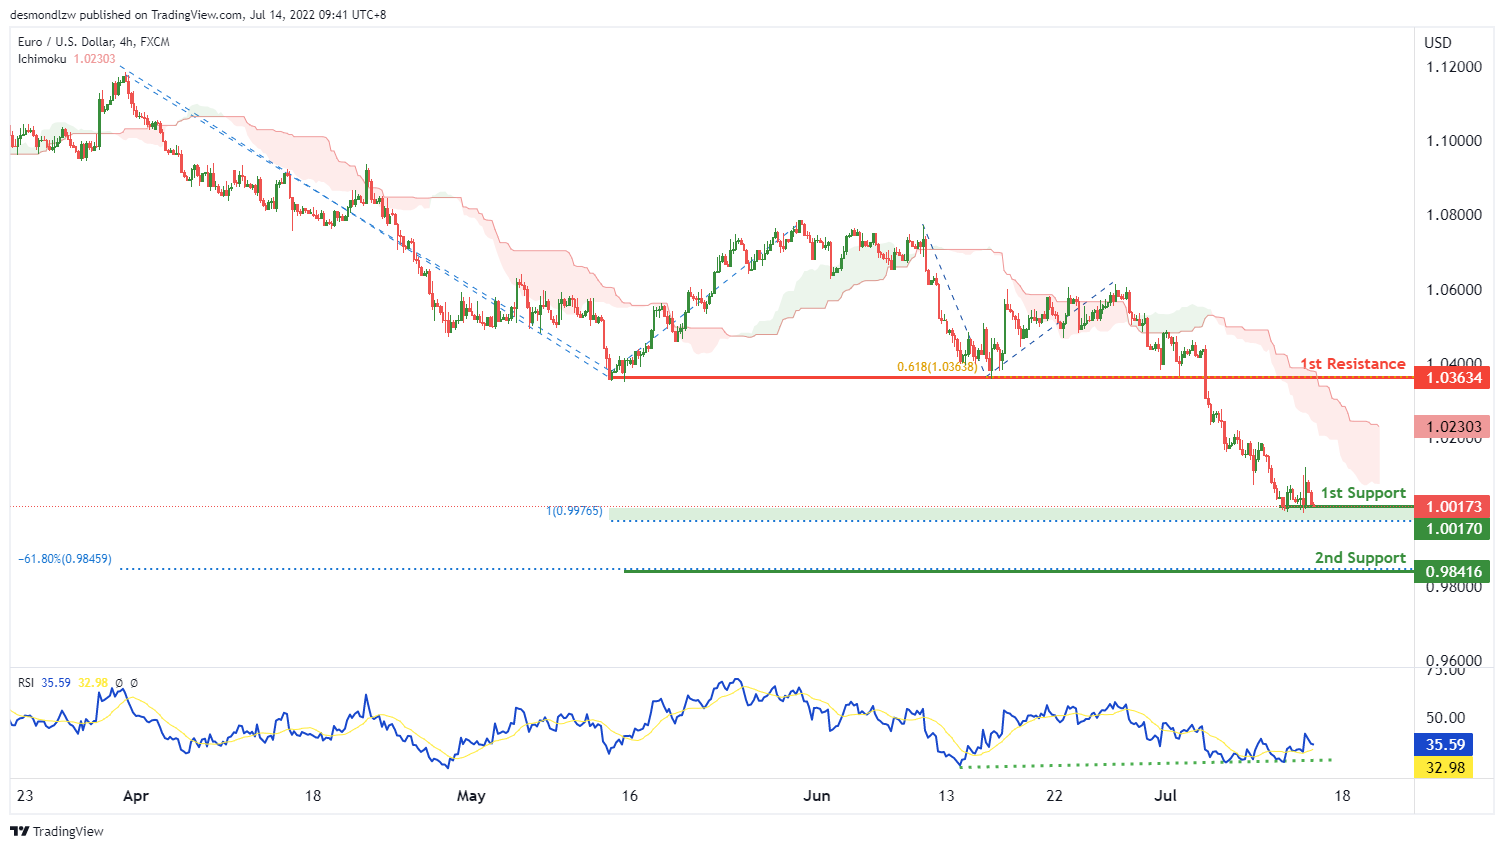
On the H4, with price moving in an ascending trendline on our RSI, we have a bullish bias that price will rise from our 1st support at 1.00173 in line with the swing low and 100% fibonacci projection to the 1st resistance at 1.03634 at the pullback resistance. Alternatively, price may break the support structure at 1st support and drop to the 2nd support at 0.98416 in line with the -61.8% fibonacci expansion.
Areas of consideration :
- H4 1st resistance at 1.03634
- H4 1st support at 1.00173
USD/JPY:
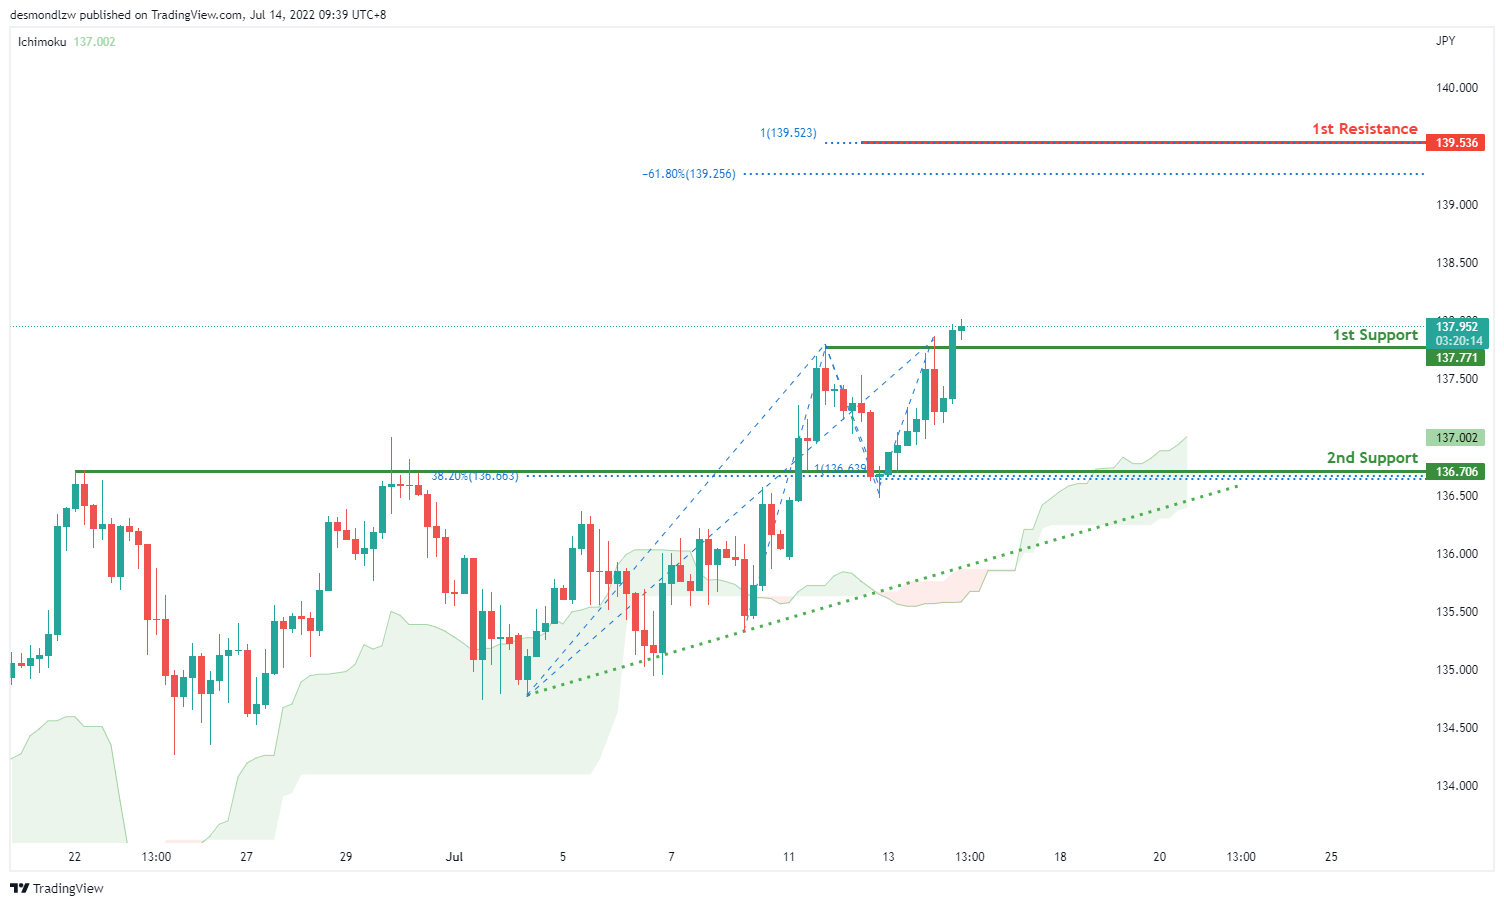
On the H4, with price moving along an ascending trendline and above the ichimoku indicator, we have a bullish bias that price will drop and rise from our 1st support at 137.771 where the pullback support is to the 1st resistance at 139.536 in line with 100% fibonacci projection and -61.8% fibonacci expansion. Alternatively, price could break 1st support and drop to 2nd support at 136.706 where the overlap support, 38.2% fibonacci retracement and 100% fibonacci projection are.
Areas of consideration:
- H4 time frame, 1st resistance at 139.536
- H4 time frame, 1st support at 137.771
AUD/USD:
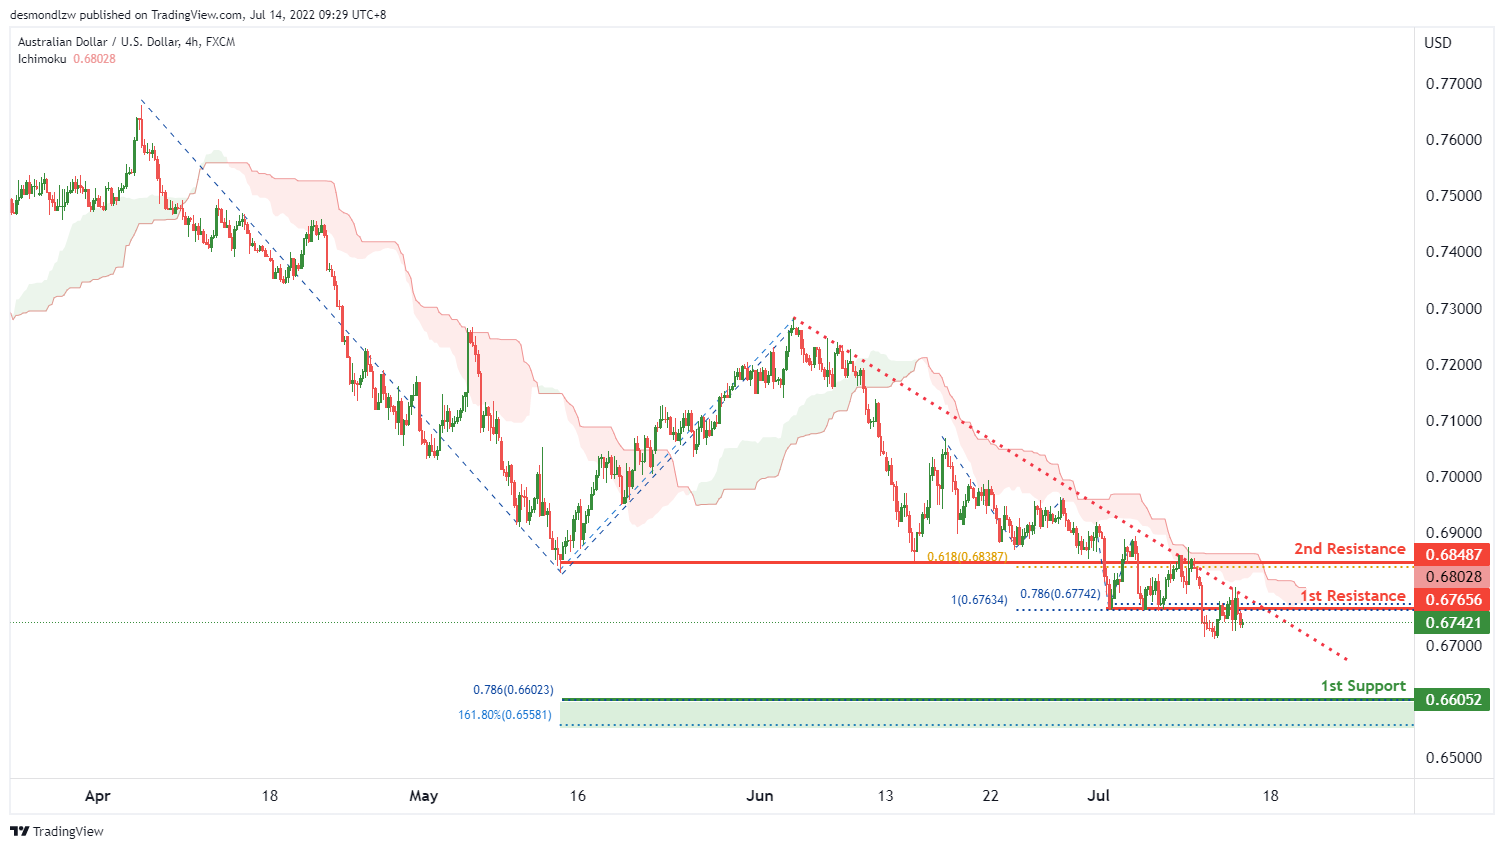
On the H4, with price moving below the ichimoku cloud and in a descending trendline, we have a bearish bias that price will continue to drop from the 1st resistance at 0.67656 in line with the 100% and 78.6% fibonacci projections to the 1st support at 0.66052 in line with the 161.8% fibonacci extension and 78.6% fibonacci projection. Alternatively, price may reverse off the 1st resistance and rise to the 2nd resistance at 0.68487 in line with the overlap swing high and 61.8% fibonacci projection
Areas of consideration
- H4 1st resistance at 0.67656
- H4 1st support at 0.66052
NZD/USD:
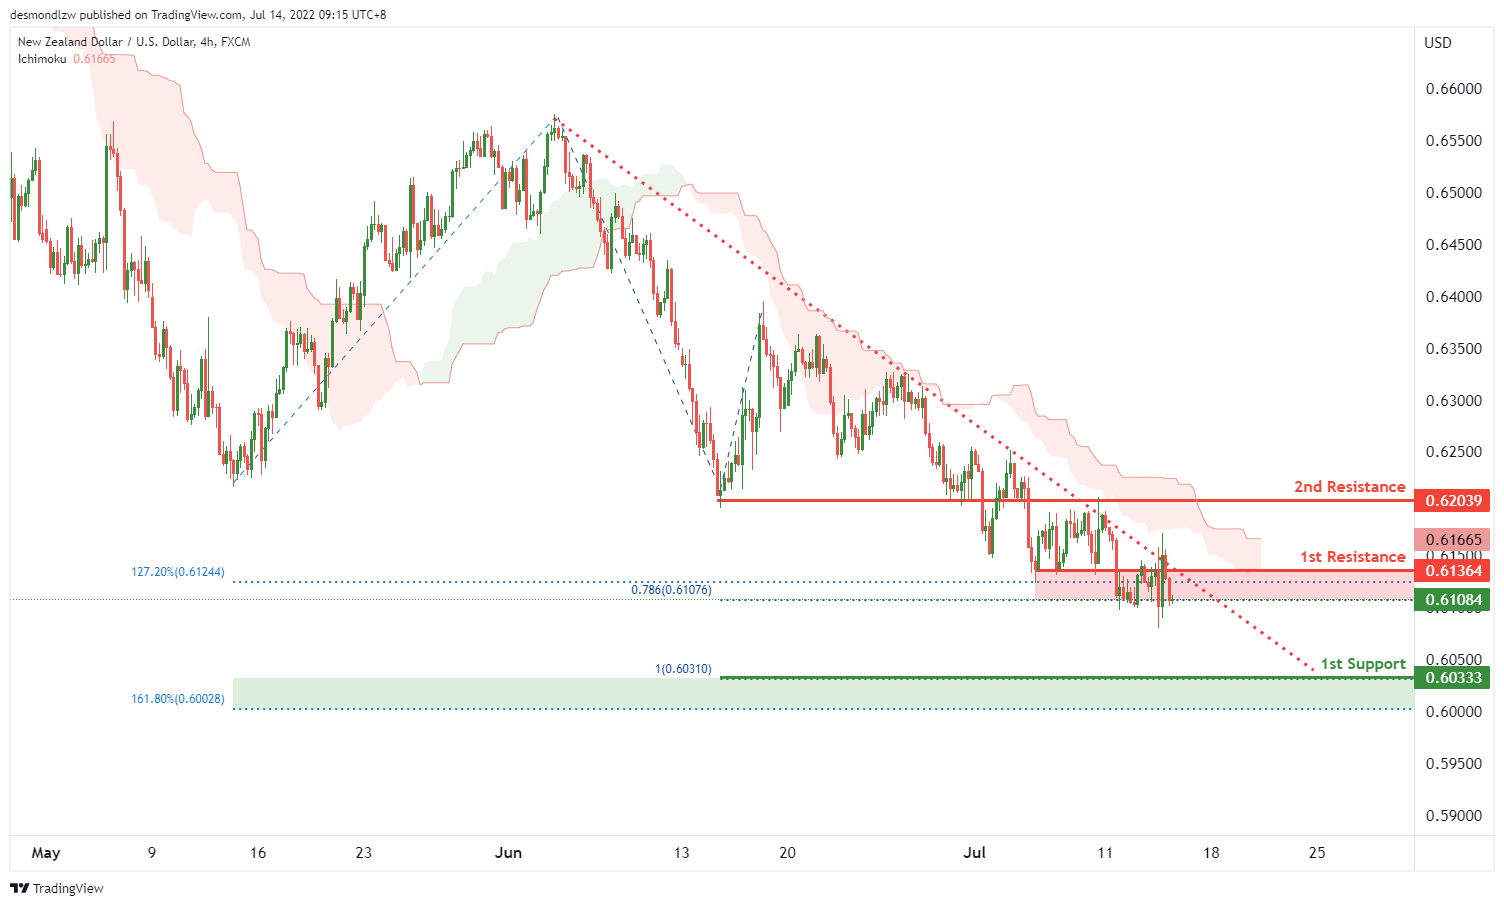
On the H4, with price moving below the ichimoku cloud and in a descending trendline, we have a bearish bias that price will continue to drop from the 1st pullback resistance at 0.61364 in line with the 127.2% fibonacci extension and 78.6% fibonacci projection to the 1st support at 0.60333 in line with the 161.8% fibonacci extension and 100% fibonacci projection. Alternatively, price may reverse off the 1st resistance and rise to the 2nd resistance at 0.62039 in line with the overlap swing high.
Areas of consideration:
- H4 time frame, 1st support at 0.60333
- H4 time frame, 1st resistance at 0.6136
USD/CAD:
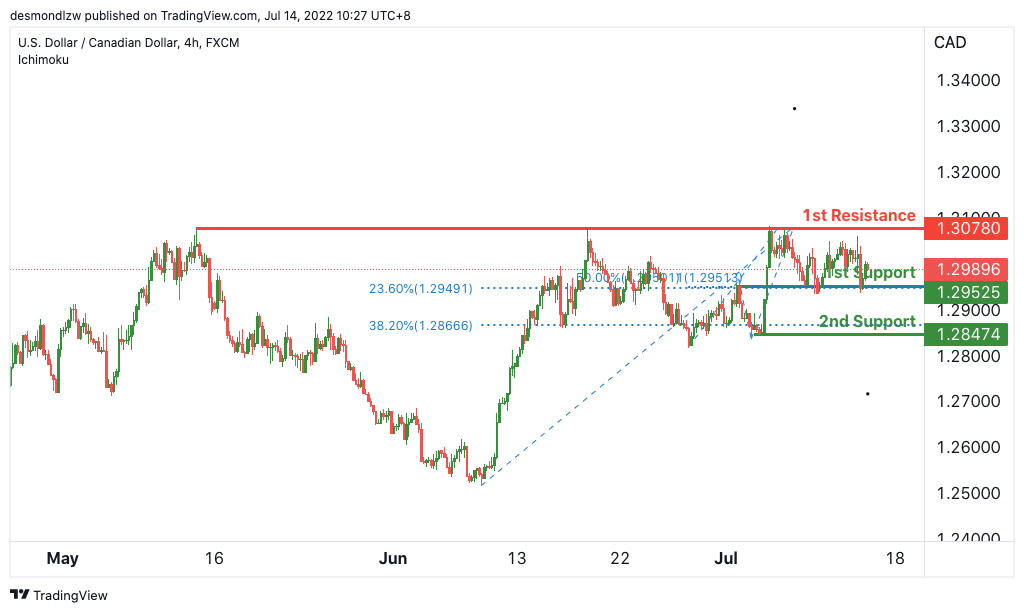
On the H4, with price moving above the ichimoku cloud, we have a bullish bias that price will rise from our 1st support at 1.29525 where the horizontal pullback support and fibonacci confluence are to our 1st resistance at 1.30780 in line with the horizontal swing high resistance. Alternatively, price may not break 1st support and head for 2nd support where the horizontal swing low support is.
Areas of consideration:
- H4 time frame, 1st resistance at 1.30780
- H4 time frame, 1st support at 1.29525
OIL:
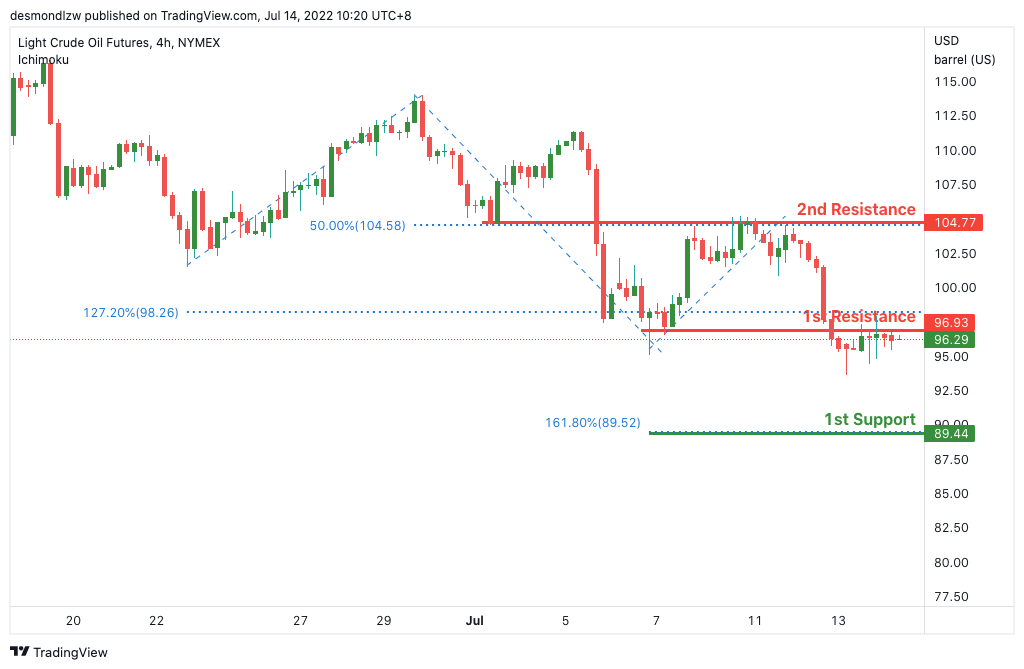
On the H4, with price moving below the ichimoku cloud, we have a bearish bias that price will drop to our 1st support at 89.44 where the 161.8% Fibonacci extension is from our 1st resistance at 96.93 in line with the horizontal pullback resistance and 50% Fibonacci retracement. Alternatively, price may break 1st resistance and head for 2nd resistance at 104.77 where the horizontal pullback resistance and 50% Fibonacci retracement is.
Areas of consideration:
- H4 time frame, 1st resistance of 96.93
- H4 time frame, 1st support of 89.44
Dow Jones Industrial Average:
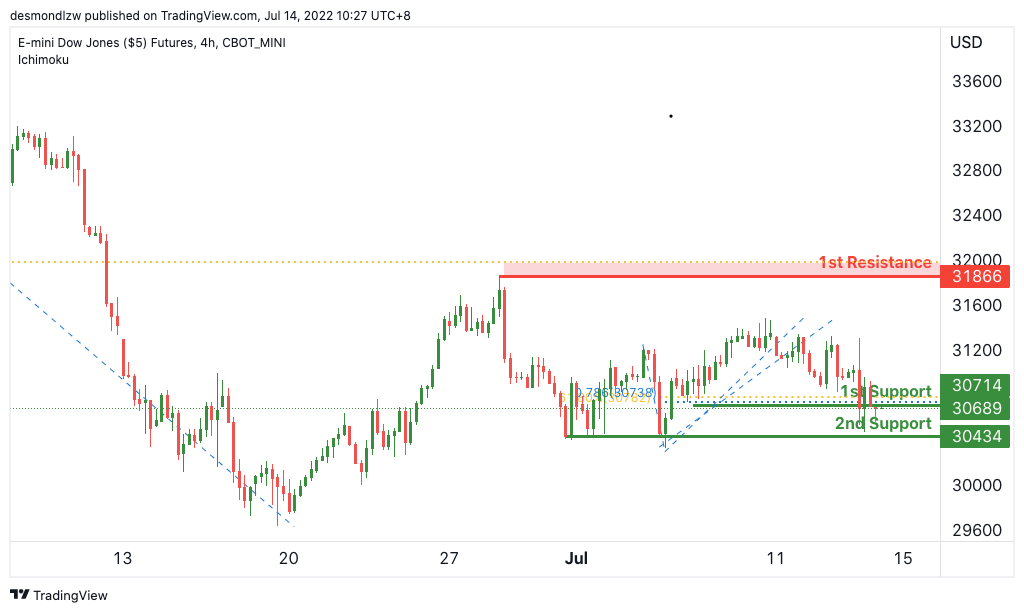
On the H4, with price moving above the ichimoku cloud, we have a bullish bias that price will rise from our 1st support at 31218 where the horizontal pullback support is to our 1st resistance at 31866 in line with the horizontal swing high resistance. Alternatively, price may not break 1st support and head for 2nd support at 30434 where the horizontal swing low support is.
Areas of consideration:
- H4 time frame, 1st resistance of 31866
- H4 time frame, 1st support of 31218
Elliott Wave View: Bearish Trend in EURUSD Remains Intact
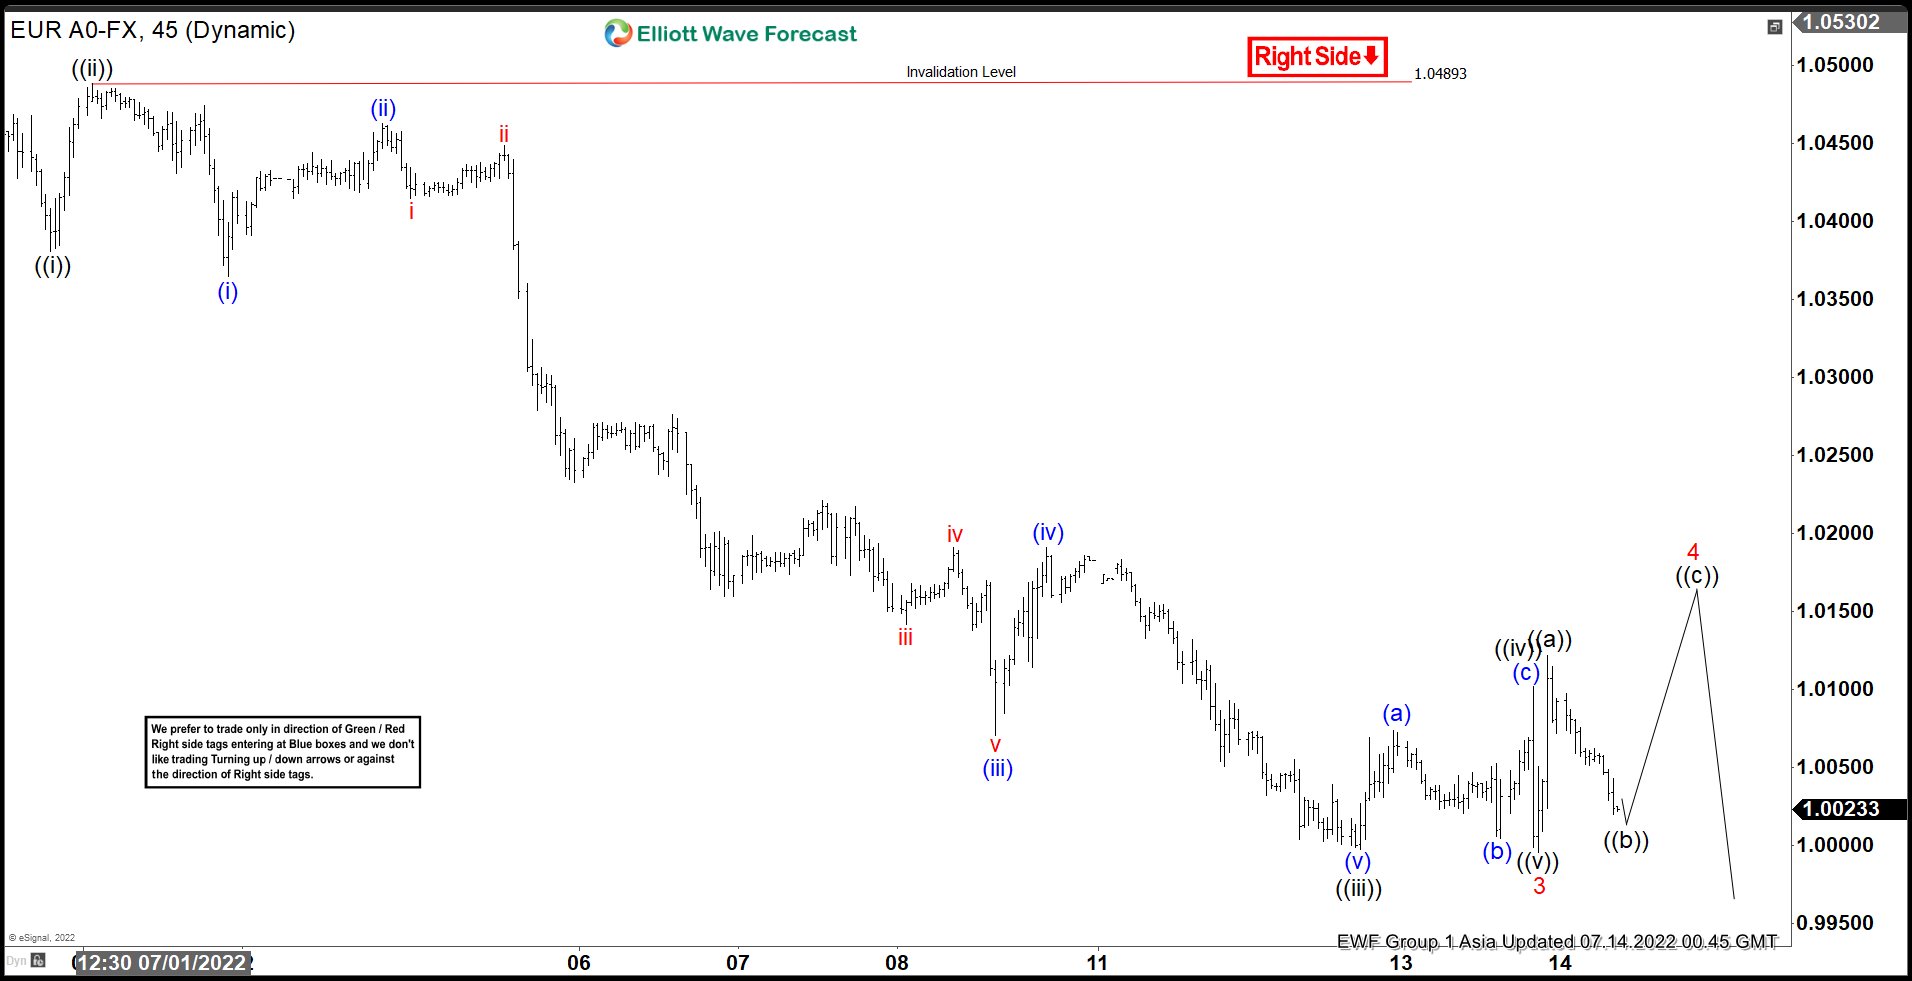
Short term Elliott Wave view in $EURUSD suggests decline from 5.31.2022 peak is unfolding as a 5 waves impulse Elliott Wave structure. Down from 5.31.2022 peak, wave 1 ended at 1.0357 and rally in wave 2 ended at 1.0615. The 45 minutes chart below shows the wave 3 lower which subdivided into another 5 waves in lesser degree. Down from wave 2, wave ((i)) ended at 1.0381 and rally in wave ((ii)) ended at 1.0489. Pair then resumes lower in wave ((iii)) towards 0.9998 and rally in wave ((iv)) ended at 1.01019. Final leg lower wave ((v)) ended at 0.9996 which completed wave 3. Rally in wave 4 is in progress with internal subdivision as a zigzag Elliott Wave structure.
Up from wave 3, wave ((a)) ended at 1.0122. While wave ((b)) pullback stays above 0.9996, pair can see another leg higher in wave ((c)) to complete wave 4. Potential area for wave 4 to complete is 100% – 161.8% fibonacci extension of wave ((a)) estimated to be around 1.0137 – 1.0215. Near term, as far as pivot at 1.0489 stays intact, rally should fail in the sequence of 3, 7, or 11 swing for further downside.
EURUSD 45 Minutes Elliott Wave Chart
WTI Wave Analysis
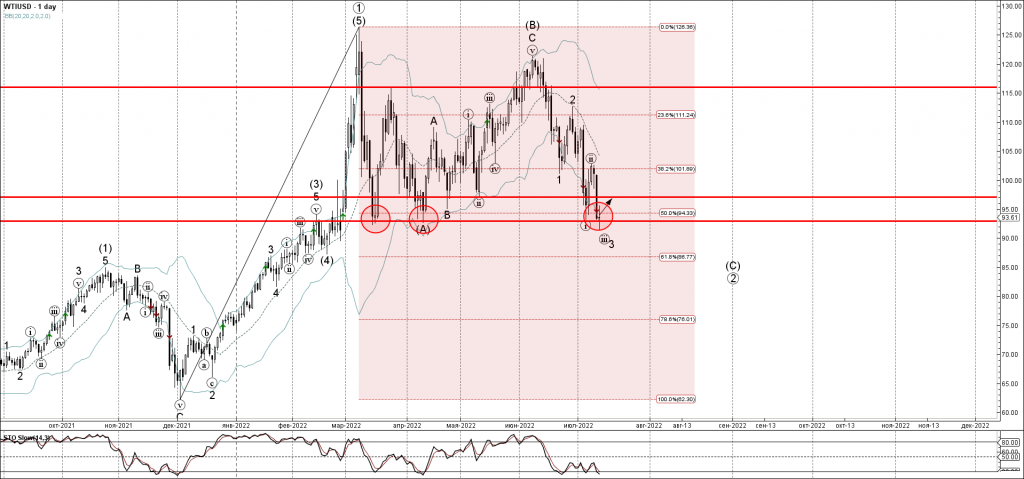
- WTI reversed from support level 92.93
- Likely to rise to resistance level 97.00
WTI recently reversed up from the strong support level 92.93 (former monthly low from March and April), standing near the 50% Fibonacci correction of the upward impulse from December.
The upward reversal from the support level 92.93 stopped the previous minor impulse waves (iii) and 3 – which belong to wave (C) from June.
Given the still oversold daily Stochastic, WTI can be expected to rise further toward the next resistance level 97.00.
EURGBP Wave Analysis
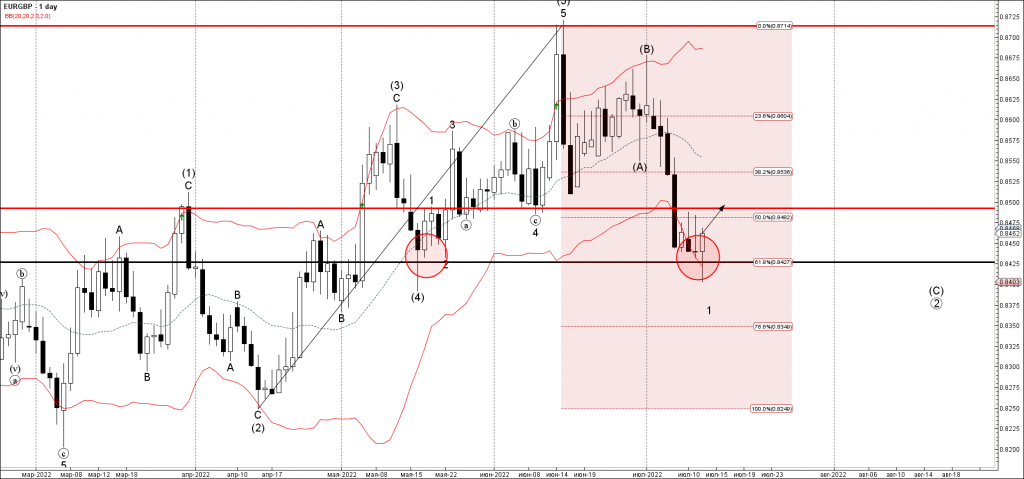
- EURGBP reversed from support level 0.8425
- Likely to rise to resistance level 0.85000
EURGBP today recently reversed up with the daily Hammer from the key support level 0.8425 (which has been reversing the pair from May), intersecting with the lower daily Bollinger Band and the 61.8% Fibonacci correction of the upward impulse from April.
The upward reversal from the support level 0.8425 stopped the previous minor downward impulse wave 1.
EURGBP can be expected to rise further toward the next resistance level 0.85000 (former monthly low from June).
AUDUSD Bounces-off 2-Year Low But Retains Bearish Outlook
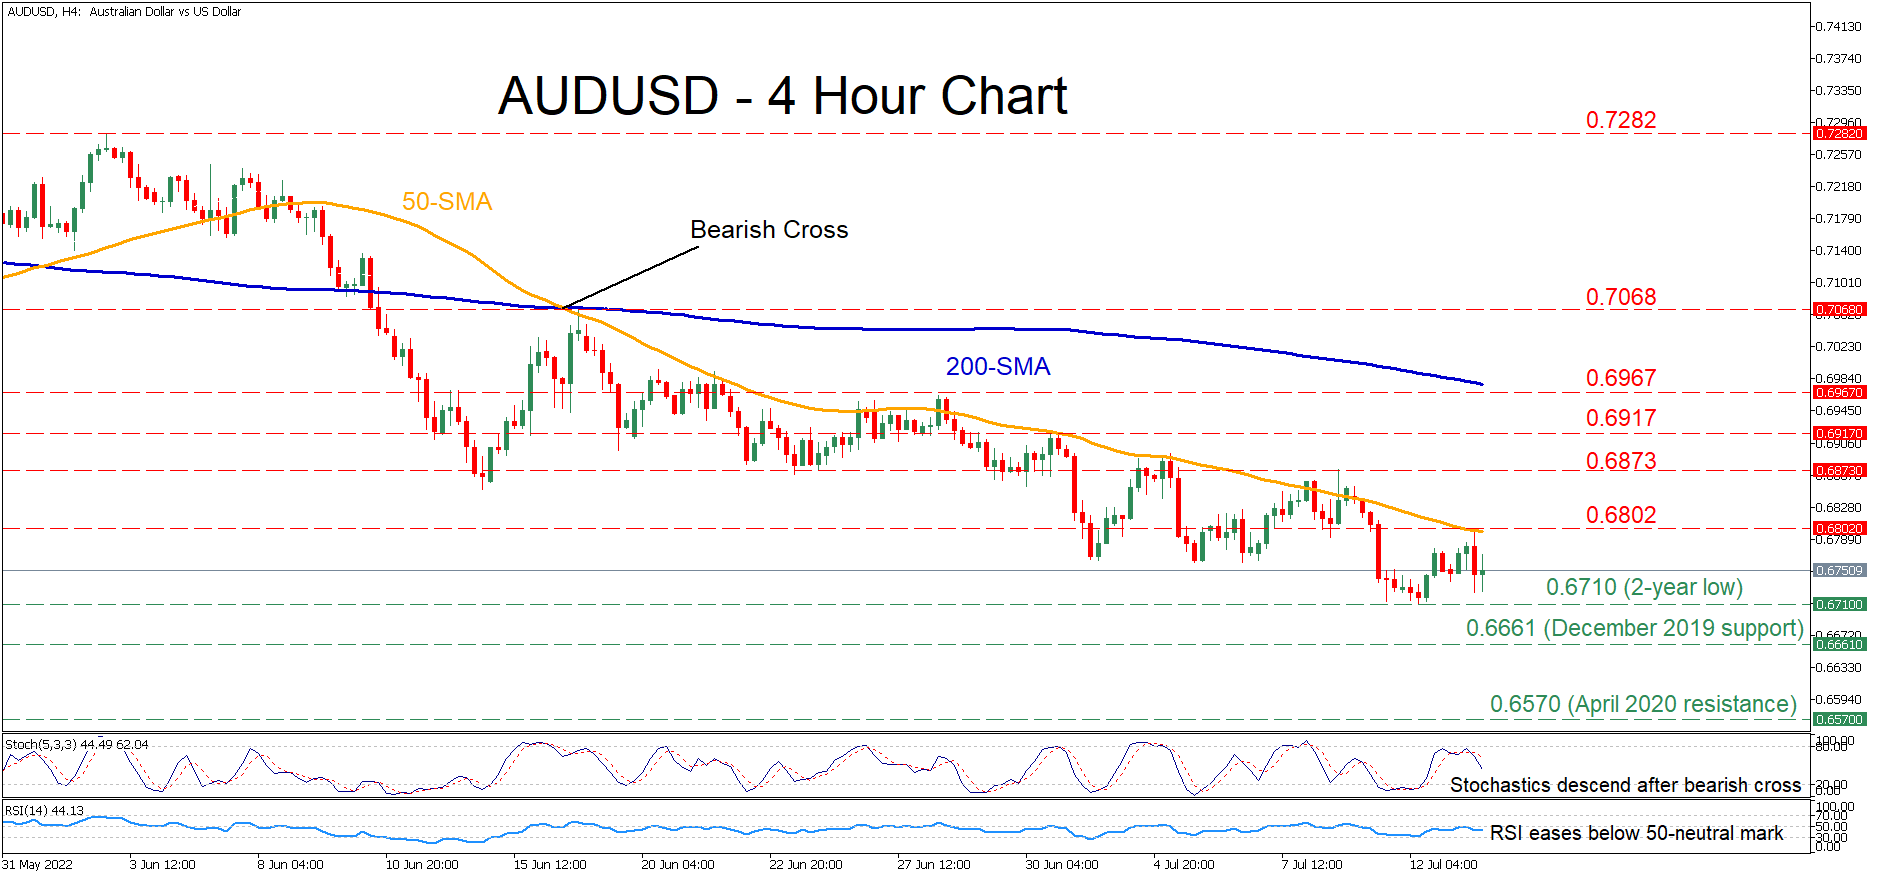
AUDUSD has been experiencing a sustained downtrend, generating a profound structure of lower highs and lower lows. However, in the last few four-hour sessions, the pair has adopted a sideways pattern after it managed to cease its decline at the two-year low of 0.6710.
The momentum indicators suggest that bearish forces remain in control. Specifically, the RSI is flatlining beneath its 50-neutral mark, while the stochastic oscillator is sloping downwards after posting a bearish cross.
If negative momentum strengthens, the price could descend towards its recent two-year low of 0.6710. Should that floor collapse, the pair would extend its decline to form fresh multi-year lows, where the December support of 0.661 could halt any further downside moves. Piercing through this barrier, the spotlight might then turn to the April 2020 resistance of 0.6570.
Inversely, bullish actions may meet initial resistance at the recent peak of 0.6802, which overlaps with the 50-period simple moving average. Jumping above this region, the bulls could aim for 0.6873 before the 0.6917 hurdle appears on the radar. An upside violation of the latter could open the door for 0.6967.
Overall, AUDUSD maintains both its bearish short- and long-term outlooks. For the former to alter, the price needs to decisively cross above the 0.6967 ceiling.
Markets Too Spooked by US Inflation
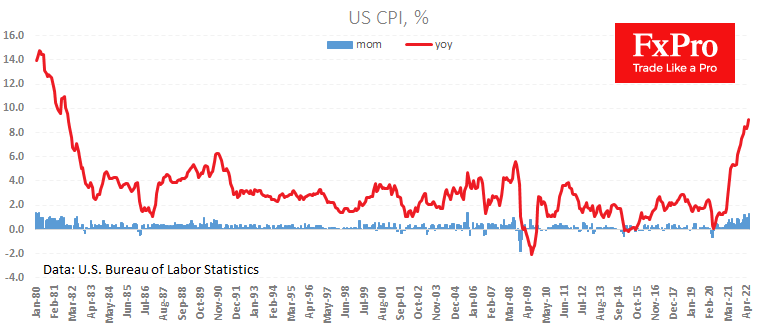
US consumer inflation hit a 41-year high and beat forecasts, reaching 9.1% y/y in June against 8.6% a month earlier and expected an increase to 8.8%. The data above expectations triggered a jump in the dollar and renewed pressure on risk-sensitive assets.
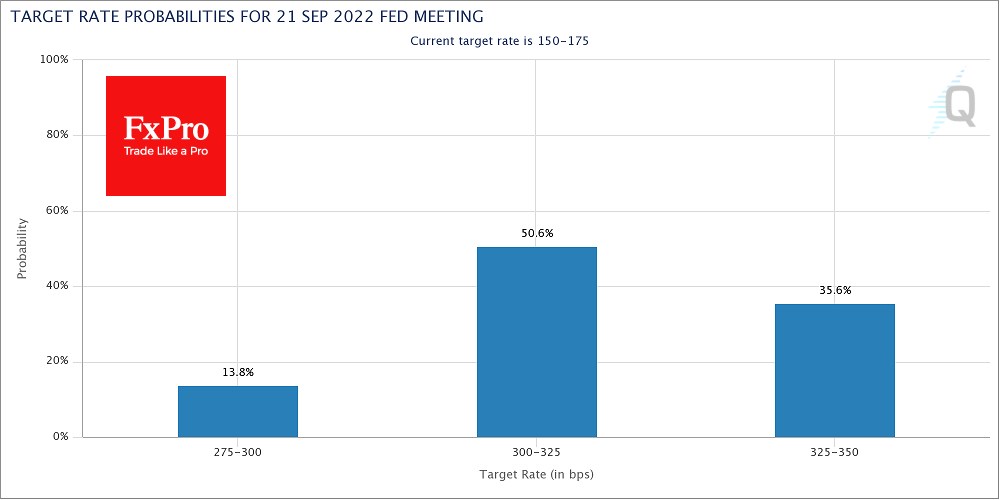
Speculation among traders increased that the Fed will have to do more than what is already priced in to catch up and suppress inflation. After the report, markets priced in two more 75-point rate hikes, while Powell called June’s hike “extraordinary”.
The initial market reaction triggered a retest of euro-dollar parity, but the single currency has so far managed to find demand at these levels. The same is true for other key currencies, which are running near local extremes against the dollar but successfully holding their ground.
Meanwhile, equities got a knock, with the Nasdaq index losing around 2% today and 3.9% from pre-release levels. Bitcoin has fallen below $19,000, returning to the lows of early July.
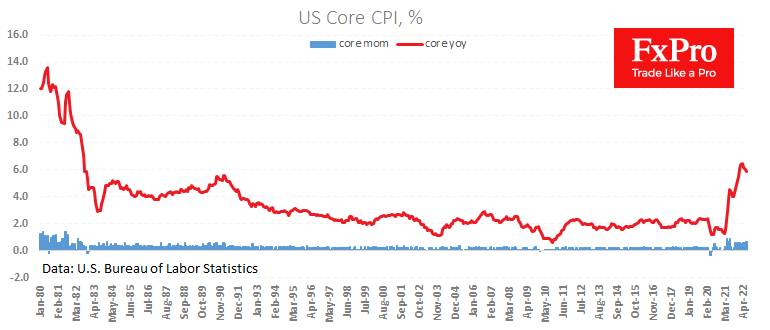
However, there is a sense that markets have jumped over their heads in their expectations from the Fed. Oil and industrial metals prices have been falling for about a month. The core inflation index, which does not include food and energy, has slowed for the past three months to 5.9% from a peak of 6.5% in March, although the monthly growth rate remains above the long-term average.
It would not be surprising if the Fed, after the 75-point rate hike at the end of July, were to reassure the markets that it would proceed more measuredly so as not to overcool the economy.
Bank of Canada Delivers Supersized 1% Hike
The Bank of Canada raised the overnight rate to 2.5% and stated that it will continue with Quantitative Tightening (QT).
On rising prices, it stated that "inflation in Canada is higher and more persistent than the Bank expected in its April Monetary Policy Report (MPR), and will likely remain around 8% in the next few months."
On economic growth, the Bank stated that it "expects Canada’s economy to grow by 3½% in 2022, 1¾% in 2023, and 2½% in 2024. Economic activity will slow as global growth moderates and tighter monetary policy works its way through the economy. This, combined with the resolution of supply disruptions, will bring demand and supply back into balance and alleviate inflationary pressures."
On today's surprise 1% hike, the Bank noted that "with the economy clearly in excess demand, inflation high and broadening, and more businesses and consumers expecting high inflation to persist for longer, the Governing Council decided to front-load the path to higher interest rates by raising the policy rate by 100 basis points today."
Key Implications
The Bank of Canada cranks up the AC again in an effort to cool the economy. The supersized 100 basis point hike is its most aggressive move since the summer of 1998. If that feels like a long time ago, it was. Coincidentally, that summer Armageddon was topping the box office and the world was singing "I Don't Want to Miss a Thing". Though this isn't Armageddon, this BoC meeting is not one to be missed.
This big step up in rates is uncommon, so too is the economic backdrop. With the unemployment rate at 4.9%, wages running at 5.2%, and inflation at 7.7%, the pressure on the BoC has not let up. As we recently discussed in our updated Quarterly Economic Forecast, the hit to consumers from high inflation and rising rates will weigh on growth over the remainder of this year and into 2023. Though this raises the risk that the economy tips into recession, the Bank has to accept this risk (and possible outcomes) in order to prevent high inflation expectations from becoming even more entrenched.
All eyes will be on Governor Macklem in his upcoming press conference. If this is indeed "front loaded", then it may not be followed with another 1% move in September, and we could see something back in the 50 to 75 basis point range…although, that would still mean it's a supersized summer.
Sterling Pares Losses after US CPI Jumps
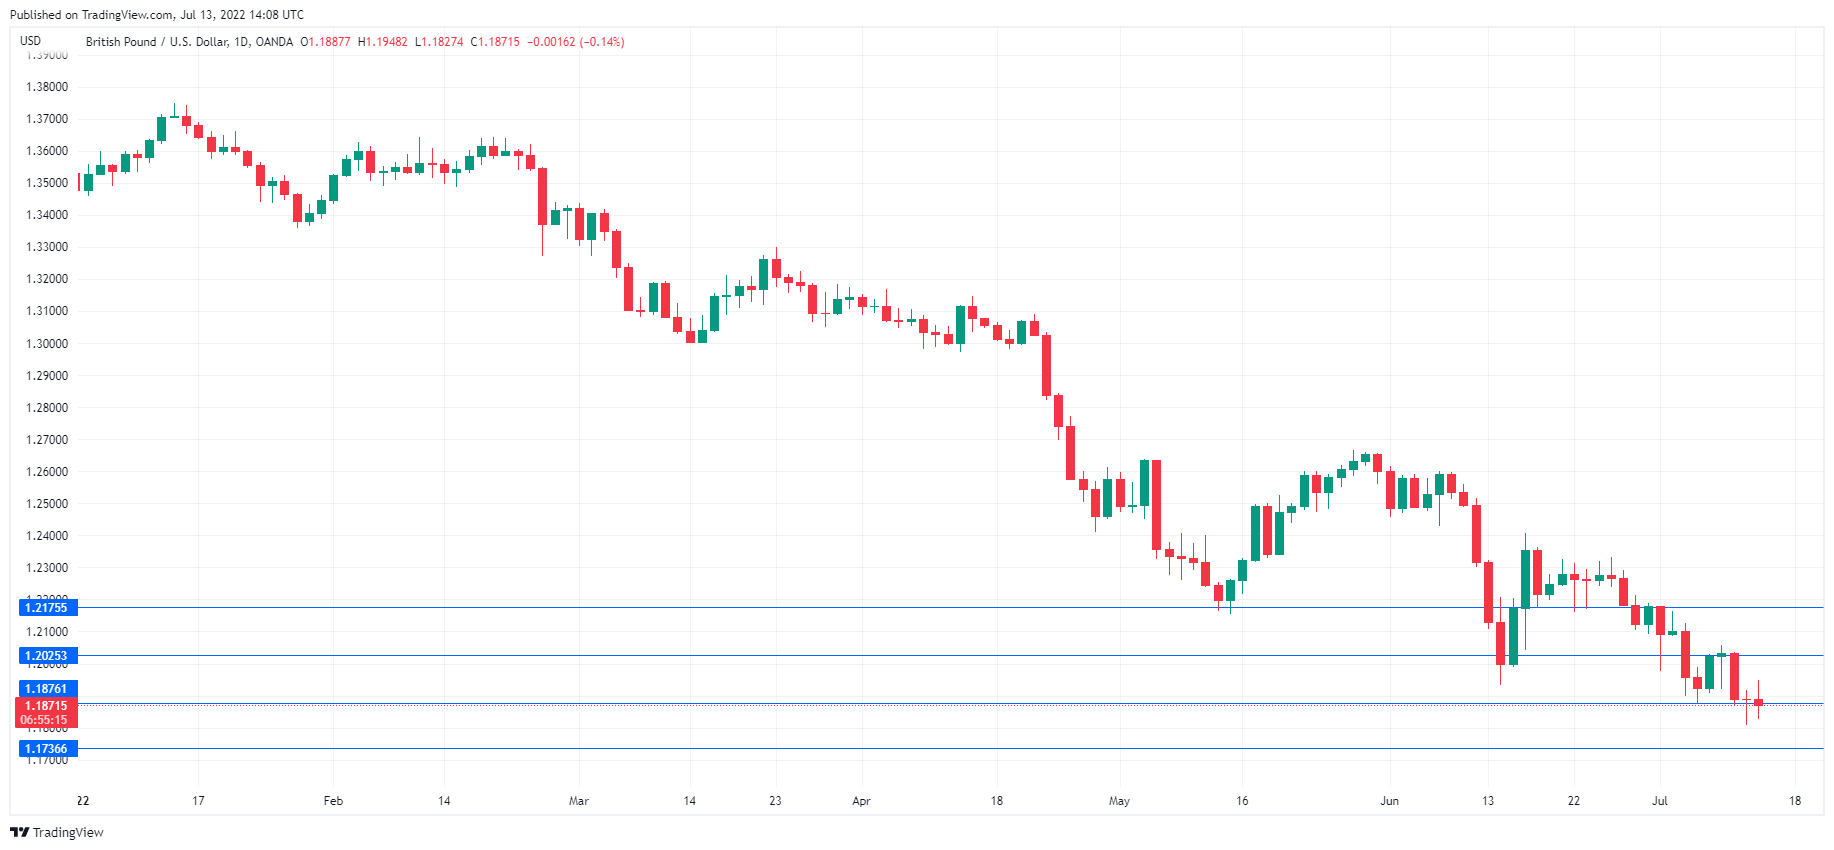
The British pound has taken investors for a ride today, as GBP/USD dropped sharply but has since recovered. In the North American session, GBP/USD is trading at 1.1856, down 0.28%. It has been a busy day on the economic calendar, with a host of UK releases and the US inflation report.
US inflation accelerates (again)
In the US, the long-sought-after inflation peak remains as elusive as ever. The June inflation report showed headline inflation rising to 9.1% YoY, up from 8.6% and above the 8.8% estimate. Core CPI ticked lower to 5.9%, down from 6.0%. Still, this was higher than the forecast of 5.7%. With inflation remaining at high levels, the path is clear for the Fed to fire at will in order to curb inflation. Just a few days ago, CME’s FedWatch pegged a 75bp hike at 93%, with a 7% chance of a 100bp move. The June inflation release has dramatically changed the FedWatch assessment, with a 53.6% of a 75bp move and 46.3% likelihood of a 100bp hike.
The British pound took a tumble immediately after the US inflation release, falling 0.76%. The pound has managed to claw back most of these losses, but the risk of the US dollar moving higher remains elevated, as a massive 100bp increase has become a very real possibility at the Fed meeting in late July.
Overshadowed by the dramatic US inflation report, UK indicators enjoyed a good day. GDP for May rose 0.5% MoM, bouncing back from a -0.2% reading in April and beating the estimate of 0.1%. Industrial Production and Manufacturing Production both ended a 3-month skid with monthly gains of 1.4% and 0.9%, respectively. Still, the bigger picture for the UK economy is not a rosy one, as a Bloomberg poll of economists indicated a 45% likelihood of the UK economy tipping into a recession in the next 12 months.
GBP/USD Technical
- GBP/USD tested support at 1.1876 earlier in the North American session. Below, there is support at 1.1736
- GBP/USD faces resistance at 1.2025 and 1.2175
BoC hikes 100bps to 2.5%, maintains hawkish bias
BoC raises overnight rate target by 100bps to 2.50% today, even larger than expectation of 75bps. The Bank Rate and deposit rate are now at 2.75% and 2.50% respectively. BoC will also continuing its policy of quantitative tightening.
The central bank also maintains hawkish bias, and said, "the Governing Council continues to judge that interest rates will need to rise further, and the pace of increases will be guided by the Bank's ongoing assessment of the economy and inflation"
On the economy, BoC estimated that GDP grew by about 4% in Q2, and will slow to about 2% in Q3. The economy is projected to grow by 3.50% in 2022, 1.75% in 2023, and then 2.50% in 2024. Inflation is projected to slow to about 3% by then end of next year, and then returns to 2% target by the end of 2024.