Sample Category Title
GBP/USD Daily Outlook
Daily Pivots: (S1) 1.1886; (P) 1.2046; (R1) 1.2158; More...
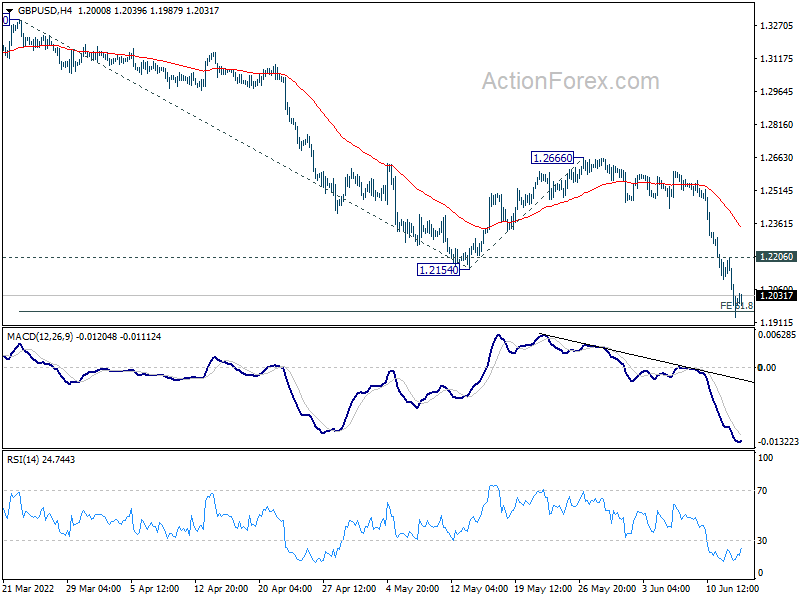
Intraday bias in GBP/USD remains on the downside as down trend is still in progress. Sustained trading below 61.8% projection of 1.3297 to 1.2154 from 1.2666 at 1.1960 will pave the way to 100% projection at 1.1523 next. On the upside, above 1.2206 minor resistance will turn intraday bias neutral and bring consolidations first, before staging another decline.
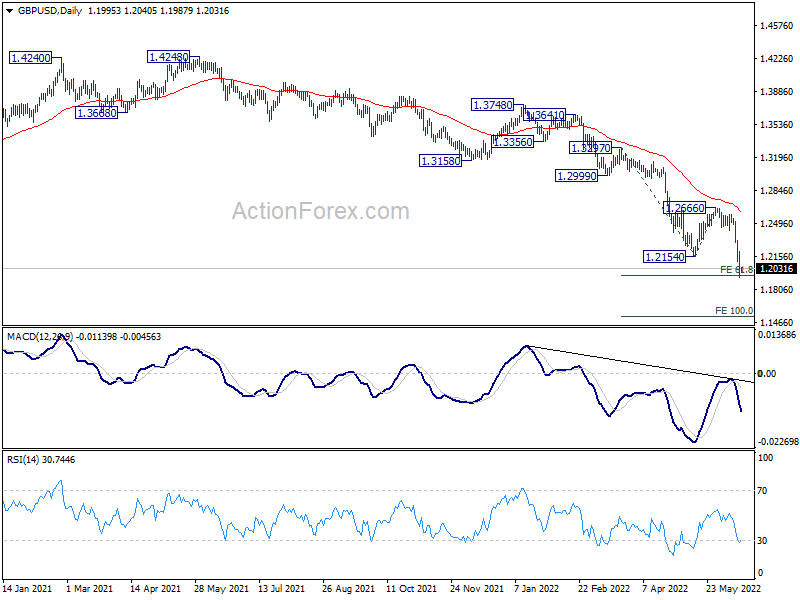
In the bigger picture, fall from 1.4248 (2018 high) could be a leg inside the pattern from 1.1409 (2020 low), or resuming the longer term down trend. Deeper decline is expected as long as 1.2666 resistance holds. On resumption, next target is 1.1409 low.
USD/CHF Daily Outlook
Daily Pivots: (S1) 0.9916; (P) 0.9976; (R1) 1.0079; More...
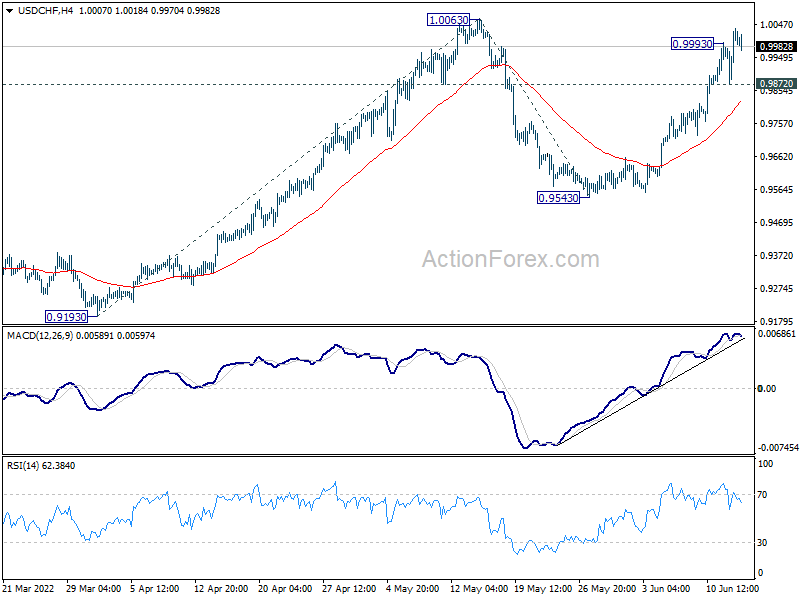
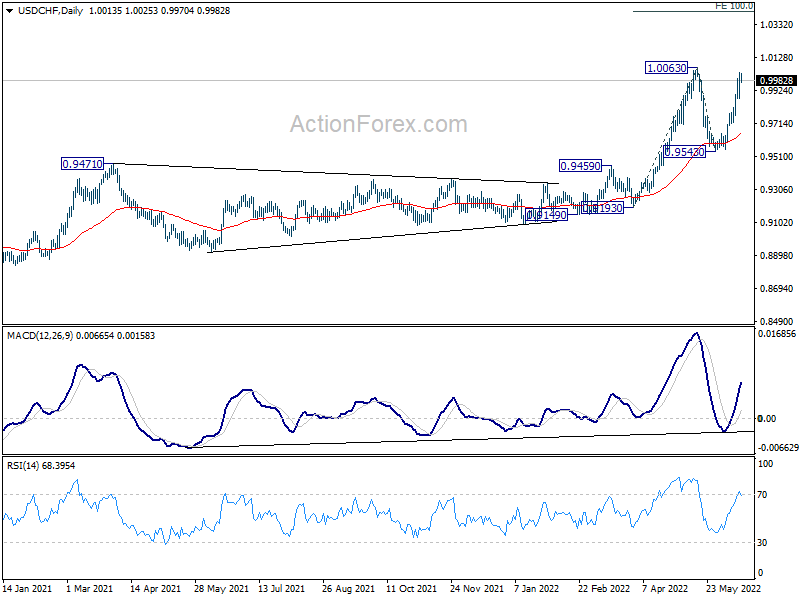
USD/CHF's rally resumed after brief consolidations. Intraday bias is back on the upside for 1.0063 resistance. Firm break there will resume larger up trend. Next target is 100% projection of 0.9193 to 1.0063 from 0.9543 at 1.0413. On the downside, below 0.9872 minor support will delay the bullish case and turn intraday bias neutral first.
In the bigger picture, down trend from 1.0342 (2016 high) should have completed with three waves down to 0.8756 (2021 low) already. Rise from 0.8756 is likely a medium term up trend of its own. Next target is 1.0237/0342 resistance zone. This will remain the favored case as long as 0.9471 resistance turned support holds. However, sustained break of 0.9471 will extend long term range trading with another falling leg.
USD/JPY Daily Outlook
Daily Pivots: (S1) 134.41; (P) 134.93; (R1) 135.99; More...
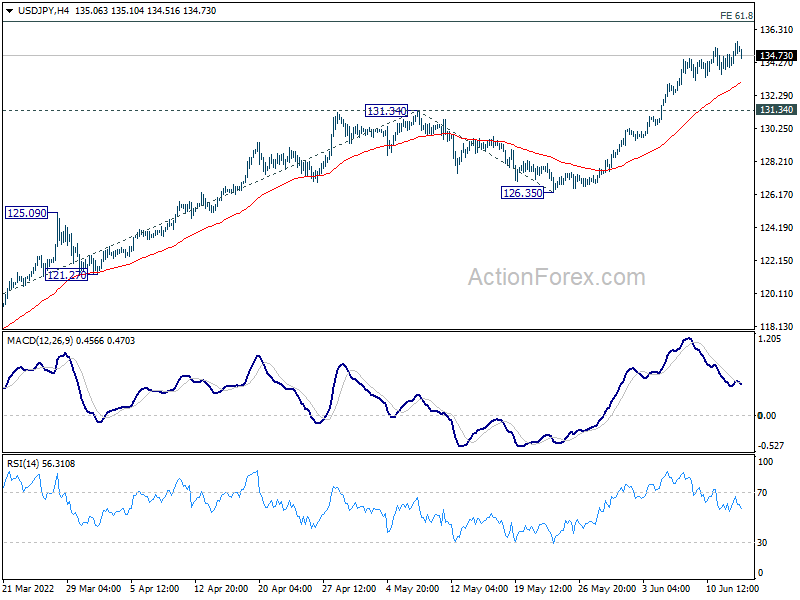
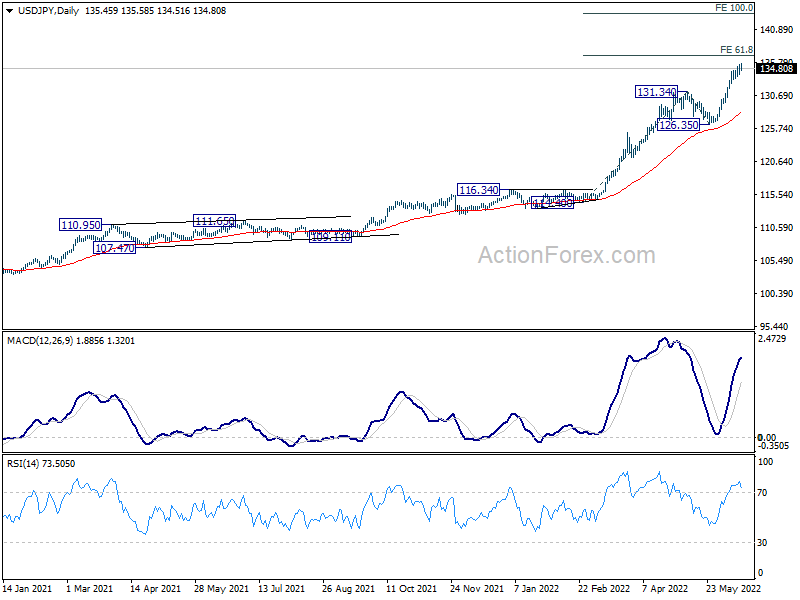
USD/JPY's rally resumes after brief consolidations. Current up trend should target 61.8% projection of 114.40 to 131.34 from 126.35 at 136.81. Firm break there will target 100% projection at 143.29. On the downside, break of 131.34 resistance turned support is needed to indicate short term topping. Otherwise, outlook will stay bullish in case of retreat.
In the bigger picture, current rally is seen as part of the long term up trend from 75.56 (2011 low). Next target is 100% projection of 75.56 (2011 low) to 125.85 (2015 high) from 98.97 at 149.26, which is close to 147.68 (1998 high). This will remain the favored case as long as 126.35 support holds.
AUD/USD Daily Report
Daily Pivots: (S1) 0.6826; (P) 0.6898; (R1) 0.6946; More...
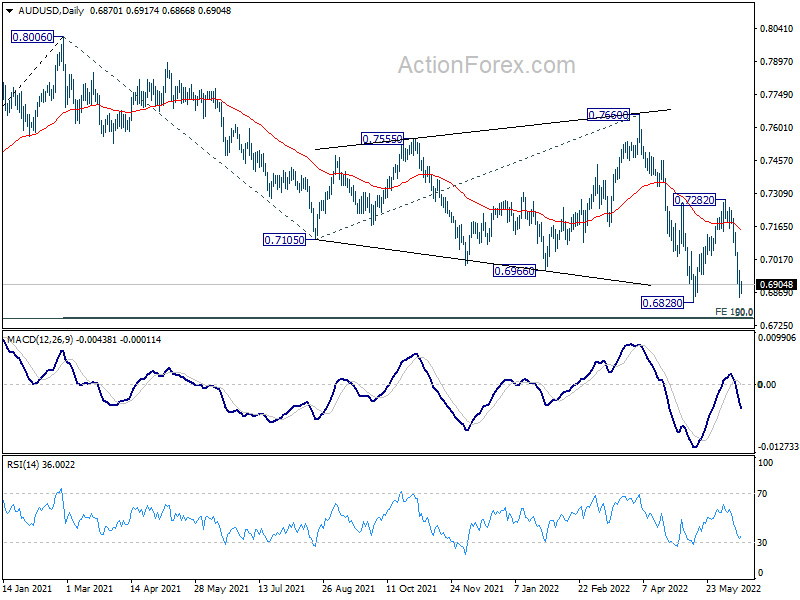
Intraday bias in AUD/USD remains on the downside with focus on 0.6828 low. Firm break there will resume larger fall from 0.8006 to 0.6756/60 cluster support. On the upside, above 0.7033 minor resistance will turn intraday bias neutral first. But risk will stay on the downside as long as 0.7282 resistance holds.
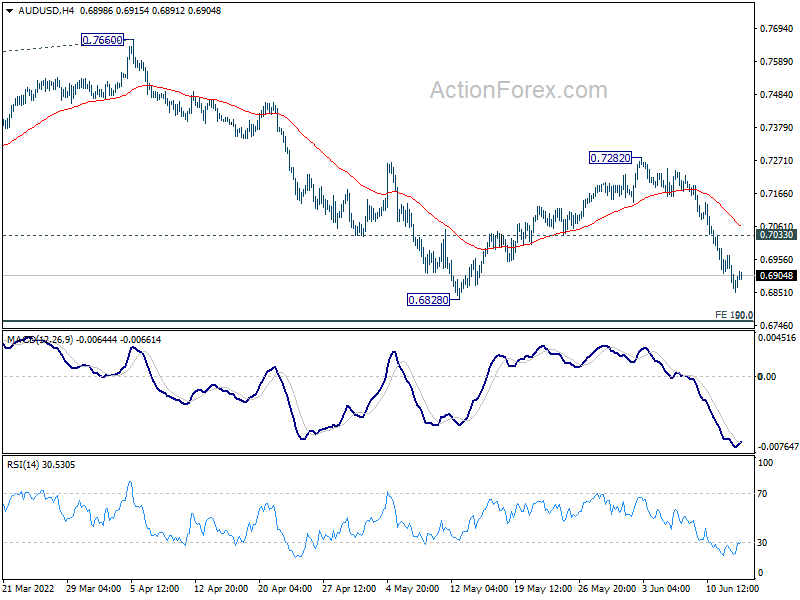
In the bigger picture, price actions from 0.8006 are seen as a corrective pattern to rise from 0.5506 (2020 low). Deeper fall could still be seen to 50% retracement of 0.5506 to 0.8006 at 0.6756. This coincides with 100% projection of 0.8006 to 0.7105 from 0.7660 at 0.6760. Strong support is expected from 0.6756/60 cluster to contain downside to complete the correction. Meanwhile, firm break of 0.7660 resistance will confirm that such corrective pattern has completed, and larger up trend is ready to resume.
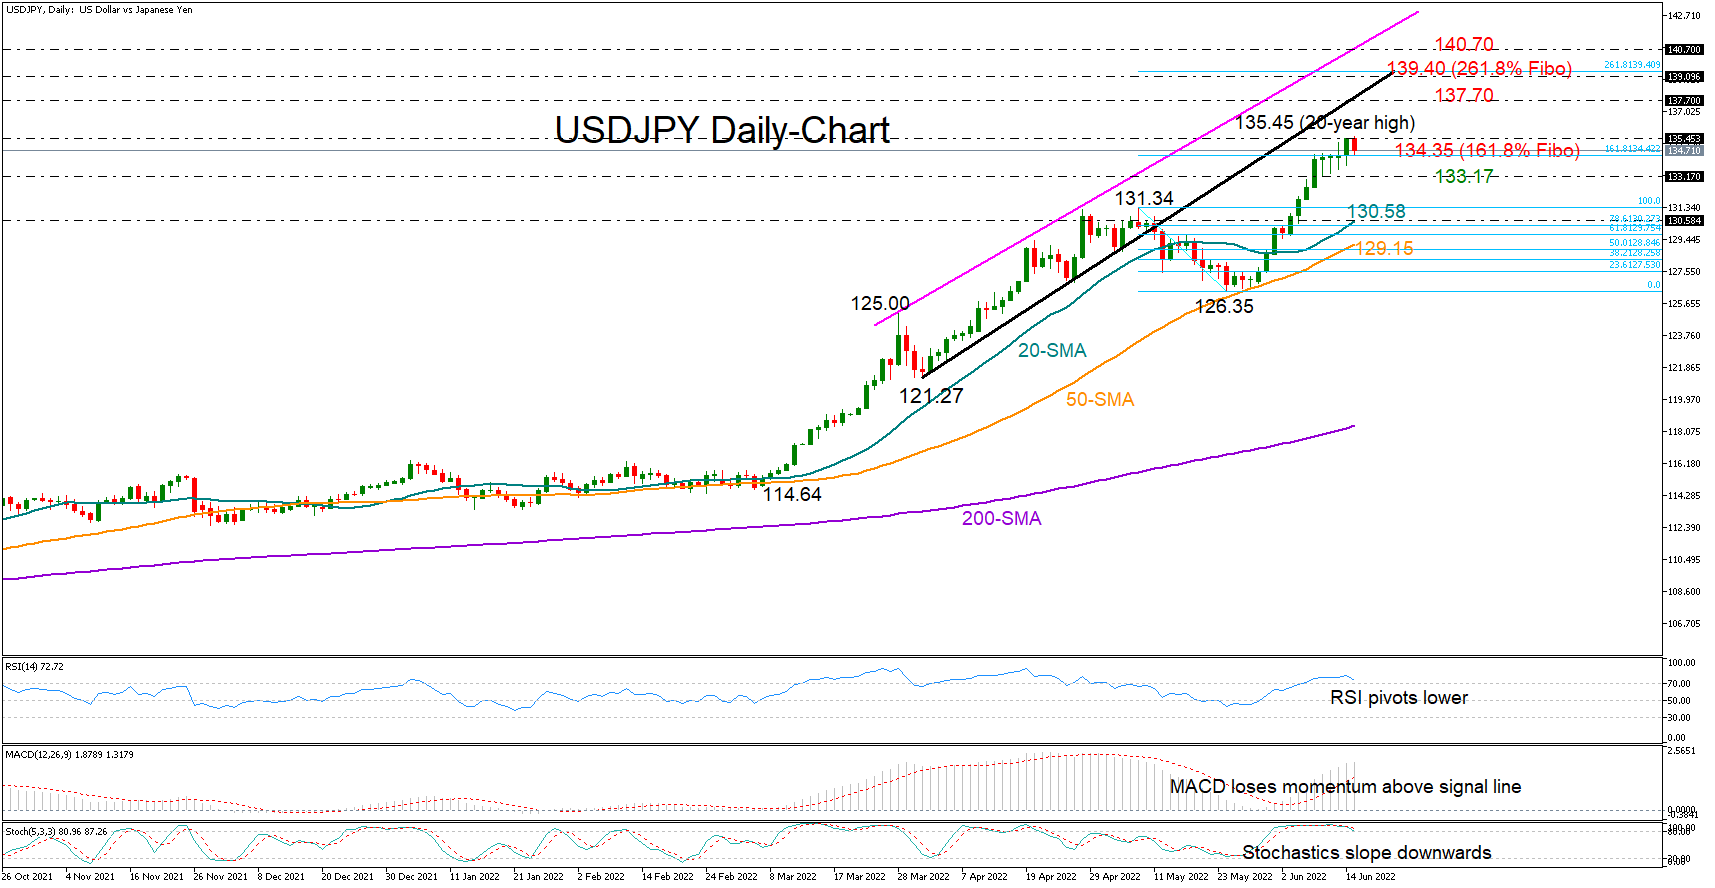
USDJPY Snaps Tough Resistance ahead of FOMC
USDJPY managed to close clearly above the tough resistance of 134.35 on Tuesday before pulling back during Wednesday’s early European trading hours, boosting optimism that the bullish cycle could see further continuation ahead of the FOMC policy announcement today at 18:00 GMT.
Some profit-taking cannot be ruled out in the short term as the RSI and the Stochastics seem to have reached a peak in the overbought territory and are looking for an exit, while the advance in the MACD seems to be losing momentum. Hence, traders may behave cautiously bullish in the coming sessions.
Nevertheless, if the price slips back below the 134.35 level, the spotlight will immediately shift to the 133.17 nearby support area. Another failure here could activate fresh selling towards the previous peak of 131.34, while the 20-day simple moving average (SMA) at 130.58 could be another spot to keep a close eye on ahead of the 50-day SMA at 129.15.
Should buying pressures resume above yesterday’s peak of 135.45, the pair may run up to the 137.70 region, where the broken support trendline could act as resistance this time. If the latter proves fragile, the door will open for the 261.8% Fibonacci extension of the latest downleg at 139.15, while a steeper increase could even test the constraining upward-sloping line drawn from March currently seen at 140.70.
In brief, the short- and long-term outlook remains bullish for USDJPY. In the meantime, traders will wait for directional signals either above 135.45 or below 133.17 before taking new positions.
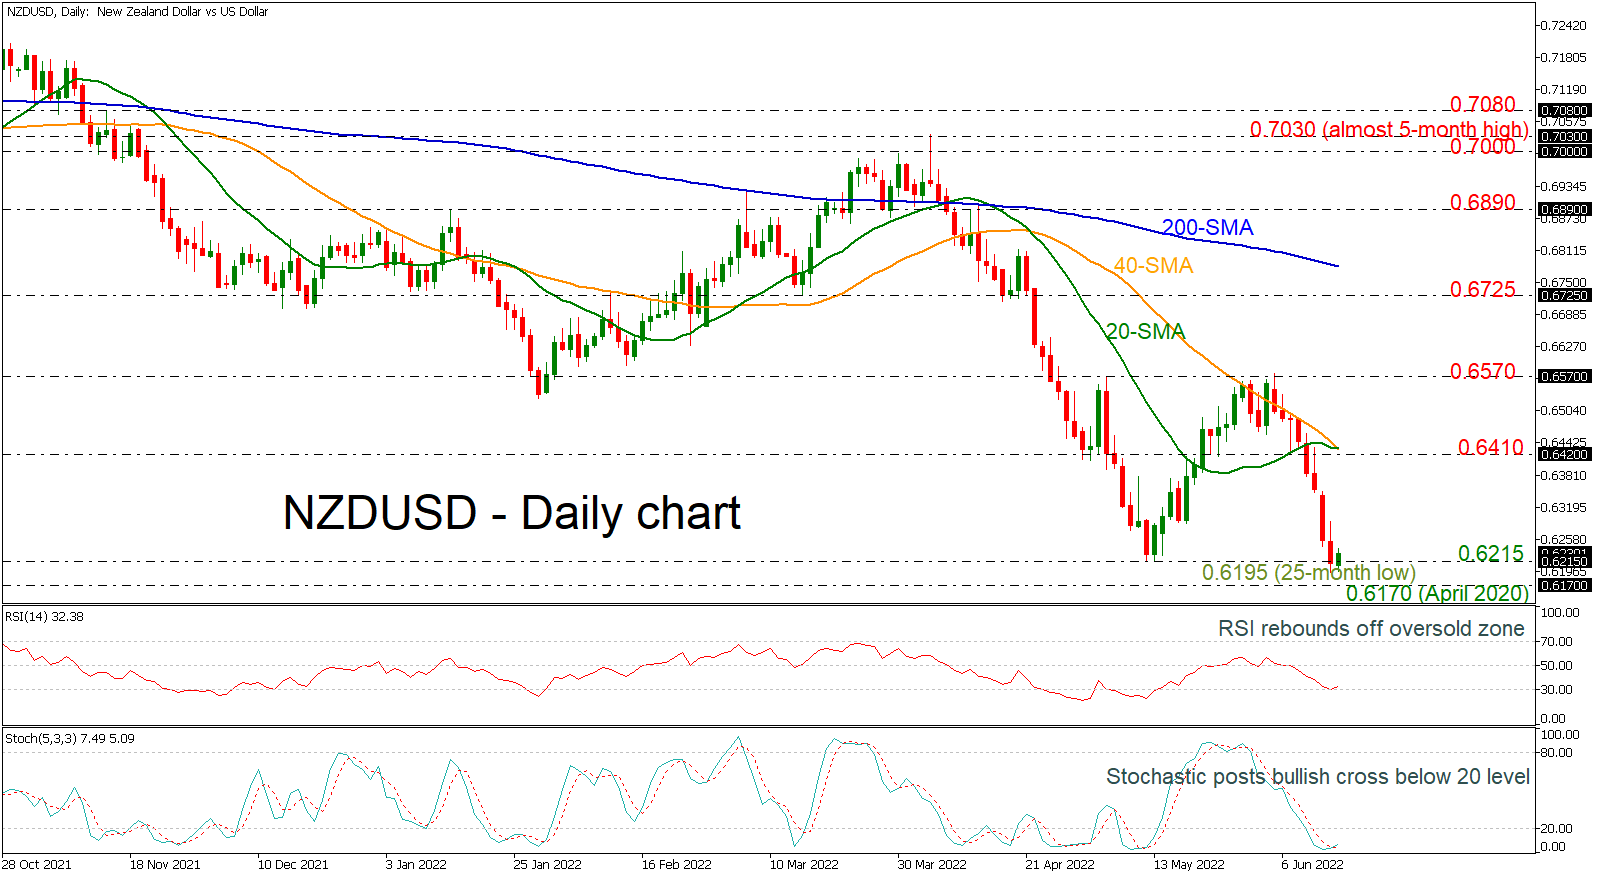
NZDUSD Bounces off 25-month Low Below 0.6200
NZDUSD is trying to recoup significant losses that were posted in the previous eight days, recording a new 25-month low below the 0.6200 round number.
The 20- and 40-day simple moving averages (SMAs) appear ready to post a bullish crossover in the short-term, while the technical indicators are confirming the recent positive move. The RSI rebounded off the oversold region, and the stochastic oscillator created a positive cross within its %K and %D lines below the 20 level, both suggesting that the aggressive selling interest may end soon.
Immediate resistance to further gains would likely come from the 0.6410 barrier and the short-term SMAs currently at 0.6430. If there is a successful break above this area, further resistance could be met around the 0.6570 barrier and the 0.6725 inside swing low from March 15.
If the upside momentum were to lose steam again and if the pair were to reverse lower, diving below the intraday’s low of 0.6195, then the next target could come from the 0.6170 support, registered in April 2020. Failure to hold above this level, the market would push the market to slip towards the 0.5920 barrier, taken from the low in May 2020.
In the more medium-term picture, the bearish outlook may remain intact and is likely to stay this way as long as prices remain below the short-term SMAs.
Daily Technical Analysis
EUR/USD
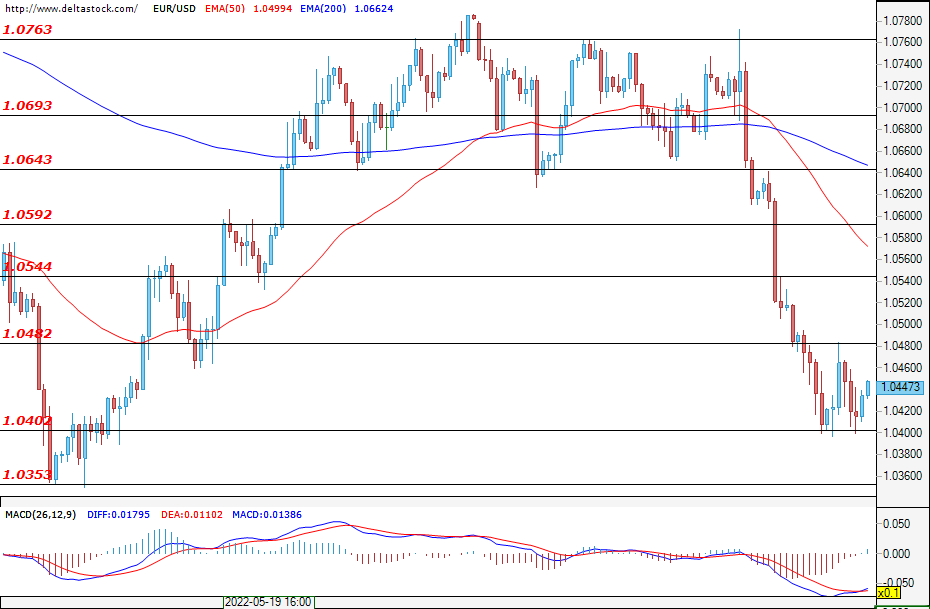
Yesterday’s trading session began with a bearish dominance, but later in the day, the bulls almost recovered all of their losses. At the time of writing the analysis, the bulls have gained momentum and are aiming to reach the first resistance at 1.0480. If they do not manage to overcome the aforementioned level, then the bears will most likely regain control of the market and will try to deal with the psychological support at 1.0400 – a level that they have failed to overcome in recent days. The most important event for today is the announcement of the Fed’s interest rate decision (18:00 GMT), with traders becoming more and more convinced that the central bank will hike the rate by 75 basis points. If this proves to be the case, then this will be the biggest increase since 1991 and volatility will be extremely high.
USD/JPY
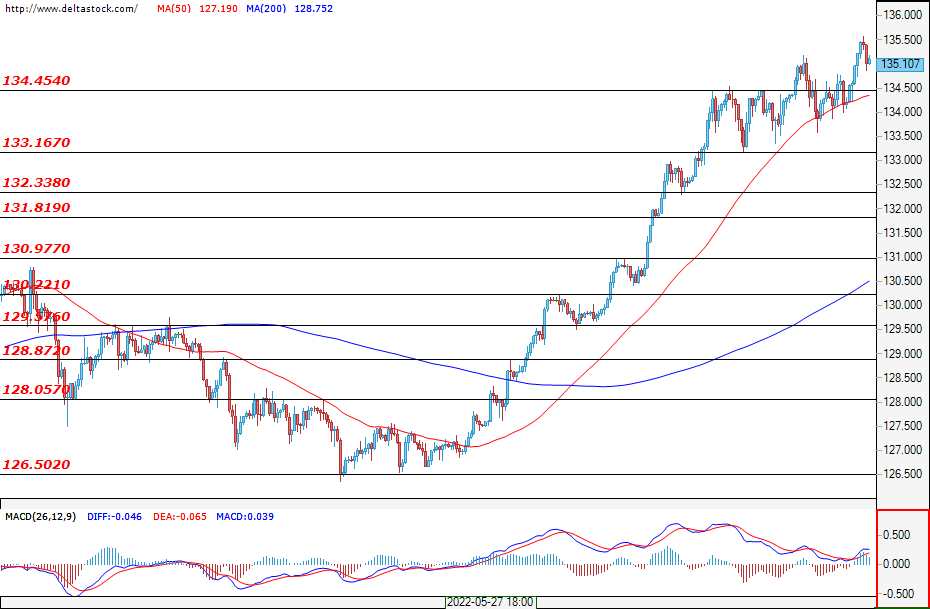
For the Ninja, yesterday's trading session was marked by a breach of the resistance at 134.50, and the bulls are now targeting the one at 137.00 – a level that has so far not been reached in the 21st century. At the time of writing, the bears have started a corrective move towards the first support at 134.50. If they are able to overcome it, then the next obstacle in front of them would be the support at 133.15.
GBP/USD
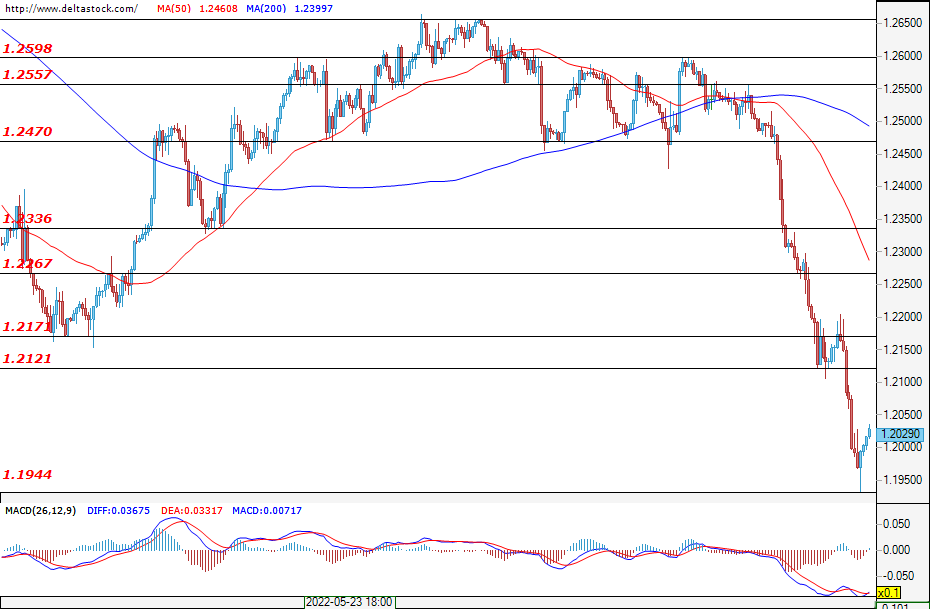
The bears tested the support at 1.1950, but failed to overcome it, and after their failure, the bulls managed to regain some of their market positions. At the time of writing the analysis, traders are trying to stage a rally towards the first resistance at 1.2121. The next key resistance would be the level at 1.2267, with the current move most likely being a corrective one. The Bank Of England interest rate decision on Thursday (11:00 GMT) and today’s Fed decision on whether to hike the rates by 50 bps or 75 bps (18:00 GMT) and the follow-up press conference (18:30 GMT) will have a strong impact on the currency this week.
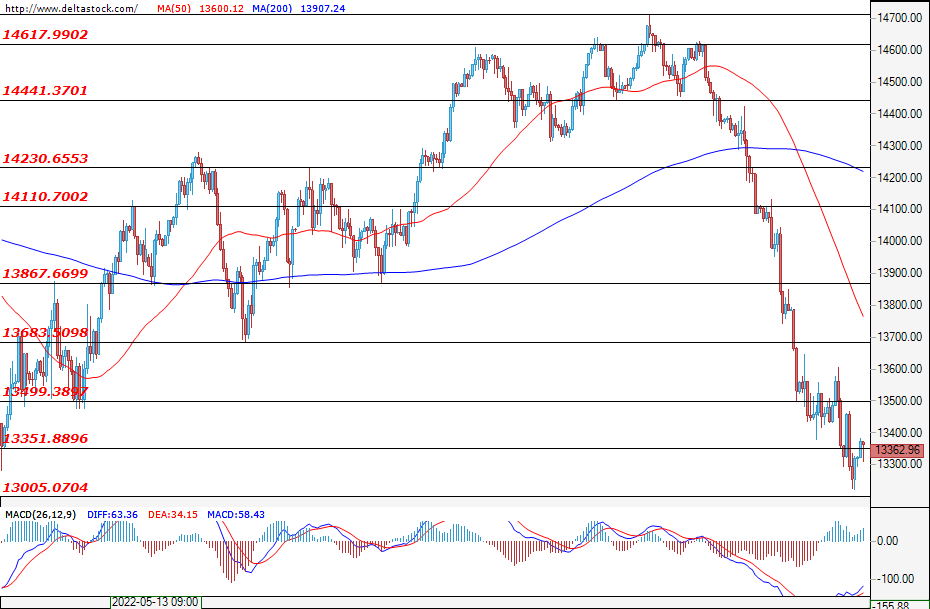
EUGERMANY40
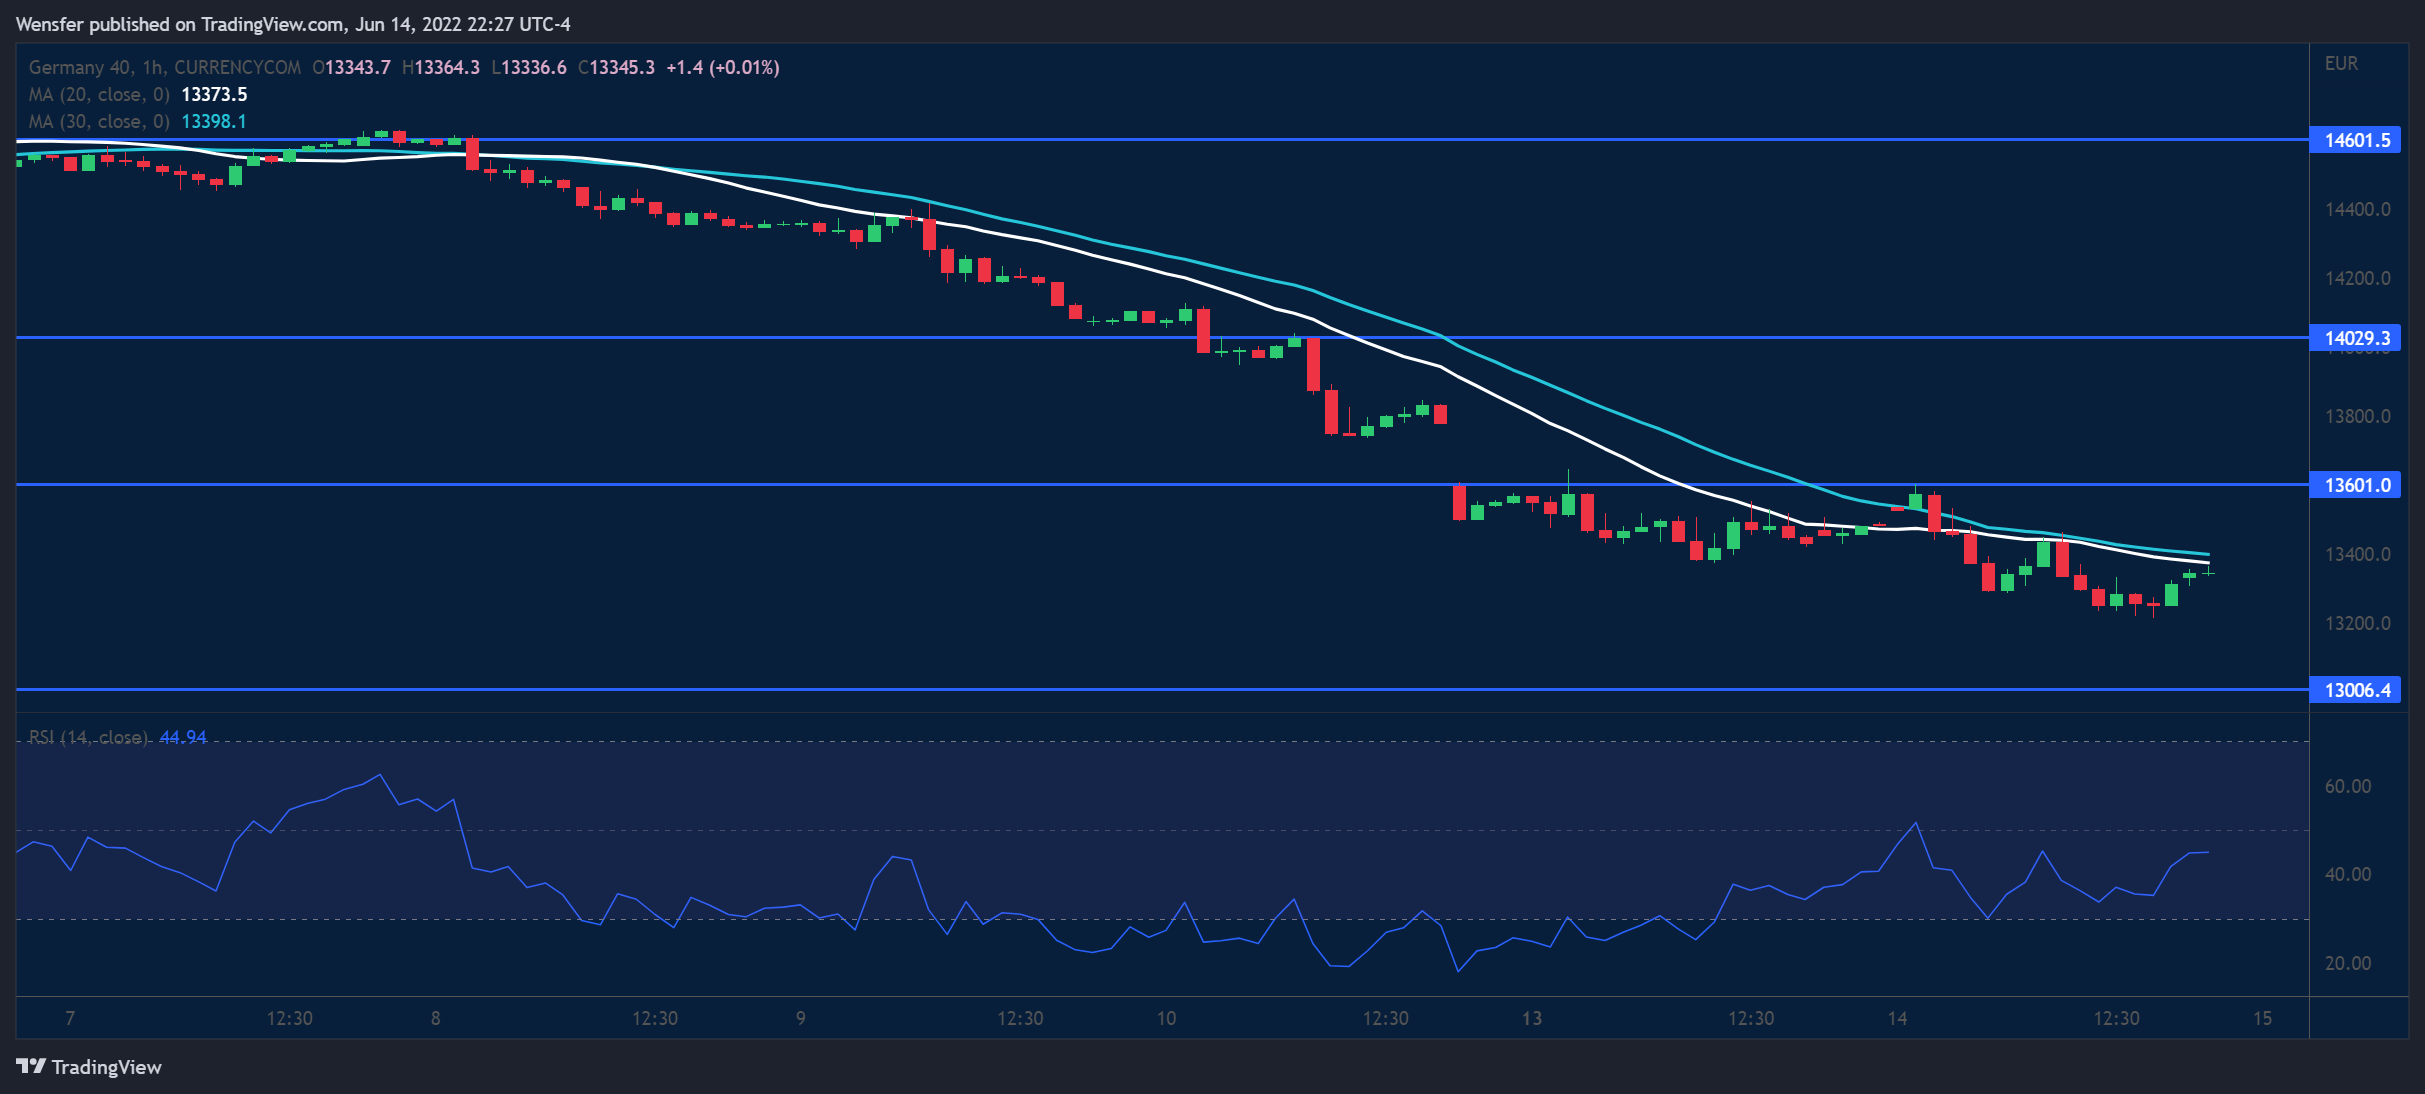
The German index continues to consolidate around the key level at 13350 as today’s session will most likely be relatively uneventful, that is until the Federal reserve announces their plans for the monetary policy in the U.S. at 18:00 GMT and at 18:30 GMT. The correlation with the U.S. indices is expected to remain extremely high and volatility will most likely be sky-high during the mentioned period.. If, despite that, the bulls end up prevailing, then the first resistance in front of them would be located at 13500. Looking from the higher time frames, we could also see the first support that the bears would have to breach, which would be the psychological level of 13000.
US30
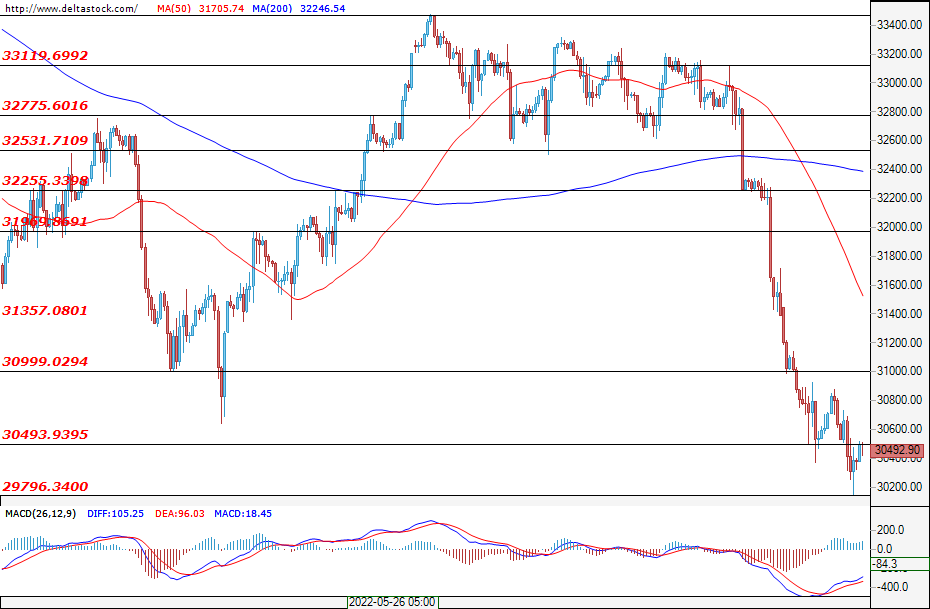
The day for the U.S. blue chips began with a breach of the support from the bears at 30500, indicating that they are still in control as they tried to take the index below the level at 30000. At the time of writing of the analysis, the breach of the aforementioned level of 30500 is being confirmed. Today's session will most likely remain relatively calm, until the storm that is the Federal Reserve engulfs the markets. If they hike the rates by 50 basis points, then the US30 will most likely go on a rally, with the main resistance being the level at 31000. However, if the decision to hike the rates by 50 bps is accompanied by Jerome Powell’s statements that there are talks of further 75 to 100 bps hikes, then the sell-off and volatility are likely to become extremely high.
Elliott Wave View: S&P 500 (SPX) Extends Lower. What’s Next?
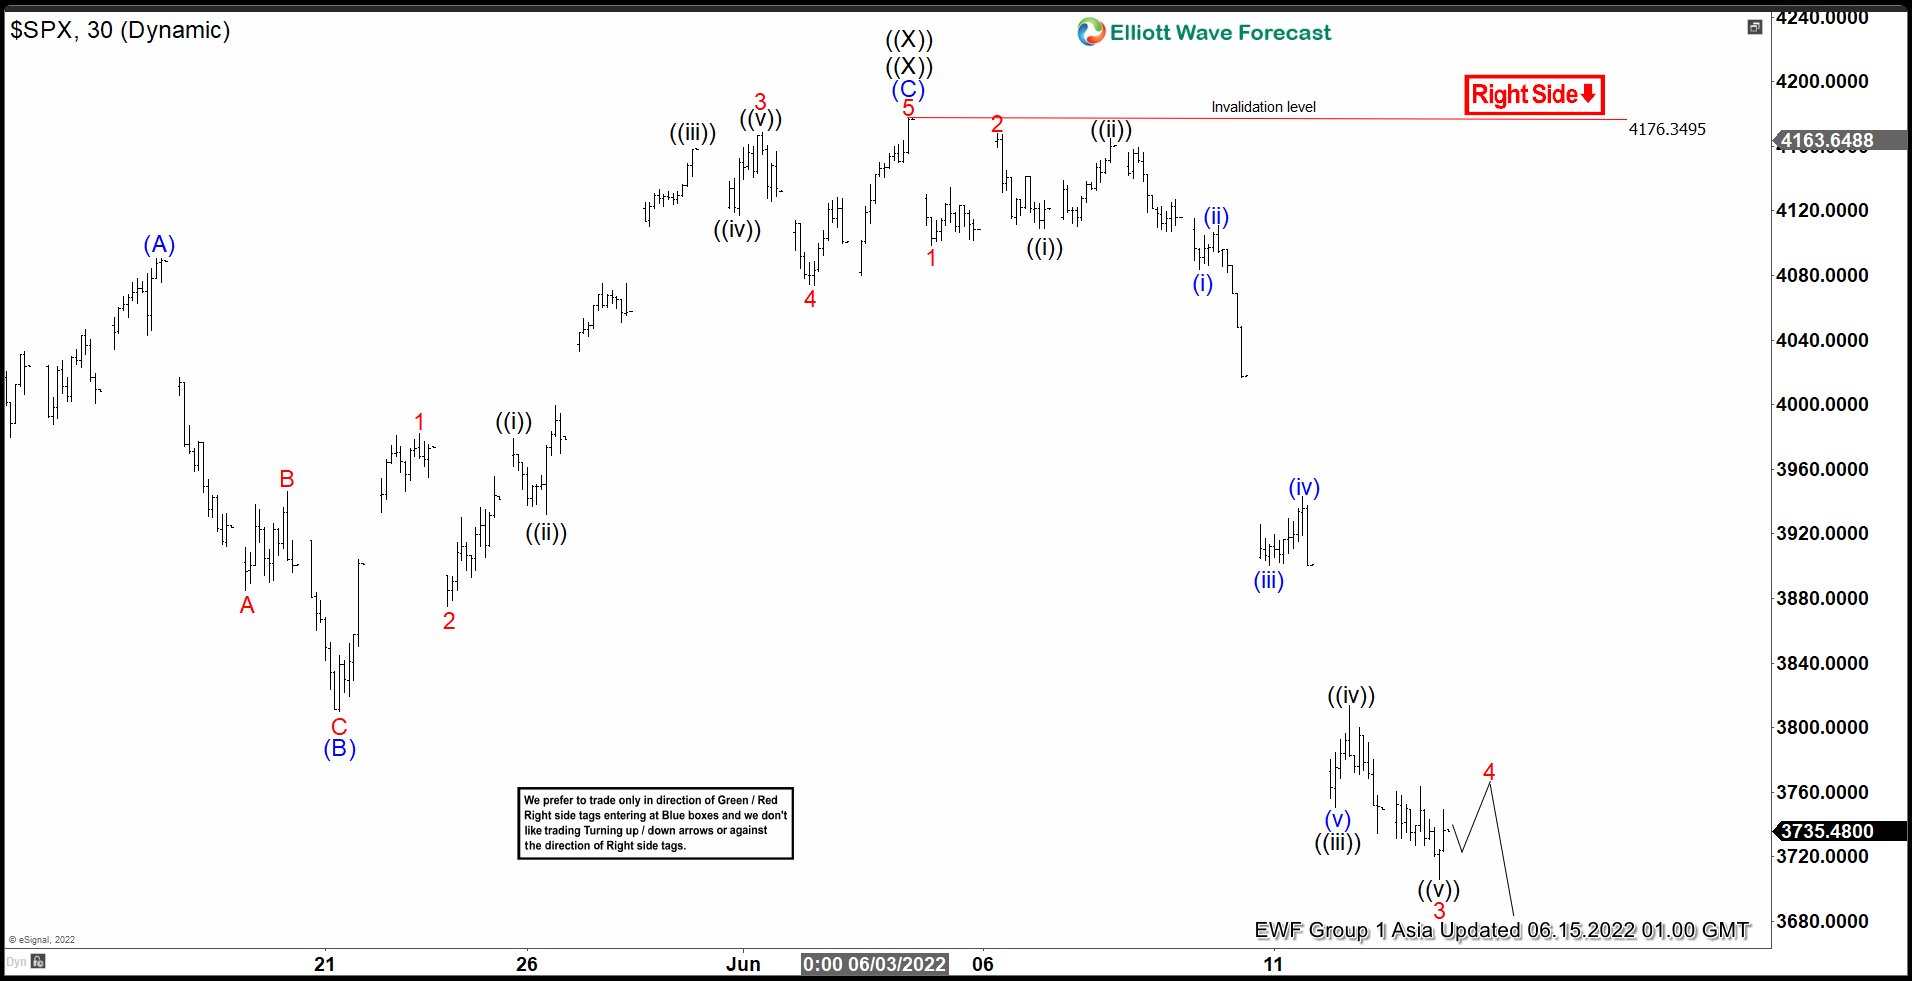
S&P 500 (SPX) broke below previous low on 5/21/2022 at 3810.32 and opens up a bearish sequence favoring further downside. The entire decline from 1/4/2022 high is unfolding as a triple three Elliott Wave structure. Triple three structure is an 11 swing corrective structure where W, Y, and Z subdivides into 3 waves. Down from 1/4/2022 high, wave ((W)) ended at 4222.62 and rally in wave ((X)) ended at 4637.3. Index then extended lower and ended wave ((Y)) at 3858.87 and rally in ((X)) ((X)) ended at 4176.35.
The 30 minutes chart below shows the decline from ((X)) ((X)) on 6/3/2022 high is in progress as an impulse Elliott Wave structure. Down from 6/3/2022, wave 1 ended at 4098.67 and rally in wave 2 ended at 4167.81. Index then extended lower in wave 3 towards 3705.68. Expect rally in wave 4 to end in 3, 7, or 11 swing and then Index can see a marginal low in wave 5 to complete wave (A). Afterwards, it should correct the entire decline from 6/3/2022 high in wave (B) before the decline resumes. Near term, as far as 6/3/2022 pivot at 4176.35 stays intact, expect rally to fail in 3, 7, or 11 swing for further downside.
S&P 500 30 Minutes Elliott Wave Chart
DAX 40 Breaks Key Support
The Dax 40 sinks as expectations of high interest rates continue to drive global equities south. A break below 13850, a support on the daily chart, prompted short-term bulls to close their bets. The fall below May’s low and critical floor at 13300 came in as a coup de grâce. This may seal the bearish fate and trigger another round of sell-off. The psychological level of 13000 would be the next support. 13600 is a fresh resistance and the bears may look to fade a rebound as the overall mood remains extremely bearish.
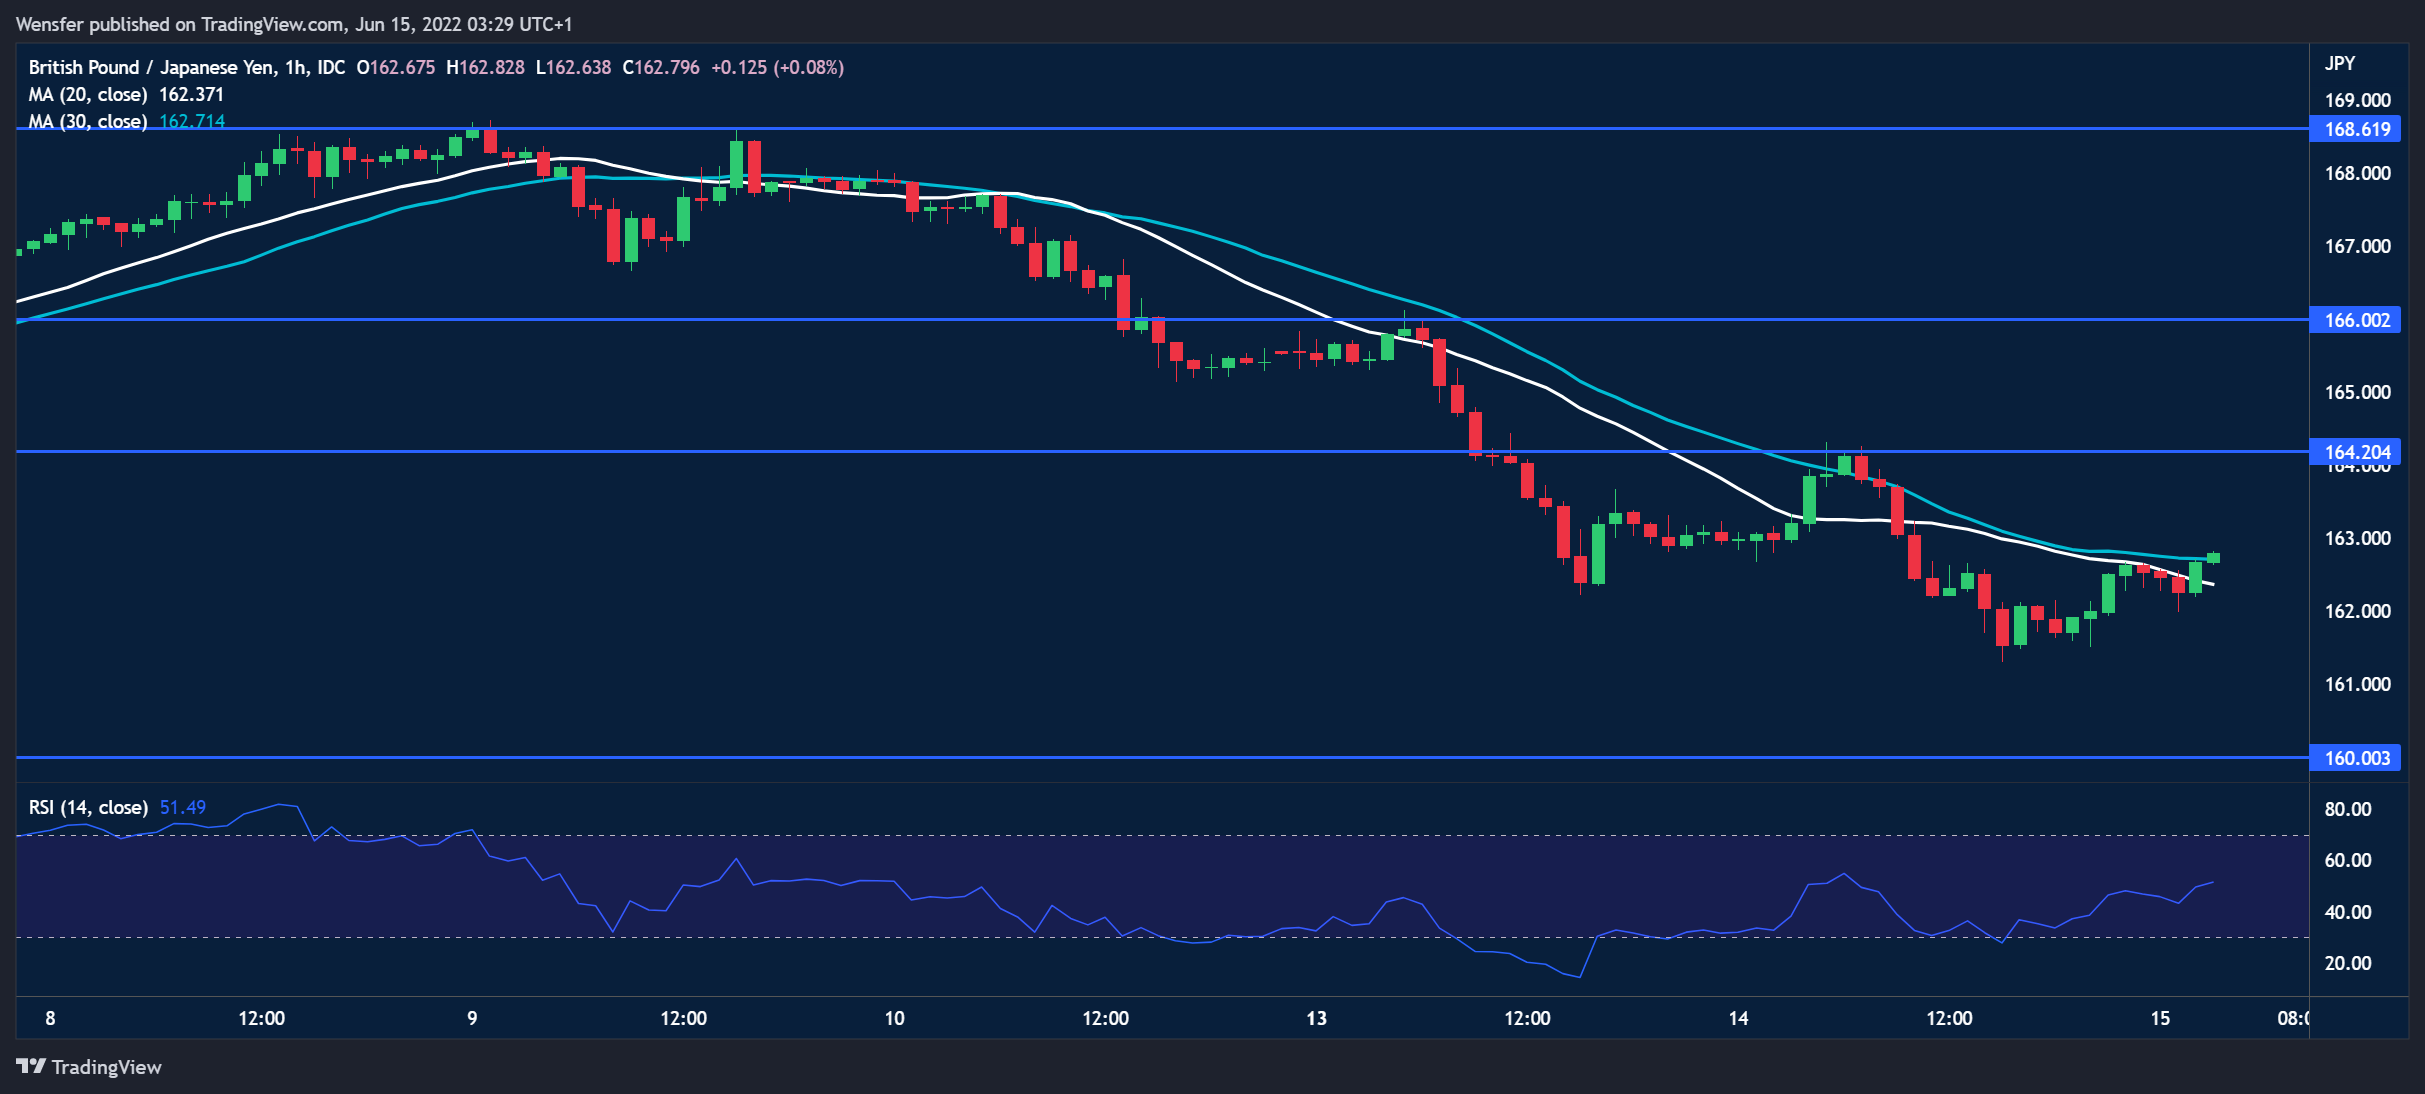
GBP/JPY Seeks Support
The pound softened after an unexpected rise in the UK’s unemployment rate in April. The pair is struggling to hold onto its recent gains after a rally above last April’s high at 168.40. A drop below 166.00 has triggered a round of liquidation as buyers rushed to exit a crowded trade. The recent jitter above 162.00 has turned out to be a dead cat bounce. The bulls will need to clear the support-turned-resistance at 164.20 before they could regain control. Otherwise, the psychological level of 160.00 would be next.