Sample Category Title
Pound Extends Losses, US Inflation Looms
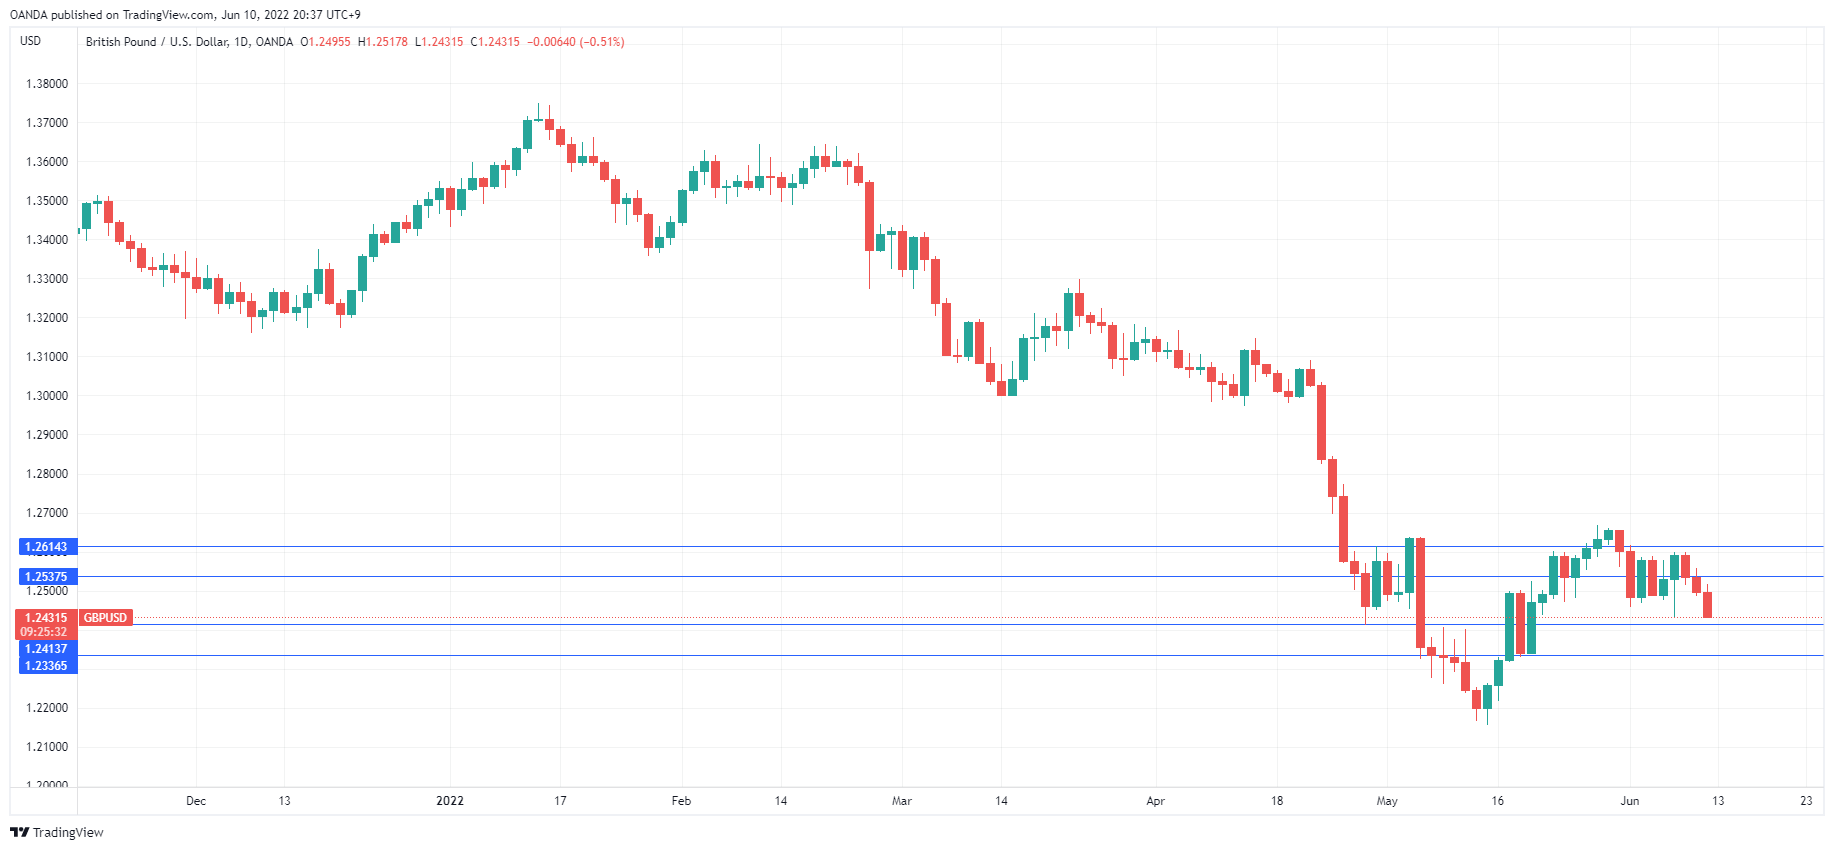
The British pound remains under pressure. GBP/USD is in negative territory today, following back-to-back losing sessions. In the European session, GBP/USD is trading at 1.2439, down 0.45% on the day.
Will US inflation drop?
The highlight of the week will be US inflation for May. Headline inflation is expected at 8.3% (unchanged), while Core CPI is forecast to fall to 5.9%, down from 6.2%. If inflation does indeed drop, there will likely be voices proclaiming that the long-sought inflation peak is finally here. It would, however, be premature to assume that inflation is on a downswing based on one reading alone. Still, there is plenty of anticipation around the inflation release, such that it could be a binary outcome for USD/CAD – if inflation outperforms, Fed hiking expectations will rise. If, however, inflation drops, we could see a move to sell US dollars.
UK inflation expectations rise
It was a light data calendar this week out of the UK. One release that was noteworthy was Inflation Expectations, released earlier today. The BoE survey found that inflation expectations for the next 12 months had risen to 4.6%, up from 4.3% n February. Inflation expectations for 2 years and 5 years were also higher, which is clearly a worrying trend. The danger of inflation expectations becoming unanchored could manifest into actual inflation continuing to accelerate. CPI hit 9% in April, up from 7.0% in March, and the BoE has stated that we could see double-digit inflation.
Asides from inflation, there are plenty of worries for investors with regard to the UK economy. Prime Minister Johnson may be on his way out after a disappointing showing at a non-confidence vote and there is trouble brewing with the EU over the Northern Ireland protocol. This points to a bumpy road for the British pound in the short term.
GBP/USD Technical
- GBP/USD faces resistance at 1.2537 and 1.2614
- There is weak support at 1.2413, followed by support at 1.2336
Bundesbank: Germany inflation to hit 7% or higher, resolute action needed
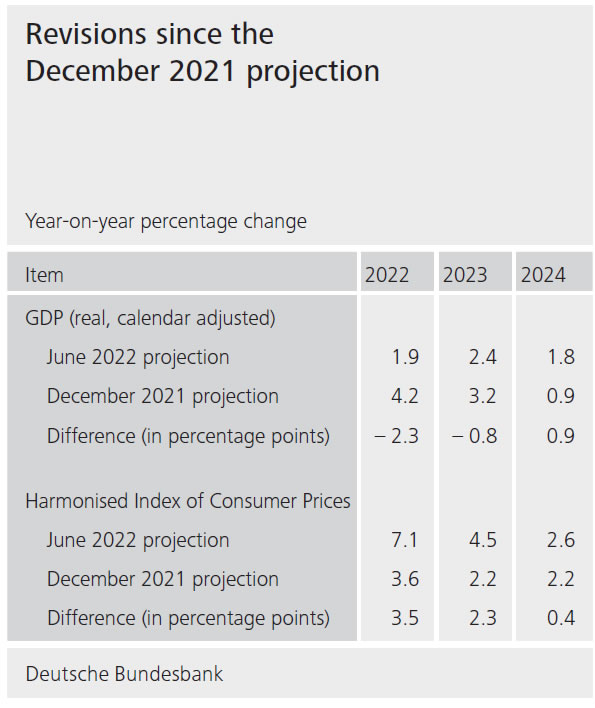
Bundesbank revised down growth projection for Germany's GDP in 2022 and 2023, and upgraded inflation projection for 2022, 2023, and 2024.
2022 GDP growth is slashed from 4.2% to just 1.9%. 2023 growth was cut from 3.2% to 2.4%. But 2024 growth was raised from 0.9% to 1.8%.
2022 HICP inflation forecast was raised from 3.6% to 7.1%. 2023 HICP forecast was raised from 2.25% to 4.5%. 2024 HICP forecast was raised from 2.2% to 2.6%.
President Joachim Nagel said: "Inflation this year will be even stronger than it was at the beginning of the 1980s. Price pressures have even intensified again recently, which is not fully reflected in the present projections. If this development is assumed to continue, the annual average HICP rate for 2022 could be considerably above 7%".
Euro area inflation rates won't fall by themselves," Nagel added. "Monetary policy is called upon to reduce inflation through resolute action."
Villeroy: ECB will pursue gradual but sustained rate hikes to neutral
ECB Governing Council member Francois Villeroy de Galhau told French radio that inflation is "not only too high but also too broad". The ECB will purse a "gradual but sustained" rate hikes until reaching neutral range. He estimated that it's "somewhere between 1% and 2%".
Separately, another Governing Council member Robert Holzmann said, "financial markets reacted very well to yesterday's announcement." "Even if we had started with a 50 bps rate hike it might have an effect on credibility but it would have raised expectations of bigger rate rises afterwards," he added.
Yen Claws Back, US Inflation Next
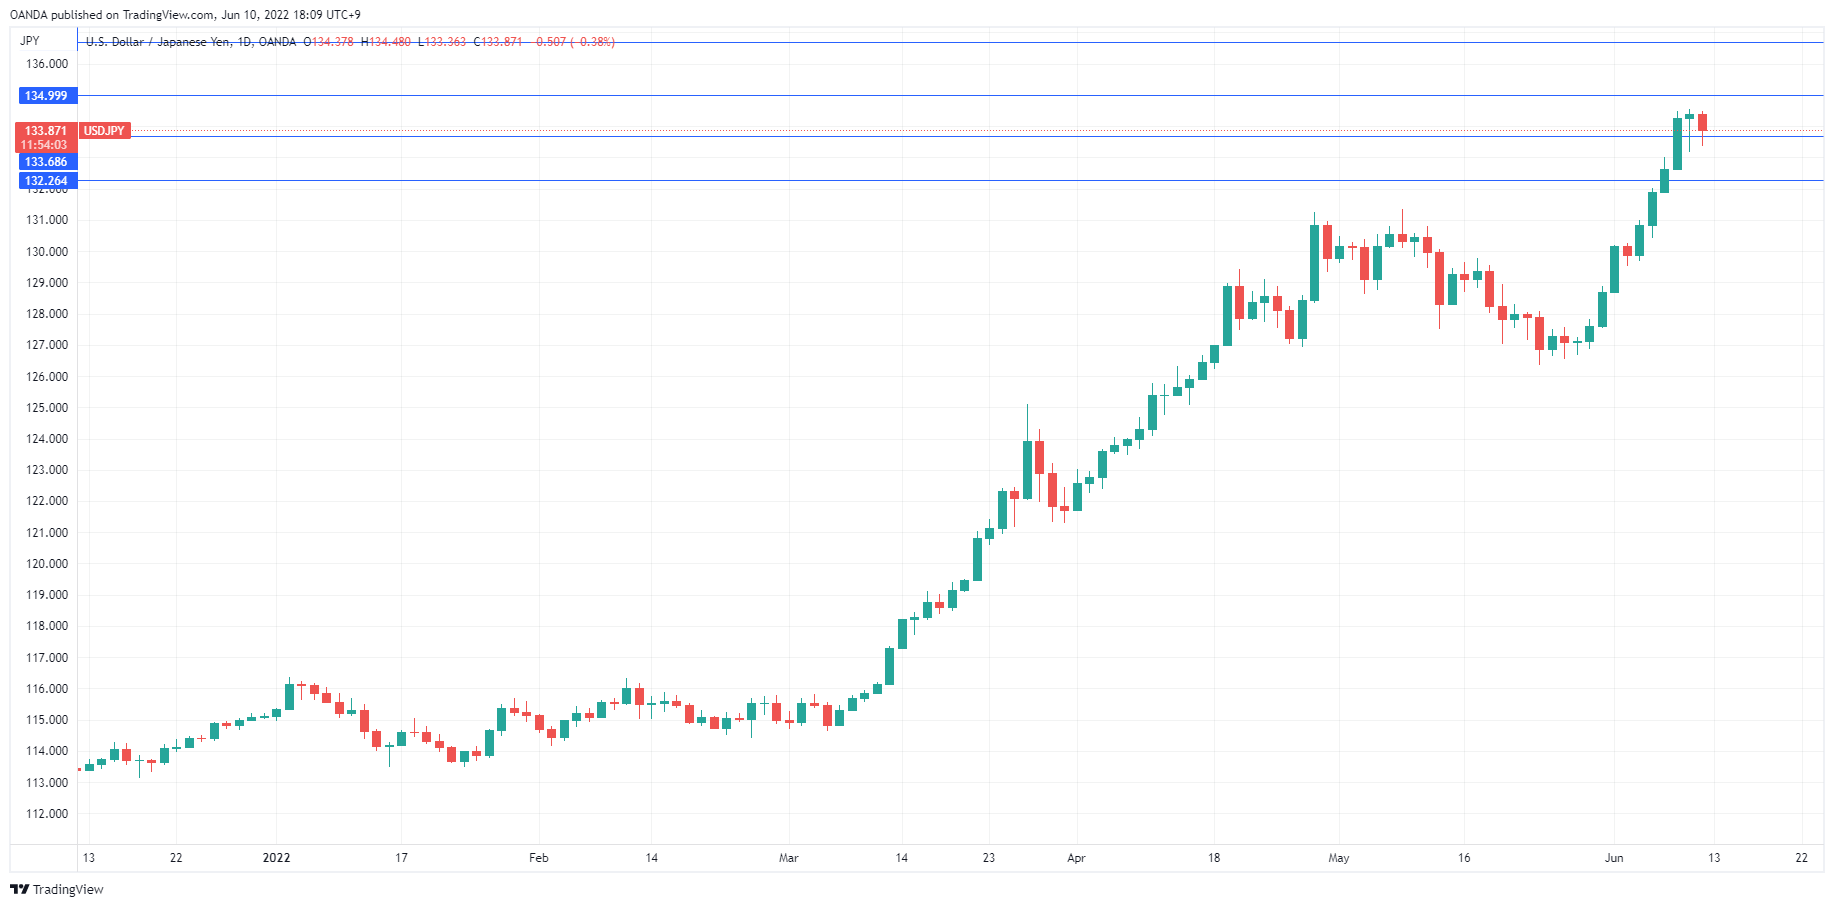
The Japanese yen has reversed directions and is in positive territory. In the European session, USD/JPY is trading at 133.86, down 0.38% on the day.
Despite today’s gains, the yen remains under strong pressure. The currency has mustered just one winning session in the month of June, and USD/JPY rose to 134.56 on Thursday, a new 20-year low for the yen. The symbolic 135 line looks ripe for the taking as early as next week.
Japan’s Minister of Finance issues yen warning
Japanese officials have chosen not to respond to the yen’s most recent descent, although Japan’s Finance Minister Suzuki did issue an underhand warning earlier today about the weak yen. Suzuki said he would not comment on the question of intervention so as to avoid any impact, but added that rapid fluctuations in the exchange rate were “not desirable”.
This latest verbal intervention comes after the yen hit a new 20-year low against the dollar and a 7-year low against the euro. The yen has declined a massive 14% against the dollar this year and could fall further against the euro as the ECB announced yesterday that it tightening policy. The BoJ and Ministry of Finance have tried jaw-boning in the past to support the ailing yen but without success. Investors have been on the lookout for a “trigger point” at which Tokyo would intervene, but the yen has crossed above 125 and 130 without hindrance, and it looks like the 135 line will also be breached without a response from Japanese officials.
It’s been a rough week for the Japanese currency, as USD/JPY has risen 2.29%. We could see some volatility from the pair later today, with the release of the US inflation report. A weak inflation release would pare expectations of Fed hiking and would be bullish for the yen. Conversely, a stronger than expected CPI reading would likely propel the dollar higher.
USD/JPY Technical
- USD/JPY is testing resistance at 133.68. Above, there is resistance at 1.3638
- There is support at 132.26 and 131.24
EUR/USD Pair Moved into a Bearish Zone Below $1.0700
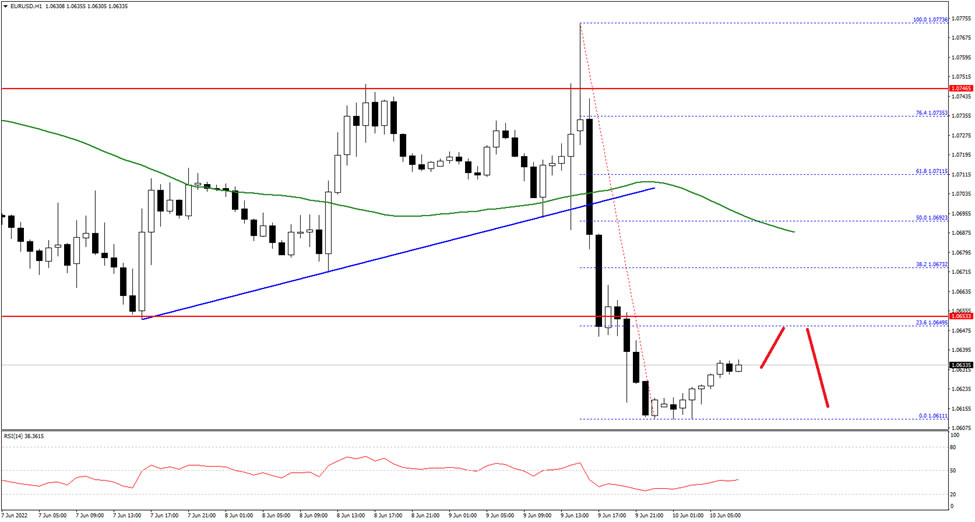
The Euro started a fresh decline from the 1.0775 resistance zone against the US Dollar. The EUR/USD pair traded below the 1.0700 support zone to move into a bearish zone.
The price even traded below the 1.0680 level and the 50 hourly simple moving average. It traded as low as 1.0611 and is currently correcting losses. On the upside, the pair might struggle near 1.0650 on FXOpen.
The next major resistance is near the 1.0700 level. A break above the 1.0700 and 1.0720 resistance levels could start another increase. In the stated case, it could even surpass 1.0750.
An immediate support is near the 1.0610 level. The next key support is near 1.0600, below the pair could decline towards the 1.0550 level in the near term. Any more losses might send the pair towards the 1.0520 level.
US Dollar Index Moving into Technical Resistance Ahead of US CPI Data
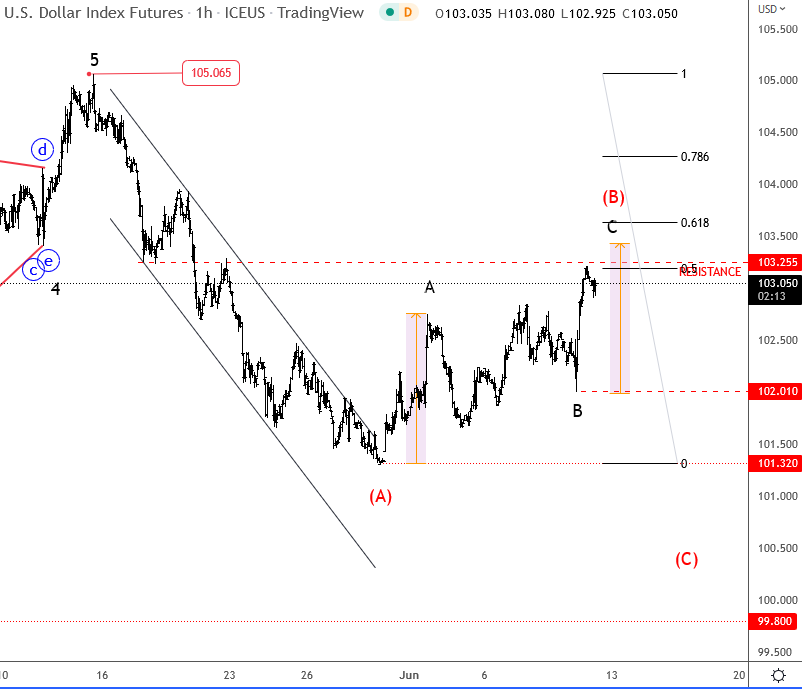
USD came higher yesterday vs the EUR as European Central Bank President (ECB) Christine Lagarde was not clear enough about the upcoming rate if maybe they will stick to 25bp or can this hike be more than that in upcoming meetings. She was not that hawkish, so the euro came down a lot, while USD rallied across the board, supported also by a lower stock market. However, we still think that USD Index can be moving into resistance now and that this is wave B rally. A new turndown can be coming, possibly after the US inflation data later at 12:30GMT as a catalyst. Break below 102.00 will be confirmation for bears. A drop of the USD would be very supportive for commodity currencies.
Loss of Correlation with Stocks will Pave the Way for Crypto to Portfolios
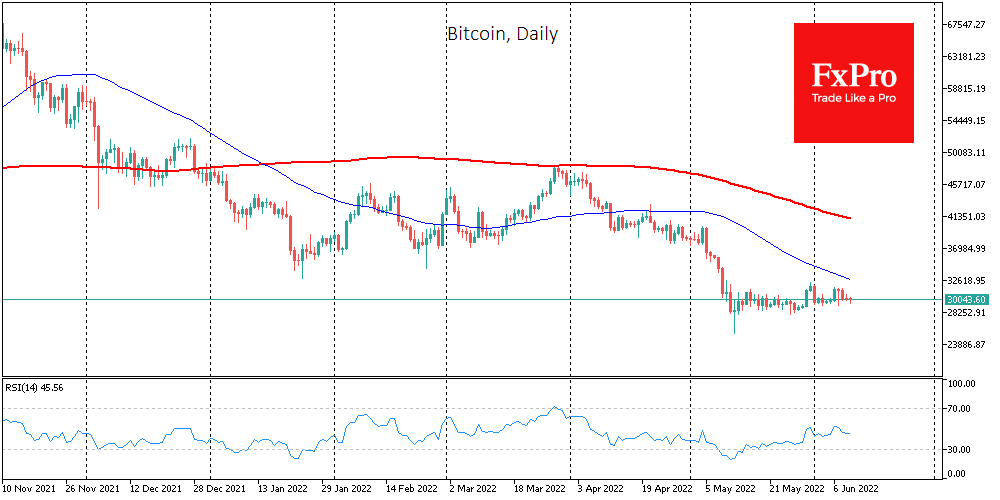
Bitcoin was down 0.3% on Thursday, continuing to hover around $30K. This mild decline was a bonus of last month’s loss of correlation between the cryptocurrency and stock markets.
Ethereum lost 0.4%, settling near $1800. Other top-10 altcoins showed mixed dynamics, ranging from a 2.5% decline (Cardano) to a 3.6% rise (Solana).
Financial market veteran Peter Brandt believes Ethereum is in a downward triangle and could fall to $1268 within a month.
The total capitalisation of the crypto market, according to CoinMarketCap, fell 0.2% overnight to $1.24 trillion. The cryptocurrency fear and greed index were up 2 points to 13 by Friday and remains in “extreme fear” mode.
Bitcoin has crossed the $30K mark almost daily over the past month, with no significant preponderance of buyers or sellers to form a clear trend.
Generally, the correlation gap between cryptocurrencies and stock markets is long-term good news as it attracts the attention of professional investors. Weakness in equity and bond markets, sagging gold and the murky outlook for the real estate market are turning their eyes to cryptocurrencies as another tool in a diversified portfolio.
CNBC’s Mad Money host Jim Cramer has changed his mind about investing in cryptocurrencies, calling BTC and ETH the best long-term investments. However, they should not account for more than 5% of a portfolio.
PwC, an audit firm, reported that most hedge funds invest less than 1% of their assets in cryptocurrencies because of regulatory uncertainty in the industry.
According to a Deloitte survey, 75% of US retailers will implement support for cryptocurrency payments within two years.
USDT, the world’s most prominent staple by market capitalisation, will be available on the Tezos blockchain powered by the Proof-of-Stake consensus mechanism. The USDT ecosystem is now open on 12 networks, including Ethereum, Solana, Polygon, Tron and Algorand.
USDCAD Fails to Continue Yesterday’s Aggressive Bullish Rally
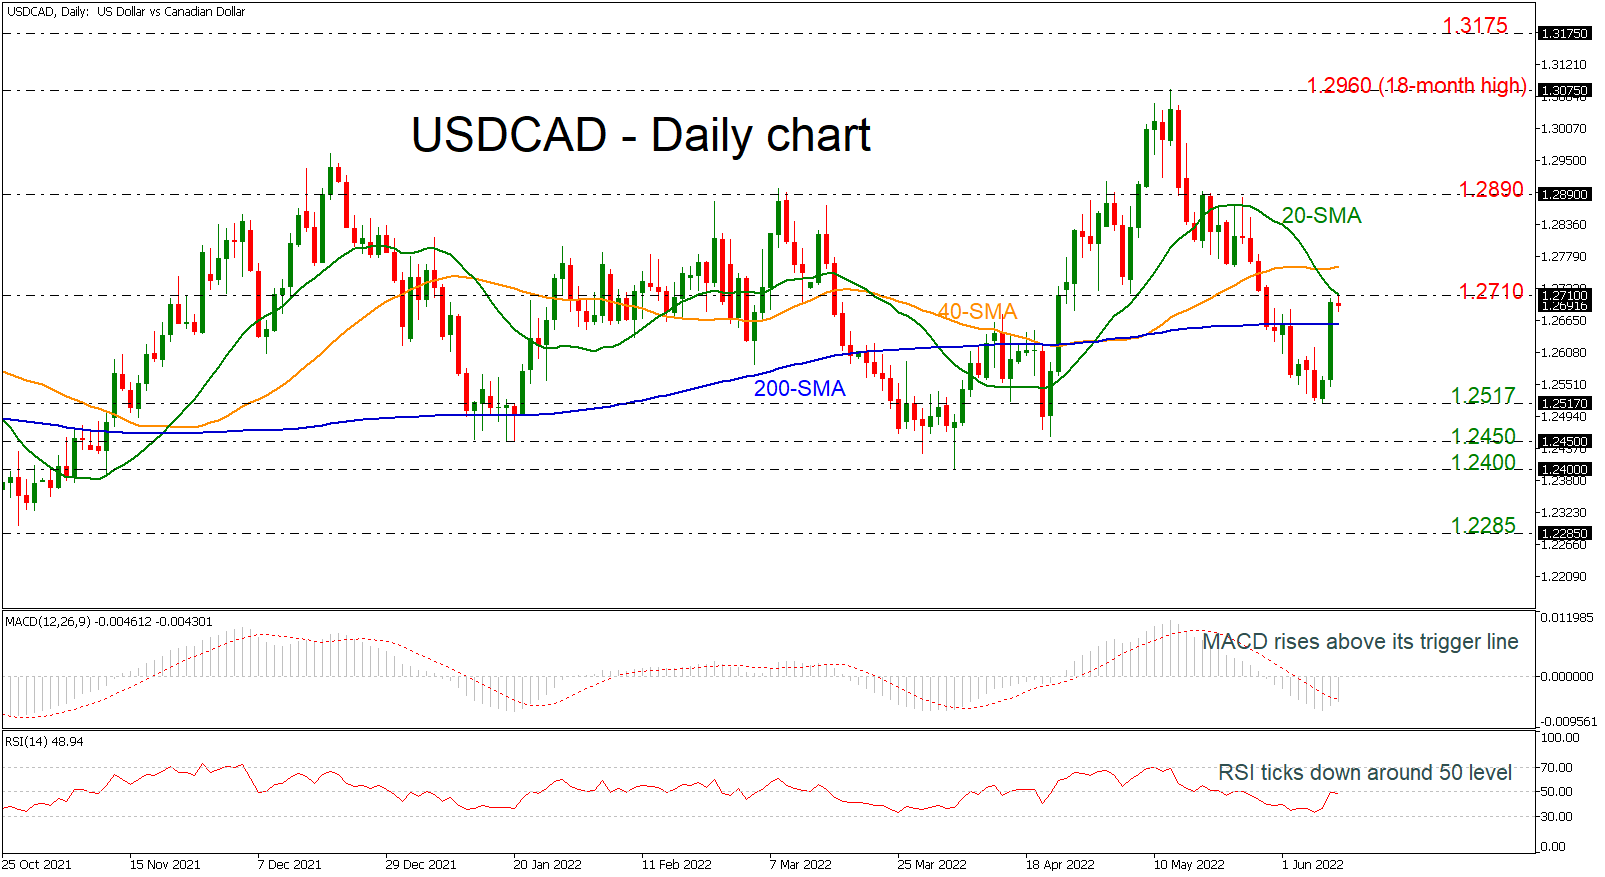
USDCAD had an aggressive bullish rally on Thursday, moving towards the 1.2700 psychological number, but the Canadian employment report later in the day may strengthen the loonie. The pair is flirting with the 20-day simple moving average (SMA) and is failing to continue the buying interest.
Technically, the MACD oscillator is gaining momentum above its trigger line and below the zero level, while the RSI is appearing flat near the neutral threshold of 50. In trend indicators, the 20- and the 40-day simple moving averages (SMAs) posted a bearish crossover in the previous sessions, mirroring the downside move from the 18-month peak of 1.2960.
Should the pair stretch north, the 40-day SMA at 1.2760 could provide immediate resistance before the pair touches the 1.2890 barrier. A significant step higher could bring the bullish sentiment back into play, sending the price probably towards the 1.2960 barrier.
On the flip side, the 200-day SMA currently at 1.2655 may halt the bearish movements, while even lower, it may meet the 1.2517 support. If traders continue to sell the pair, the price could hit the 1.2450-1.2400 region ahead of 1.2285.
To sum up, the market is expected to hold bullish in the very short-term if the pair jumps above the short-term SMAs. However, in the broader picture, the outlook is still neutral-to-bullish.
GBPJPY Set for a Corrective Decline
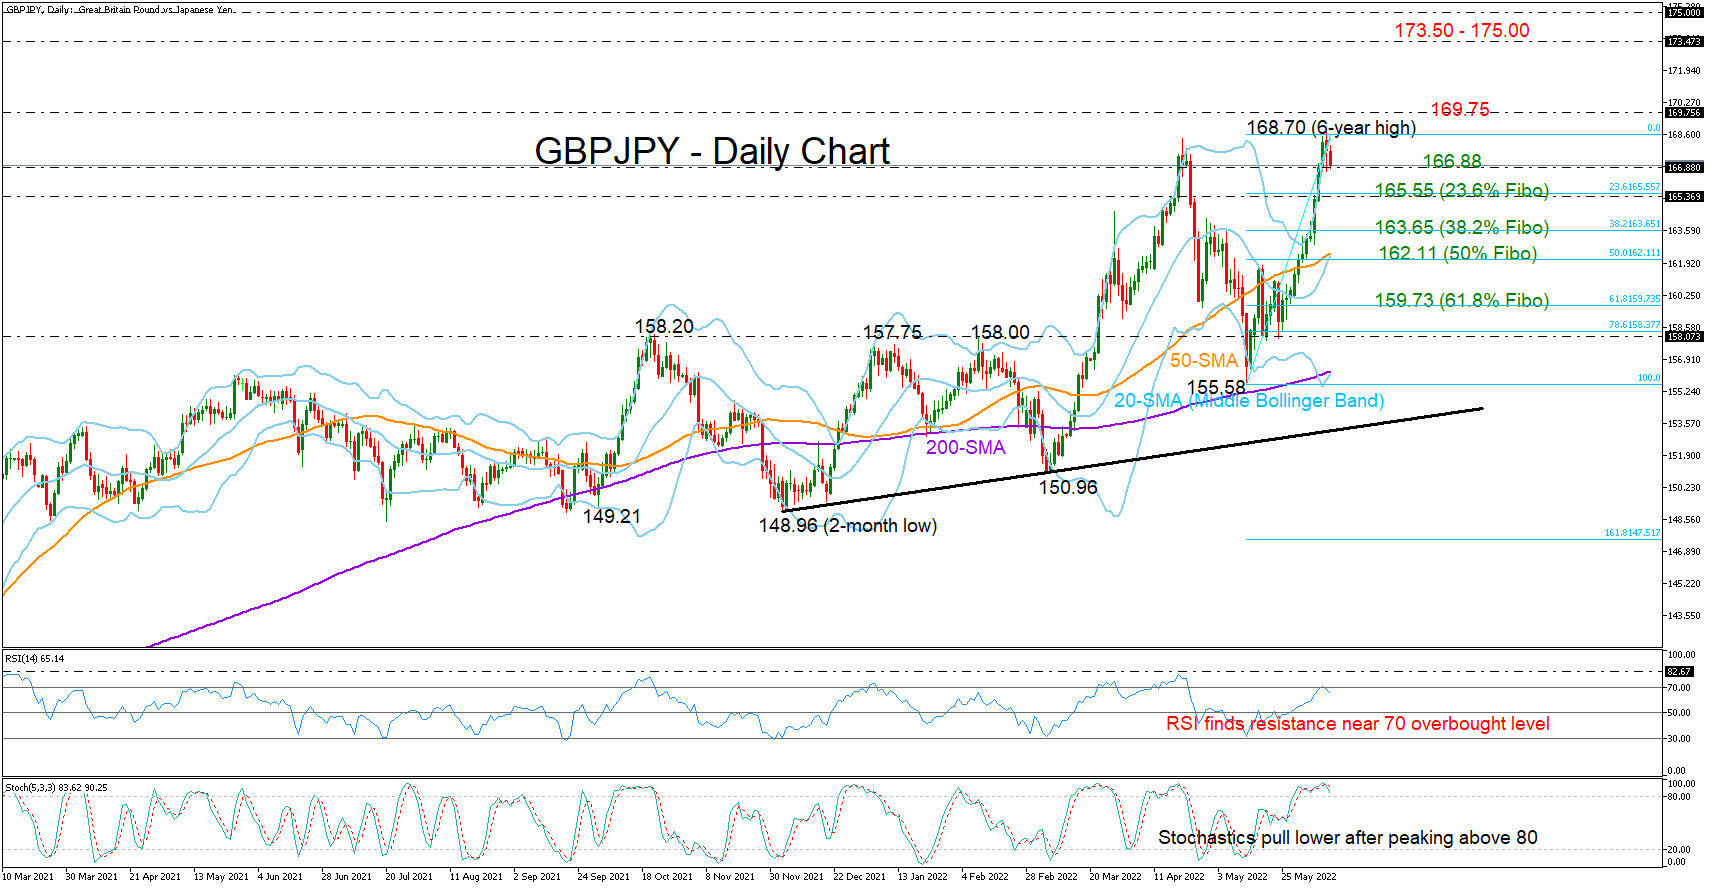
GBPJPY is setting the stage for its next bearish phase after its latest explosive rally topped at a new six-year high of 168.70 and near April’s peak.
The RSI is also pivoting near its 70 overbought mark, while the Stochastics are reversing southwards within the overbought zone too, suggesting that the bull run is overextended and it’s time for a downside correction. It’s worthy to note that the price has been trading along the upper Bollinger band since the start of the month; therefore, a downside move can be technically justified.
Whether the current weakness develops into anything more than a normal bearish correction in an uptrend remains to be seen. Traders are currently having their eye on the nearby barrier of 166.88. If that base cracks, the decline could continue towards the 23.6% Fibonacci of the 155.58 – 168.70 upleg at 165.55. Falling lower, the price may next visit the 38.2% Fibonacci of 163.65, while a decisive close below the 50% Fibonacci of 162.11, where the 20- and 50-day simple moving averages (SMAs) are placed, would eliminate confidence on the latest steep upturn.
Alternatively, if selling tendencies fade immediately around 166.88, buyers may push harder for a break above the 168.70 ceiling, and particularly above the 169.75 barricade taken from January-February 2016. If that turns out to be the case, the rally may speed up to the 173.50 – 175.00 restrictive region last seen during the 2013 – 2016 period.
In short, GBPJPY is expected to give up some of its recent impressive gains in the coming sessions. A clear close below 166.80 may activate fresh selling pressures.
BTCUSD Rangebound But Downside Risks Remain
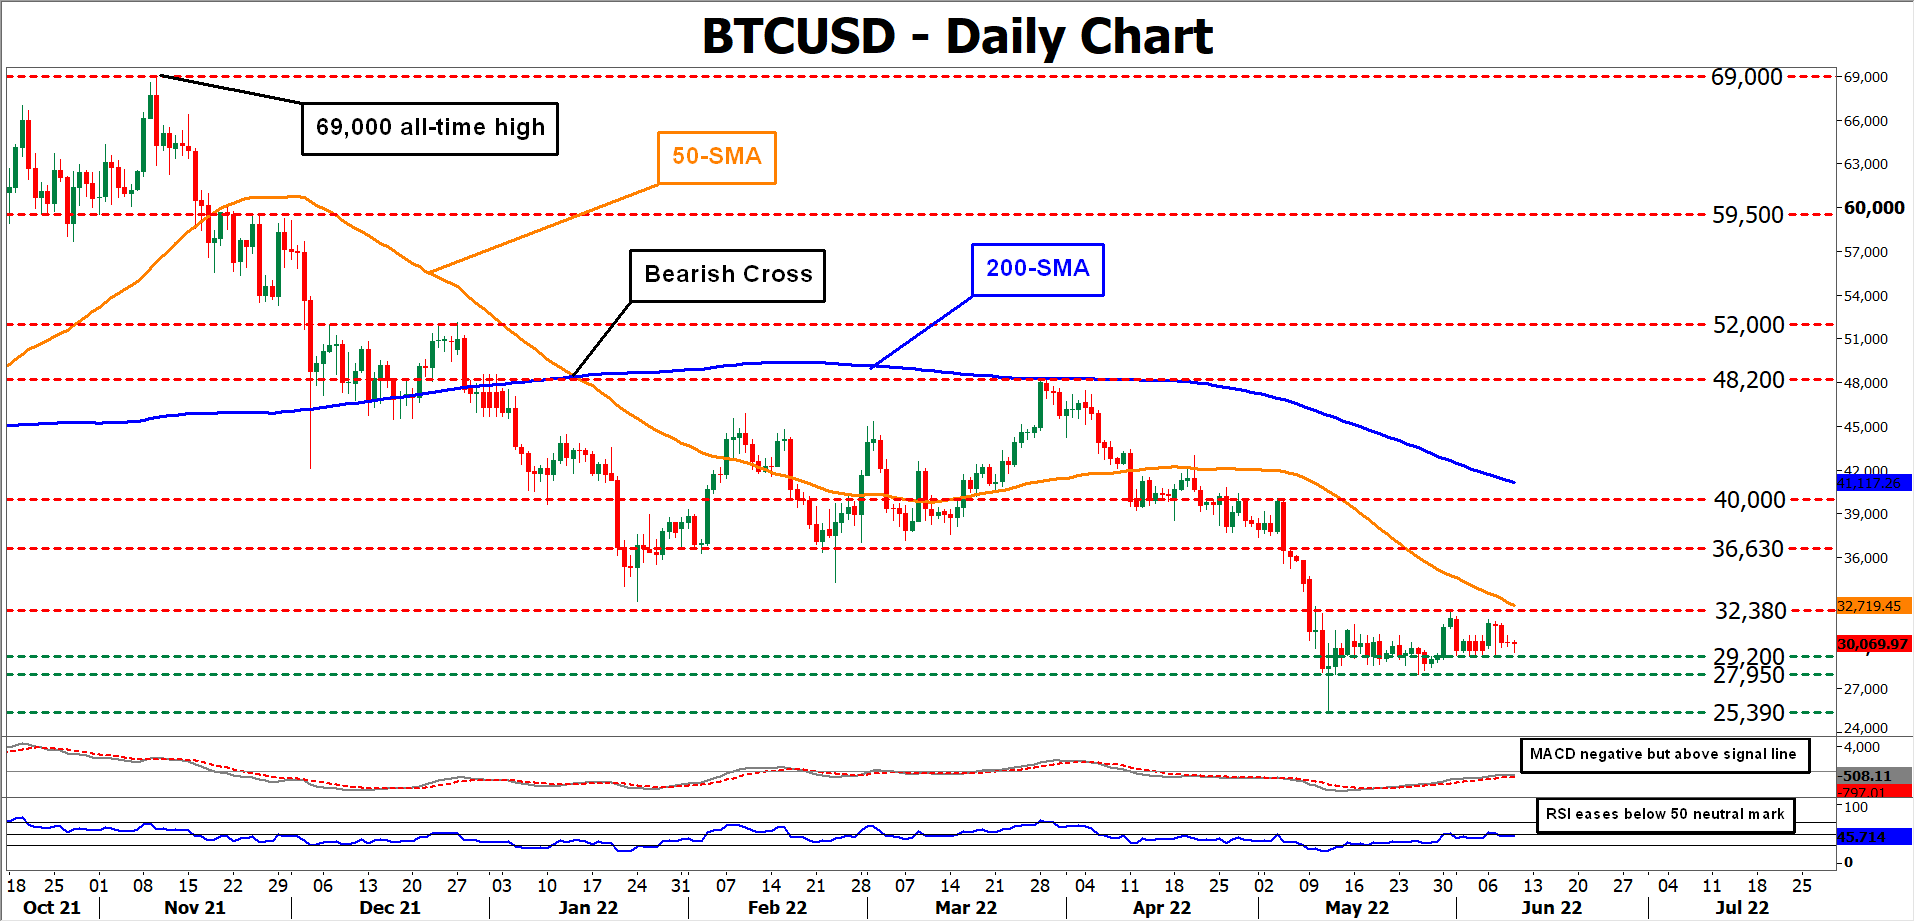
BTCUSD has been trading within a tight range during the past month, unable to adopt a clear direction. However, the descending 50- and 200-day simple moving averages (SMAs) are painting a gloomy technical picture for the cryptocurrency.
The short-term oscillators also indicate a cautiously bearish near-term bias. Specifically, the RSI is dipping beneath its 50-neutral threshold, while the MACD histogram has crossed above its red signal line but remains in the negative territory.
Should selling interest intensify, 29,200 could act as the first line of defence. Diving beneath that region, the price could descend towards 27,950, which is the lower boundary of its recent sideways pattern. Failing to halt there, the 2022 low of 25,390 may cease any further declines.
In the positive scenario, bullish actions could propel the price towards the recent peak of $32,380. Conquering this barricade, the bulls might aim at the 36,630 barrier before the spotlight turns to the 40,000 psychological mark. Piercing through these levels, the 2022 peak of 48,200 could prove a tough obstacle for the price to overcome.
Overall, BTCUSD seems to be consolidating between the 29,000-31,000 range, while near-term risks are tilted to the downside. Therefore, a break beneath the 25,390 floor could signal the resumption of its long-term downtrend.